session fsa
TRANSCRIPT

8/7/2019 Session FSA
http://slidepdf.com/reader/full/session-fsa 1/30
Financial Statement Analysis
Session Three
8/7/2019 Session FSA
http://slidepdf.com/reader/full/session-fsa 2/30
1–2
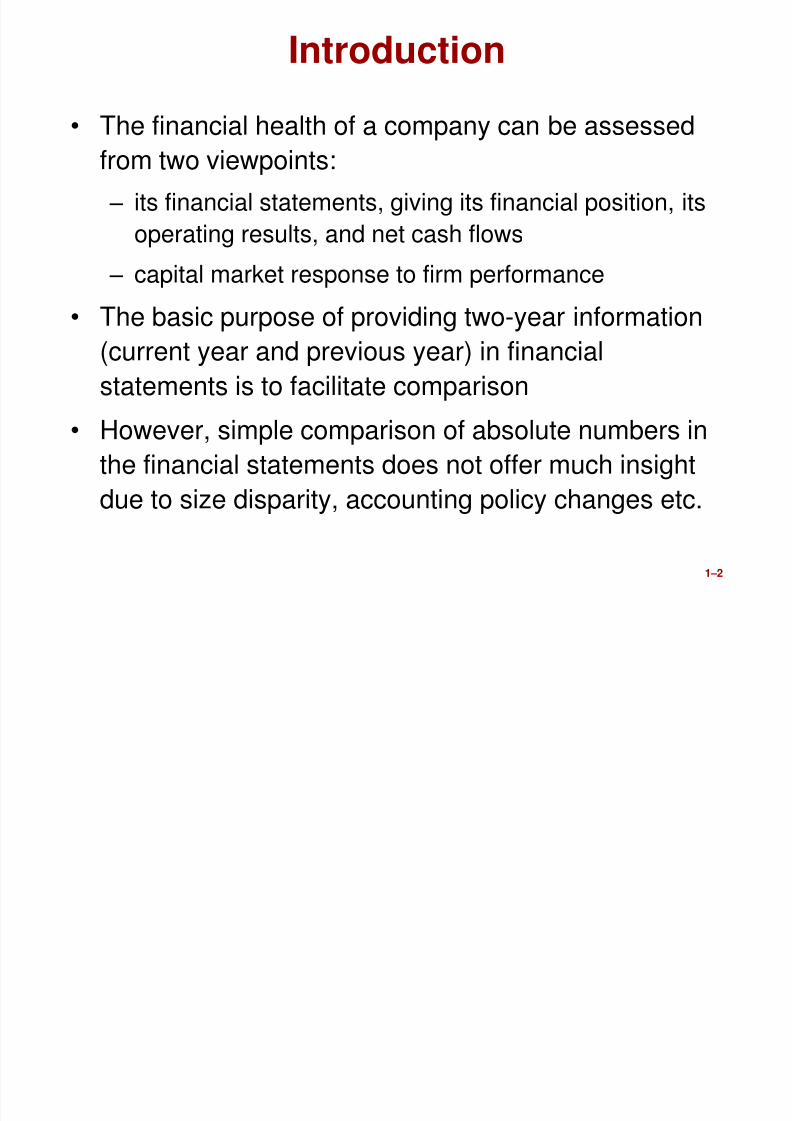
Introduction
• The financial health of a company can be assessedfrom two viewpoints:
– its financial statements, giving its financial position, its
operating results, and net cash flows
– capital market response to firm performance
• The basic purpose of providing two-year information
(current year and previous year) in financial
statements is to facilitate comparison
• However, simple comparison of absolute numbers in
the financial statements does not offer much insight
due to size disparity, accounting policy changes etc.
8/7/2019 Session FSA
http://slidepdf.com/reader/full/session-fsa 3/30
1–3
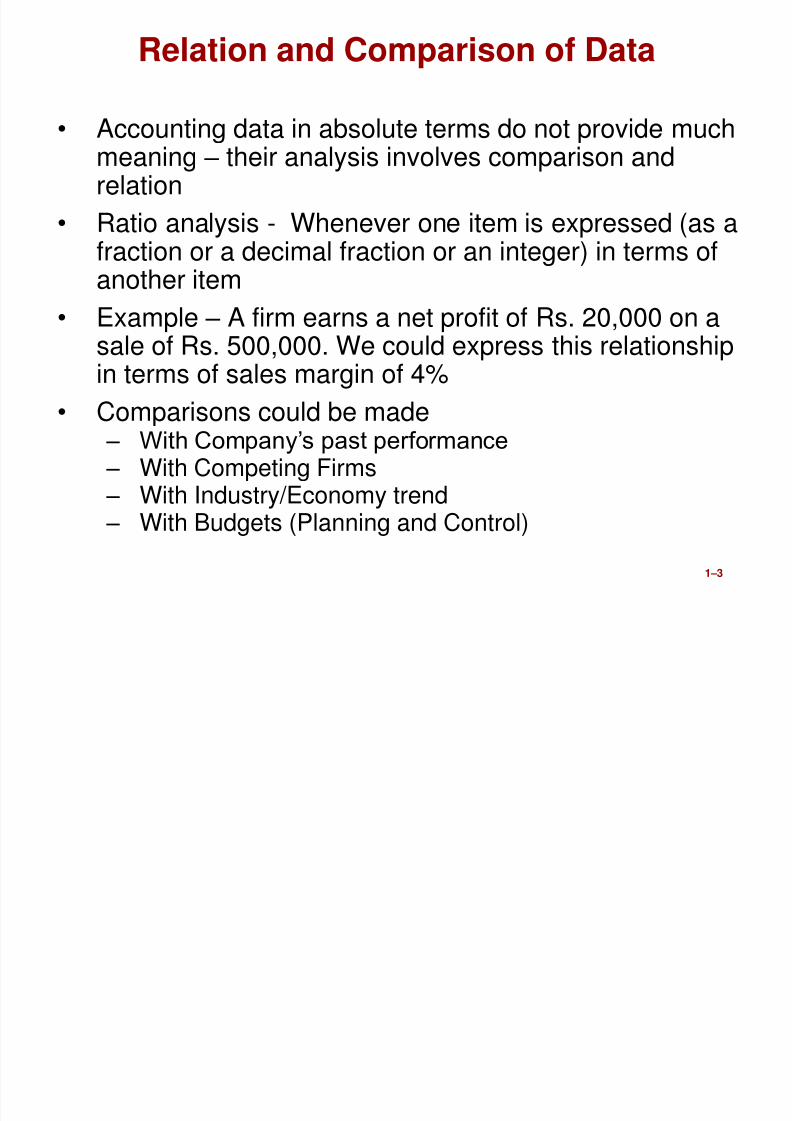
Relation and Comparison of Data
• Accounting data in absolute terms do not provide muchmeaning – their analysis involves comparison andrelation
• Ratio analysis - Whenever one item is expressed (as afraction or a decimal fraction or an integer) in terms of
another item• Example – A firm earns a net profit of Rs. 20,000 on a
sale of Rs. 500,000. We could express this relationshipin terms of sales margin of 4%
• Comparisons could be made– With Company’s past performance– With Competing Firms– With Industry/Economy trend– With Budgets (Planning and Control)

8/7/2019 Session FSA
http://slidepdf.com/reader/full/session-fsa 4/30
1–4
Fund Flow Analysis
• Where Got Where Gone Statement
• Sources of Funds = Uses of Funds
8/7/2019 Session FSA
http://slidepdf.com/reader/full/session-fsa 5/30
1–5
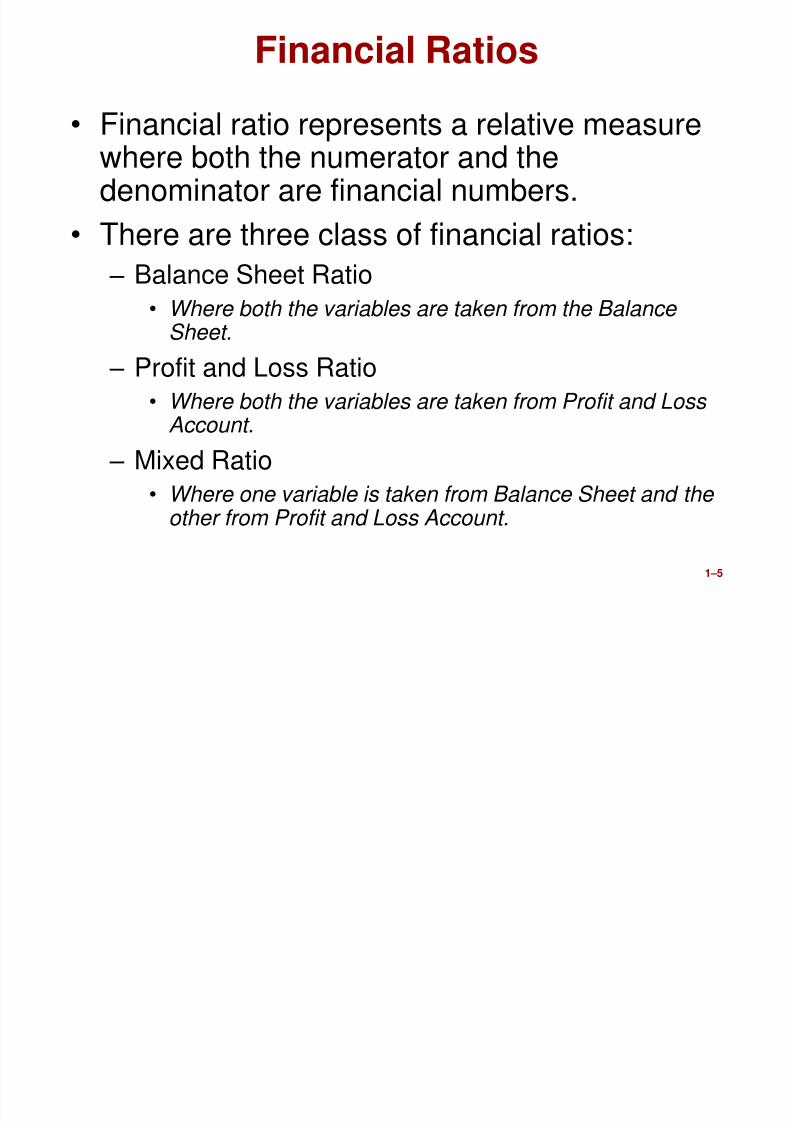
Financial Ratios
• Financial ratio represents a relative measurewhere both the numerator and thedenominator are financial numbers.
• There are three class of financial ratios:
– Balance Sheet Ratio• Where both the variables are taken from the Balance
Sheet.
– Profit and Loss Ratio
• Where both the variables are taken from Profit and Loss Account.
– Mixed Ratio
• Where one variable is taken from Balance Sheet and the other from Profit and Loss Account.
8/7/2019 Session FSA
http://slidepdf.com/reader/full/session-fsa 6/30
1–6
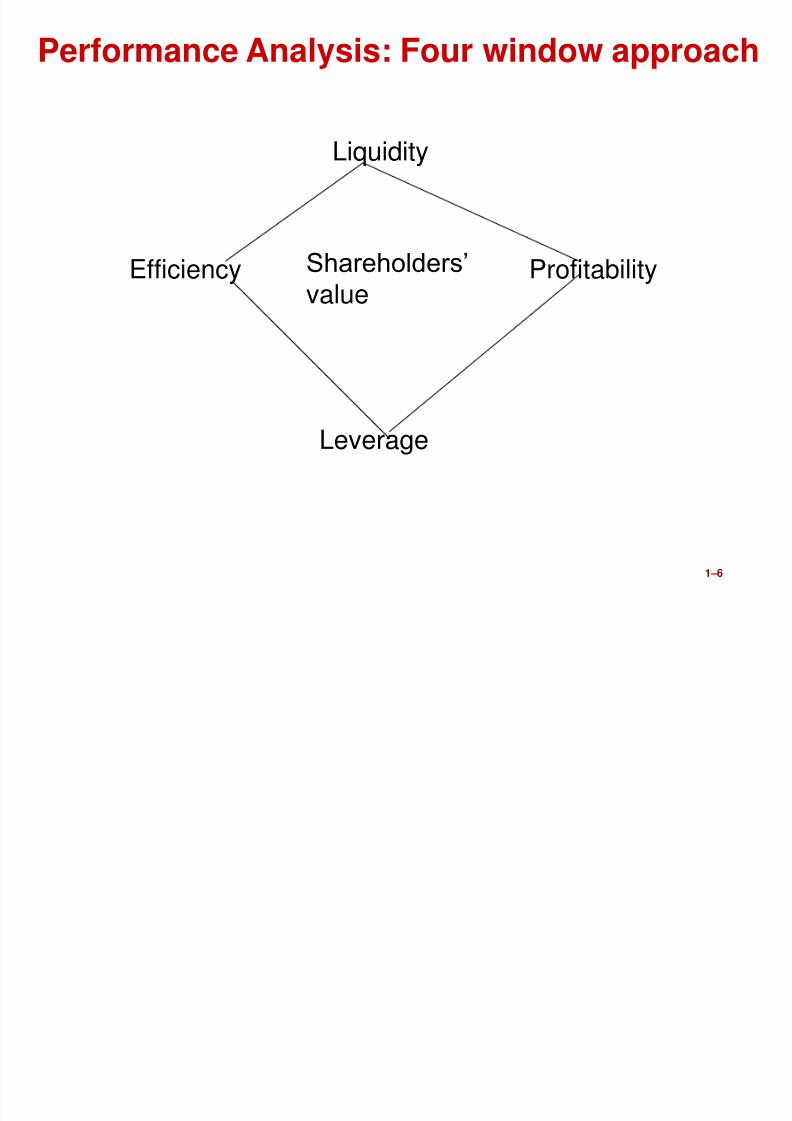
Liquidity
Efficiency
Leverage
ProfitabilityShareholders’value
Performance Analysis: Four window approach
8/7/2019 Session FSA
http://slidepdf.com/reader/full/session-fsa 7/301–7
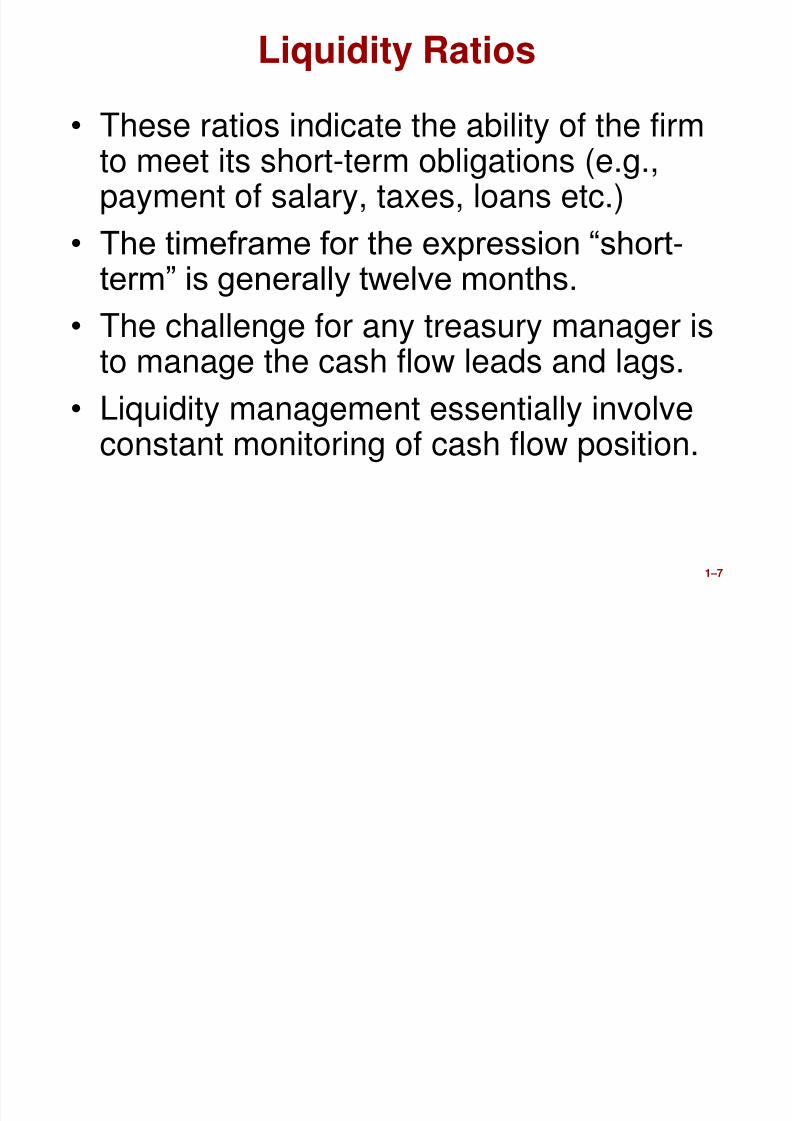
Liquidity Ratios
• These ratios indicate the ability of the firmto meet its short-term obligations (e.g.,payment of salary, taxes, loans etc.)
• The timeframe for the expression “short-
term” is generally twelve months.• The challenge for any treasury manager is
to manage the cash flow leads and lags.
• Liquidity management essentially involveconstant monitoring of cash flow position.
8/7/2019 Session FSA
http://slidepdf.com/reader/full/session-fsa 8/301–8
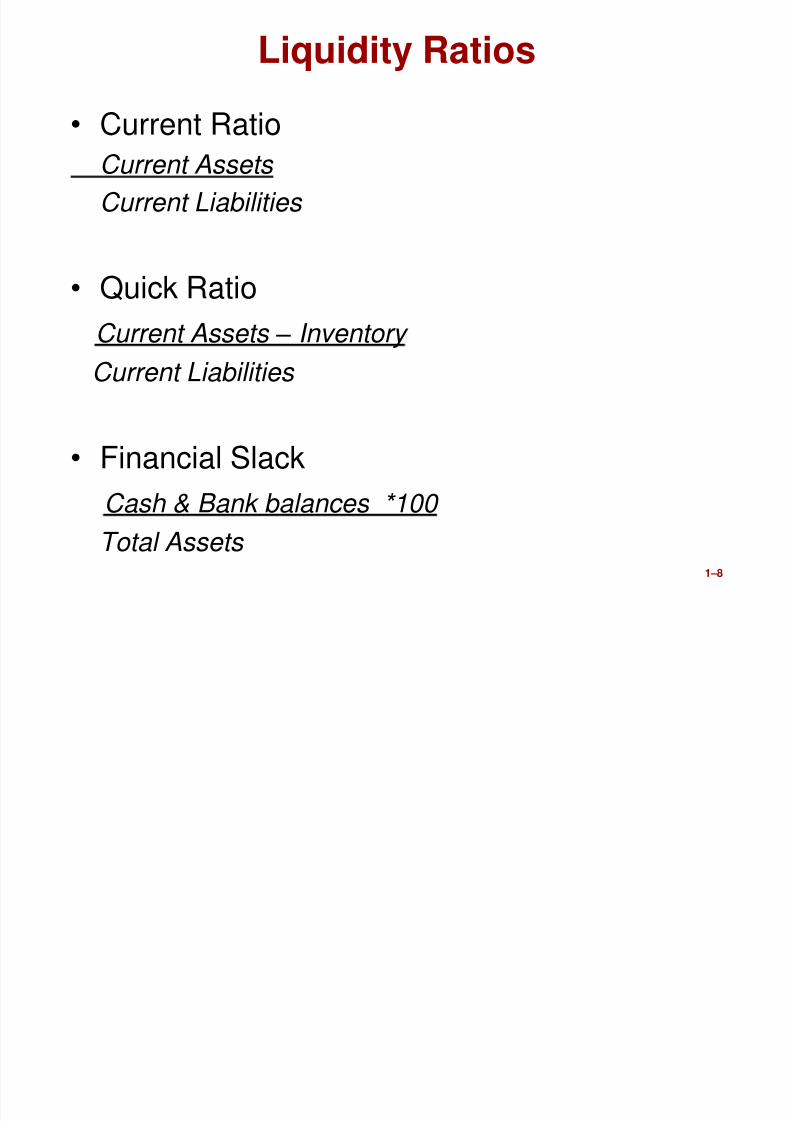
Liquidity Ratios
• Current RatioCurrent Assets
Current Liabilities
• Quick Ratio
Current Assets – Inventory
Current Liabilities
• Financial Slack
Cash & Bank balances *100
Total Assets
8/7/2019 Session FSA
http://slidepdf.com/reader/full/session-fsa 9/301–9
Maruti Marico Colgate InfosysTataSteel
AsianPaints TCS
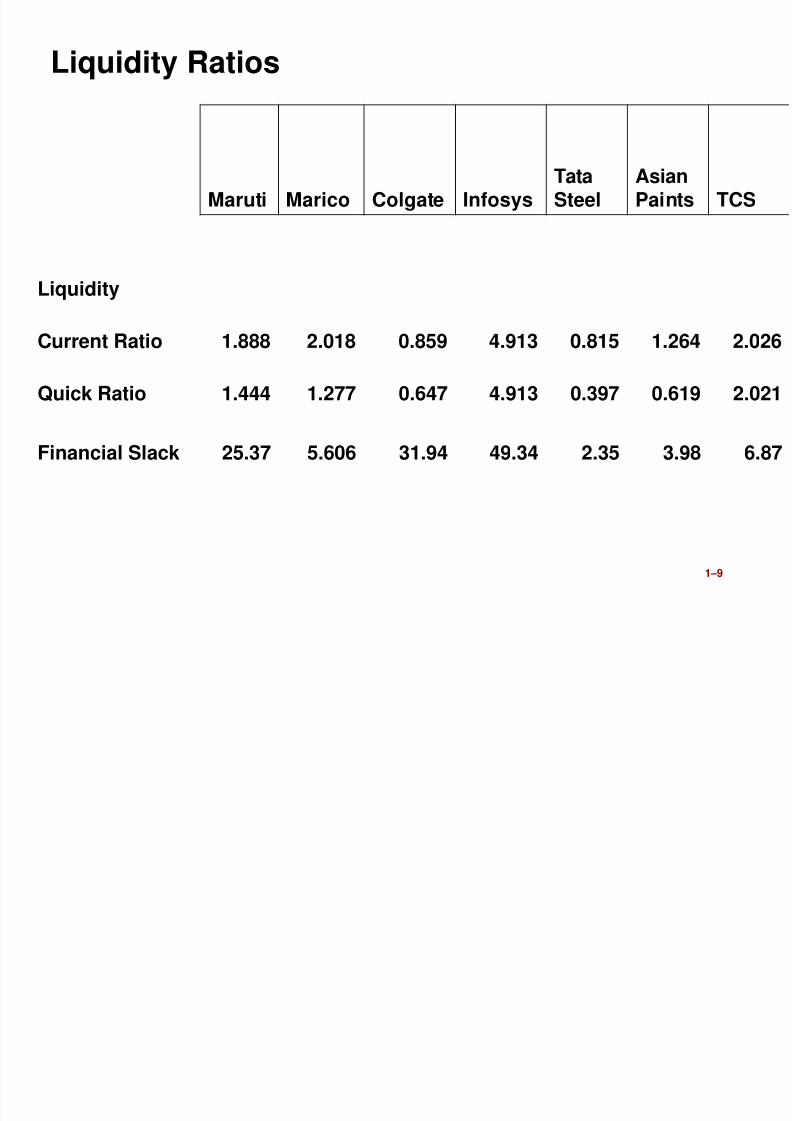
Liquidity
Current Ratio 1.888 2.018 0.859 4.913 0.815 1.264 2.026
Quick Ratio 1.444 1.277 0.647 4.913 0.397 0.619 2.021
Financial Slack 25.37 5.606 31.94 49.34 2.35 3.98 6.87
Liquidity Ratios
8/7/2019 Session FSA
http://slidepdf.com/reader/full/session-fsa 10/301–10
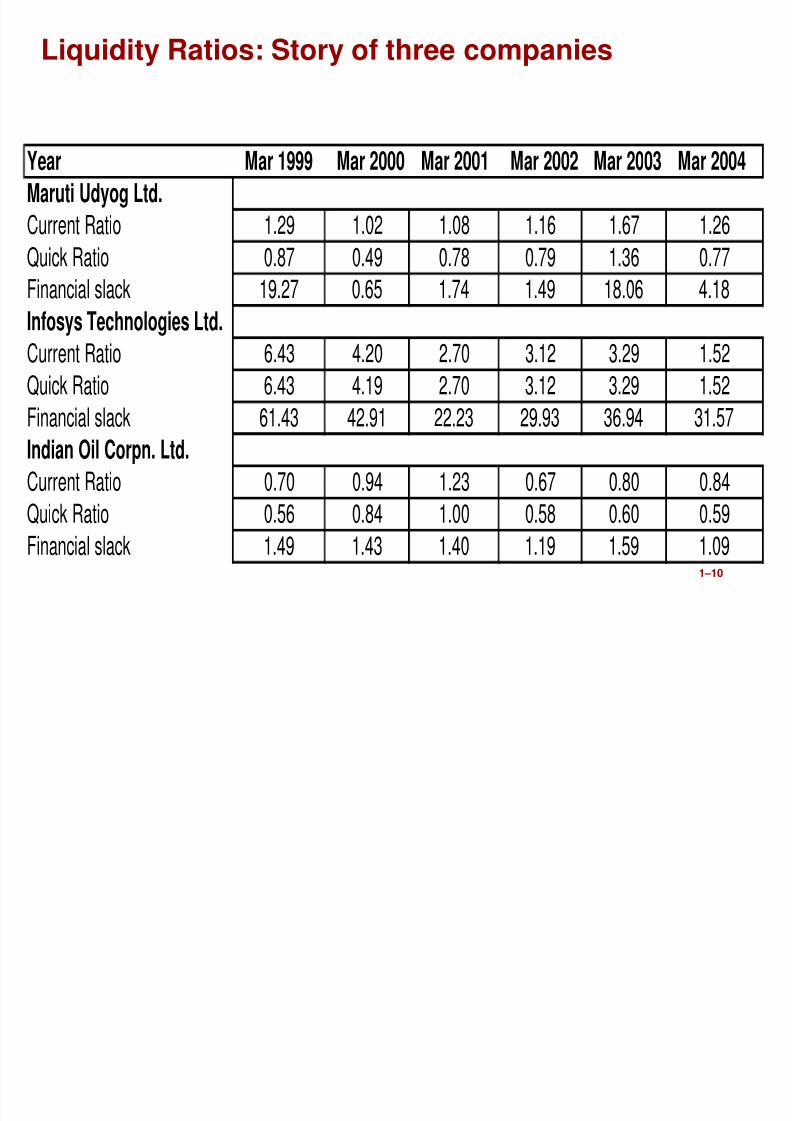
Liquidity Ratios: Story of three companies
Year Mar 1999 Mar 2000 Mar 2001 Mar 2002 Mar 2003 Mar 2004
Maruti Udyog Ltd.
Current Ratio 1.29 1.02 1.08 1.16 1.67 1.26
Quick Ratio 0.87 0.49 0.78 0.79 1.36 0.77
Financial slack 19.27 0.65 1.74 1.49 18.06 4.18
Infosys Technologies Ltd.
Current Ratio 6.43 4.20 2.70 3.12 3.29 1.52
Quick Ratio 6.43 4.19 2.70 3.12 3.29 1.52
Financial slack 61.43 42.91 22.23 29.93 36.94 31.57Indian Oil Corpn. Ltd.
Current Ratio 0.70 0.94 1.23 0.67 0.80 0.84
Quick Ratio 0.56 0.84 1.00 0.58 0.60 0.59
Financial slack 1.49 1.43 1.40 1.19 1.59 1.09
8/7/2019 Session FSA
http://slidepdf.com/reader/full/session-fsa 11/301–11
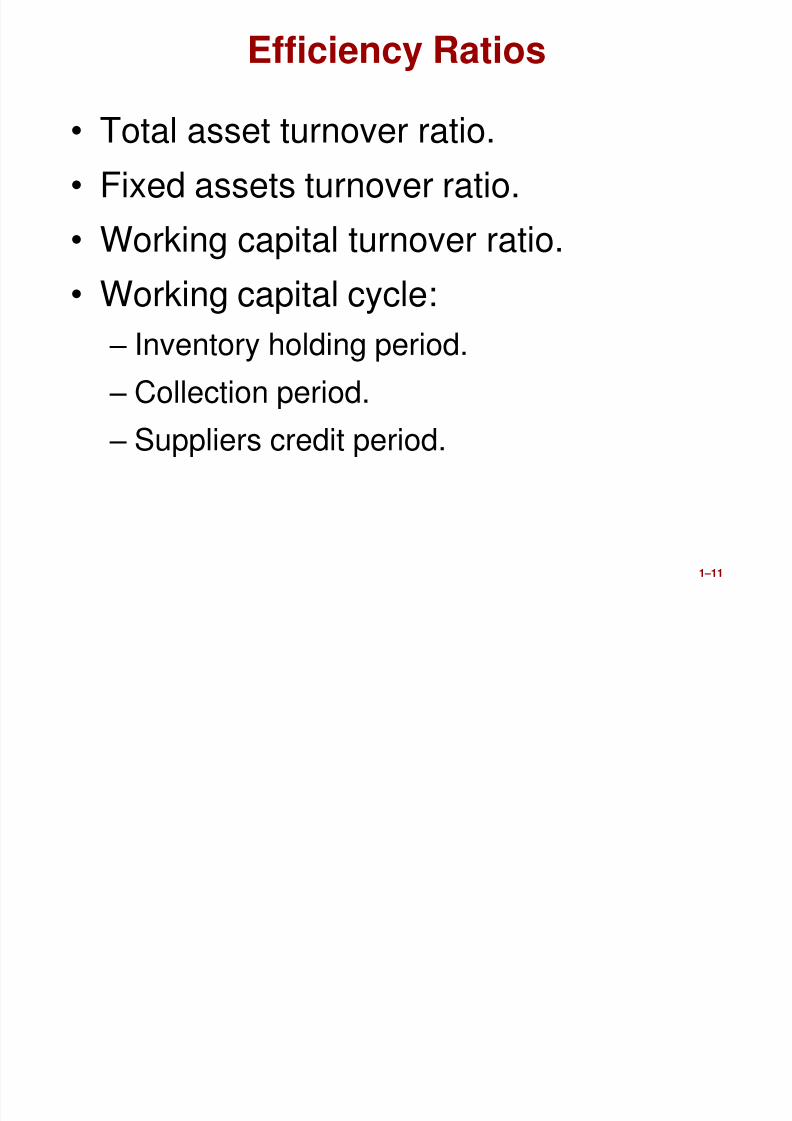
Efficiency Ratios
• Total asset turnover ratio.• Fixed assets turnover ratio.
• Working capital turnover ratio.
• Working capital cycle:
– Inventory holding period.
– Collection period.
– Suppliers credit period.

8/7/2019 Session FSA
http://slidepdf.com/reader/full/session-fsa 12/301–12
Overall Efficiency Sales/Capital Employed
Fixed Assets Efficiency
(or Turnover) Ratio
Sales/(Net Block + Capital WIP)
Working Capital
Efficiency(Turnover)
Sales/ Working Capital
Inventory Turnover Cost of Goods Sold / Average Inventory
Debtors Turnover Credit Sales / (Average Debtors + Average Bills Receivable)
Creditors Turnover Credit Purchase / (Average Creditors + Average Bills Payable)
Average Inventory
Inventory Holding
Period
(Average Inventory/Cost of Goods Sold) x No. of Days/Months in a
Year
Debtors CollectionPeriod
((Average Debtors + Average Bills Receivables)/ Credit Sales) x No. of Days/Months in a Year
Suppliers Credit Period ((Average Creditors + Average Bills Payable)/ Credit Purchases) x No.
of Days/months in a year
8/7/2019 Session FSA
http://slidepdf.com/reader/full/session-fsa 13/301–13
Maruti
Marico
Colgate
Infosys
TataSteel
AsianPaints TCS
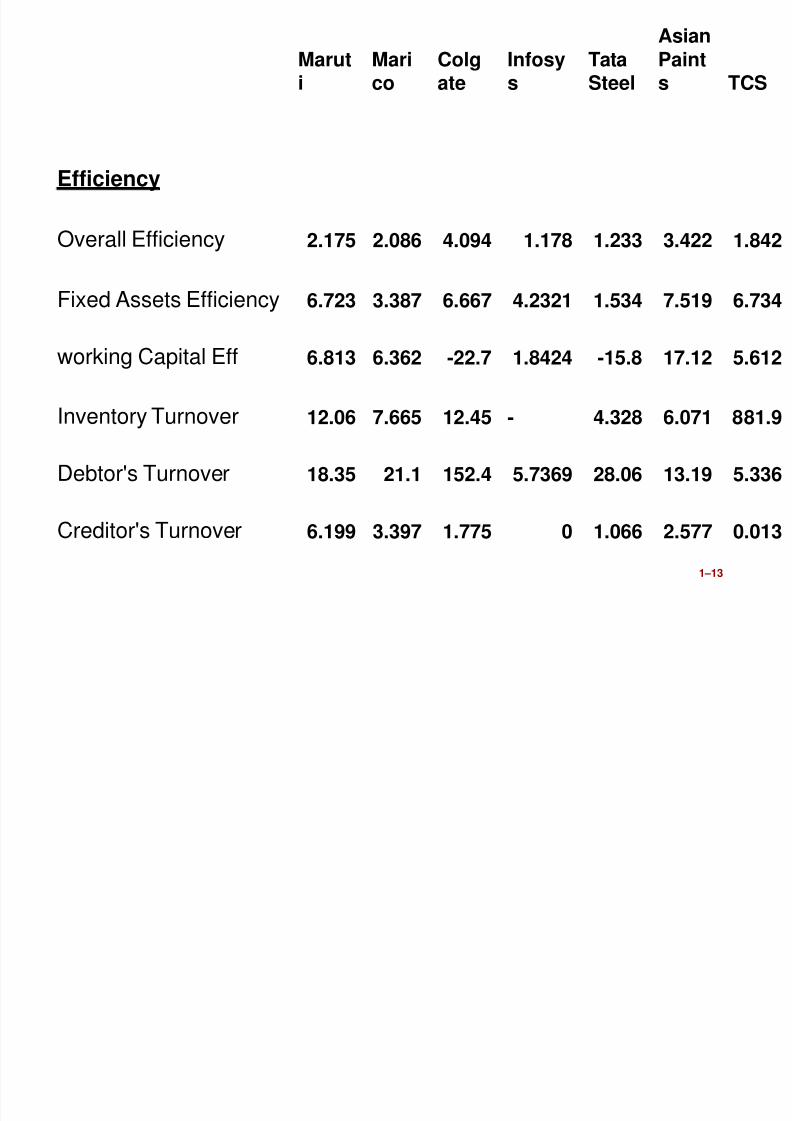
Efficiency
Overall Efficiency 2.175 2.086 4.094 1.178 1.233 3.422 1.842
Fixed Assets Efficiency 6.723 3.387 6.667 4.2321 1.534 7.519 6.734
working Capital Eff 6.813 6.362 -22.7 1.8424 -15.8 17.12 5.612
Inventory Turnover 12.06 7.665 12.45 - 4.328 6.071 881.9
Debtor's Turnover 18.35 21.1 152.4 5.7369 28.06 13.19 5.336
Creditor's Turnover 6.199 3.397 1.775 0 1.066 2.577 0.013
8/7/2019 Session FSA
http://slidepdf.com/reader/full/session-fsa 14/301–14
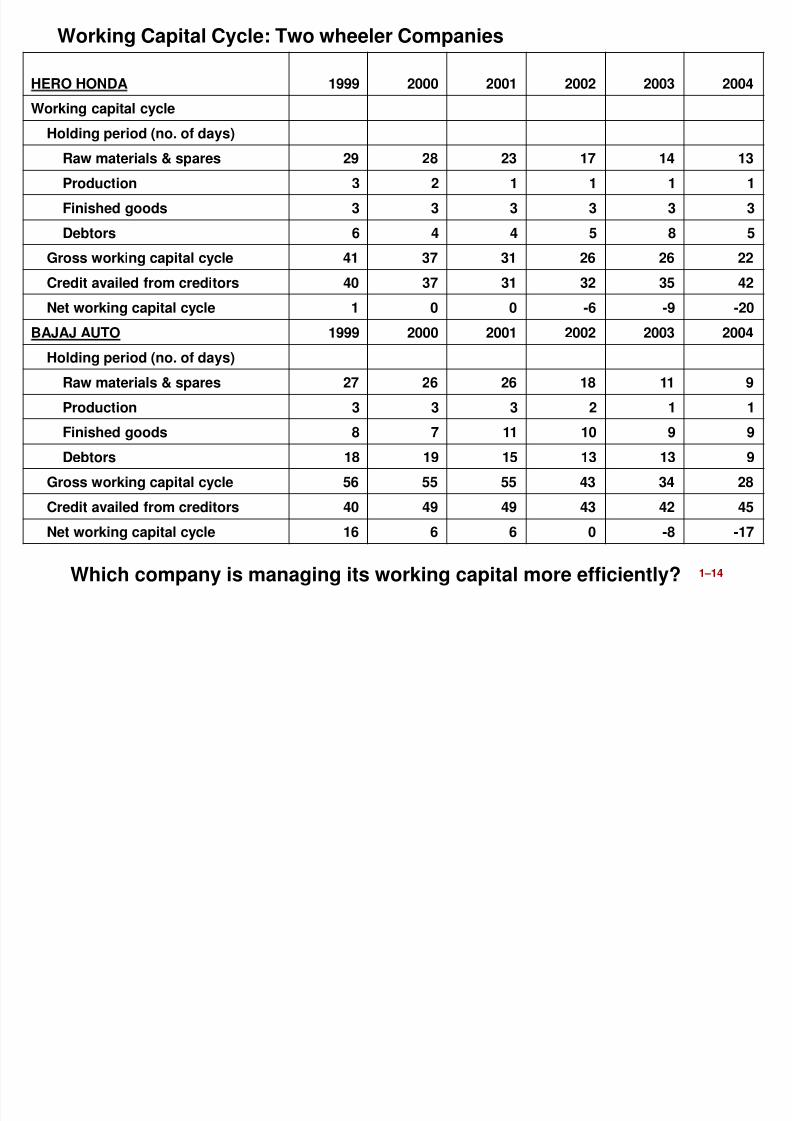
HERO HONDA 1999 2000 2001 2002 2003 2004
Working capital cycle
Holding period (no. of days)Raw materials & spares 29 28 23 17 14 13
Production 3 2 1 1 1 1
Finished goods 3 3 3 3 3 3
Debtors 6 4 4 5 8 5
Gross working capital cycle 41 37 31 26 26 22
Credit availed from creditors 40 37 31 32 35 42
Net working capital cycle 1 0 0 -6 -9 -20
BAJAJ AUTO 1999 2000 2001 2002 2003 2004
Holding period (no. of days)
Raw materials & spares 27 26 26 18 11 9
Production 3 3 3 2 1 1
Finished goods 8 7 11 10 9 9
Debtors 18 19 15 13 13 9
Gross working capital cycle 56 55 55 43 34 28
Credit availed from creditors 40 49 49 43 42 45
Net working capital cycle 16 6 6 0 -8 -17
Working Capital Cycle: Two wheeler Companies
Which company is managing its working capital more efficiently?
8/7/2019 Session FSA
http://slidepdf.com/reader/full/session-fsa 15/30
15
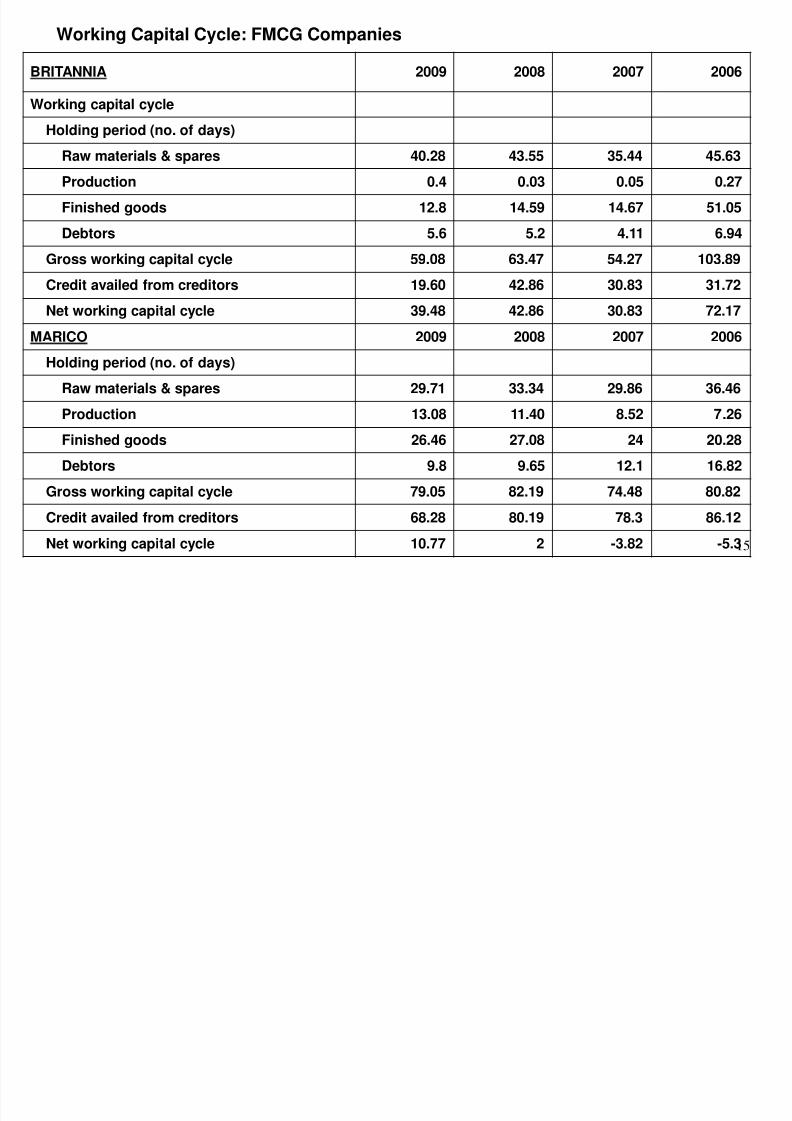
BRITANNIA 2009 2008 2007 2006
Working capital cycle
Holding period (no. of days)
Raw materials & spares 40.28 43.55 35.44 45.63
Production 0.4 0.03 0.05 0.27
Finished goods 12.8 14.59 14.67 51.05
Debtors 5.6 5.2 4.11 6.94
Gross working capital cycle 59.08 63.47 54.27 103.89
Credit availed from creditors 19.60 42.86 30.83 31.72
Net working capital cycle 39.48 42.86 30.83 72.17
MARICO 2009 2008 2007 2006
Holding period (no. of days)
Raw materials & spares 29.71 33.34 29.86 36.46
Production 13.08 11.40 8.52 7.26
Finished goods 26.46 27.08 24 20.28
Debtors 9.8 9.65 12.1 16.82
Gross working capital cycle 79.05 82.19 74.48 80.82
Credit availed from creditors 68.28 80.19 78.3 86.12
Net working capital cycle 10.77 2 -3.82 -5.3
Working Capital Cycle: FMCG Companies
8/7/2019 Session FSA
http://slidepdf.com/reader/full/session-fsa 16/30
1–16
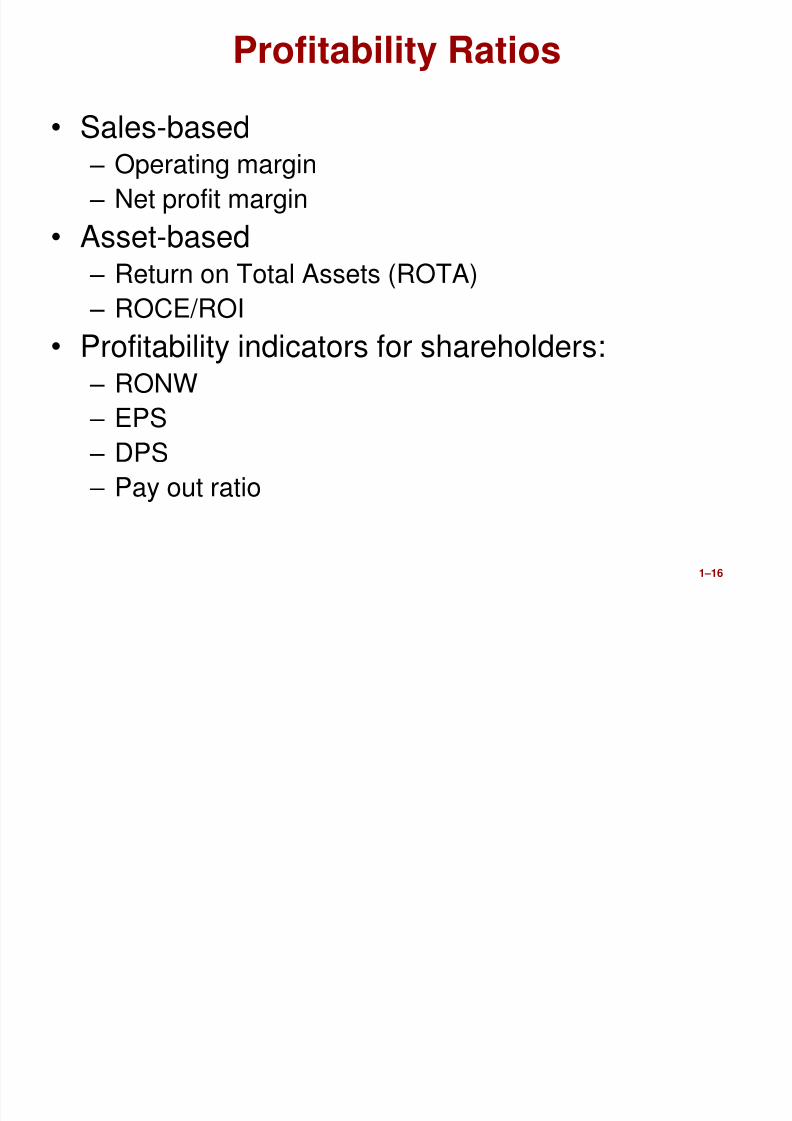
Profitability Ratios
• Sales-based– Operating margin
– Net profit margin
• Asset-based
– Return on Total Assets (ROTA)– ROCE/ROI
• Profitability indicators for shareholders:– RONW
– EPS– DPS
– Pay out ratio
8/7/2019 Session FSA
http://slidepdf.com/reader/full/session-fsa 17/30
1–17
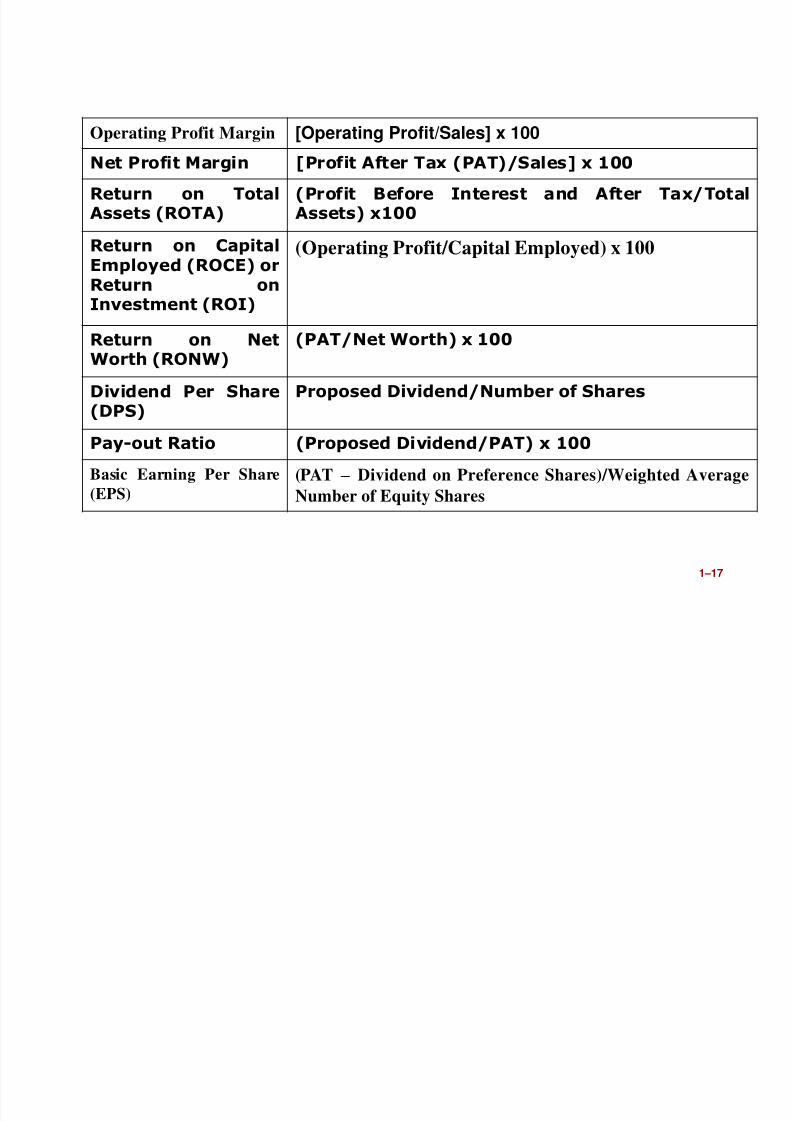
Operating Profit Margin [Operating Profit/Sales] x 100Net Profit Margin [Profit After Tax (PAT)/Sales] x 100
Return on TotalAssets (ROTA)
(Profit Before Interest and After Tax/TotalAssets) x100
Return on CapitalEmployed (ROCE) or
Return onInvestment (ROI)
(Operating Profit/Capital Employed) x 100
Return on NetWorth (RONW)
(PAT/Net Worth) x 100
Dividend Per Share
(DPS)
Proposed Dividend/Number of Shares
Pay-out Ratio (Proposed Dividend/PAT) x 100
Basic Earning Per Share
(EPS)
(PAT – Dividend on Preference Shares)/Weighted Average
Number of Equity Shares
8/7/2019 Session FSA
http://slidepdf.com/reader/full/session-fsa 18/30
1–18
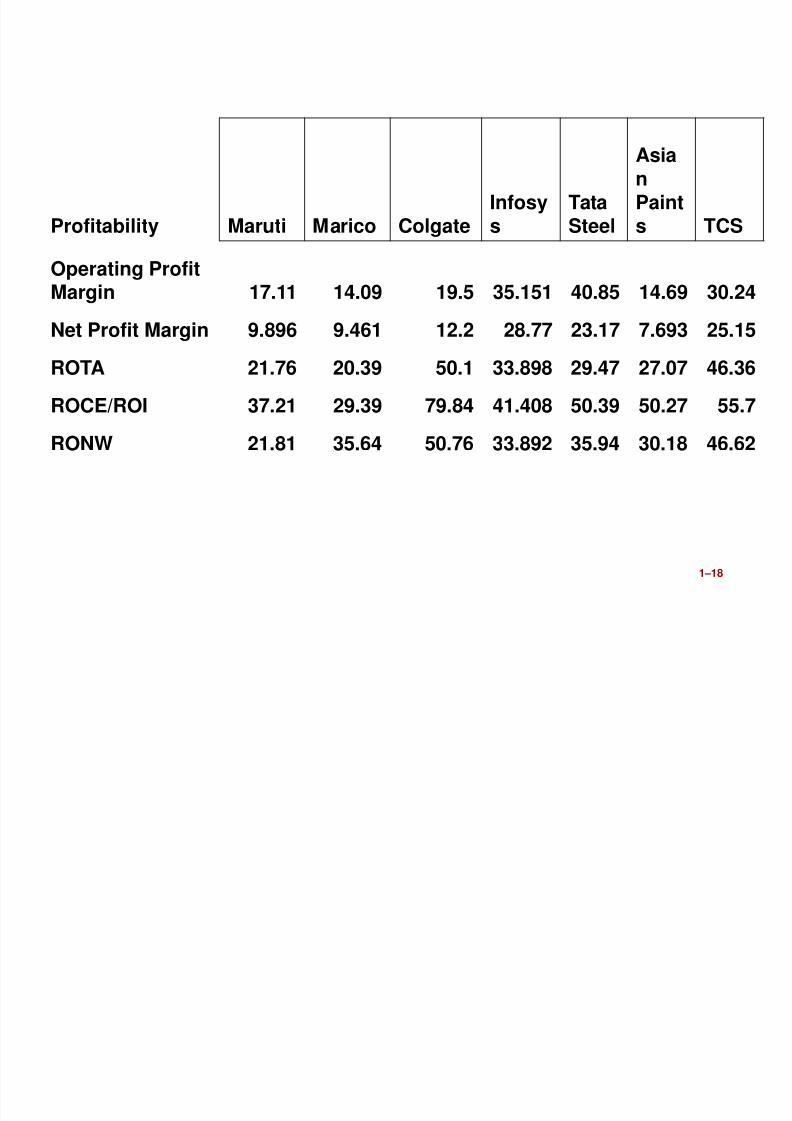
Profitability Maruti Marico ColgateInfosys
TataSteel
AsianPaints TCS
Operating ProfitMargin 17.11 14.09 19.5 35.151 40.85 14.69 30.24
Net Profit Margin 9.896 9.461 12.2 28.77 23.17 7.693 25.15
ROTA 21.76 20.39 50.1 33.898 29.47 27.07 46.36
ROCE/ROI 37.21 29.39 79.84 41.408 50.39 50.27 55.7
RONW 21.81 35.64 50.76 33.892 35.94 30.18 46.62
8/7/2019 Session FSA
http://slidepdf.com/reader/full/session-fsa 19/30
1–19
Capital Structure (or Long-term solvency)
• Debt-equity ratio.
• Interest coverage ratio.• Debt service coverage ratio.
8/7/2019 Session FSA
http://slidepdf.com/reader/full/session-fsa 20/30
1–20
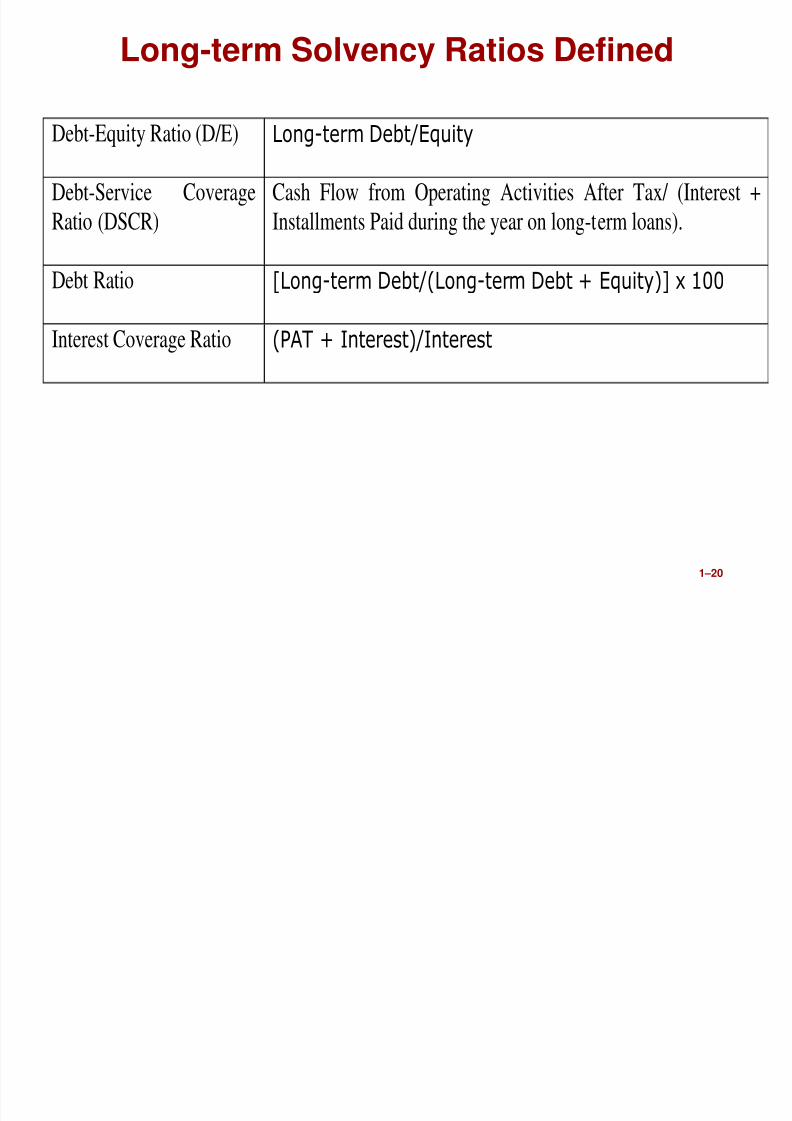
Long-term Solvency Ratios Defined
Debt-Equity Ratio (D/E) Long-term Debt/Equity
Debt-Service Coverage
Ratio (DSCR)
Cash Flow from Operating Activities After Tax/ (Interest +
Installments Paid during the year on long-term loans).
Debt Ratio [Long-term Debt/(Long-term Debt + Equity)] x 100
Interest Coverage Ratio (PAT + Interest)/Interest
8/7/2019 Session FSA
http://slidepdf.com/reader/full/session-fsa 21/30
1–21
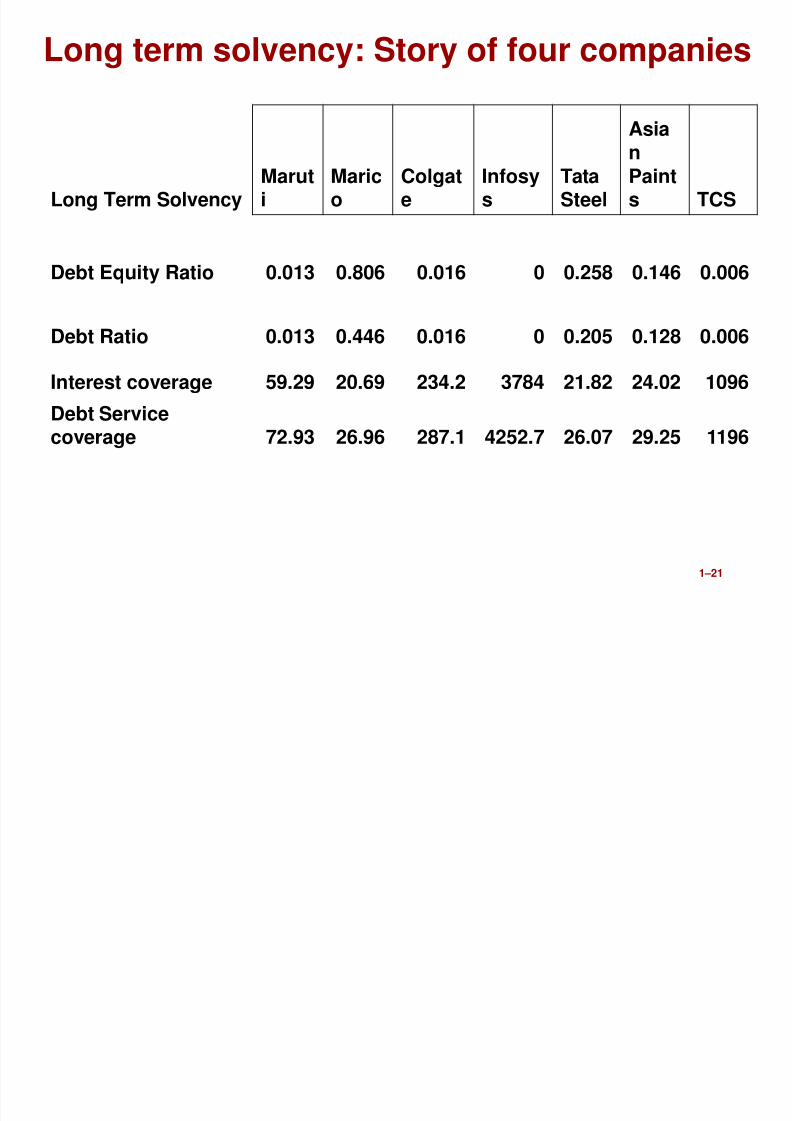
Long term solvency: Story of four companies
Long Term SolvencyMaruti
Marico
Colgate
Infosys
TataSteel
AsianPaints TCS
Debt Equity Ratio 0.013 0.806 0.016 0 0.258 0.146 0.006
Debt Ratio 0.013 0.446 0.016 0 0.205 0.128 0.006
Interest coverage 59.29 20.69 234.2 3784 21.82 24.02 1096
Debt Servicecoverage 72.93 26.96 287.1 4252.7 26.07 29.25 1196

8/7/2019 Session FSA
http://slidepdf.com/reader/full/session-fsa 22/30
1–22
Market-based ratios
• Price-earning (P/E) multiple.• Price-to-book ratio.
• Dividend yield.
• Total shareholder return (TSR)
8/7/2019 Session FSA
http://slidepdf.com/reader/full/session-fsa 23/30
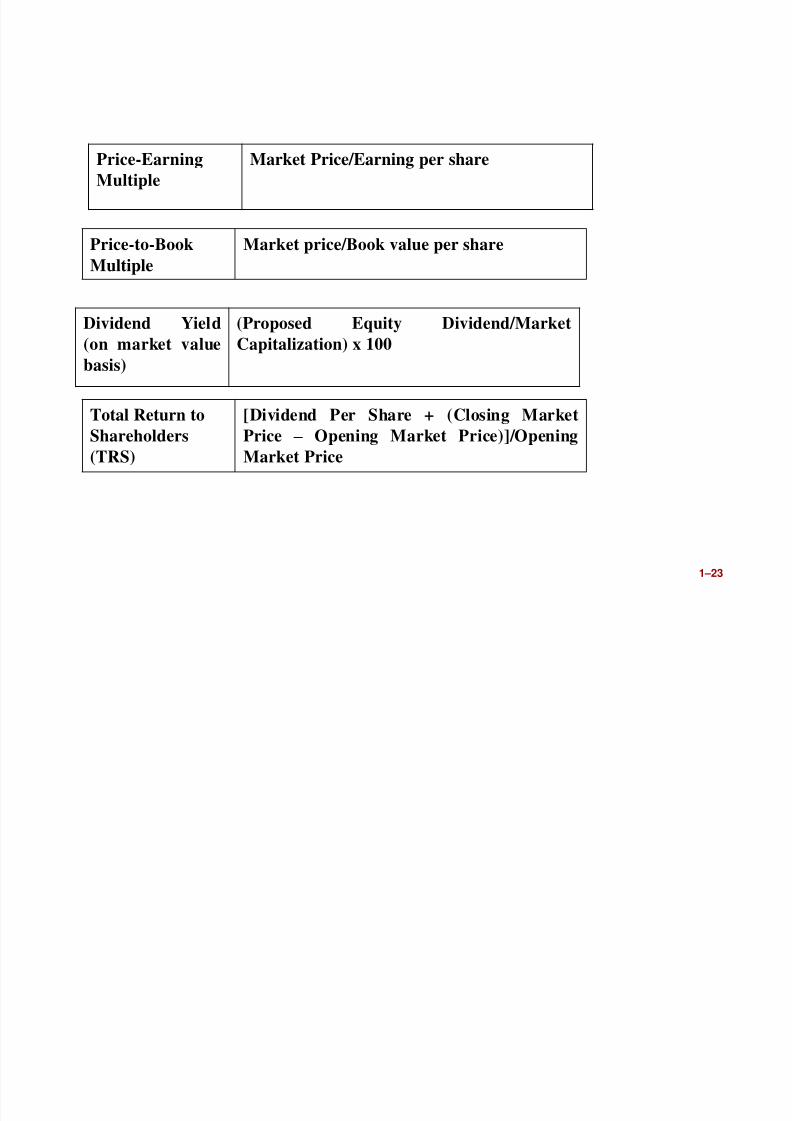
1–23
Dividend Yield
(on market value
basis)
(Proposed Equity Dividend/Market
Capitalization) x 100
Total Return toShareholders
(TRS)
[Dividend Per Share + (Closing MarketPrice – Opening Market Price)]/Opening
Market Price
Price-Earning
Multiple
Market Price/Earning per share
Price-to-Book
Multiple
Market price/Book value per share
8/7/2019 Session FSA
http://slidepdf.com/reader/full/session-fsa 24/30
1–24
Limitations of FinancialRatio Analysis
• Financial ratio analysis, however, hassome limitations:
– Comparing an organization that is in asingle line of business with an organization
that is a competitor but has multiple lines ofbusiness is likely to be a meaninglesscomparison of unlike organizations
– Even though organizations might be
comparable because they are in similarlines of business, they may use differentaccounting conventions making ratiocomparisons between the two
organizations meaningless
8/7/2019 Session FSA
http://slidepdf.com/reader/full/session-fsa 25/30
1–25
Intra-firm and Inter-firm analyses
• When the performance of a particularfirm is evaluated over a time period, it isknown as intra-firm analysis.
• When the performance of cross sectionof firms within the same industry areevaluated for a particular year or over aperiod of time, it is known as inter-firmanalysis.
8/7/2019 Session FSA
http://slidepdf.com/reader/full/session-fsa 26/30
1–26
Time series and Cross sectional analyses
• The performance of a particular firmmay be observed over a time period byfollowing the trend of financial ratios.Such analysis of performance is known
as time series analysis.• When performance of cross section of
firms in the same industry is analysed
for a particular year, such analysis iscalled cross sectional analysis.
8/7/2019 Session FSA
http://slidepdf.com/reader/full/session-fsa 27/30
1–27
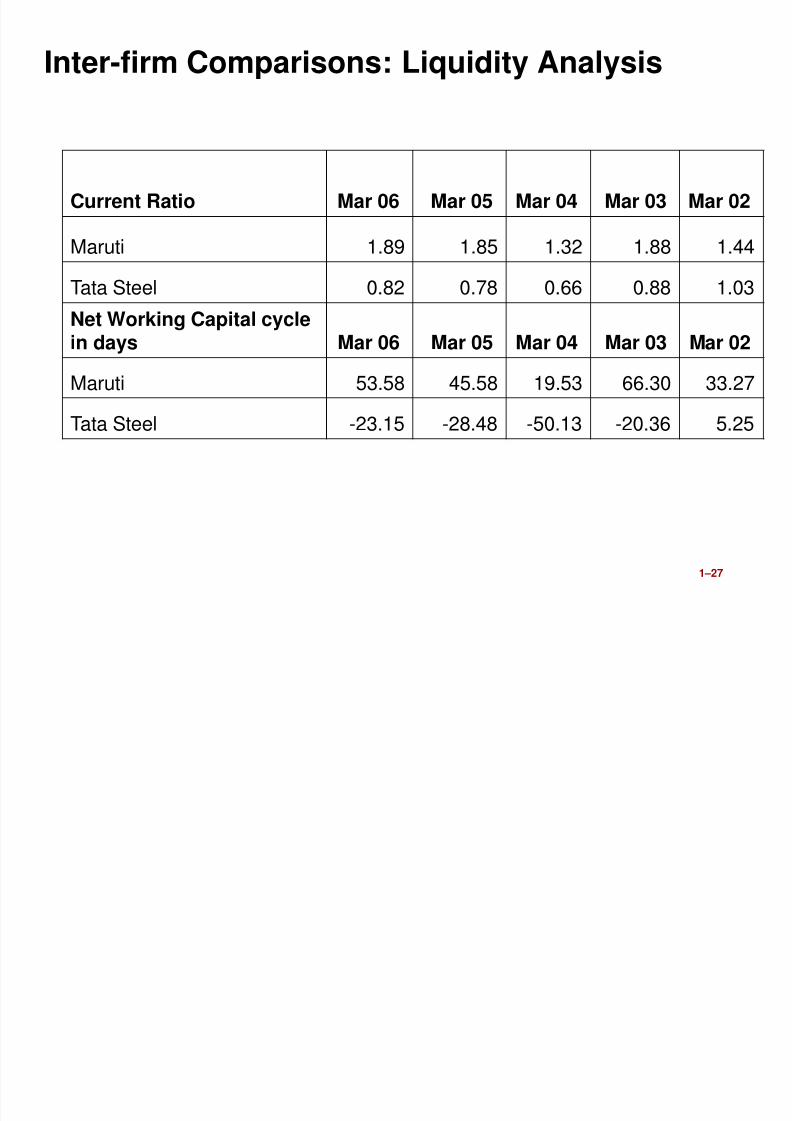
Inter-firm Comparisons: Liquidity Analysis
Current Ratio Mar 06 Mar 05 Mar 04 Mar 03 Mar 02
Maruti 1.89 1.85 1.32 1.88 1.44
Tata Steel 0.82 0.78 0.66 0.88 1.03
Net Working Capital cyclein days Mar 06 Mar 05 Mar 04 Mar 03 Mar 02
Maruti 53.58 45.58 19.53 66.30 33.27
Tata Steel -23.15 -28.48 -50.13 -20.36 5.25
8/7/2019 Session FSA
http://slidepdf.com/reader/full/session-fsa 28/30
1–28
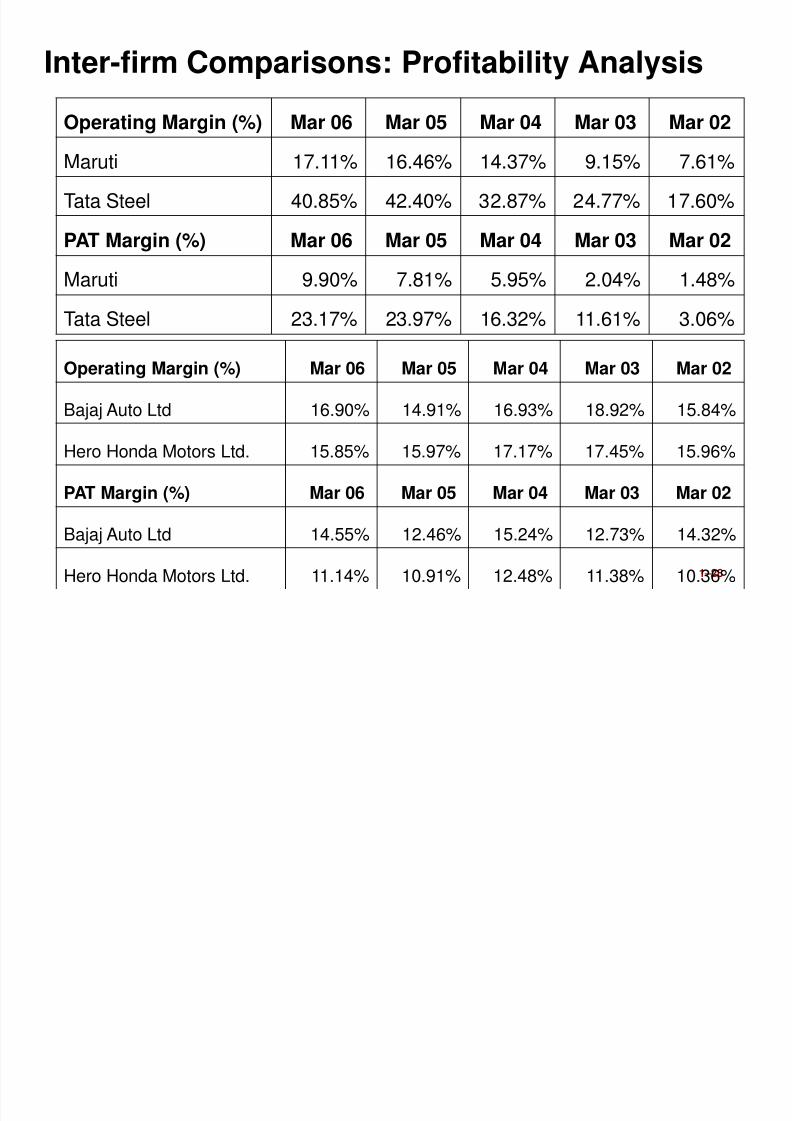
Inter-firm Comparisons: Profitability Analysis
Operating Margin (%) Mar 06 Mar 05 Mar 04 Mar 03 Mar 02
Maruti 17.11% 16.46% 14.37% 9.15% 7.61%
Tata Steel 40.85% 42.40% 32.87% 24.77% 17.60%
PAT Margin (%) Mar 06 Mar 05 Mar 04 Mar 03 Mar 02
Maruti 9.90% 7.81% 5.95% 2.04% 1.48%
Tata Steel 23.17% 23.97% 16.32% 11.61% 3.06%
Operating Margin (%) Mar 06 Mar 05 Mar 04 Mar 03 Mar 02
Bajaj Auto Ltd 16.90% 14.91% 16.93% 18.92% 15.84%
Hero Honda Motors Ltd. 15.85% 15.97% 17.17% 17.45% 15.96%
PAT Margin (%) Mar 06 Mar 05 Mar 04 Mar 03 Mar 02
Bajaj Auto Ltd 14.55% 12.46% 15.24% 12.73% 14.32%
Hero Honda Motors Ltd. 11.14% 10.91% 12.48% 11.38% 10.36%
8/7/2019 Session FSA
http://slidepdf.com/reader/full/session-fsa 29/30
1–29
Trend Analysis
• Consider the first year of the time periodas the base year.
• The variables (e.g., ratios) in the first
year are considered as 100 andvariables of all the subsequent yearsare expressed as percentages of thebase year.
• This gives a trend line for each variable.
8/7/2019 Session FSA
http://slidepdf.com/reader/full/session-fsa 30/30
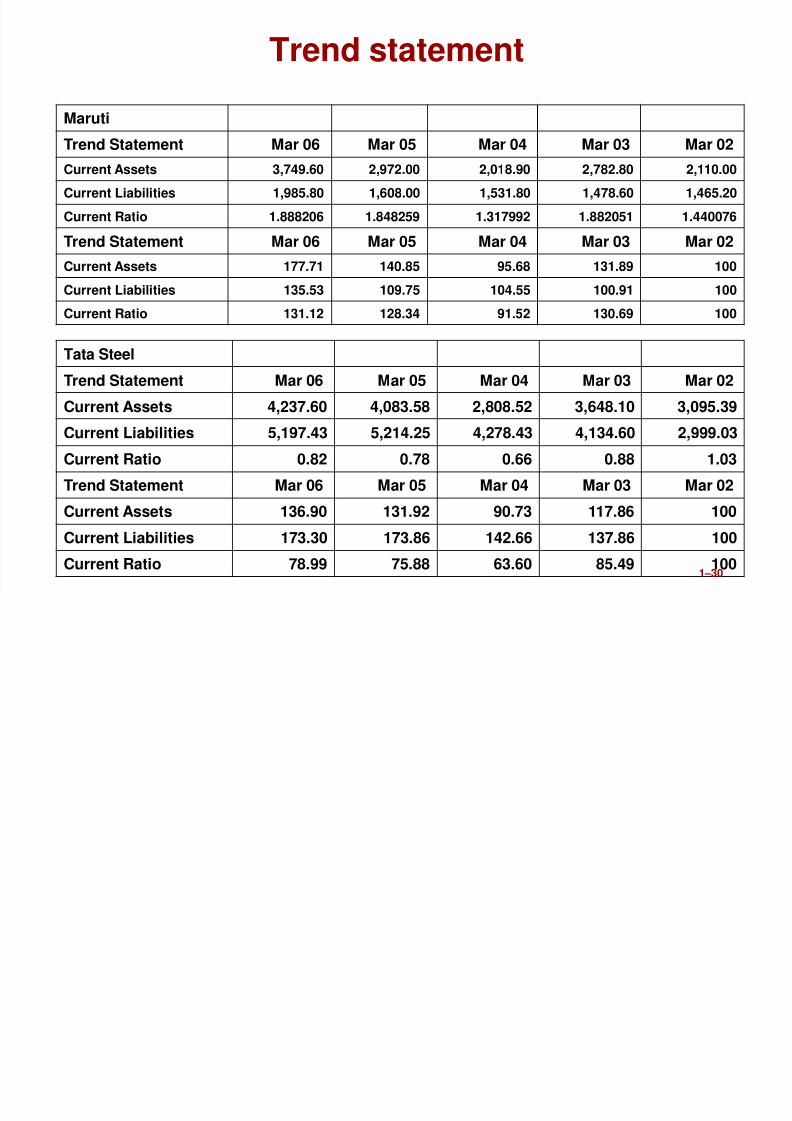
Trend statement
Maruti
Trend Statement Mar 06 Mar 05 Mar 04 Mar 03 Mar 02
Current Assets 3,749.60 2,972.00 2,018.90 2,782.80 2,110.00
Current Liabilities 1,985.80 1,608.00 1,531.80 1,478.60 1,465.20
Current Ratio 1.888206 1.848259 1.317992 1.882051 1.440076
Trend Statement Mar 06 Mar 05 Mar 04 Mar 03 Mar 02
Current Assets 177.71 140.85 95.68 131.89 100
Current Liabilities 135.53 109.75 104.55 100.91 100
Current Ratio 131.12 128.34 91.52 130.69 100
Tata Steel
Trend Statement Mar 06 Mar 05 Mar 04 Mar 03 Mar 02
Current Assets 4,237.60 4,083.58 2,808.52 3,648.10 3,095.39
Current Liabilities 5,197.43 5,214.25 4,278.43 4,134.60 2,999.03
Current Ratio 0.82 0.78 0.66 0.88 1.03
Trend Statement Mar 06 Mar 05 Mar 04 Mar 03 Mar 02
Current Assets 136.90 131.92 90.73 117.86 100
Current Liabilities 173.30 173.86 142.66 137.86 100
Current Ratio 78.99 75.88 63.60 85.49 100