session b3 - introduction to project cost and schedule risk analysis
TRANSCRIPT

Copyright @ 2011. All rights reserved
Introduction to Project Cost and Schedule Risk Analysis
Keith Gray, Risk Performance Ltd
Project Controls Expo – 13th Oct 2015Emirates Stadium, London

Copyright @ 2011. All rights reserved
About the Speaker: Keith Gray
Consultant and trainer on risk processes (Management _of_Risk) and tools (Predict! Risk Controller, Predict! Risk Analyser, Primavera Risk Analysis, Primavera P6 Risk Register)
Implementer of ISO 31000 process
Many sectors covered, including defence, energy, oil and gas, telecomms, ICT, construction
Established quantitative risk analysis capability in an energy utility
Early experience in defence during Defence Procurement game changing period
Committee Member of the APM Risk Specific Interest Group
+447879423242

Copyright @ 2011. All rights reserved
Agenda
A few questions
Processes
Definitions
Uncertainty
Risk discussion
ISO 31000 process steps
Recording risks
Configuring a risk matrix
Monte Carlo sampling
Integration
Typical outputs
Further discussion points

Copyright @ 2011. All rights reserved
Project Cost and Schedule Risk Analysis
A few familiar questions …
What?
Why?
When?
How?
Where?
Who?

Copyright @ 2011. All rights reserved
Project Cost and Schedule Risk Analysis–What, Why and When
What – realistic, timely, accurate information on project duration and costs taking account of uncertainties and risks
Why – projects are probabilistic in nature and risk analysis information can help set realistic cost and timescales
When – as required through the project lifecycle, for setting budgets and timescales and contingency before execution phase and to aid project controls during execution

Copyright @ 2011. All rights reserved
Project Cost and Schedule Risk Analysis–How, Where and Who
How – Monte Carlo sampling on estimates of project cost and task duration with uncertainty; risks with estimates of probability and impact linked to costs and tasks; qualitative level of risks from a configured risk matrix, aggregated cost and duration from Monte Carlo simulation
Where – cost and planning tools; risk database; Monte Carlo simulation tool; import / export interfaces
Who – estimators, schedulers, risk analysts, project team, project managers, decision-makers

Copyright @ 2011. All rights reserved
Risk Management Processes
Processes
ISO 31000 Risk management – Principles and Guidelines
plus ISO Guide 73:2009, Risk Management – Vocabulary and ISO/IEC 31010, Risk Management – Risk Assessment Techniques
Management_of_Risk: Guidance for Practitioners
PMBoK, Section 11, Project Risk Management
APM BoK, Section 2 .5 Project Risk Management
plus Project Risk Analysis & Management, (2004) 2nd edition

Copyright @ 2011. All rights reserved
Definitions - Risk
ISO 31000: “Effect of uncertainty on objectives”
M_o_R: “An uncertain event or set of events that, should it occur, will have an effect on the achievement of objectives. A risk is measured by a combination of the probability of a perceived threat or opportunity occurring and the magnitude of its impact on objectives.”
PMBoK: ”An uncertain event or condition that , if it occurs, has a positive effect on a project’s objectives.”
APM: (Risk event) “An uncertain event or set of circumstances that should it or they occur would have an effect on the achievement of one or more of the project objectives.”
APM: (Project risk) “The exposure of stakeholders to the consequences of variation in outcome.”

Copyright @ 2011. All rights reserved
Discussion of terms in the definitions
Uncertainty
Objectives
Uncertain event
Probability (also known as likelihood or chance)
Perceived threat or opportunity
Magnitude of impact
Exposure
Variation in outcome
Stakeholders
Copyright @ 2011. All rights reserved
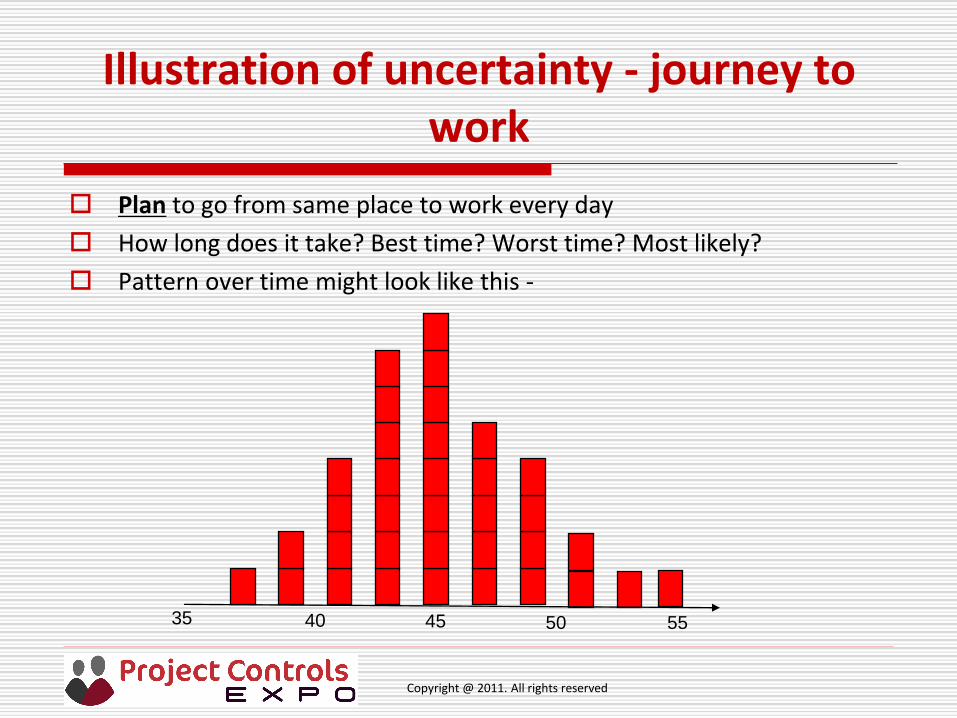
Illustration of uncertainty - journey to work
Plan to go from same place to work every day
How long does it take? Best time? Worst time? Most likely?
Pattern over time might look like this -
35 40 45 50 55
Copyright @ 2011. All rights reserved
Uncertainty discussion points
Why the variation? Ask the audience!
Pattern is also known as: “frequency distribution shape” or “probability distribution function”
Uncertainty in a project schedule relates to the variation in an estimate of a task’s duration and / or cost so need skilled estimators for quality
What drives the variation in a project? What assumptions are made?
How do we make use of this variation? Ask the audience!
Use three-point estimating for each task to define best, worst and most likely durations with a defined distribution shape
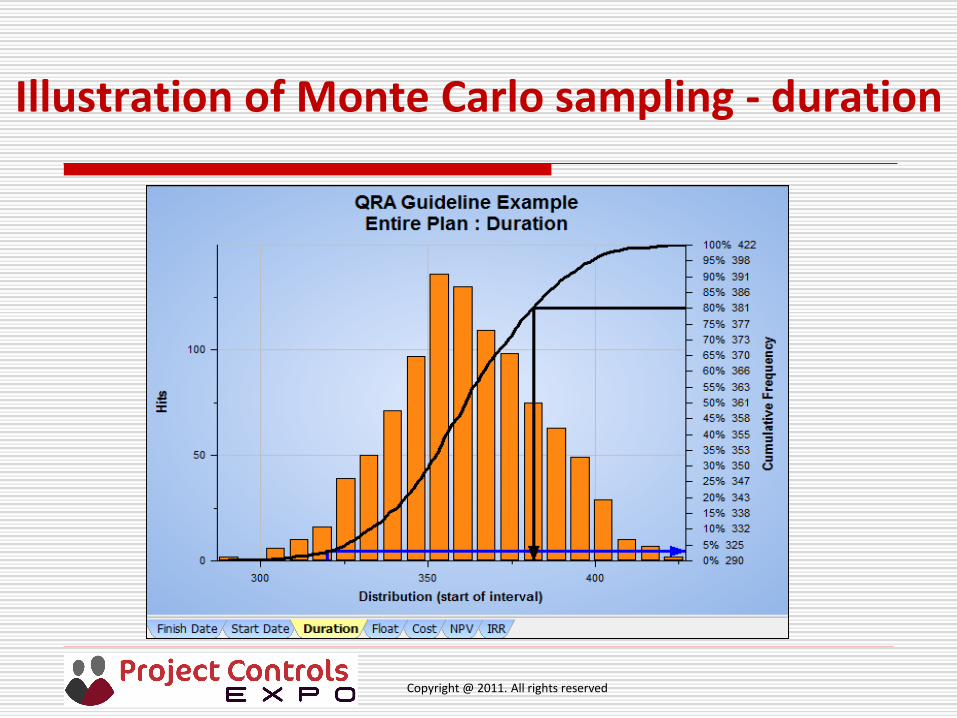
Monte Carlo sampling to provide
Likelihood of achieving project finish date / duration &cost
Drivers of project duration and project cost

Copyright @ 2011. All rights reserved
Example of Monte Carlo sampling
Example – From morning alarm going off to arrival at desk at work
Iteration Number
Alarm goes off
Ablutions
Breakfast
Car journey
Parking
Walk to desk
Arrival at desk / Total time
4, 6, 10 mins
7, 8, 15 mins
35, 45, 55 mins
3, 5, 7 mins
2, 4, 7 mins
7
40
12
5
7
94
50
11
5
6
52
7
5
3
1 32
6
37
8
5
4
n
71 76 76 60
…
Copyright @ 2011. All rights reserved
Illustration of Monte Carlo sampling - duration

Copyright @ 2011. All rights reserved
Risk discussion points 1
Uncertain event – may or may not occur
Likelihood of occurrence is also known as probability, measured as a decimal 0 to 1 or percentage 0% to 100%
If 0 or 0%, then there is no risk
If 1 or 100% there is no risk as has occurred & should be treated as an issue
Threat – if risk occurs,
schedule could be extended, and / or
cost will be increased
Opportunity – if it occurs,
schedule could be reduced, and / or
cost will be reduced (if cost of managing less than benefit)

Copyright @ 2011. All rights reserved
Risk discussion points 2
Magnitude of impact: days added to (or subtracted from) task duration and / or costs added to (or reduced from) task cost
There can be
one risk impacting several tasks
one task impacted by several risks
several risks impacting several tasks
To measure the full impact of a risk it must be linked to an appropriate Work Breakdown Structure element(s) (Project, Task package, Task)
Impact may be uncertain (best, worst, most likely so need three-point estimate) or certain (single value, such as a fee)
Copyright @ 2011. All rights reserved
Risk discussion points 3
Exposure is the full range of the variation of project outcomes over the cumulative probability range from 0% to 100%, shown as ‘S’ curve in earlier slide
Use can be made of ‘S’ curves for setting budgets and timescales, including contingency
Stakeholders – “Any individual, group or organisation that can affect, be affected by, or perceive itself to be affected by an initiative (project or task).” Source Management_of_Risk
Task managers, project managers, decision-makers, investment committee, residents, landowners, schools, emergency services, etc etc

Copyright @ 2011. All rights reserved
ISO 31000: Risk management – Principles and Guidelines, Process Steps

Copyright @ 2011. All rights reserved
ISO 31000 Risk process steps 1
Establish the context – everything you need to know about the project, including objectives and stakeholders. Need to keep this under review
Project charter should define how risk are to be managed –qualitatively, quantitatively or both
Identify the risks – what may happen. Use construct <Cause>, <Event>, <Impact or consequence> for clarity
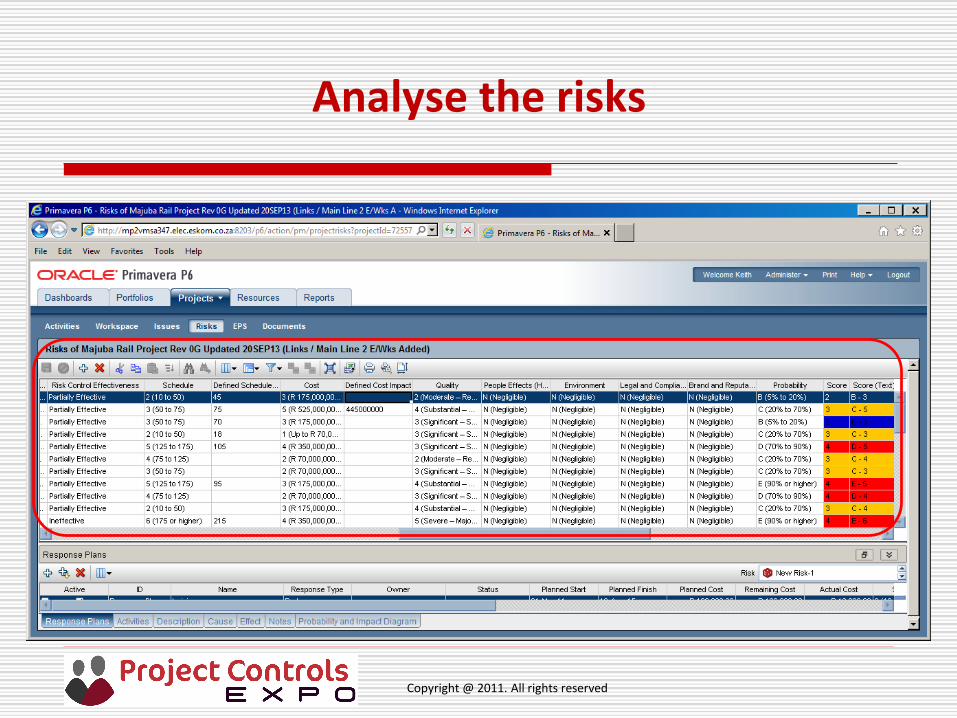
Analyse the risks - in terms of likelihood and impact on objectives, taking account of current controls and their effectiveness
Impacts on objectives can be readily quantifiable (cost and duration) or non-quantifiable (quality, reputation, legal and compliance, health and safety, environment)
Ranges of likelihood and impacts and impact types should be defined in project charter or organisation risk policy / standard

Copyright @ 2011. All rights reserved
ISO 31000 Risk process steps 2
For each risk, the highest of the impact types are combined with likelihood to determine a risk level or score.
Evaluate the risks - sorted from highest likelihood and impact to lowest likelihood and impact. Levels or scores can be used
Treat the risks - focuses attention on the prioritised risks and can use one or more of these options:
Avoid (Enhance) – remove the risk by changing the plan or circumstances
Treat – proactive action to reduce (increase) likelihood and / or reduce (increase) impact
Share – with another party including contracts and insurance
Accept – an informed decision to do nothing but keep under review

Copyright @ 2011. All rights reserved
The decision to proceed with treatment options should take into account cost effectiveness, timing, resourcing
Effectiveness can be measured as the difference between the pre-treatment and planned post-treatment levels or exposure for the cost of the treatment actions and the cost of treating any secondary risks introduced by the actions.
Communicate and consult - throughout the risk lifecycle
Monitor and review - throughout the risk lifecycle
Contingency can be recommended based on the difference between the pre-treatment and planned post-treatment values at an agreed confidence level
ISO 31000 Risk process steps 3

Copyright @ 2011. All rights reserved
Risk identification exercise
Exercise. Look at the journey to work example. Look at one of the tasks and identify at least 2 risks.
Use the construct <cause>, <event>, <impact> to describe the risk
How likely is the risk to occur? How much will it impact on my journey?
What can you do about the risk?
What assumptions have you made?
Copyright @ 2011. All rights reserved
Practical aspects: Recording risks -database or spreadsheet?
What do we need a risk database to be capable of?
Does a spreadsheet achieve these features?
What do you use?

Copyright @ 2011. All rights reserved
Practical aspects: Risk databases
What do we need a risk database to be capable of?
Accessible
User profiles
Controlled configuration to a process / standard / project / organisation
Ease of use and secure
Handle pre-treatment and planned post-treatment assessments
Audit trail
Reporting
Roll back / backed up
Integrate with other tools and link risks to tasks / cost elements
Comply with IT policy

Copyright @ 2011. All rights reserved
Example configuration requirement for risk matrix in database
Level of risk using a risk matrix by combining highest impact (or consequence) with probability(or likelihood) (also known as heat map)
Project impact types from organisation standard (e.g. commonly 4, 5 or 6; cost, schedule delay, reputation, environment, people, legal)
Impact ranges - how many and how labeled
Examples: 1, 2, 3, 4. 5, 6; Very Low, Low, Medium, High, Very High;
Probability ranges from organisation standard
Probability - how many and how labeled (commonly 4, 5 or 6)
Examples: e.g. A, B, C, D; V Low, Low, Medium, High, V High;
Risk bands (or tolerance threshold) from organisation standard
Risk bands – how many, how labeled and field colours
Examples: Low, Medium, High; Levels I, II, III, IV

Copyright @ 2011. All rights reserved
Example configuration settings

Copyright @ 2011. All rights reserved
Example configured risk matrix

Copyright @ 2011. All rights reserved
Identify the risks
Copyright @ 2011. All rights reserved
Analyse the risks

Copyright @ 2011. All rights reserved
Evaluate the risks

Copyright @ 2011. All rights reserved
Treat the risks 1

Copyright @ 2011. All rights reserved
Treat the risks 2

Copyright @ 2011. All rights reserved
Example populated risk matrix

Copyright @ 2011. All rights reserved
Risk database vs Monte Carlo sampling
Risk matrix used for qualitative analysis so that risk levels can be compared
What are the benefits and limitations?
Benefits: Intuitive; easy to understand and prioritise risks
Limitations: Difficult to aggregate; can be misleading if risk linked to task in schedule, cannot distinguish between risks impacting in a schedule
Monte Carlo sampling pinpoints drivers of uncertainty and risks, both cost and schedule; aggregates all risks to provide total exposure
Let’s have a look at what else the Monte Carlo sampling tool should be capable of

Copyright @ 2011. All rights reserved
Monte Carlo sampling
What do we need Monte Carlo sampling to be capable of?
Import schedule and cost plan if separate
Edit uncertainty values, distributions shapes and correlation
Import risks from risk database
Link risks to tasks and cost elements if not already linked in database
Edit cost and schedule impact values
Edit risk probability
Edit risk distribution shape
Select number of iterations
Show histograms and pre & post treated cumulative probability graphs
Show schedule and cost drivers with and without pre & post risks
Reports

Copyright @ 2011. All rights reserved
Integration with Quantitative Risk Analysis tool

Copyright @ 2011. All rights reserved
Typical outputs – Tornado graph, schedule duration drivers: duration sensitivity

Copyright @ 2011. All rights reserved
Typical outputs – Tornado graph, schedule duration drivers: criticality index

Copyright @ 2011. All rights reserved
Typical outputs – Tornado graph, schedule duration drivers: duration cruciality

Copyright @ 2011. All rights reserved
Typical outputs – schedule duration pre-treated risk drivers: duration sensitivity

Copyright @ 2011. All rights reserved
Typical outputs – frequency histogram and cumulative probability: duration uncertainty
Copyright @ 2011. All rights reserved
Further discussion points
Use of the analysis graph for contingency determination
Benefits – Ranges of outcomes address probabilistic nature of projects; many what if scenarios and options can be explored; can support earned value and cost to completion forecasts
Limitations – only modeling those risks identified; new risks will emerge during execution so need to repeat frequently
Skills of everyone involved – Ask the audience!
Estimators and schedulers: do you use three-point estimating?
Risk practitioners: how thorough is risk identification
Do you or your projects use Monte Carlo sampling? Ask the audience!
Do project managers use qualitative and / or quantitative risk analysis?

Copyright @ 2011. All rights reserved
Thank you
+447879423242