session 97 lecture: ortho clinical path for lower back pain - soa.org · • case study. section 1:...
TRANSCRIPT
Session 97L, Ortho Clinical Path for Lower Back Pain- An Analysis
Moderator/Presenter:
Kevin Sigman, FSA, MAAA
Presenters: Eli Greenberg, ASA, MAAA
SOA Antitrust Disclaimer SOA Presentation Disclaimer

2018 SOA Health MeetingELI GREENBERG, ASA, MAAA097- Ortho Clinical Path for Lower Back PainJune 26, 2018
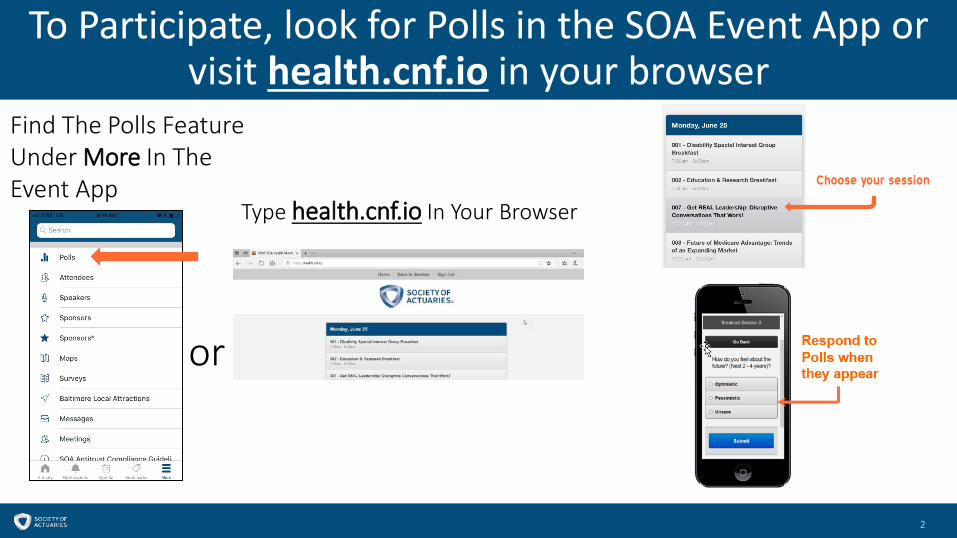
To Participate, look for Polls in the SOA Event App or visit health.cnf.io in your browser
2
Type health.cnf.io In Your Browser
or
Find The Polls Feature Under More In The Event App Choose your session

Seinfeld Video
3
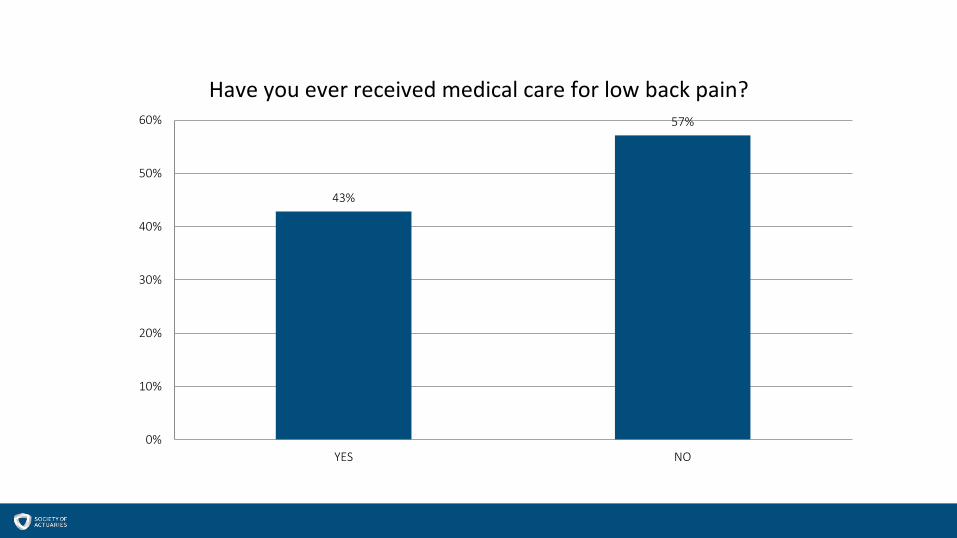
43%
57%
0%
10%
20%
30%
40%
50%
60%
YES NO
Have you ever received medical care for low back pain?
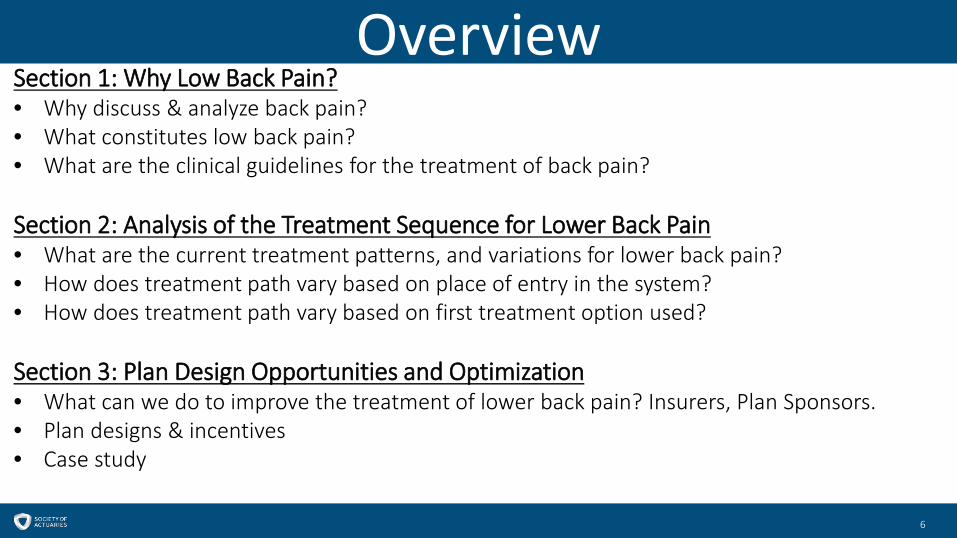
Overview
6
Section 1: Why Low Back Pain?• Why discuss & analyze back pain?• What constitutes low back pain? • What are the clinical guidelines for the treatment of back pain?
Section 2: Analysis of the Treatment Sequence for Lower Back Pain• What are the current treatment patterns, and variations for lower back pain?• How does treatment path vary based on place of entry in the system? • How does treatment path vary based on first treatment option used?
Section 3: Plan Design Opportunities and Optimization• What can we do to improve the treatment of lower back pain? Insurers, Plan Sponsors. • Plan designs & incentives• Case study
Section 1: Why Low Back Pain?- Why discuss & analyze back pain?- What constitutes low back pain? - What are the clinical guidelines for the treatment of back pain?
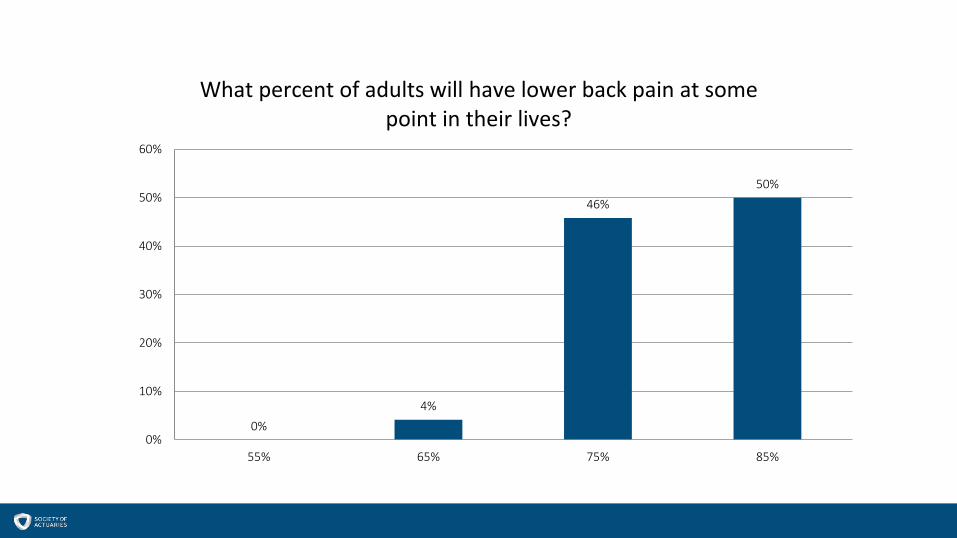
0%4%
46%50%
0%
10%
20%
30%
40%
50%
60%
55% 65% 75% 85%
What percent of adults will have lower back pain at some point in their lives?
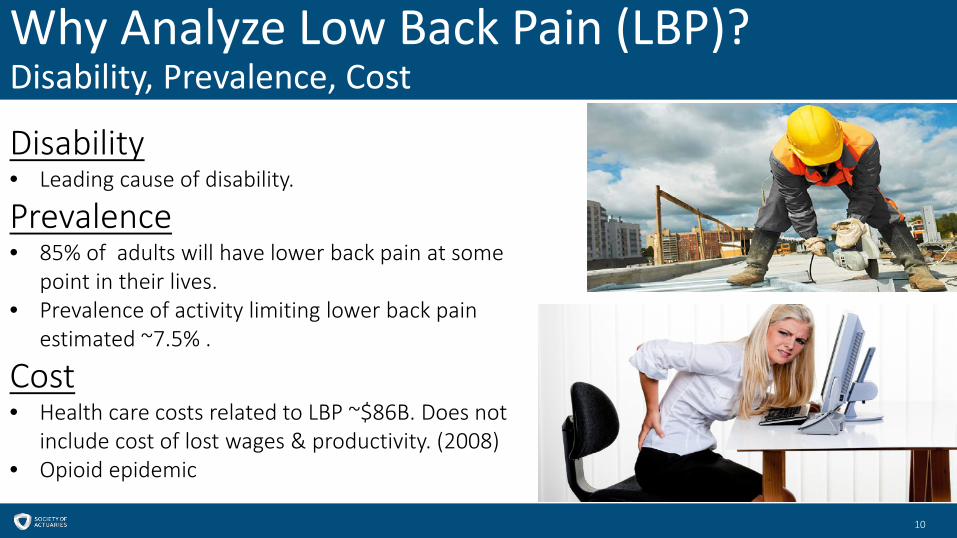
Why Analyze Low Back Pain (LBP)?Disability, Prevalence, Cost
10
Disability• Leading cause of disability.
Prevalence• 85% of adults will have lower back pain at some
point in their lives.• Prevalence of activity limiting lower back pain
estimated ~7.5% .
Cost• Health care costs related to LBP ~$86B. Does not
include cost of lost wages & productivity. (2008)• Opioid epidemic
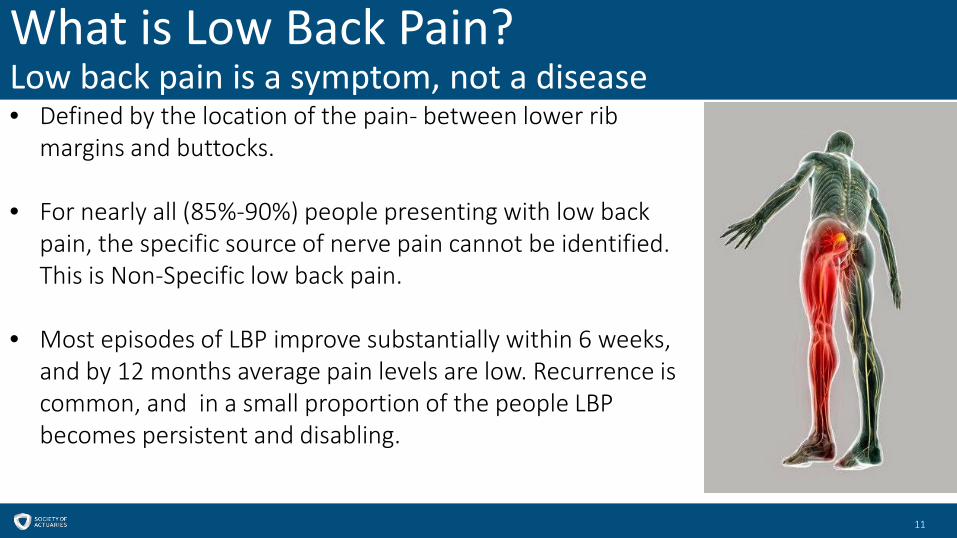
What is Low Back Pain?Low back pain is a symptom, not a disease
11
• Defined by the location of the pain- between lower rib margins and buttocks.
• For nearly all (85%-90%) people presenting with low back pain, the specific source of nerve pain cannot be identified. This is Non-Specific low back pain.
• Most episodes of LBP improve substantially within 6 weeks, and by 12 months average pain levels are low. Recurrence is common, and in a small proportion of the people LBP becomes persistent and disabling.

Radicular Pain (Radiculopathy)People w/ LBP & radicular pain are more severely affected, have worse outcomes
12
Radicular Pain occurs when there is nerve-root involvement.
Symptoms:• Straight leg raise test- negative. • Leg pain worse than back pain• Worsening of pain during coughing, sneezing, or
straining.• Weakness, loss of sensation.• Loss of reflexes associated with a particular nerve
root.
Normal Disk
Vertebral Body
Herniated Disk
Sacrum
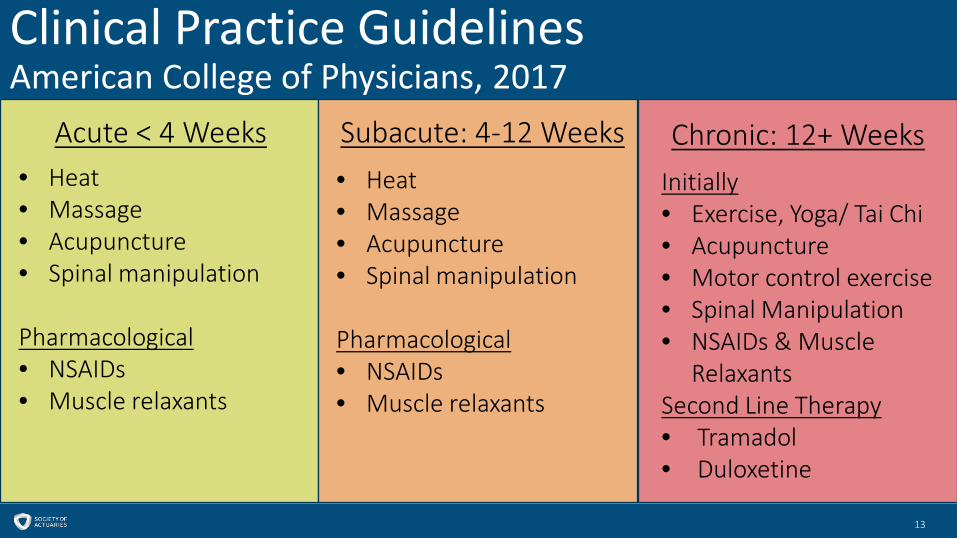
Clinical Practice GuidelinesAmerican College of Physicians, 2017
13
Acute < 4 Weeks Subacute: 4-12 Weeks Chronic: 12+ Weeks• Heat• Massage• Acupuncture• Spinal manipulation
Pharmacological• NSAIDs• Muscle relaxants
• Heat• Massage• Acupuncture• Spinal manipulation
Pharmacological• NSAIDs• Muscle relaxants
Initially• Exercise, Yoga/ Tai Chi• Acupuncture• Motor control exercise• Spinal Manipulation• NSAIDs & Muscle
RelaxantsSecond Line Therapy• Tramadol• Duloxetine
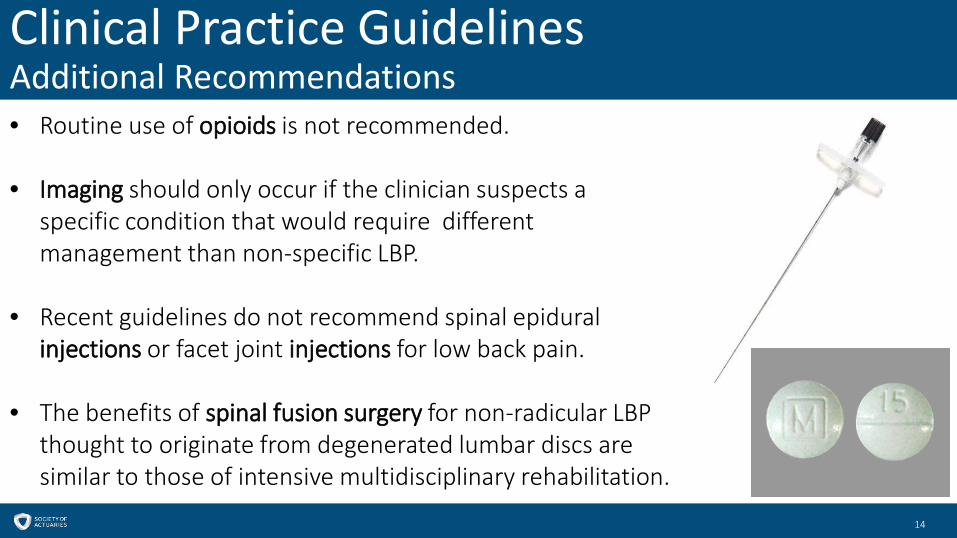
Clinical Practice GuidelinesAdditional Recommendations
14
• Routine use of opioids is not recommended.
• Imaging should only occur if the clinician suspects a specific condition that would require different management than non-specific LBP.
• Recent guidelines do not recommend spinal epidural injections or facet joint injections for low back pain.
• The benefits of spinal fusion surgery for non-radicular LBP thought to originate from degenerated lumbar discs are similar to those of intensive multidisciplinary rehabilitation.
Section 2: Analysis of the Treatment Sequence for Lower Back Pain
- What are the treatment patterns, and variations for lower back pain?- How does treatment path vary based on place of entry in the system? - How does treatment path vary based on first treatment option used?

Analysis Parameters: Ortho Clinical Path-LBPAnalyzing the first occurrence of lower back pain
16
Data• 30 large ASO employers ~1.3M members • Cohort of 57,217 adults age 18-65, continuously enrolled
over a 4 year period, who did not have a diagnosis for lower back pain in year 1, but then had a diagnosis for lower back pain in year 2.
• Excludes cancer, fractures, osteoporosis, tuberculosis.
Incidence• 3.6% is incidence for first occurrence of back pain• Surgery rate of 2.9% among LBP cohort.
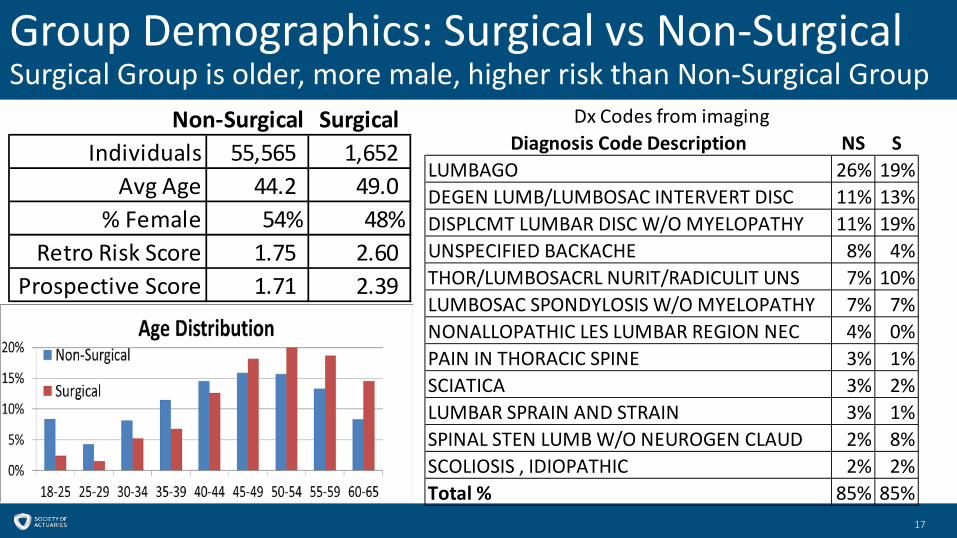
Group Demographics: Surgical vs Non-SurgicalSurgical Group is older, more male, higher risk than Non-Surgical Group
17
Non-Surgical SurgicalIndividuals 55,565 1,652
Avg Age 44.2 49.0 % Female 54% 48%
Retro Risk Score 1.75 2.60 Prospective Score 1.71 2.39
Diagnosis Code Description NS SLUMBAGO 26% 19%DEGEN LUMB/LUMBOSAC INTERVERT DISC 11% 13%DISPLCMT LUMBAR DISC W/O MYELOPATHY 11% 19%UNSPECIFIED BACKACHE 8% 4%THOR/LUMBOSACRL NURIT/RADICULIT UNS 7% 10%LUMBOSAC SPONDYLOSIS W/O MYELOPATHY 7% 7%NONALLOPATHIC LES LUMBAR REGION NEC 4% 0%PAIN IN THORACIC SPINE 3% 1%SCIATICA 3% 2%LUMBAR SPRAIN AND STRAIN 3% 1%SPINAL STEN LUMB W/O NEUROGEN CLAUD 2% 8%SCOLIOSIS , IDIOPATHIC 2% 2%Total % 85% 85%
Dx Codes from imaging
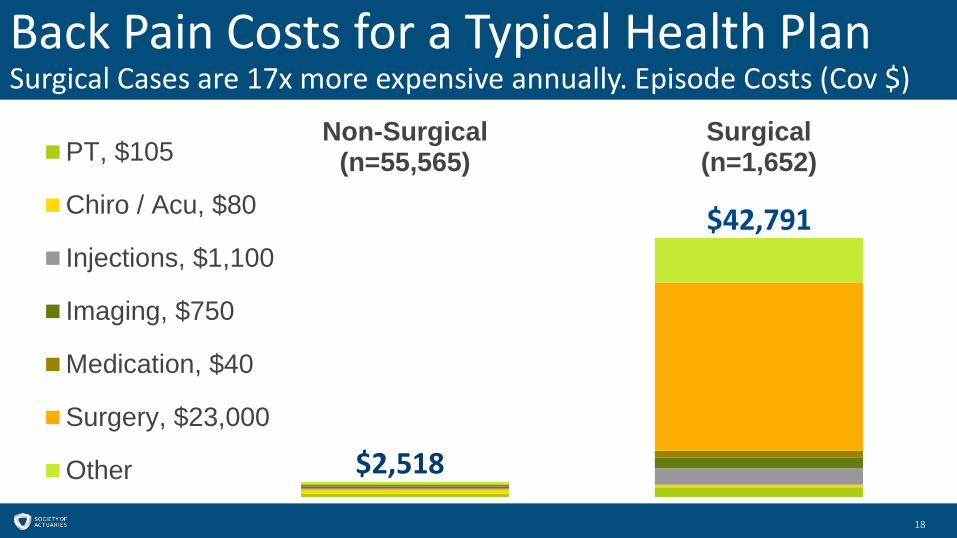
Back Pain Costs for a Typical Health PlanSurgical Cases are 17x more expensive annually. Episode Costs (Cov $)
18
Non-Surgical(n=55,565)
Surgical(n=1,652)PT, $105
Chiro / Acu, $80
Injections, $1,100
Imaging, $750
Medication, $40
Surgery, $23,000
Other
$42,791
$2,518
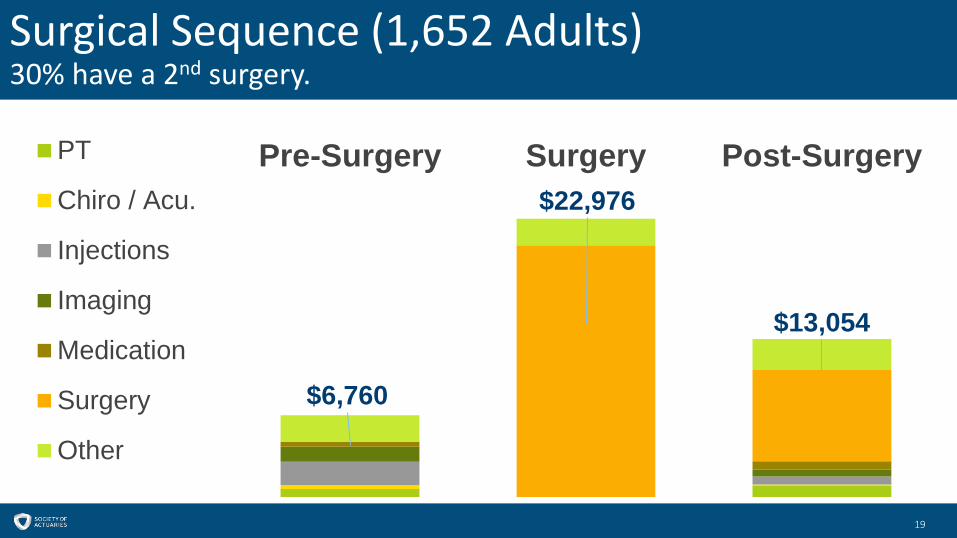
Surgical Sequence (1,652 Adults)30% have a 2nd surgery.
19
$6,760
$22,976
$13,054
Pre-Surgery Surgery Post-SurgeryPT
Chiro / Acu.
Injections
Imaging
Medication
Surgery
Other
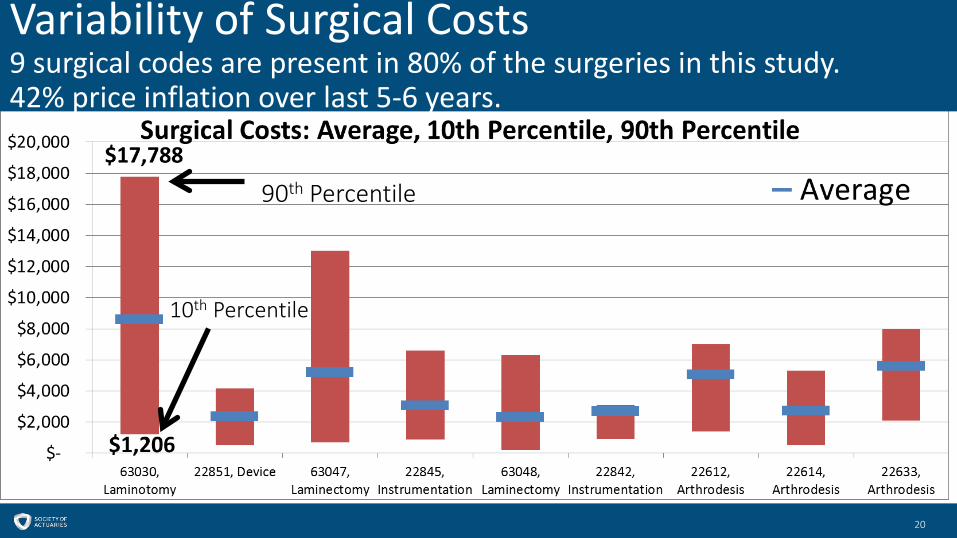
Variability of Surgical Costs9 surgical codes are present in 80% of the surgeries in this study. 42% price inflation over last 5-6 years.
20
90th Percentile
10th Percentile
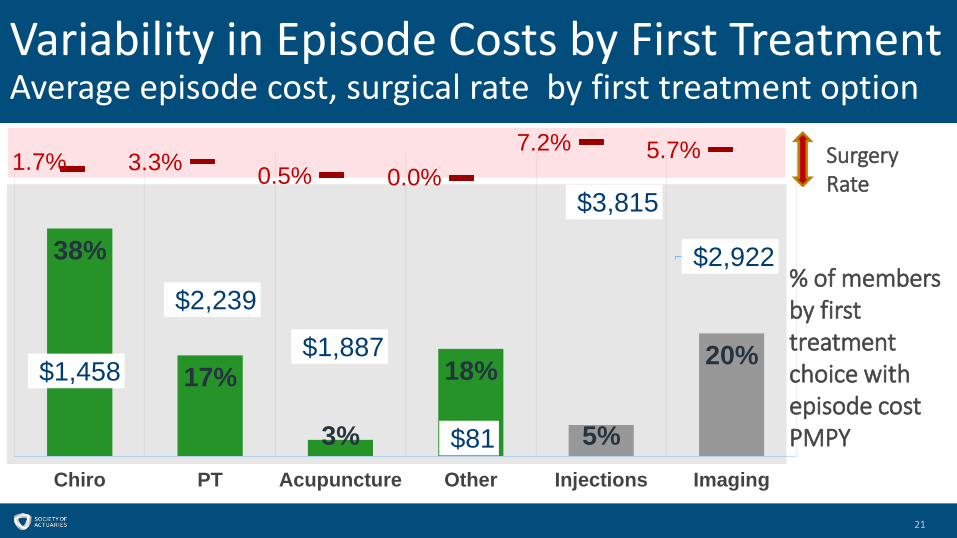
Variability in Episode Costs by First TreatmentAverage episode cost, surgical rate by first treatment option
21
38%
17%
3%
18%
5%
20%
Chiro PT Acupuncture Other Injections Imaging
% of members by first treatment choice with episode cost PMPY
$1,458
$2,239
$1,887
$81
$3,815
$2,922
1.7% 3.3% 0.5% 0.0%7.2% 5.7% Surgery
Rate

Variability in Outcomes by First TreatmentDoing Chiro as first treatment option is optimal Injections or Imaging increase surgical probability by 3-5X
22
38%
17% 3% 18% 5%20%
Chiro PT Acupuncture Other Injections Imaging
34% 37%13% 0%
49% 100%
40% 52% 29% 8%64% 53%
1.7% 3.3% 0.5% 0.0%7.2% 5.7%
9%20%
5% 0%20%100%
Imaging
Opioids
Injections
Surgery
% of members by first treatment choice
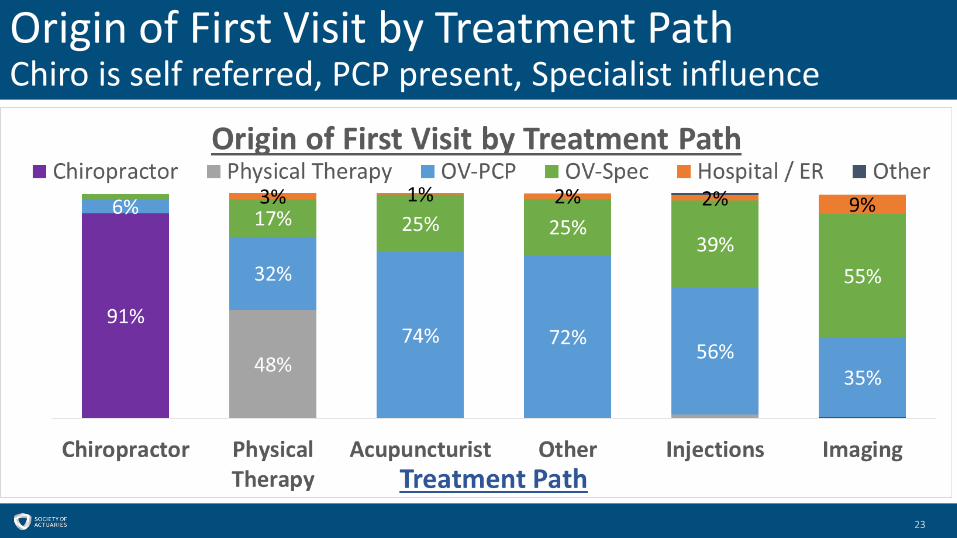
Origin of First Visit by Treatment PathChiro is self referred, PCP present, Specialist influence
23

Pace of treatment-First 2 Weeks After DiagnosisMore Chiro for Non-Surgical Group, less injections, imaging, specialists.Services are consumed quickly
24
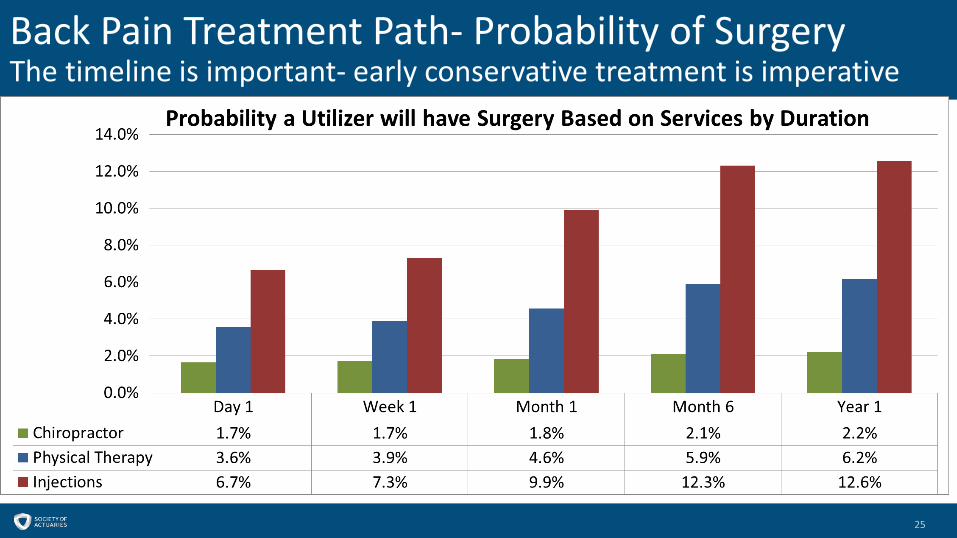
Back Pain Treatment Path- Probability of SurgeryThe timeline is important- early conservative treatment is imperative
25
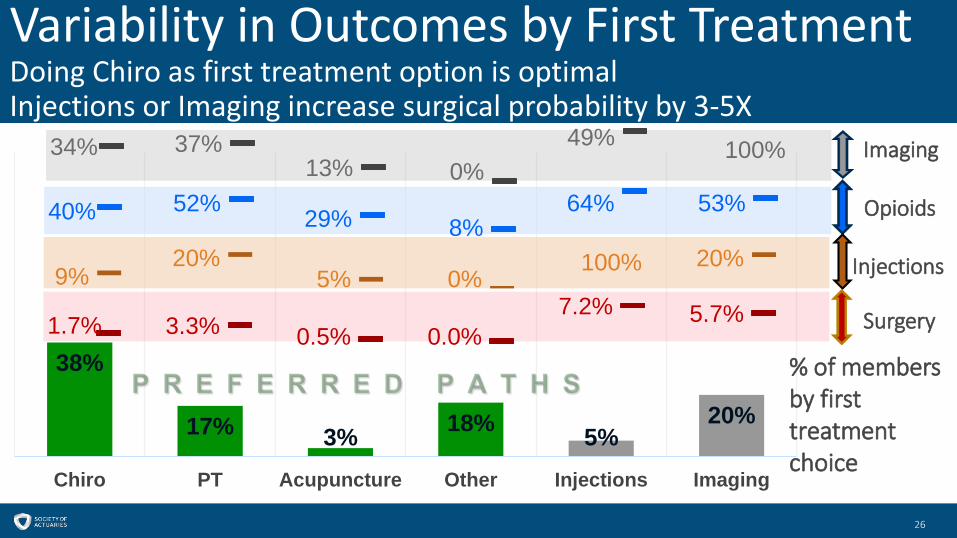
Variability in Outcomes by First TreatmentDoing Chiro as first treatment option is optimal Injections or Imaging increase surgical probability by 3-5X
26
38%
17% 3% 18% 5%20%
Chiro PT Acupuncture Other Injections Imaging
34% 37%13% 0%
49% 100%
40% 52% 29% 8%64% 53%
1.7% 3.3% 0.5% 0.0%7.2% 5.7%
9%20%
5% 0%20%100%
Imaging
Opioids
Injections
Surgery
% of members by first treatment choice
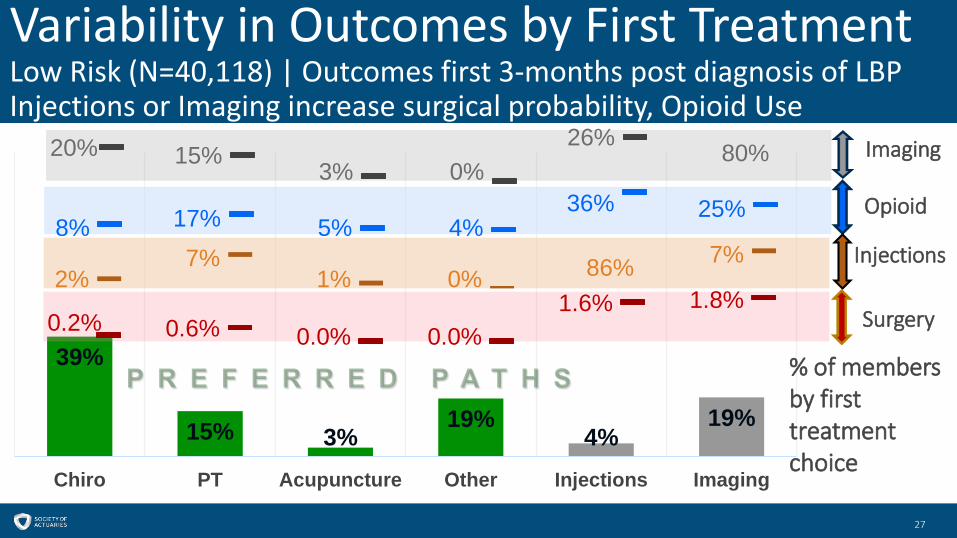
Variability in Outcomes by First TreatmentLow Risk (N=40,118) | Outcomes first 3-months post diagnosis of LBPInjections or Imaging increase surgical probability, Opioid Use
27
39%
15% 3%19%
4%19%
Chiro PT Acupuncture Other Injections Imaging
20% 15% 3% 0%26%
8% 17% 5% 4%36% 25%
0.2% 0.6% 0.0% 0.0%1.6% 1.8%
2%7%
1% 0%7%86%
Imaging
Opioid
Injections
Surgery
80%
% of members by first treatment choice
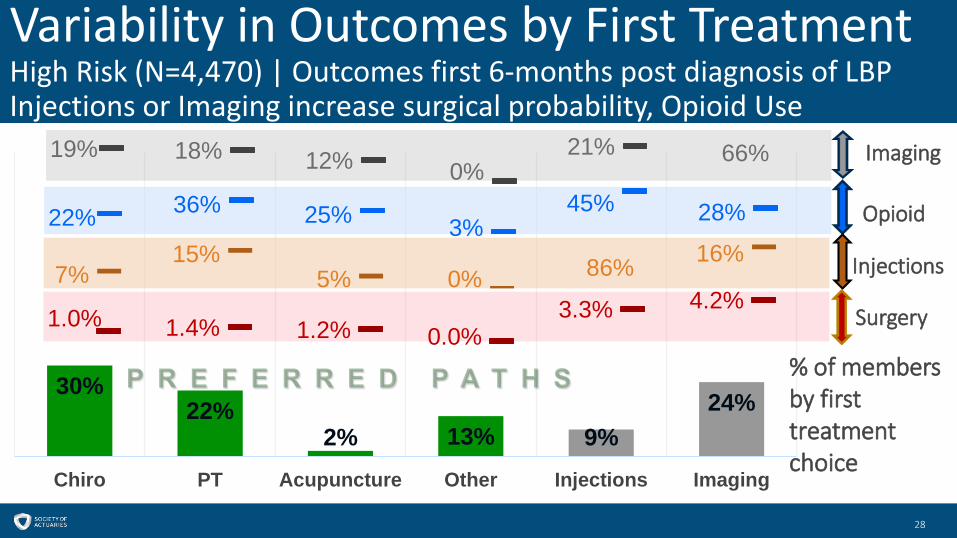
Variability in Outcomes by First TreatmentHigh Risk (N=4,470) | Outcomes first 6-months post diagnosis of LBPInjections or Imaging increase surgical probability, Opioid Use
28
30%22%
2% 13% 9%24%
Chiro PT Acupuncture Other Injections Imaging
19% 18% 12% 0%21%
22% 36% 25% 3%45% 28%
1.0% 1.4% 1.2% 0.0%3.3% 4.2%
7%15%
5% 0%16%86%
Imaging
Opioid
Injections
Surgery
66%
% of members by first treatment choice
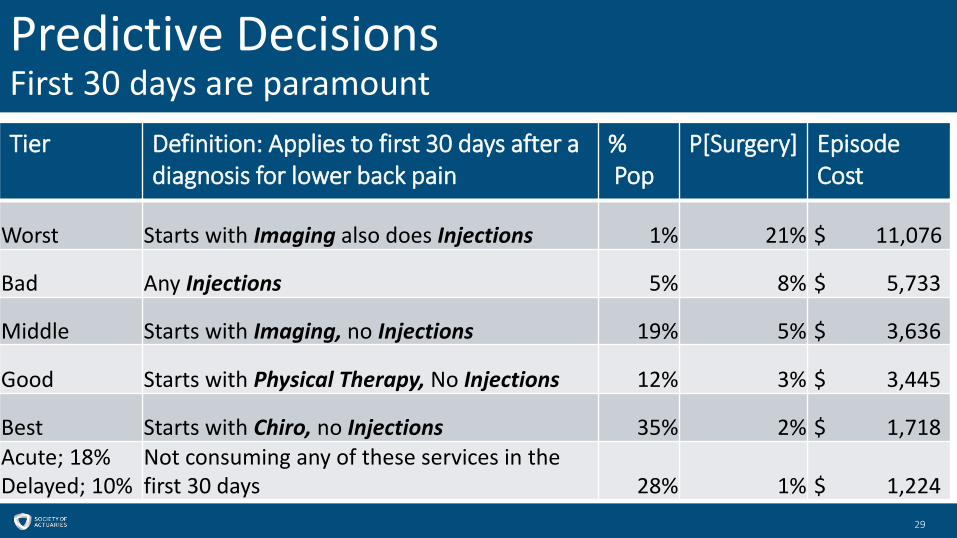
Predictive DecisionsFirst 30 days are paramount
29
Tier Definition: Applies to first 30 days after a diagnosis for lower back pain
%Pop
P[Surgery] Episode Cost
Worst Starts with Imaging also does Injections 1% 21% $ 11,076
Bad Any Injections 5% 8% $ 5,733
Middle Starts with Imaging, no Injections 19% 5% $ 3,636
Good Starts with Physical Therapy, No Injections 12% 3% $ 3,445
Best Starts with Chiro, no Injections 35% 2% $ 1,718 Acute; 18%Delayed; 10%
Not consuming any of these services in the first 30 days 28% 1% $ 1,224
Analysis Conclusions
30
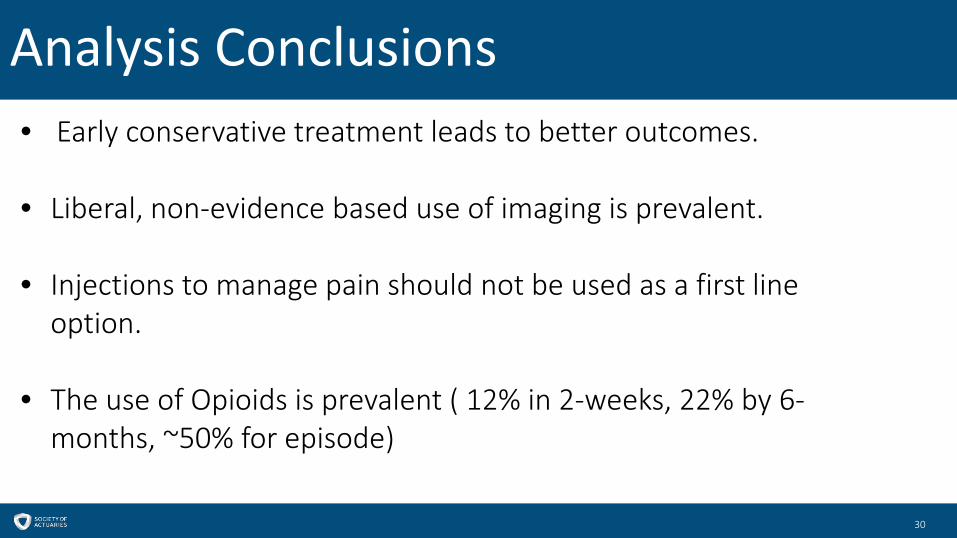
• Early conservative treatment leads to better outcomes.
• Liberal, non-evidence based use of imaging is prevalent.
• Injections to manage pain should not be used as a first line option.
• The use of Opioids is prevalent ( 12% in 2-weeks, 22% by 6-months, ~50% for episode)
Section 3: Plan Design Opportunities and Optimization
- What can we do to improve the treatment of lower back pain?- Plan designs & incentives- Case study
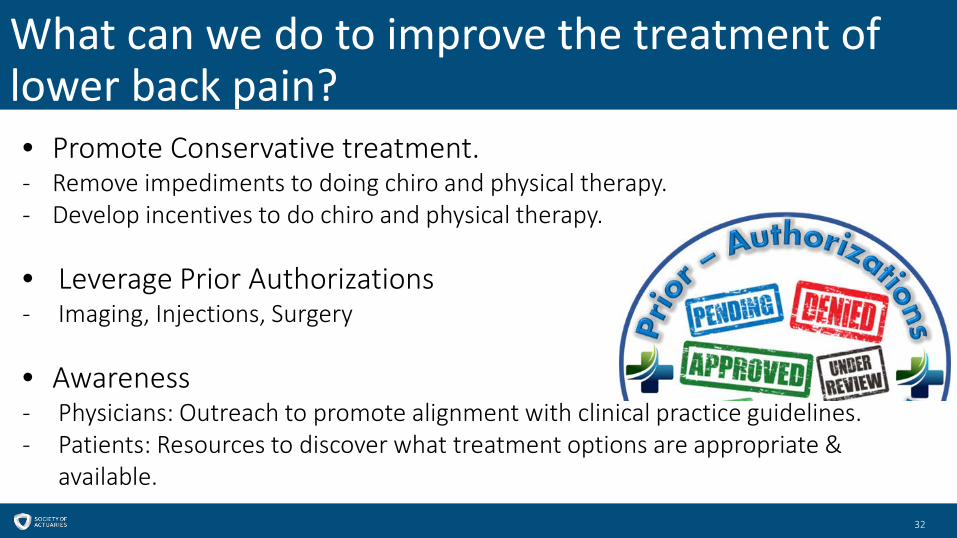
What can we do to improve the treatment of lower back pain?
32
• Promote Conservative treatment.- Remove impediments to doing chiro and physical therapy. - Develop incentives to do chiro and physical therapy.
• Leverage Prior Authorizations- Imaging, Injections, Surgery
• Awareness- Physicians: Outreach to promote alignment with clinical practice guidelines.- Patients: Resources to discover what treatment options are appropriate &
available.
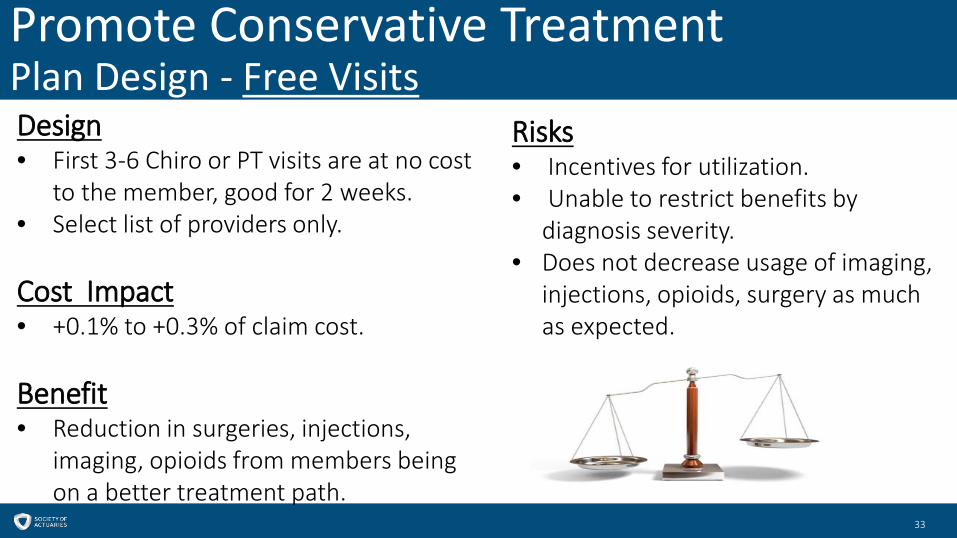
Promote Conservative TreatmentPlan Design - Free Visits
33
Design• First 3-6 Chiro or PT visits are at no cost
to the member, good for 2 weeks. • Select list of providers only.
Cost Impact • +0.1% to +0.3% of claim cost.
Benefit • Reduction in surgeries, injections,
imaging, opioids from members being on a better treatment path.
Risks• Incentives for utilization.• Unable to restrict benefits by
diagnosis severity.• Does not decrease usage of imaging,
injections, opioids, surgery as much as expected.
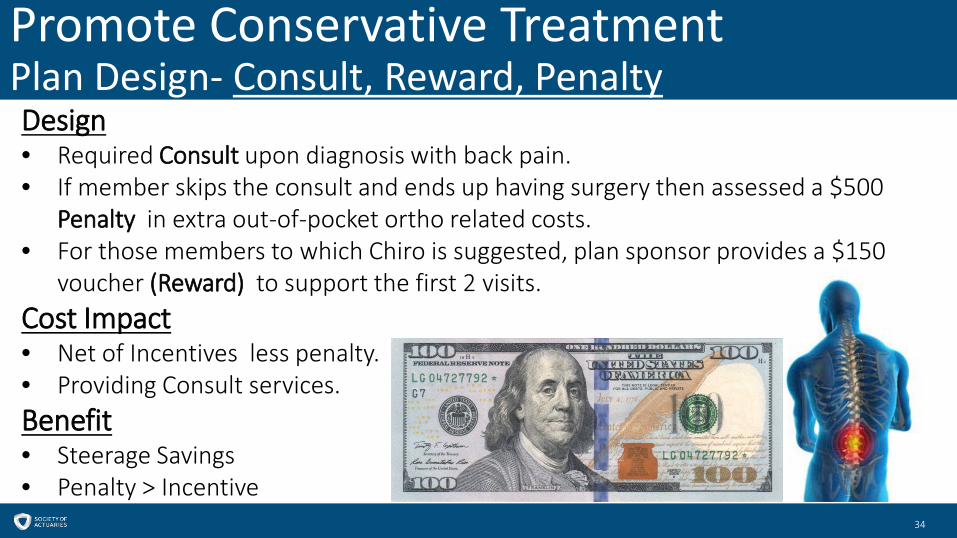
Promote Conservative TreatmentPlan Design- Consult, Reward, Penalty
34
Design• Required Consult upon diagnosis with back pain.• If member skips the consult and ends up having surgery then assessed a $500
Penalty in extra out-of-pocket ortho related costs. • For those members to which Chiro is suggested, plan sponsor provides a $150
voucher (Reward) to support the first 2 visits. Cost Impact• Net of Incentives less penalty. • Providing Consult services.Benefit • Steerage Savings• Penalty > Incentive
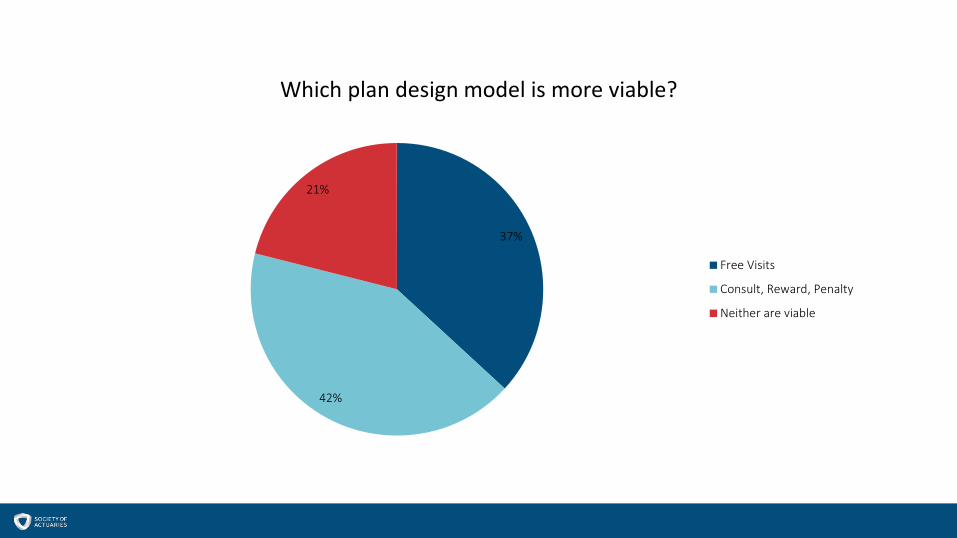
37%
42%
21%
Which plan design model is more viable?
Free Visits
Consult, Reward, Penalty
Neither are viable

Which incentive plan design is better?Free Visits vs. Consult, Reward, Penalty
37
Free VisitsSteerage Plan Cost
33% $0.4250% $0.4675% $0.52
Consult, Reward, PenaltySteerage Plan Cost
33% $0.1650% $0.2675% $0.42
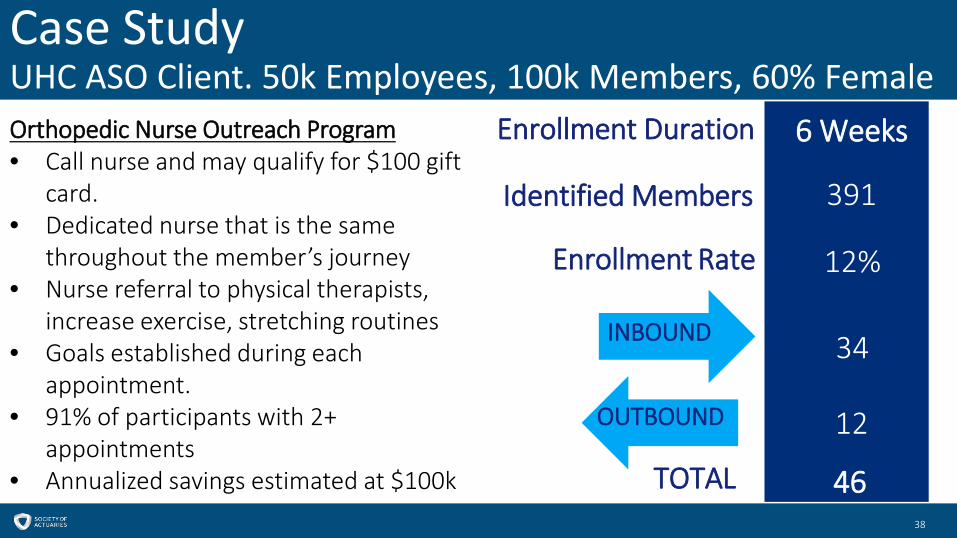
Case StudyUHC ASO Client. 50k Employees, 100k Members, 60% Female
38
Orthopedic Nurse Outreach Program• Call nurse and may qualify for $100 gift
card. • Dedicated nurse that is the same
throughout the member’s journey• Nurse referral to physical therapists,
increase exercise, stretching routines• Goals established during each
appointment.• 91% of participants with 2+
appointments• Annualized savings estimated at $100k
34
12
12%
6 Weeks
Identified Members 391
46
Enrollment Rate
INBOUND
TOTAL
Enrollment Duration
OUTBOUND
Summary
39
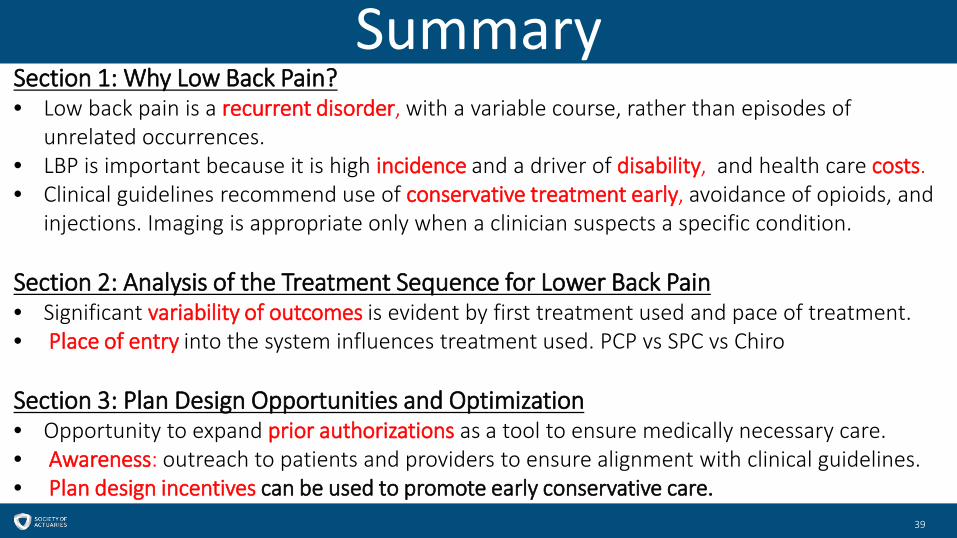
Section 1: Why Low Back Pain?• Low back pain is a recurrent disorder, with a variable course, rather than episodes of
unrelated occurrences. • LBP is important because it is high incidence and a driver of disability, and health care costs. • Clinical guidelines recommend use of conservative treatment early, avoidance of opioids, and
injections. Imaging is appropriate only when a clinician suspects a specific condition.
Section 2: Analysis of the Treatment Sequence for Lower Back Pain• Significant variability of outcomes is evident by first treatment used and pace of treatment. • Place of entry into the system influences treatment used. PCP vs SPC vs Chiro
Section 3: Plan Design Opportunities and Optimization• Opportunity to expand prior authorizations as a tool to ensure medically necessary care.• Awareness: outreach to patients and providers to ensure alignment with clinical guidelines.• Plan design incentives can be used to promote early conservative care.


Appendix

CitationsThe Lancet- Series on low back pain, Annals of Internal Medicine
42
1. Buchbinder R, van Tulder M, Oberg B, et al. Low back pain: a call for action. Lancet (London, England). 2018;391(10137):2384-2388.2. Chou R, Deyo R, Friedly J, et al. Nonpharmacologic Therapies for Low Back Pain: A Systematic Review for an American College of Physicians Clinical Practice Guideline. Annals of internal medicine. 2017;166(7):493-505.3. Deyo RA. The Role of Spinal Manipulation in the Treatment of Low Back Pain. Jama. 2017;317(14):1418-1419.4. Foster NE, Anema JR, Cherkin D, et al. Prevention and treatment of low back pain: evidence, challenges, and promising directions. The Lancet. 2018;391(10137):2368-2383.5. Hartvigsen J, Hancock MJ, Kongsted A, et al. What low back pain is and why we need to pay attention. The Lancet. 2018;391(10137):2356-2367.6. Kosloff TM, Elton D, Shulman SA, Clarke JL, Skoufalos A, Solis A. Conservative spine care: opportunities to improve the quality and value of care. Population health management. 2013;16(6):390-396.7. Vijan S, Manaker S, Qaseem A. Noninvasive Treatments for Acute, Subacute, and Chronic Low Back Pain. Annals of internal medicine. 2017;167(11):835-836.
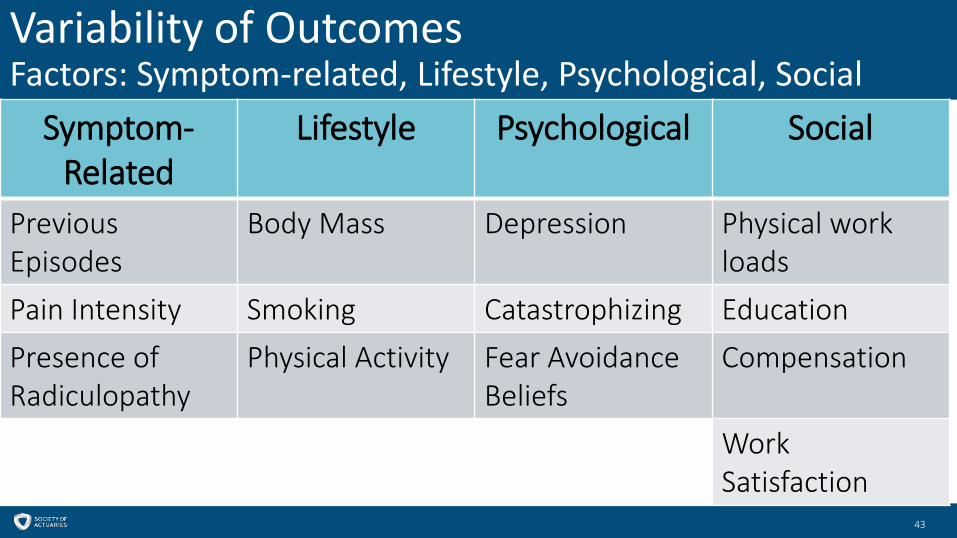
Variability of OutcomesFactors: Symptom-related, Lifestyle, Psychological, Social
43
Symptom-Related
Lifestyle Psychological Social
Previous Episodes
Body Mass Depression Physical work loads
Pain Intensity Smoking Catastrophizing EducationPresence of Radiculopathy
Physical Activity Fear Avoidance Beliefs
Compensation
Work Satisfaction
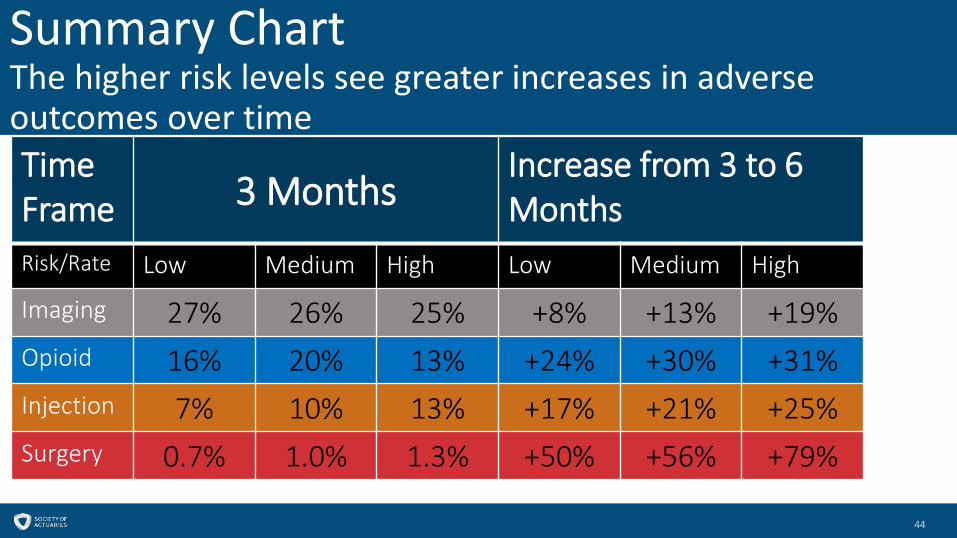
Summary ChartThe higher risk levels see greater increases in adverse outcomes over time
44
Time Frame 3 Months
Increase from 3 to 6 Months
Risk/Rate Low Medium High Low Medium High
Imaging 27% 26% 25% +8% +13% +19%Opioid 16% 20% 13% +24% +30% +31%Injection 7% 10% 13% +17% +21% +25%Surgery 0.7% 1.0% 1.3% +50% +56% +79%