session 46 panel discussion, mortality table update … 46 pd, mortality table update on the 2015...
TRANSCRIPT
Session 46 PD, Mortality Table Update on the 2015 VBT/CSO
Moderator:
Mary J. Bahna‐Nolan, FSA, CERA, MAAA
Presenters: Mary J. Bahna‐Nolan, FSA, CERA, MAAA Dieter S. Gaubatz, FSA, FCIA, MAAA
Copyright © 2015 by the American Academy of Actuaries. All Rights Reserved.Copyright © 2015 by the Society of Actuaries. All Rights Reserved.
Joint American Academy of Actuaries Life Experience Committee and Society of Actuaries Preferred Mortality Oversight Group
Session 46, SOA Annual MeetingOctober 12, 2015
Austin, Texas
Mortality Table Update on the 2015 VBT/CSO
Copyright © 2015 by the American Academy of Actuaries. All Rights Reserved.Copyright © 2015 by the Society of Actuaries. All Rights Reserved. 2
Agenda & Presenters
AgendaMary J. Bahna-Nolan, FSA, MAAA, CERAChair, Joint American Academy of Actuaries
Life Experience Committee and Society of Actuaries Preferred Mortality Oversight Group
Dieter Gaubatz, FSA, FCIA, MAAAChair, Underwriting Criteria Team
Presenters
2015 VBT 2015 VBT Relative Risk
Tables 2017 CSO 2017 CSO Preferred Structure
Tables Underwriting Criteria Scoring
Tool (UCS)
Copyright © 2015 by the American Academy of Actuaries. All Rights Reserved.Copyright © 2015 by the Society of Actuaries. All Rights Reserved. 3
Mortality Development
Significant work completed to develop various mortality tables and margins to support PBR and new valuation table
Series of presentations on the various table development and impacts from prior tables via NAIC National Meetings and can be found on NAIC website VBT: Summer and Fall 2014 meetings CSO: Fall 2014 and Spring 2015 meetings UCS: Conference calls Summer 2015
Copyright © 2015 by the American Academy of Actuaries. All Rights Reserved.Copyright © 2015 by the Society of Actuaries. All Rights Reserved. 4
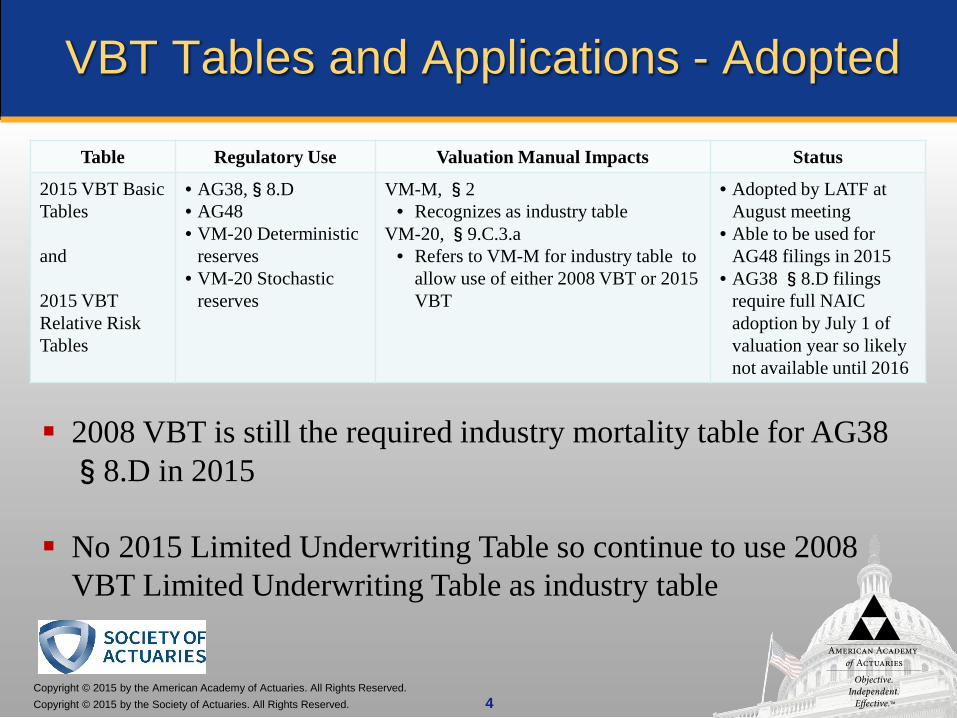
VBT Tables and Applications - Adopted
Table Regulatory Use Valuation Manual Impacts Status
2015 VBT BasicTables
and
2015 VBT Relative Risk Tables
• AG38,§8.D• AG48• VM-20 Deterministic
reserves• VM-20 Stochastic
reserves
VM-M, §2• Recognizes as industry table
VM-20, §9.C.3.a• Refers to VM-M for industry table to
allow use of either 2008 VBT or 2015 VBT
• Adopted by LATF at August meeting
• Able to be used for AG48 filings in 2015
• AG38 §8.D filings require full NAIC adoption by July 1 of valuation year so likely not available until 2016
2008 VBT is still the required industry mortality table for AG38 §8.D in 2015
No 2015 Limited Underwriting Table so continue to use 2008 VBT Limited Underwriting Table as industry table

Copyright © 2015 by the American Academy of Actuaries. All Rights Reserved.Copyright © 2015 by the Society of Actuaries. All Rights Reserved.
2015 VBT DevelopmentMary Bahna-Nolan
Copyright © 2015 by the American Academy of Actuaries. All Rights Reserved.Copyright © 2015 by the Society of Actuaries. All Rights Reserved. 6
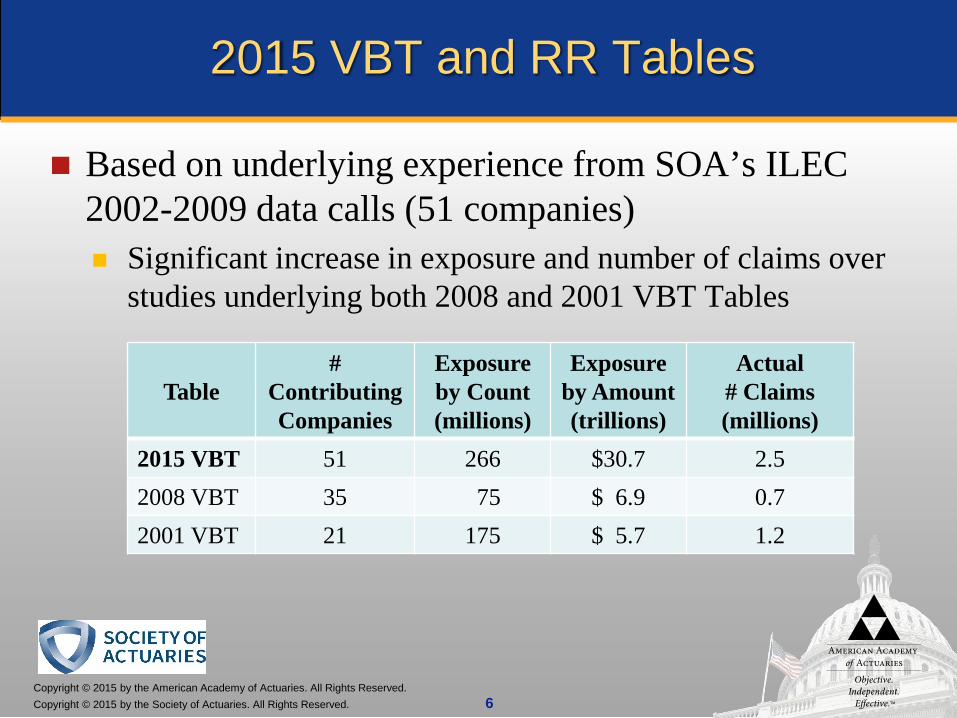
2015 VBT and RR Tables
Based on underlying experience from SOA’s ILEC 2002-2009 data calls (51 companies) Significant increase in exposure and number of claims over
studies underlying both 2008 and 2001 VBT Tables
Table#
Contributing Companies
Exposure by Count(millions)
Exposure by Amount(trillions)
Actual# Claims(millions)
2015 VBT 51 266 $30.7 2.52008 VBT 35 75 $ 6.9 0.72001 VBT 21 175 $ 5.7 1.2
Copyright © 2015 by the American Academy of Actuaries. All Rights Reserved.Copyright © 2015 by the Society of Actuaries. All Rights Reserved. 7
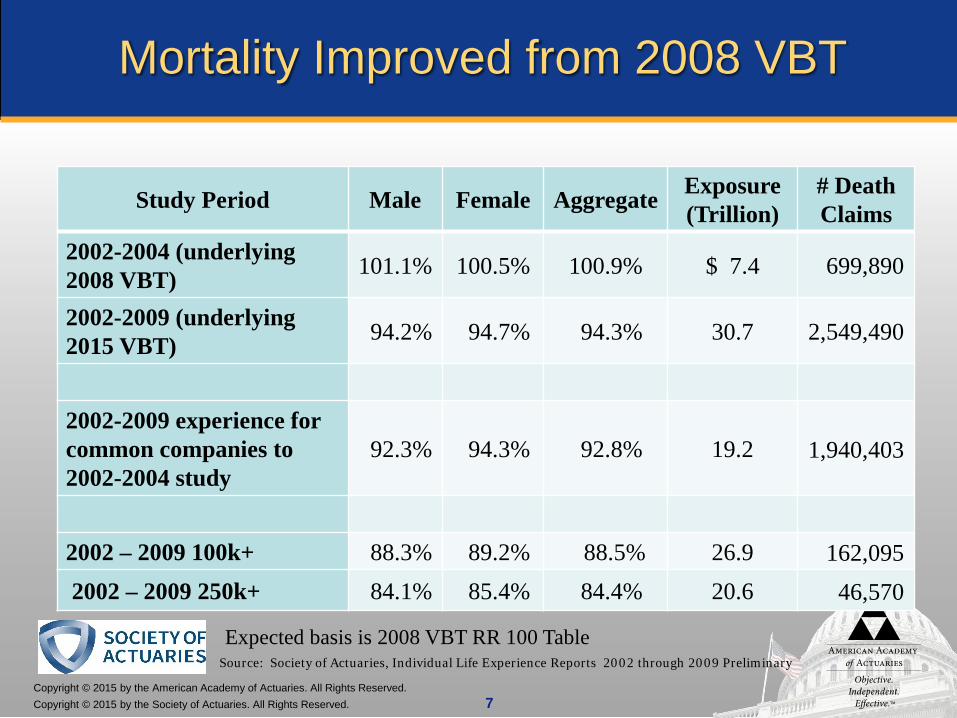
Mortality Improved from 2008 VBT
Study Period Male Female Aggregate Exposure(Trillion)
# Death Claims
2002-2004 (underlying 2008 VBT) 101.1% 100.5% 100.9% $ 7.4 699,890
2002-2009 (underlying2015 VBT) 94.2% 94.7% 94.3% 30.7 2,549,490
2002-2009 experience for common companies to 2002-2004 study
92.3% 94.3% 92.8% 19.2 1,940,403
2002 – 2009 100k+ 88.3% 89.2% 88.5% 26.9 162,0952002 – 2009 250k+ 84.1% 85.4% 84.4% 20.6 46,570
Expected basis is 2008 VBT RR 100 TableSource: Society of Actuaries, Individual Life Experience Reports 2002 through 2009 Preliminary
Copyright © 2015 by the American Academy of Actuaries. All Rights Reserved.Copyright © 2015 by the Society of Actuaries. All Rights Reserved. 8
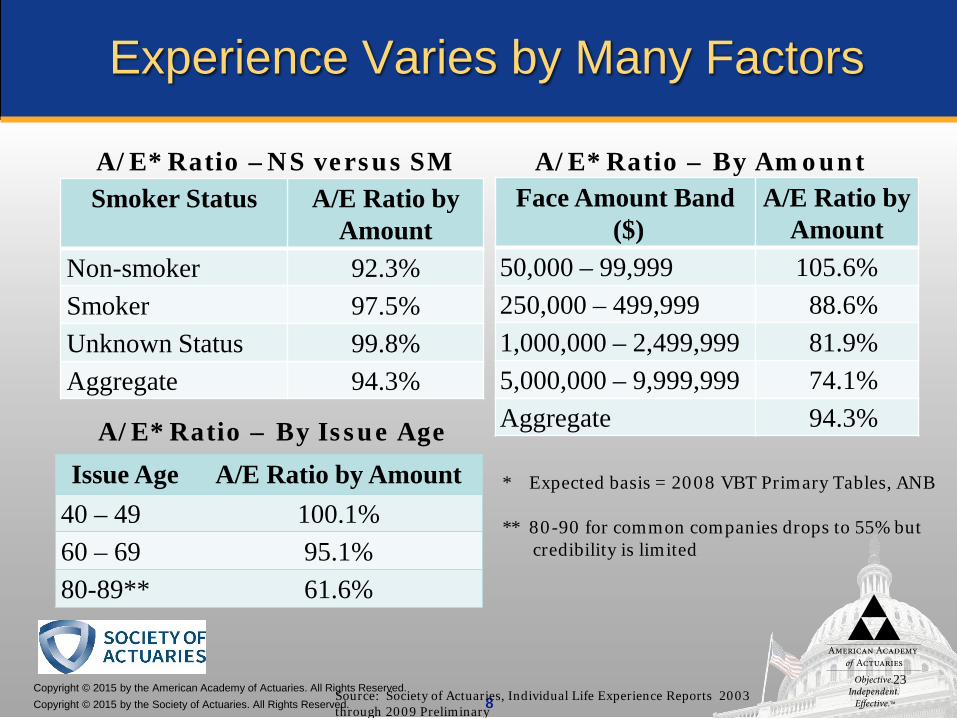
Experience Varies by Many Factors
Smoker Status A/E Ratio by Amount
Non-smoker 92.3%Smoker 97.5%Unknown Status 99.8%Aggregate 94.3%
Face Amount Band($)
A/E Ratio by Amount
50,000 – 99,999 105.6%250,000 – 499,999 88.6%1,000,000 – 2,499,999 81.9%5,000,000 – 9,999,999 74.1%Aggregate 94.3%
23
A/E* Ratio –NS versus SM
A/E* Ratio – By Issue AgeIssue Age A/E Ratio by Amount
40 – 49 100.1%60 – 69 95.1%80-89** 61.6%
* Expected basis = 2008 VBT Primary Tables, ANB
** 80-90 for common companies drops to 55% but credibility is limited
Source: Society of Actuaries, Individual Life Experience Reports 2003 through 2009 Preliminary
A/E* Ratio – By Amount
Copyright © 2015 by the American Academy of Actuaries. All Rights Reserved.Copyright © 2015 by the Society of Actuaries. All Rights Reserved. 9
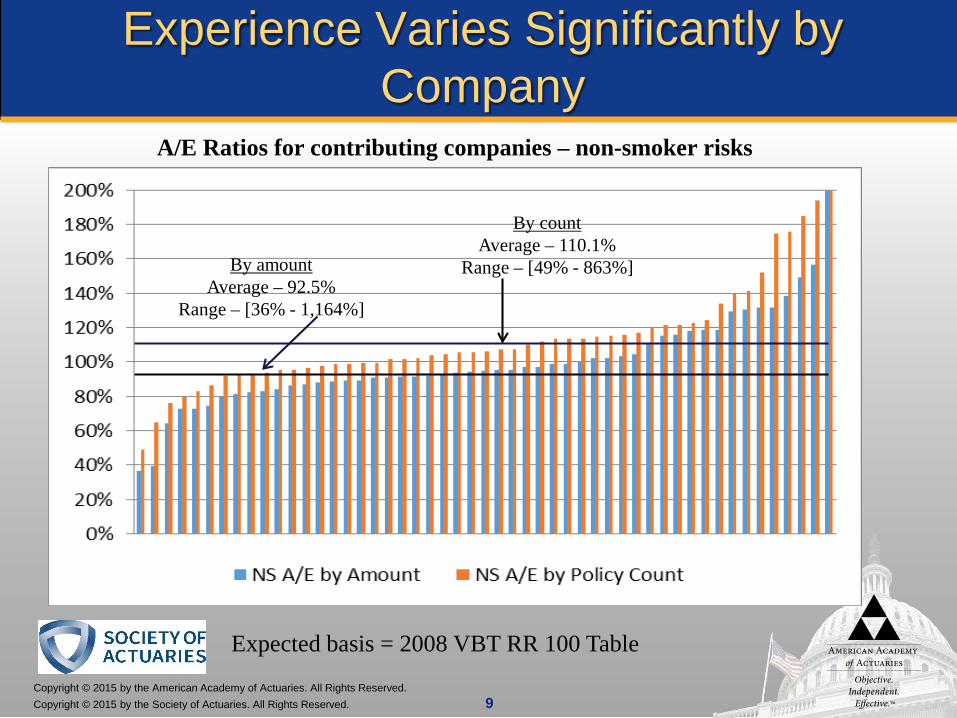
Experience Varies Significantly by Company
A/E Ratios for contributing companies – non-smoker risks
Expected basis = 2008 VBT RR 100 Table
By amount Average – 92.5%
Range – [36% - 1,164%]
By count Average – 110.1%
Range – [49% - 863%]
Copyright © 2015 by the American Academy of Actuaries. All Rights Reserved.Copyright © 2015 by the Society of Actuaries. All Rights Reserved. 10
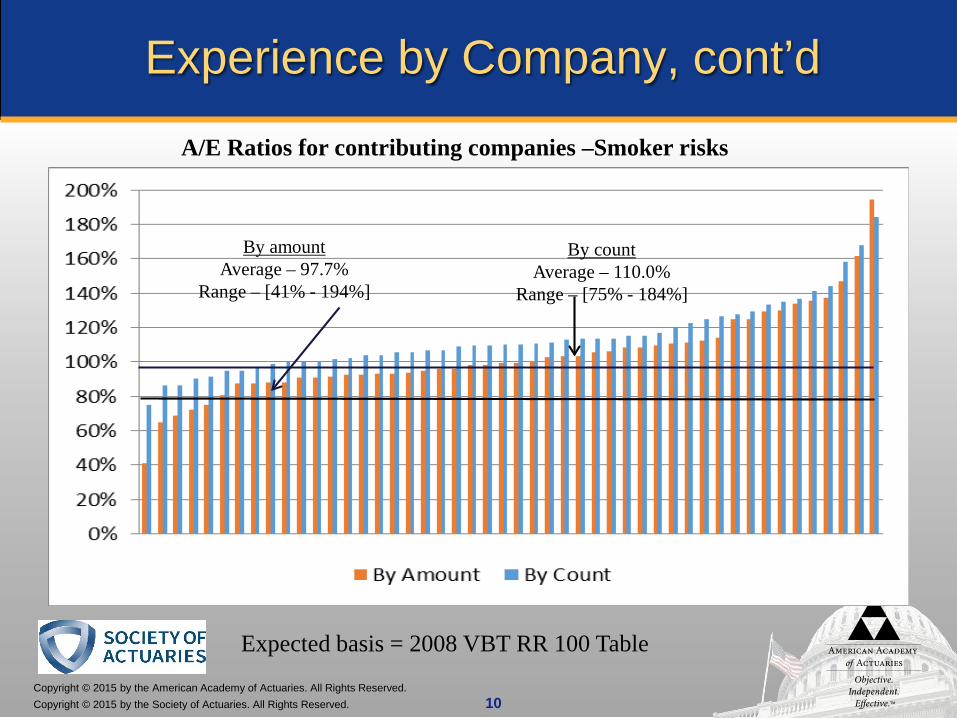
Experience by Company, cont’d
A/E Ratios for contributing companies –Smoker risks
Expected basis = 2008 VBT RR 100 Table
By amountAverage – 97.7%
Range – [41% - 194%]
By countAverage – 110.0%
Range – [75% - 184%]
Copyright © 2015 by the American Academy of Actuaries. All Rights Reserved.Copyright © 2015 by the Society of Actuaries. All Rights Reserved. 11
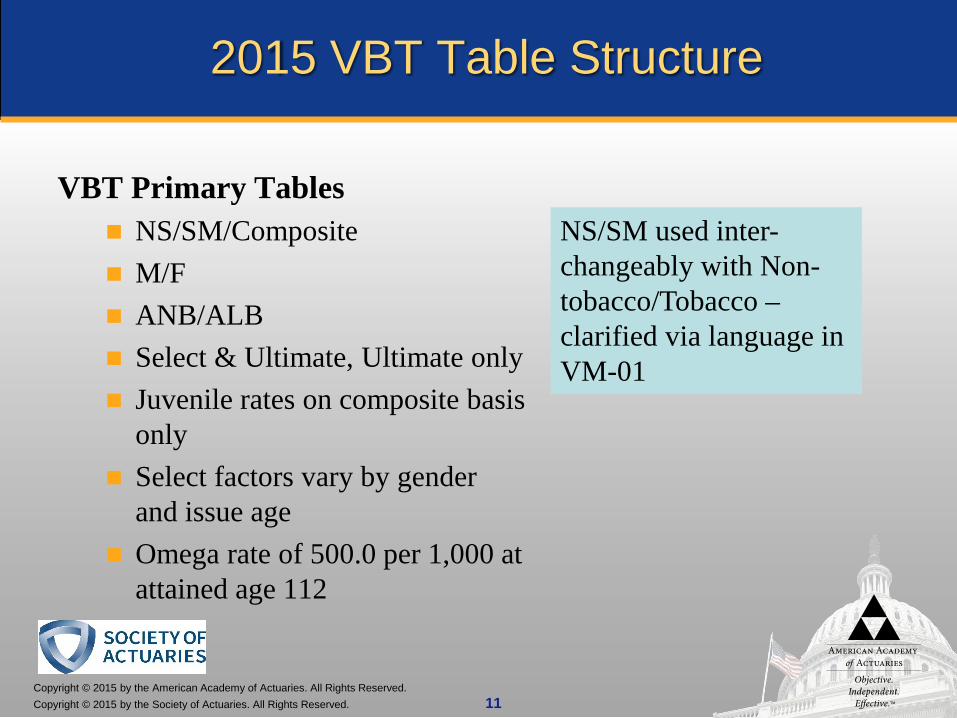
2015 VBT Table Structure
VBT Primary Tables NS/SM/Composite M/F ANB/ALB Select & Ultimate, Ultimate only Juvenile rates on composite basis
only Select factors vary by gender
and issue age Omega rate of 500.0 per 1,000 at
attained age 112
NS/SM used inter-changeably with Non-tobacco/Tobacco –clarified via language in VM-01
Copyright © 2015 by the American Academy of Actuaries. All Rights Reserved.Copyright © 2015 by the Society of Actuaries. All Rights Reserved. 12
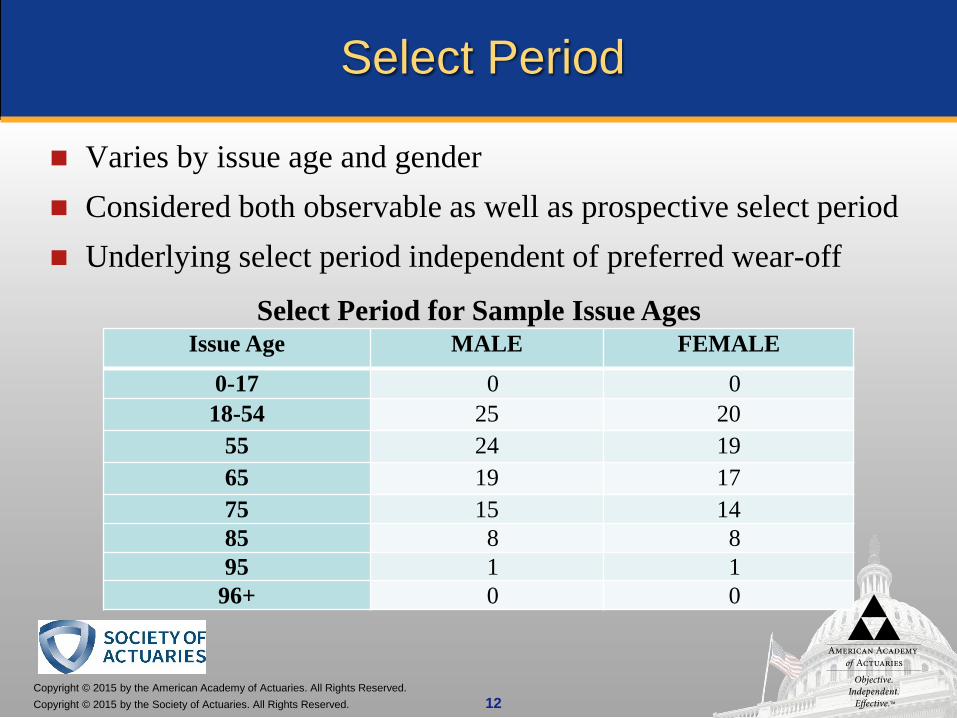
Select Period
Varies by issue age and gender Considered both observable as well as prospective select period Underlying select period independent of preferred wear-off
Issue Age MALE FEMALE
0-17 0 018-54 25 20
55 24 1965 19 1775 15 1485 8 895 1 1
96+ 0 0
Select Period for Sample Issue Ages
Copyright © 2015 by the American Academy of Actuaries. All Rights Reserved.Copyright © 2015 by the Society of Actuaries. All Rights Reserved. 13
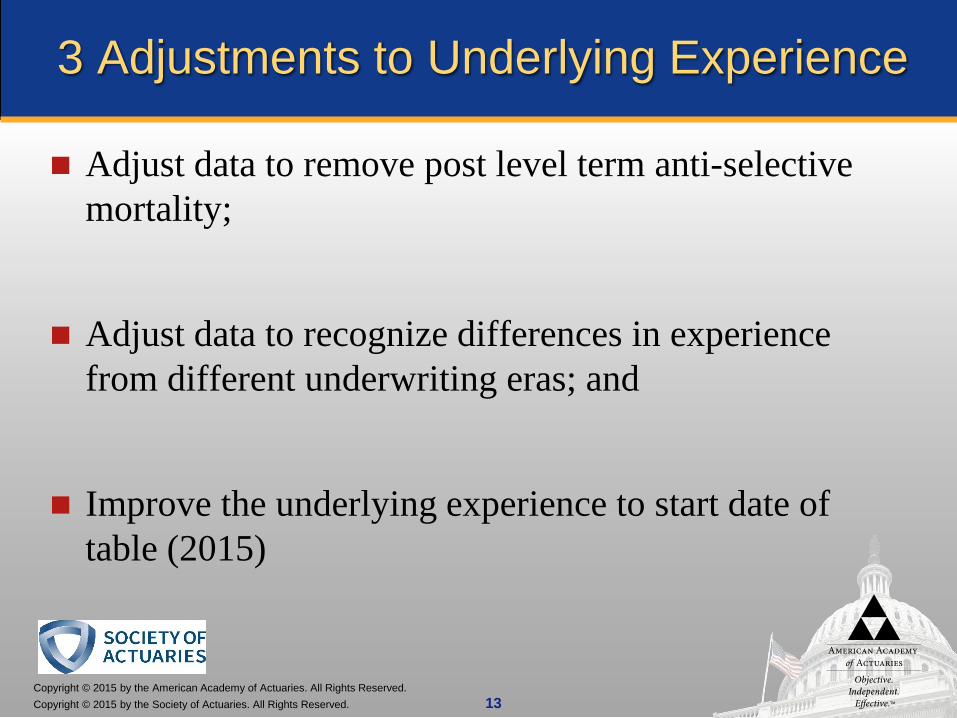
3 Adjustments to Underlying Experience
Adjust data to remove post level term anti-selective mortality;
Adjust data to recognize differences in experience from different underwriting eras; and
Improve the underlying experience to start date of table (2015)

Copyright © 2015 by the American Academy of Actuaries. All Rights Reserved.Copyright © 2015 by the Society of Actuaries. All Rights Reserved. 14
1. Remove Effects of Post Level Term Mortality
Adjustment to decrease the total mortality rates to account for the impact of post-level term experience Analyzed A/E ratios for 10/15/20 year term plans by face
amount, issue age group and duration Recalculated A/E ratios by estimating impact of post level
term mortality
Factors vary by issue age/duration Average 2.9% at duration 13 versus 1.3% at duration 18
Copyright © 2015 by the American Academy of Actuaries. All Rights Reserved.Copyright © 2015 by the Society of Actuaries. All Rights Reserved. 15
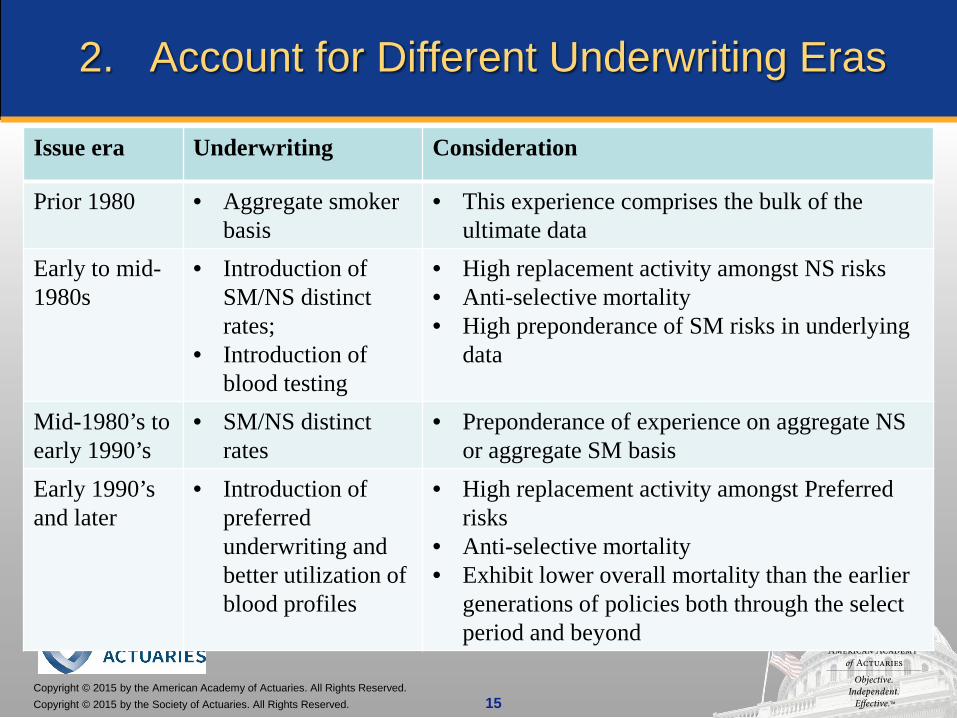
2. Account for Different Underwriting Eras
Issue era Underwriting Consideration
Prior 1980 • Aggregate smoker basis
• This experience comprises the bulk of the ultimate data
Early to mid-1980s
• Introduction of SM/NS distinct rates;
• Introduction of blood testing
• High replacement activity amongst NS risks• Anti-selective mortality• High preponderance of SM risks in underlying
data
Mid-1980’s to early 1990’s
• SM/NS distinct rates
• Preponderance of experience on aggregate NS or aggregate SM basis
Early 1990’s and later
• Introduction of preferred underwriting and better utilization of blood profiles
• High replacement activity amongst Preferred risks
• Anti-selective mortality• Exhibit lower overall mortality than the earlier
generations of policies both through the select period and beyond
Copyright © 2015 by the American Academy of Actuaries. All Rights Reserved.Copyright © 2015 by the Society of Actuaries. All Rights Reserved. 16
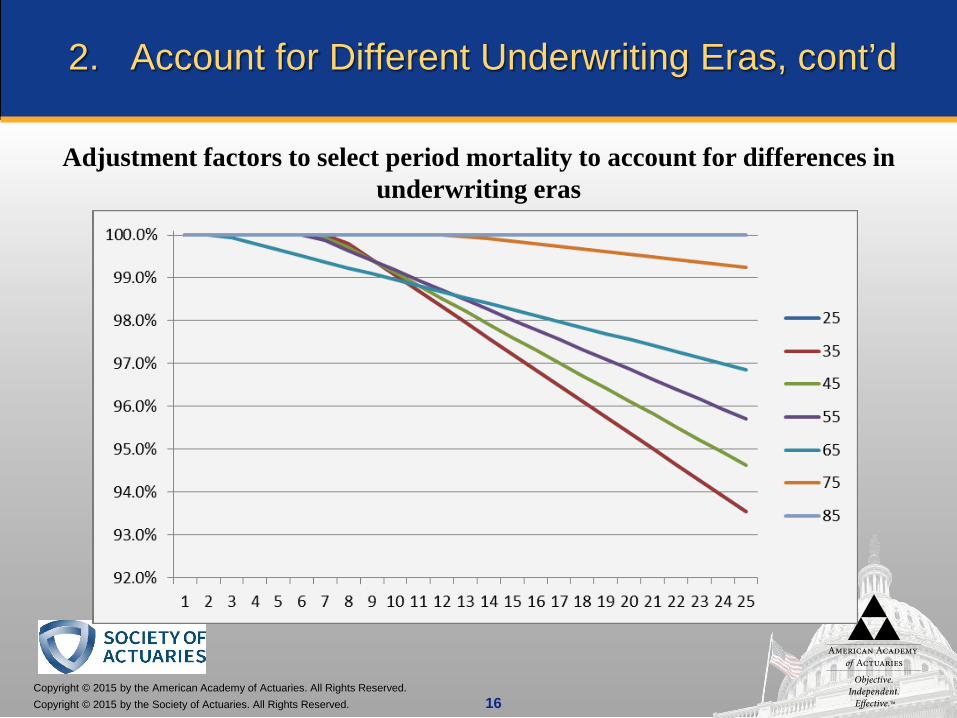
2. Account for Different Underwriting Eras, cont’d
Adjustment factors to select period mortality to account for differences in underwriting eras
Copyright © 2015 by the American Academy of Actuaries. All Rights Reserved.Copyright © 2015 by the Society of Actuaries. All Rights Reserved. 17
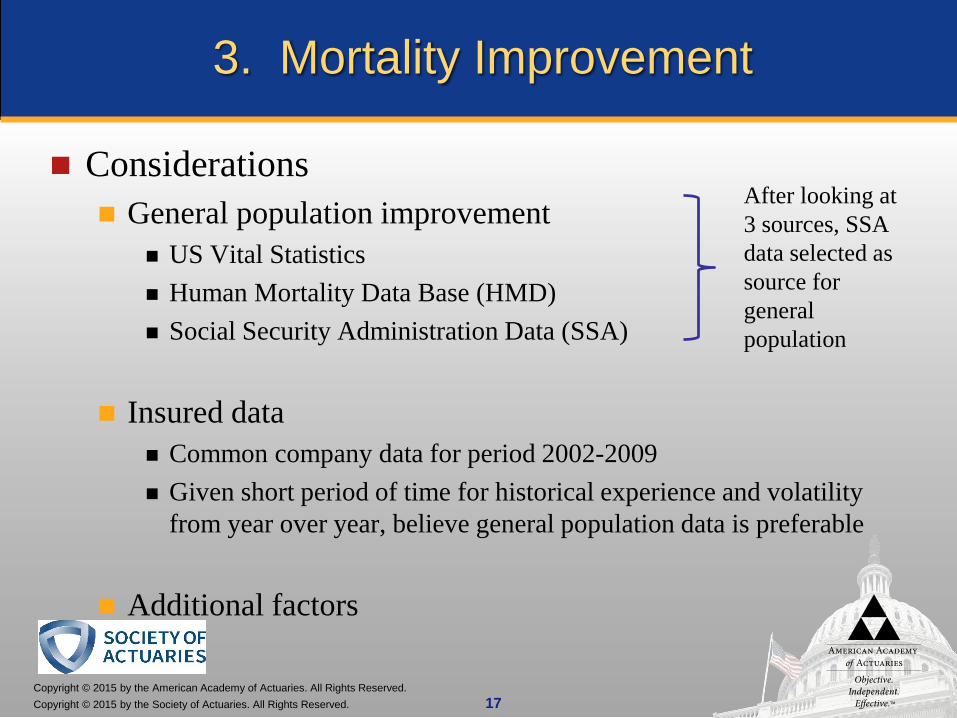
3. Mortality Improvement
Considerations General population improvement
US Vital Statistics Human Mortality Data Base (HMD) Social Security Administration Data (SSA)
Insured data Common company data for period 2002-2009 Given short period of time for historical experience and volatility
from year over year, believe general population data is preferable
Additional factors
After looking at 3 sources, SSA data selected as source for general population

Copyright © 2015 by the American Academy of Actuaries. All Rights Reserved.Copyright © 2015 by the Society of Actuaries. All Rights Reserved. 18
3. Mortality Improvement, cont’d
Additional factors considered Gender; Attained age; Smoker status; Socio-economic status; and Differences in cause of death for insured lives vs general
population.
Copyright © 2015 by the American Academy of Actuaries. All Rights Reserved.Copyright © 2015 by the Society of Actuaries. All Rights Reserved. 19
3. Mortality Improvement, cont’d
For period 2002-2009: Apply actual mortality improvement to adjust each experience
year.
For period 2009-2015: Apply annual improvement rates varying by attained age and
gender = average of:(a) Average annual improvement rates implied by the SSA’s
most recent intermediate level projection of mortality for the social security population; and
(b) Actual average annual improvement rates from historical SSA data for the most recent 10-year period.
Copyright © 2015 by the American Academy of Actuaries. All Rights Reserved.Copyright © 2015 by the Society of Actuaries. All Rights Reserved. 20
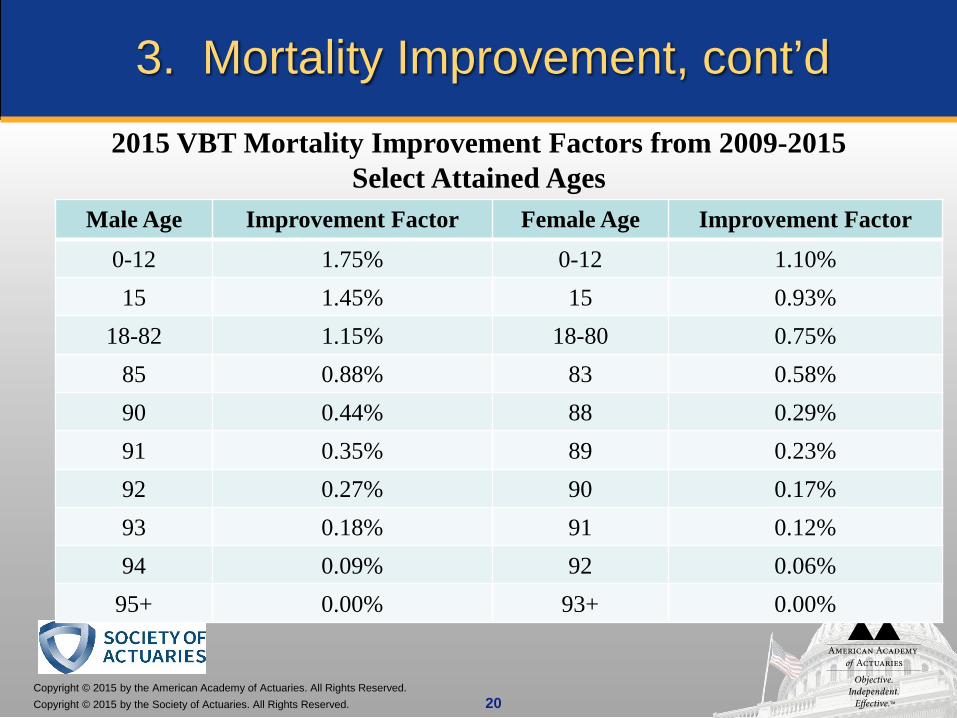
3. Mortality Improvement, cont’d2015 VBT Mortality Improvement Factors from 2009-2015
Select Attained AgesMale Age Improvement Factor Female Age Improvement Factor
0-12 1.75% 0-12 1.10%15 1.45% 15 0.93%
18-82 1.15% 18-80 0.75%85 0.88% 83 0.58%90 0.44% 88 0.29%91 0.35% 89 0.23%92 0.27% 90 0.17%93 0.18% 91 0.12%94 0.09% 92 0.06%
95+ 0.00% 93+ 0.00%
Copyright © 2015 by the American Academy of Actuaries. All Rights Reserved.Copyright © 2015 by the Society of Actuaries. All Rights Reserved. 21
Graduation Approach
Explored 3 separate approaches to graduating data and resulting fit Projection pursuit regression (PPR); Whittaker-Henderson (WH); and Generalized Additive Model (GAM).
For the ultimate date, all three models produced reasonable results;
For the select data, the models did not perform equally - GAM approach had best fit overall with little to no loss of monotonicity
Additional adjustments made for young adult issue ages and issue ages 70 and above
Copyright © 2015 by the American Academy of Actuaries. All Rights Reserved.Copyright © 2015 by the Society of Actuaries. All Rights Reserved. 22
Relative Risk Table Considerations
Number of tables Same as 2008 VBT for both non-smoker and smoker
Relativity amongst tables Different from 2008 VBT for non-smokers; same for
smokers
Preferred wear-off pattern Similar to 2008 VBT
Copyright © 2015 by the American Academy of Actuaries. All Rights Reserved.Copyright © 2015 by the Society of Actuaries. All Rights Reserved. 23
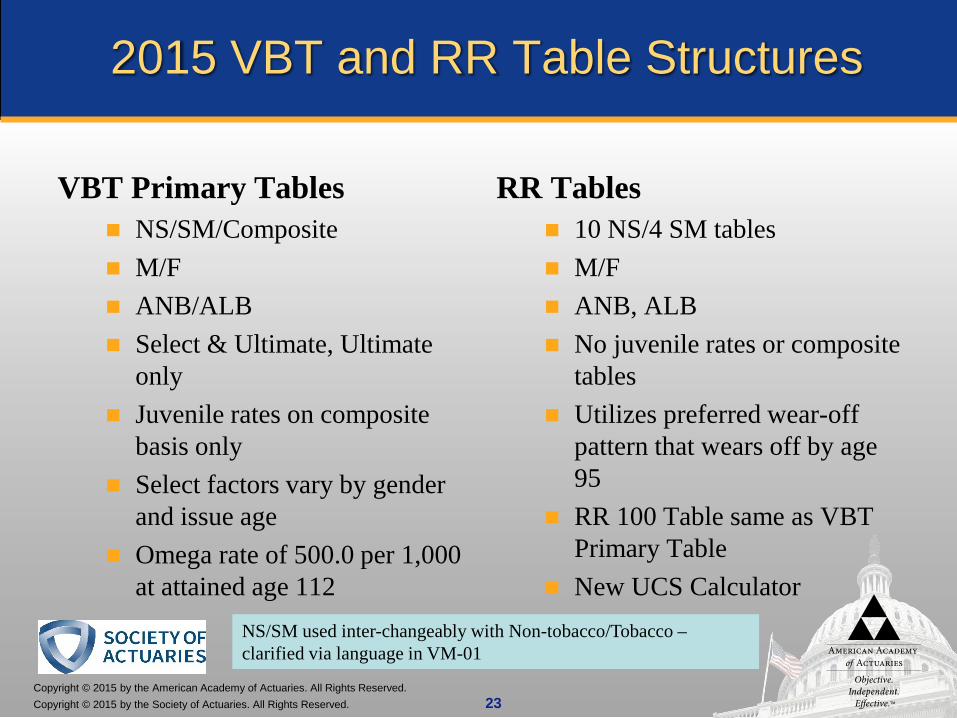
2015 VBT and RR Table Structures
VBT Primary Tables NS/SM/Composite M/F ANB/ALB Select & Ultimate, Ultimate
only Juvenile rates on composite
basis only Select factors vary by gender
and issue age Omega rate of 500.0 per 1,000
at attained age 112
RR Tables 10 NS/4 SM tables M/F ANB, ALB No juvenile rates or composite
tables Utilizes preferred wear-off
pattern that wears off by age 95
RR 100 Table same as VBT Primary Table
New UCS CalculatorNS/SM used inter-changeably with Non-tobacco/Tobacco –clarified via language in VM-01

Copyright © 2015 by the American Academy of Actuaries. All Rights Reserved.Copyright © 2015 by the Society of Actuaries. All Rights Reserved. 24
NS = RR 50, 60, 70, 80, 90, 100, 110, 125, 150, 175
E = 2014 VBT adjusted to remove improvement to midpoint of data period for each company
02468
101214
Num
ber
of c
ompa
nies
A/E where E=2014 VBT
Range of A/Es for all NS risk classes by number of claims
50+ Claims25-49 Claims<25 Claims
Determination of Relativity for RR Tables - Nonsmoker
Copyright © 2015 by the American Academy of Actuaries. All Rights Reserved.Copyright © 2015 by the Society of Actuaries. All Rights Reserved. 25
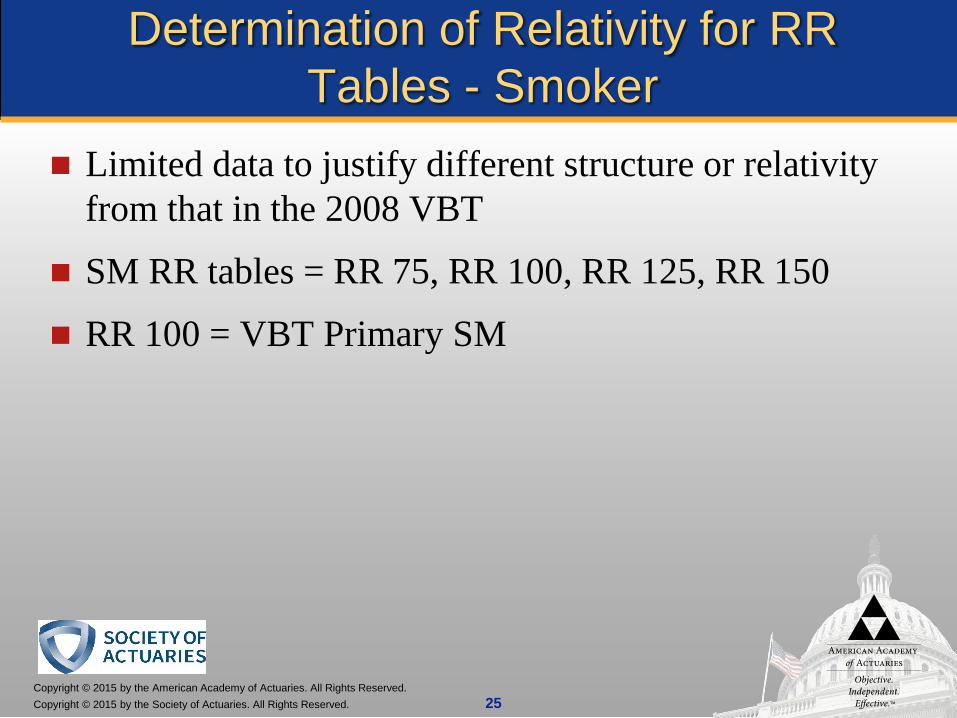
Determination of Relativity for RR Tables - Smoker
Limited data to justify different structure or relativity from that in the 2008 VBT
SM RR tables = RR 75, RR 100, RR 125, RR 150
RR 100 = VBT Primary SM
Copyright © 2015 by the American Academy of Actuaries. All Rights Reserved.Copyright © 2015 by the Society of Actuaries. All Rights Reserved. 26
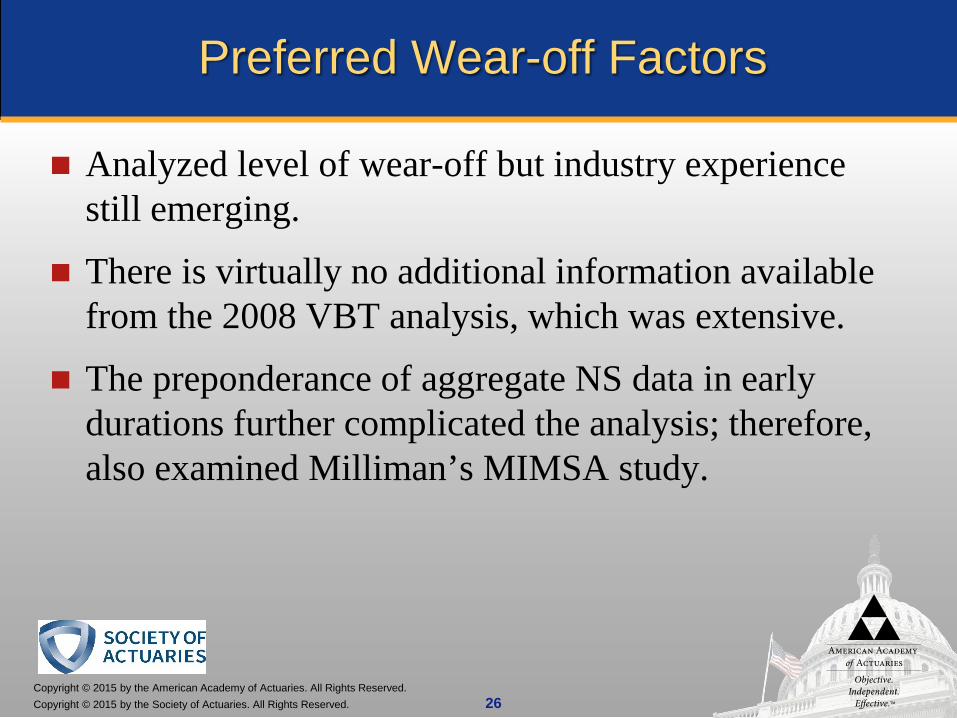
Preferred Wear-off Factors
Analyzed level of wear-off but industry experience still emerging.
There is virtually no additional information available from the 2008 VBT analysis, which was extensive.
The preponderance of aggregate NS data in early durations further complicated the analysis; therefore, also examined Milliman’s MIMSA study.
Copyright © 2015 by the American Academy of Actuaries. All Rights Reserved.Copyright © 2015 by the Society of Actuaries. All Rights Reserved. 27
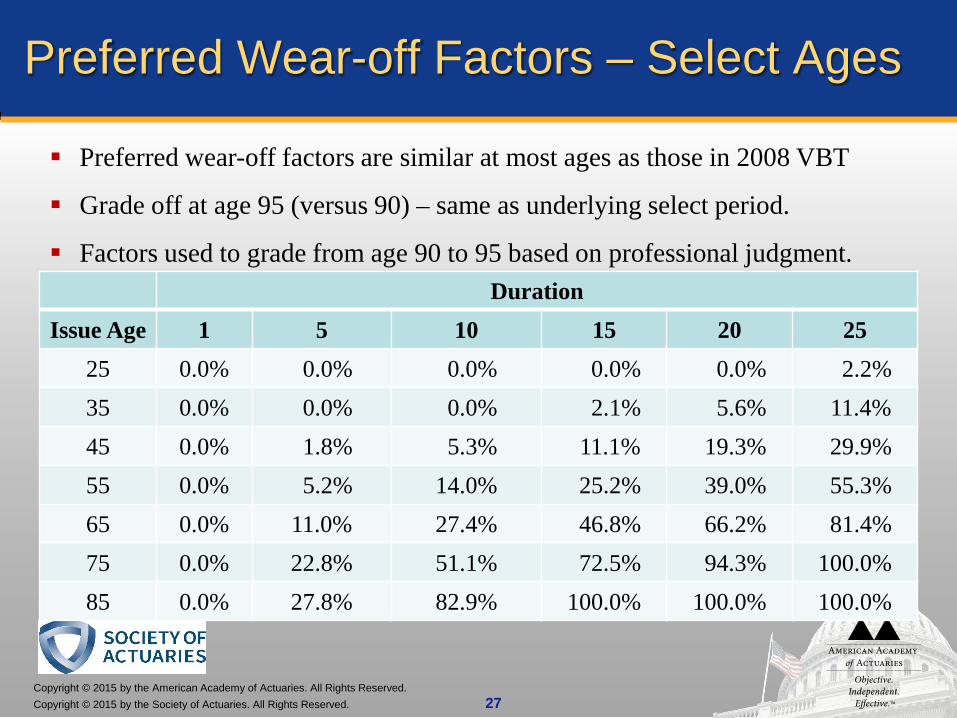
Preferred Wear-off Factors – Select Ages
DurationIssue Age 1 5 10 15 20 25
25 0.0% 0.0% 0.0% 0.0% 0.0% 2.2%35 0.0% 0.0% 0.0% 2.1% 5.6% 11.4%45 0.0% 1.8% 5.3% 11.1% 19.3% 29.9%55 0.0% 5.2% 14.0% 25.2% 39.0% 55.3%65 0.0% 11.0% 27.4% 46.8% 66.2% 81.4%75 0.0% 22.8% 51.1% 72.5% 94.3% 100.0%85 0.0% 27.8% 82.9% 100.0% 100.0% 100.0%
Preferred wear-off factors are similar at most ages as those in 2008 VBT
Grade off at age 95 (versus 90) – same as underlying select period.
Factors used to grade from age 90 to 95 based on professional judgment.
Copyright © 2015 by the American Academy of Actuaries. All Rights Reserved.Copyright © 2015 by the Society of Actuaries. All Rights Reserved.
Resulting experience – Sample Ages and DurationsMale Risks

Copyright © 2015 by the American Academy of Actuaries. All Rights Reserved.Copyright © 2015 by the Society of Actuaries. All Rights Reserved. 29
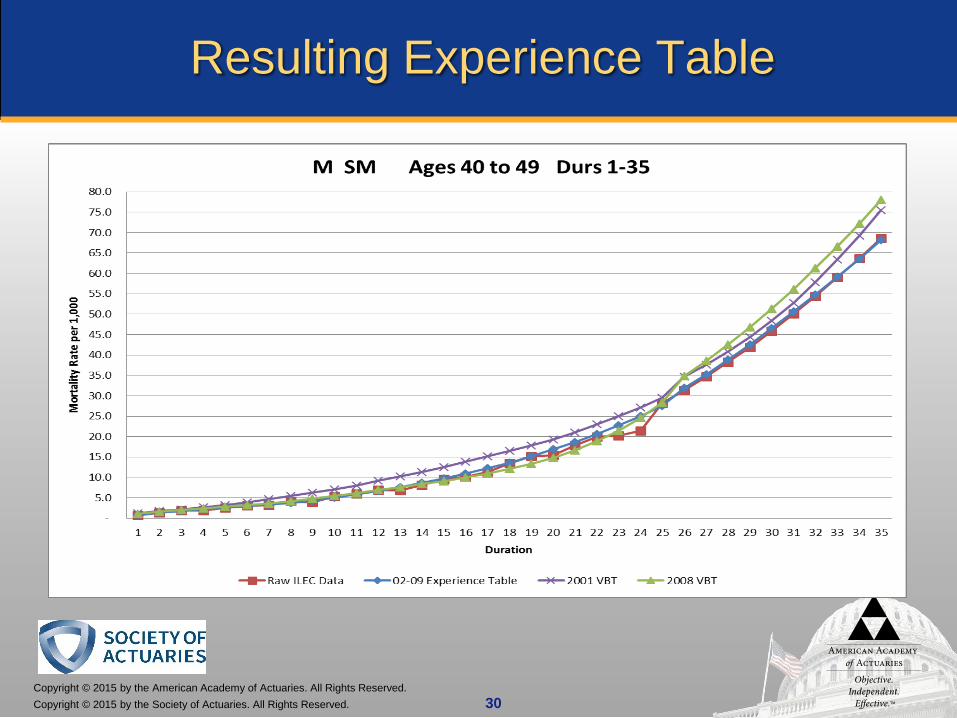
Resulting Experience Table
Copyright © 2015 by the American Academy of Actuaries. All Rights Reserved.Copyright © 2015 by the Society of Actuaries. All Rights Reserved. 30
Resulting Experience Table

Copyright © 2015 by the American Academy of Actuaries. All Rights Reserved.Copyright © 2015 by the Society of Actuaries. All Rights Reserved. 31
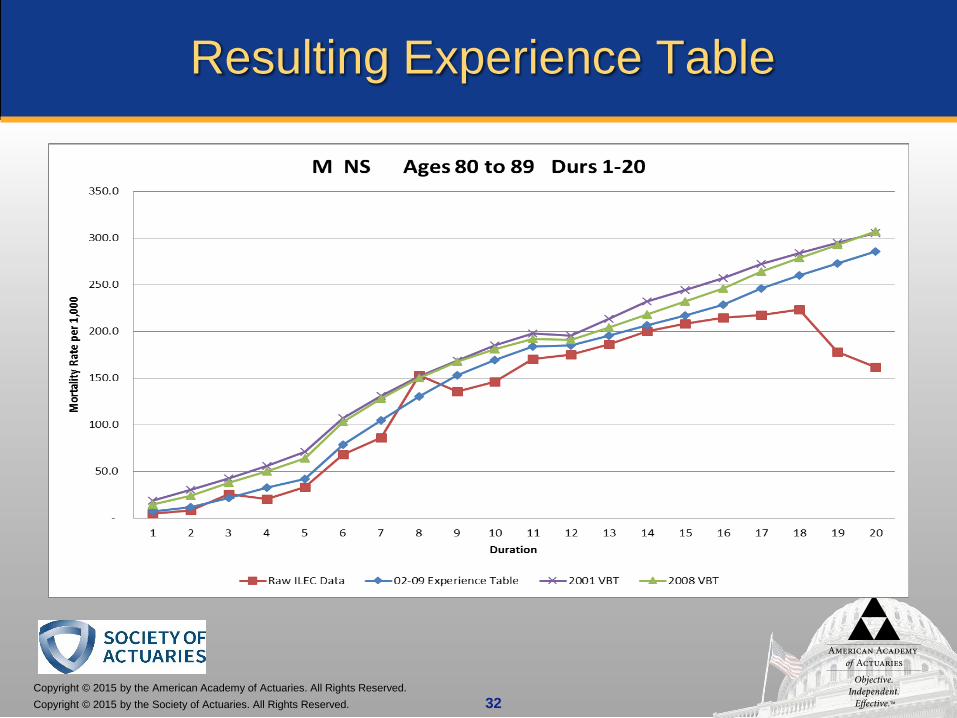
Resulting Experience Table
Copyright © 2015 by the American Academy of Actuaries. All Rights Reserved.Copyright © 2015 by the Society of Actuaries. All Rights Reserved. 32
Resulting Experience Table

Copyright © 2015 by the American Academy of Actuaries. All Rights Reserved.Copyright © 2015 by the Society of Actuaries. All Rights Reserved.
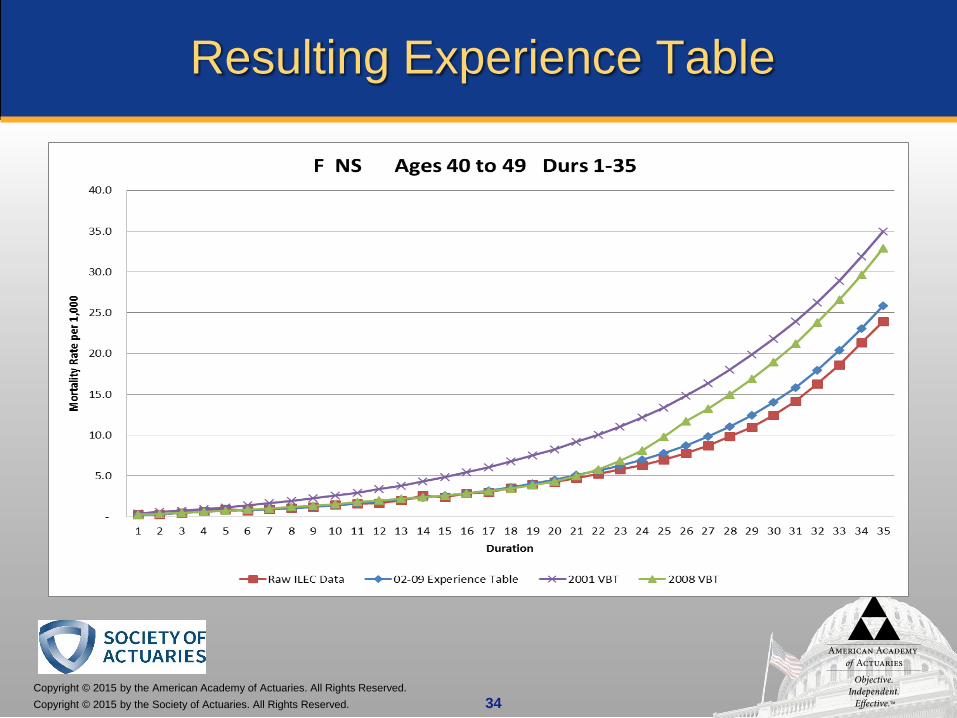
Resulting experience – Sample Ages and Durations
Female Risks
Copyright © 2015 by the American Academy of Actuaries. All Rights Reserved.Copyright © 2015 by the Society of Actuaries. All Rights Reserved. 34
Resulting Experience Table
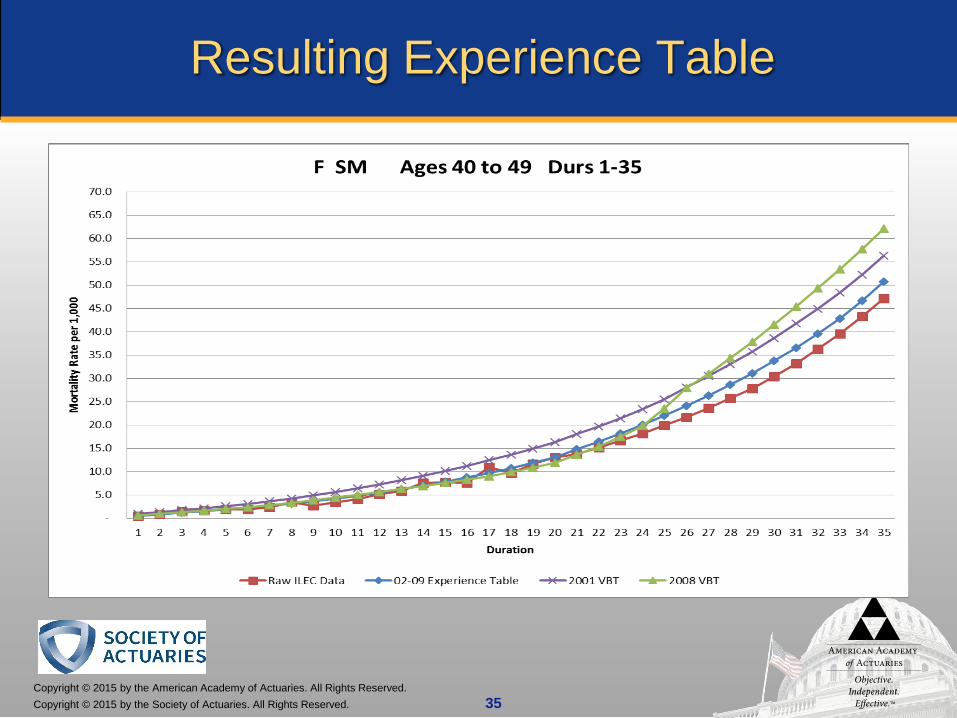
Copyright © 2015 by the American Academy of Actuaries. All Rights Reserved.Copyright © 2015 by the Society of Actuaries. All Rights Reserved. 35
Resulting Experience Table
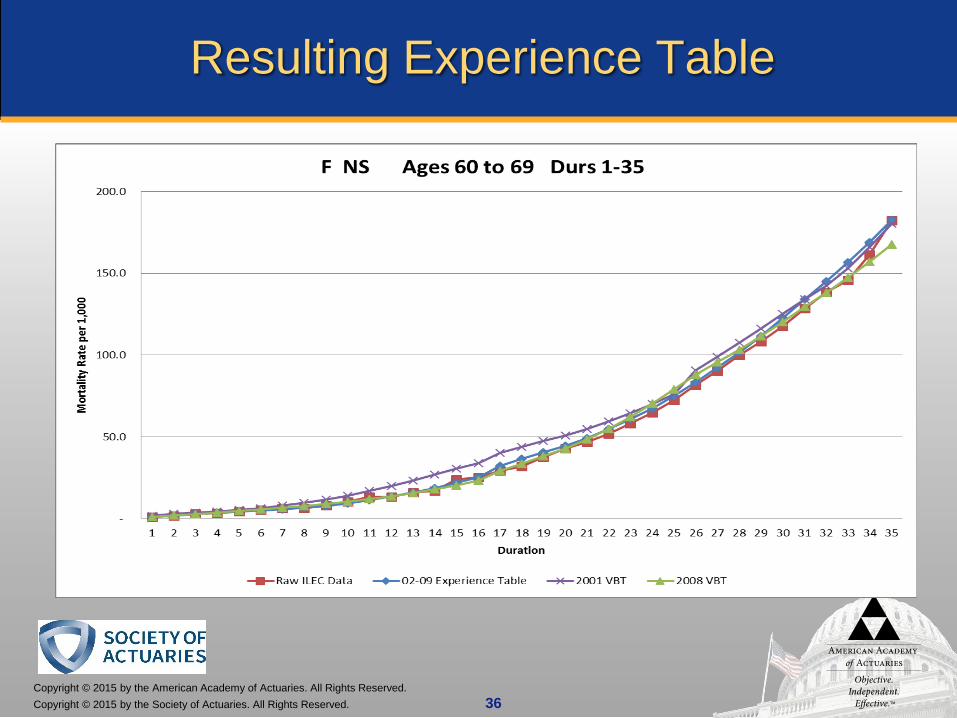
Copyright © 2015 by the American Academy of Actuaries. All Rights Reserved.Copyright © 2015 by the Society of Actuaries. All Rights Reserved. 36
Resulting Experience Table
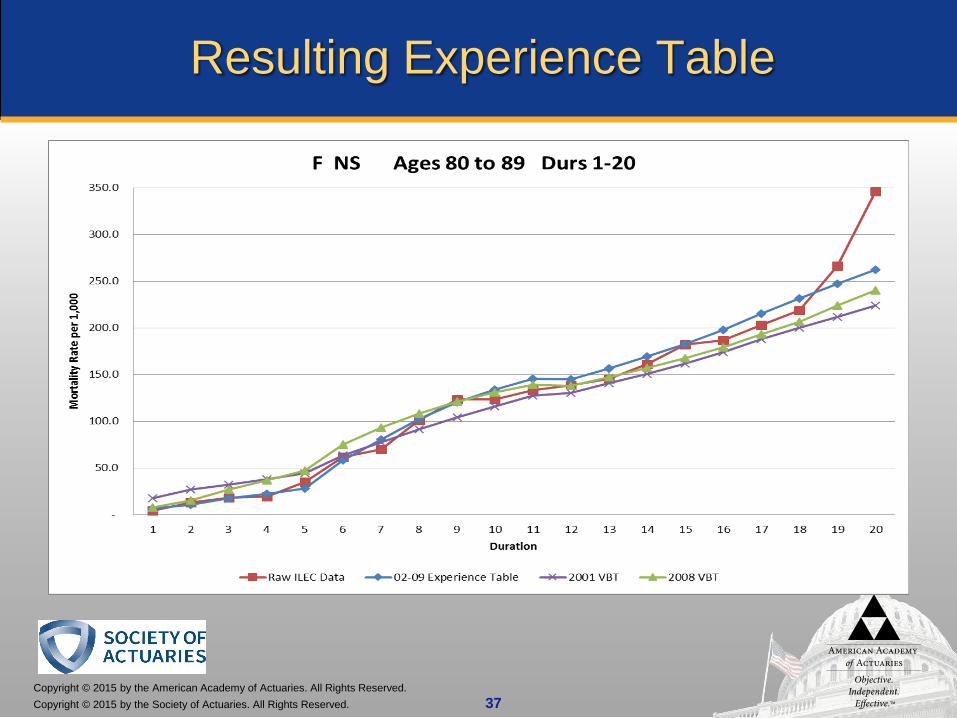
Copyright © 2015 by the American Academy of Actuaries. All Rights Reserved.Copyright © 2015 by the Society of Actuaries. All Rights Reserved. 37
Resulting Experience Table
Copyright © 2015 by the American Academy of Actuaries. All Rights Reserved.Copyright © 2015 by the Society of Actuaries. All Rights Reserved.
2017 CSO DevelopmentMary Bahna-Nolan

Copyright © 2015 by the American Academy of Actuaries. All Rights Reserved.Copyright © 2015 by the Society of Actuaries. All Rights Reserved. 39
Tables and Applications – Exposed, cont’d
Table Regulatory Use Valuation Manual Impacts Status
2017 CSO
and
2017 CSOPreferred Structure Tables
• Net premium reserves• Tax reserves• Non-forfeiture
determination*• Basis for 7702/7702A• Cap for universal life cost
of insurance charges
VM-00• Allows use of 2017 CSO, per conditions in
VM-20,§3 for companies that elect to defer PBR implementation
VM-02, §5.A.1-3• Recognizes 2017 CSO for non-forfeiture
and defines conditions for useVM-M, §1.H
• Defines 2017 CSO and Preferred Structure Tables for use as a valuation table
VM-20, §3.A.2 and §3.C.1• Allows use of 2017 CSO for net premium
reserve determination and defines conditions for its use
VM-20, §6• Points to mortality as defined in §3.C.1
and VM-M §1.H for which mortality to use in the stochastic and deterministic exclusion tests
VM-A• Adds Appendix A-814 to list of references
• 30-day comment period expired 09/18/2015
• Report being finalized• Vote for adoption at
upcoming LATF conference call
* Relative risk tables are not applicable for non-forfeiture
Copyright © 2015 by the American Academy of Actuaries. All Rights Reserved.Copyright © 2015 by the Society of Actuaries. All Rights Reserved. 40
2017 CSO
Purpose of margin
Target level of margin (from regulators)
Structure of margin
Preferred structure tables
Copyright © 2015 by the American Academy of Actuaries. All Rights Reserved.Copyright © 2015 by the Society of Actuaries. All Rights Reserved. 41
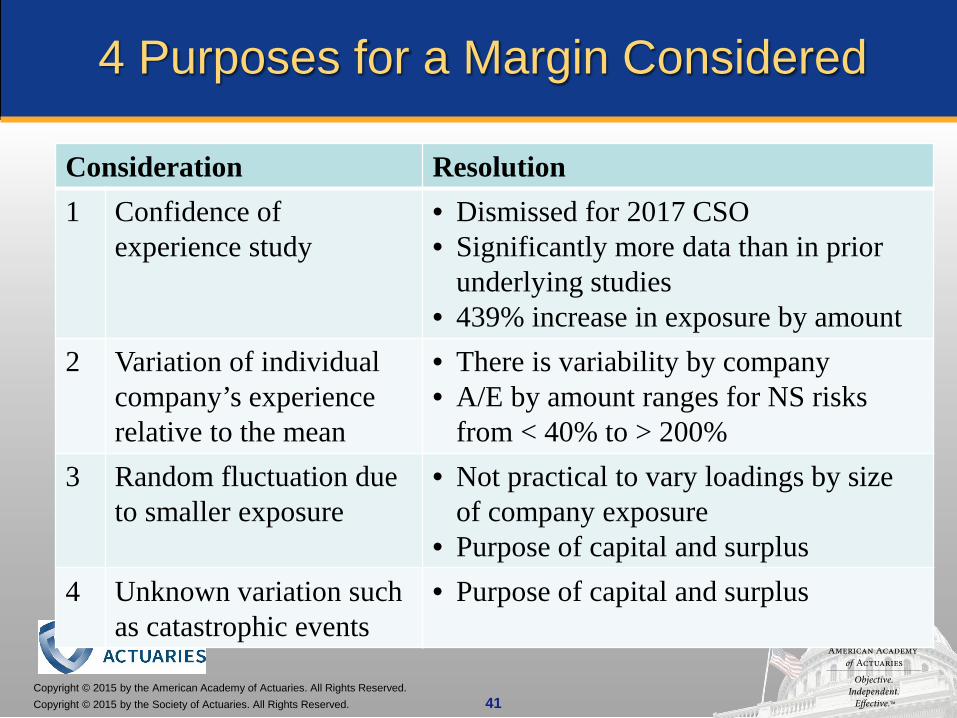
4 Purposes for a Margin Considered
Consideration Resolution1 Confidence of
experience study• Dismissed for 2017 CSO• Significantly more data than in prior
underlying studies• 439% increase in exposure by amount
2 Variation of individualcompany’s experience relative to the mean
• There is variability by company• A/E by amount ranges for NS risks
from < 40% to > 200%3 Random fluctuation due
to smaller exposure• Not practical to vary loadings by size
of company exposure• Purpose of capital and surplus
4 Unknown variation such as catastrophic events
• Purpose of capital and surplus
Copyright © 2015 by the American Academy of Actuaries. All Rights Reserved.Copyright © 2015 by the Society of Actuaries. All Rights Reserved. 42
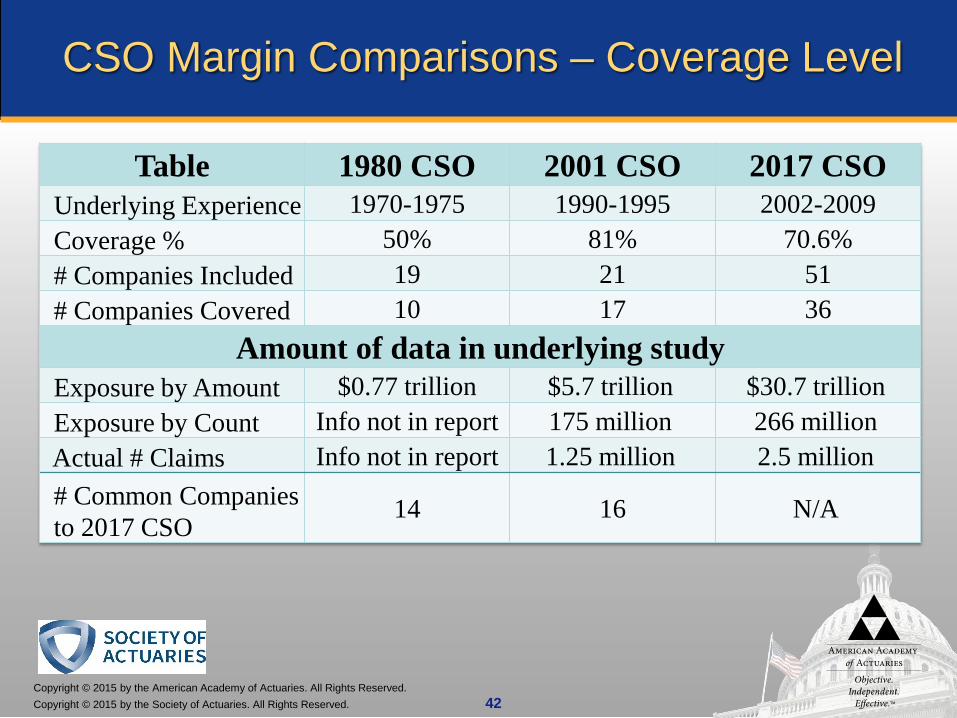
CSO Margin Comparisons – Coverage Level
Table 1980 CSO 2001 CSO 2017 CSOUnderlying Experience 1970-1975 1990-1995 2002-2009Coverage % 50% 81% 70.6%# Companies Included 19 21 51# Companies Covered 10 17 36
Amount of data in underlying studyExposure by Amount $0.77 trillion $5.7 trillion $30.7 trillionExposure by Count Info not in report 175 million 266 millionActual # Claims Info not in report 1.25 million 2.5 million# Common Companies to 2017 CSO
14 16 N/A
Copyright © 2015 by the American Academy of Actuaries. All Rights Reserved.Copyright © 2015 by the Society of Actuaries. All Rights Reserved. 43
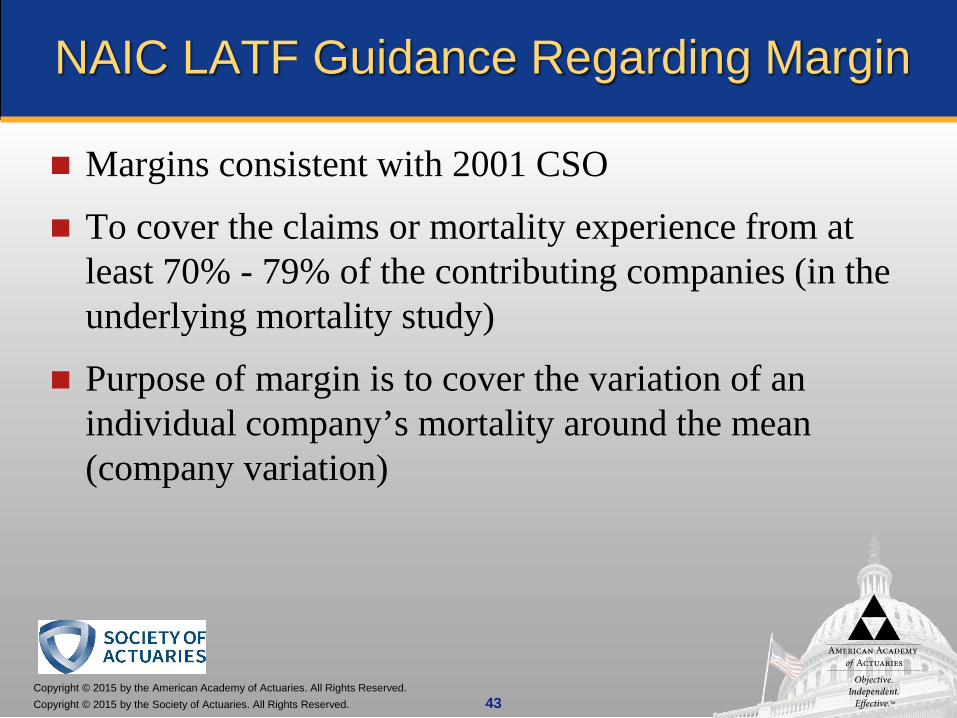
NAIC LATF Guidance Regarding Margin
Margins consistent with 2001 CSO
To cover the claims or mortality experience from at least 70% - 79% of the contributing companies (in the underlying mortality study)
Purpose of margin is to cover the variation of an individual company’s mortality around the mean (company variation)
Copyright © 2015 by the American Academy of Actuaries. All Rights Reserved.Copyright © 2015 by the Society of Actuaries. All Rights Reserved. 44
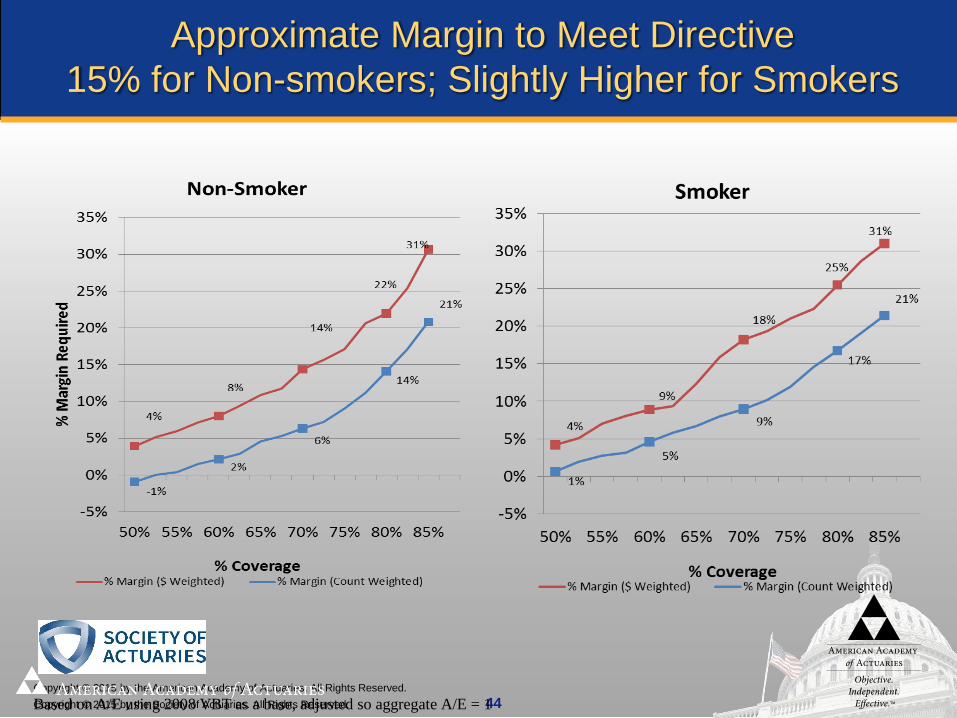
Approximate Margin to Meet Directive 15% for Non-smokers; Slightly Higher for Smokers
Based on A/E using 2008 VBT as a base, adjusted so aggregate A/E = 1
Copyright © 2015 by the American Academy of Actuaries. All Rights Reserved.Copyright © 2015 by the Society of Actuaries. All Rights Reserved. 45
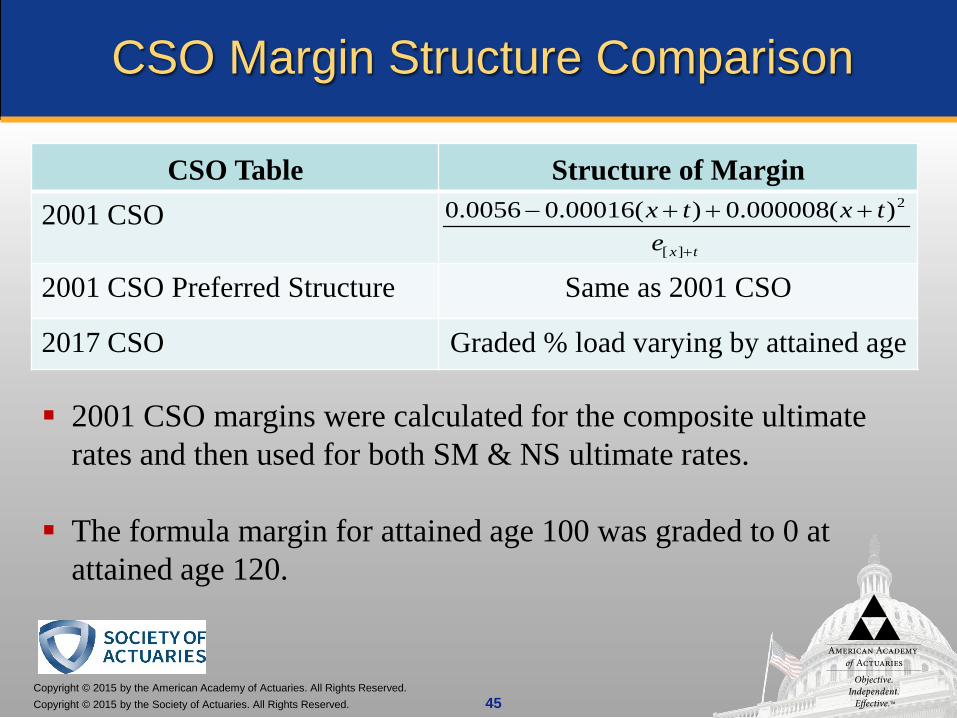
CSO Margin Structure Comparison
CSO Table Structure of Margin2001 CSO
2001 CSO Preferred Structure Same as 2001 CSO
2017 CSO Graded % load varying by attained age
2001 CSO margins were calculated for the composite ultimate rates and then used for both SM & NS ultimate rates.
The formula margin for attained age 100 was graded to 0 at attained age 120.
txetxtx
+
+++−
][
2)(000008.0)(00016.00056.0
Copyright © 2015 by the American Academy of Actuaries. All Rights Reserved.Copyright © 2015 by the Society of Actuaries. All Rights Reserved. 46
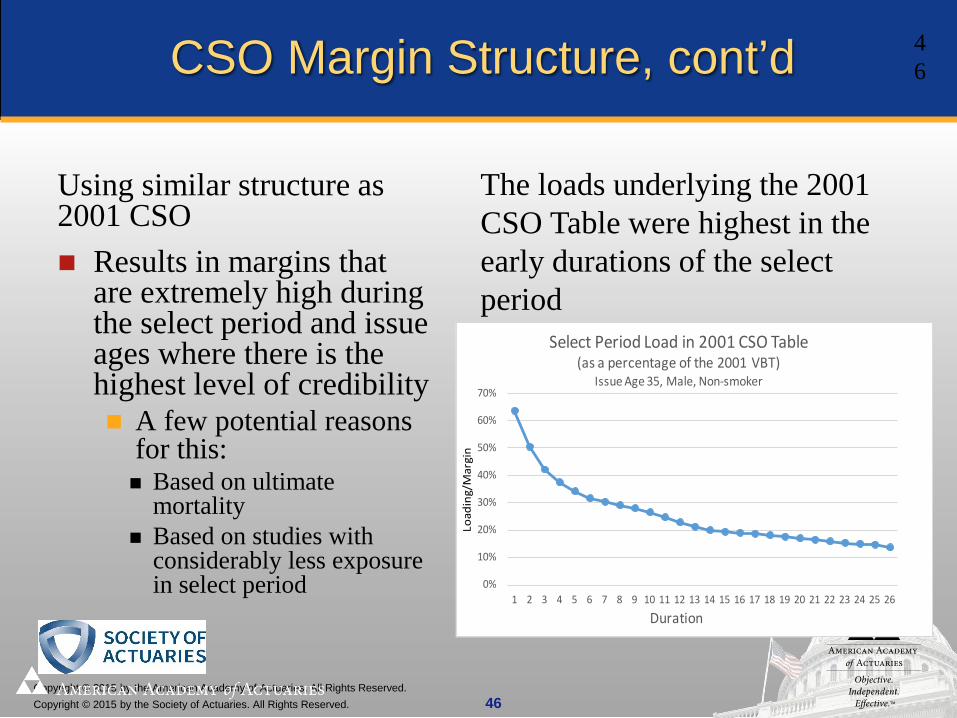
CSO Margin Structure, cont’d
Using similar structure as 2001 CSO Results in margins that
are extremely high during the select period and issue ages where there is the highest level of credibility A few potential reasons
for this: Based on ultimate
mortality Based on studies with
considerably less exposure in select period
The loads underlying the 2001 CSO Table were highest in the early durations of the select period
0%
10%
20%
30%
40%
50%
60%
70%
1 2 3 4 5 6 7 8 9 10 11 12 13 14 15 16 17 18 19 20 21 22 23 24 25 26
Load
ing/
Mar
gin
Duration
Select Period Load in 2001 CSO Table(as a percentage of the 2001 VBT)
Issue Age 35, Male, Non-smoker
46
Copyright © 2015 by the American Academy of Actuaries. All Rights Reserved.Copyright © 2015 by the Society of Actuaries. All Rights Reserved. 47
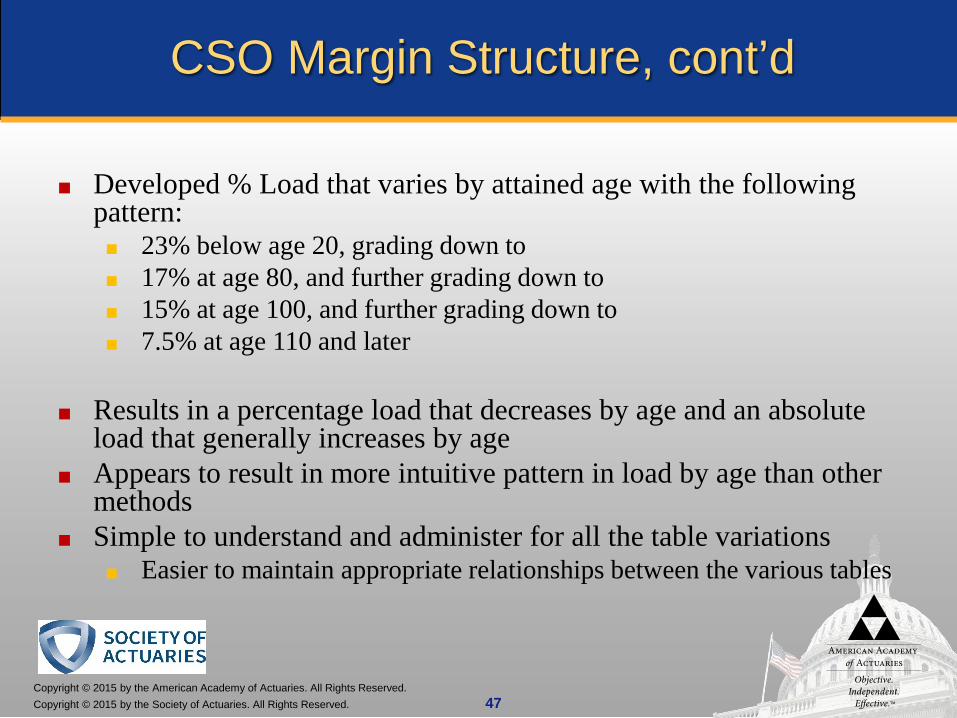
CSO Margin Structure, cont’d
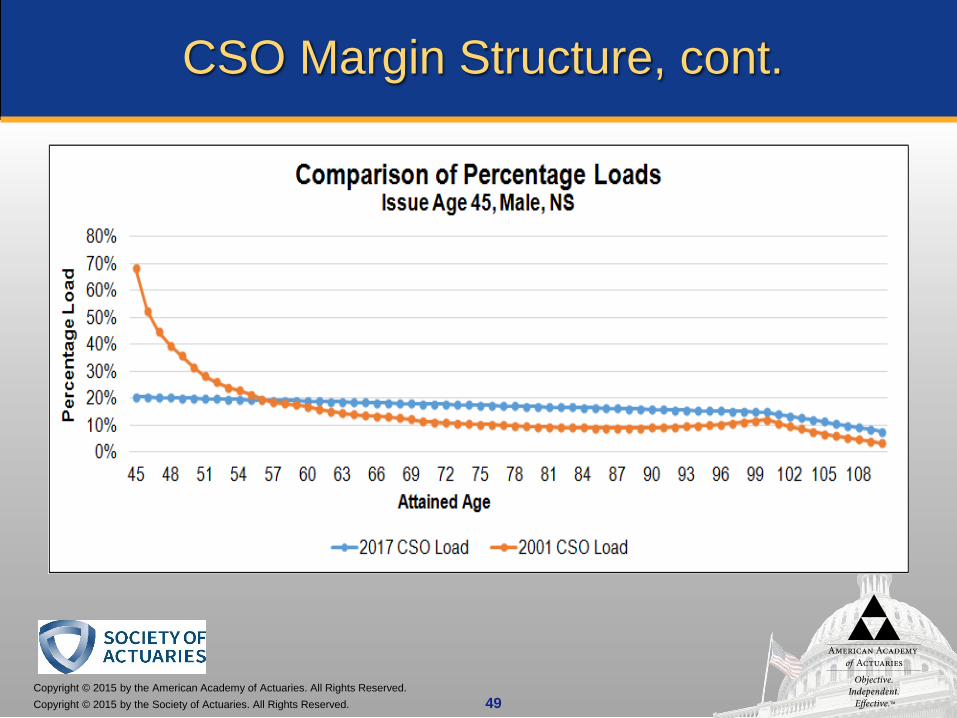
■ Developed % Load that varies by attained age with the following pattern:■ 23% below age 20, grading down to■ 17% at age 80, and further grading down to■ 15% at age 100, and further grading down to■ 7.5% at age 110 and later
■ Results in a percentage load that decreases by age and an absolute load that generally increases by age
■ Appears to result in more intuitive pattern in load by age than other methods
■ Simple to understand and administer for all the table variations■ Easier to maintain appropriate relationships between the various tables
Copyright © 2015 by the American Academy of Actuaries. All Rights Reserved.Copyright © 2015 by the Society of Actuaries. All Rights Reserved. 48
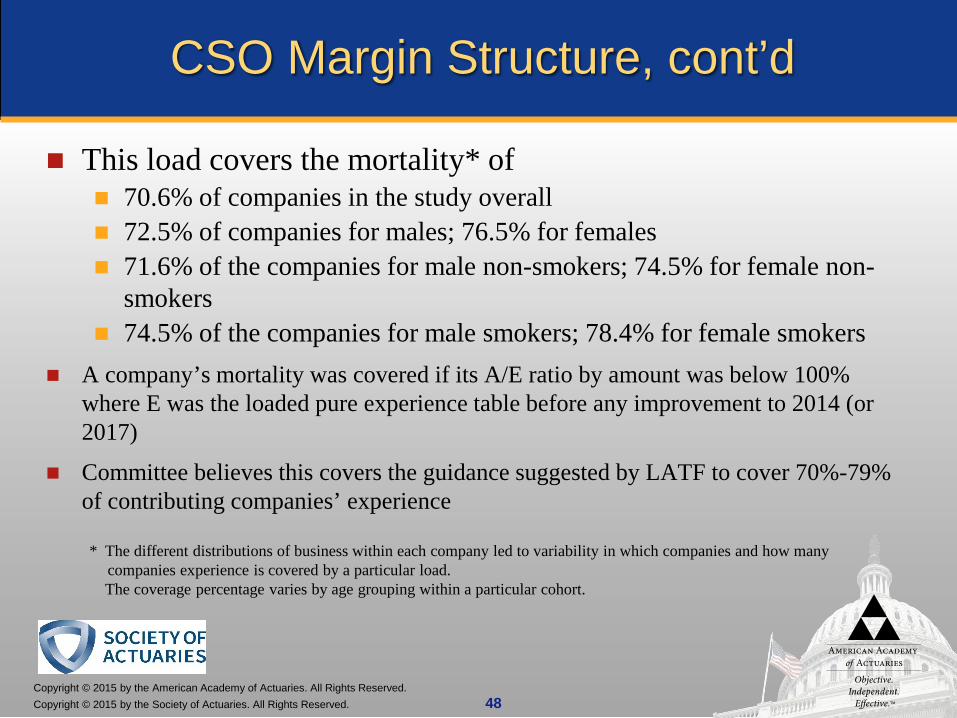
CSO Margin Structure, cont’d
This load covers the mortality* of 70.6% of companies in the study overall 72.5% of companies for males; 76.5% for females 71.6% of the companies for male non-smokers; 74.5% for female non-
smokers 74.5% of the companies for male smokers; 78.4% for female smokers
A company’s mortality was covered if its A/E ratio by amount was below 100% where E was the loaded pure experience table before any improvement to 2014 (or 2017)
Committee believes this covers the guidance suggested by LATF to cover 70%-79% of contributing companies’ experience
* The different distributions of business within each company led to variability in which companies and how many companies experience is covered by a particular load.The coverage percentage varies by age grouping within a particular cohort.
Copyright © 2015 by the American Academy of Actuaries. All Rights Reserved.Copyright © 2015 by the Society of Actuaries. All Rights Reserved. 49
CSO Margin Structure, cont.
Copyright © 2015 by the American Academy of Actuaries. All Rights Reserved.Copyright © 2015 by the Society of Actuaries. All Rights Reserved. 50
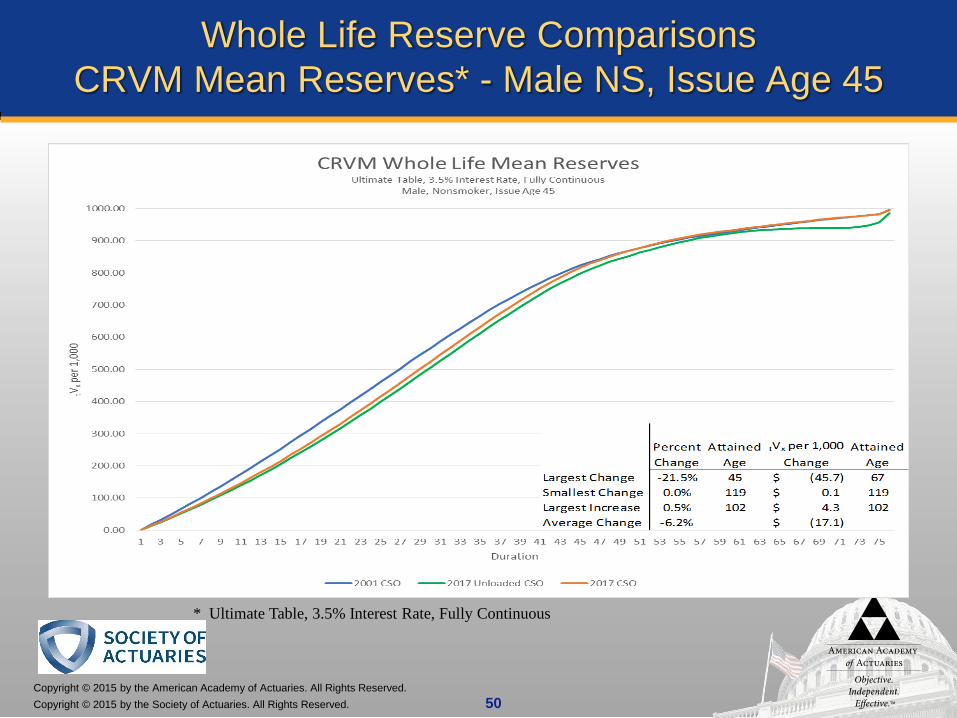
Whole Life Reserve ComparisonsCRVM Mean Reserves* - Male NS, Issue Age 45
* Ultimate Table, 3.5% Interest Rate, Fully Continuous

Copyright © 2015 by the American Academy of Actuaries. All Rights Reserved.Copyright © 2015 by the Society of Actuaries. All Rights Reserved. 51
Whole Life Reserve ComparisonsCRVM Mean Reserves* - Male NS, Issue Age 65
* Ultimate Table, 3.5% Interest Rate, Fully Continuous

Copyright © 2015 by the American Academy of Actuaries. All Rights Reserved.Copyright © 2015 by the Society of Actuaries. All Rights Reserved. 52
Whole Life Reserve ComparisonsCRVM Mean Reserves* - Female NS, Issue Age 45
* Ultimate Table, 3.5% Interest Rate, Fully Continuous
Copyright © 2015 by the American Academy of Actuaries. All Rights Reserved.Copyright © 2015 by the Society of Actuaries. All Rights Reserved. 53
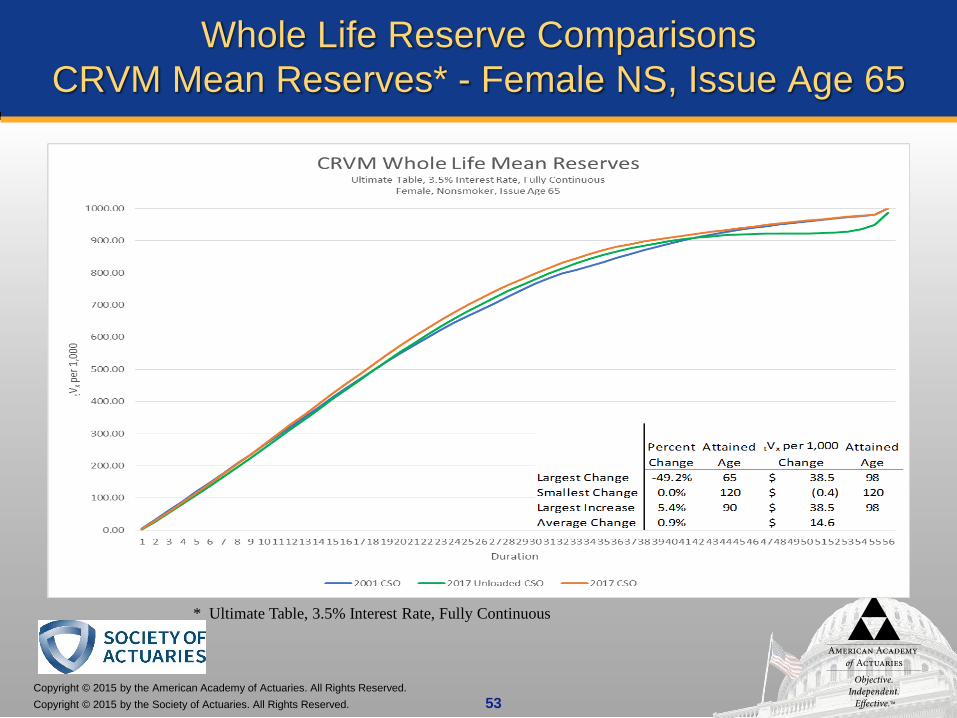
Whole Life Reserve ComparisonsCRVM Mean Reserves* - Female NS, Issue Age 65
* Ultimate Table, 3.5% Interest Rate, Fully Continuous
Copyright © 2015 by the American Academy of Actuaries. All Rights Reserved.Copyright © 2015 by the Society of Actuaries. All Rights Reserved. 54
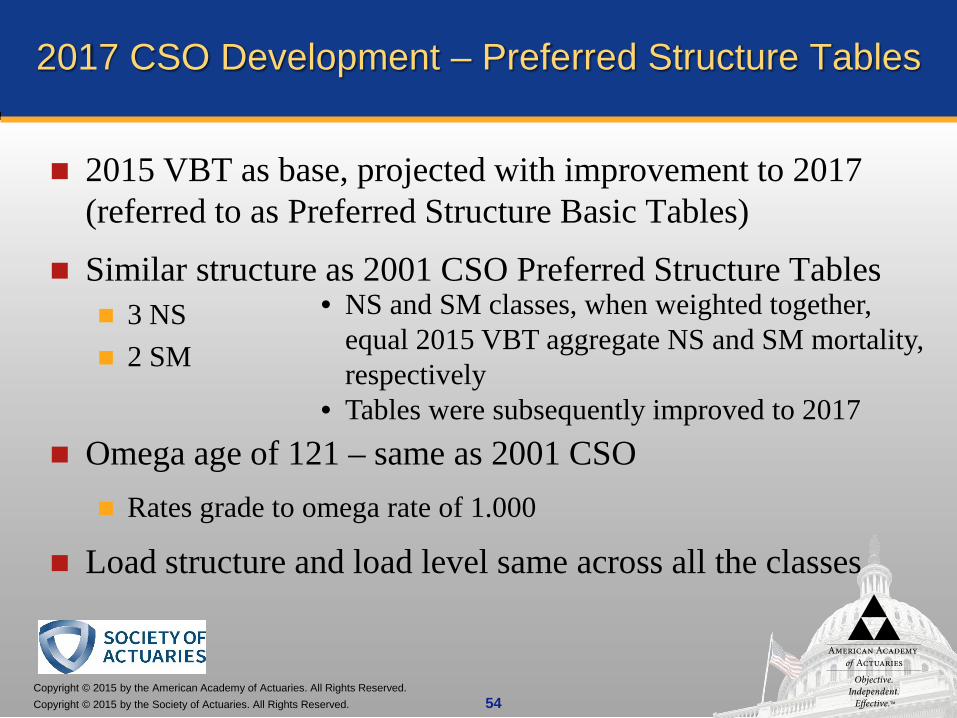
2017 CSO Development – Preferred Structure Tables
2015 VBT as base, projected with improvement to 2017 (referred to as Preferred Structure Basic Tables)
Similar structure as 2001 CSO Preferred Structure Tables 3 NS 2 SM
Omega age of 121 – same as 2001 CSO Rates grade to omega rate of 1.000
Load structure and load level same across all the classes
• NS and SM classes, when weighted together, equal 2015 VBT aggregate NS and SM mortality, respectively
• Tables were subsequently improved to 2017

Copyright © 2015 by the American Academy of Actuaries. All Rights Reserved.Copyright © 2015 by the Society of Actuaries. All Rights Reserved. 55
2017 CSO Development – Preferred Structure Tables, cont’d
Step 1: Assessed preferred experience based on the 2005-09 ILEC data collected for business issued under a preferred structure basis. Business for nonsmoker risks with 3 or more classes limited
to issues since 1990 resulting in little to no data beyond duration 15
Business for smoker/nonsmoker risk structures limited to issues since 1980s
Copyright © 2015 by the American Academy of Actuaries. All Rights Reserved.Copyright © 2015 by the Society of Actuaries. All Rights Reserved. 56
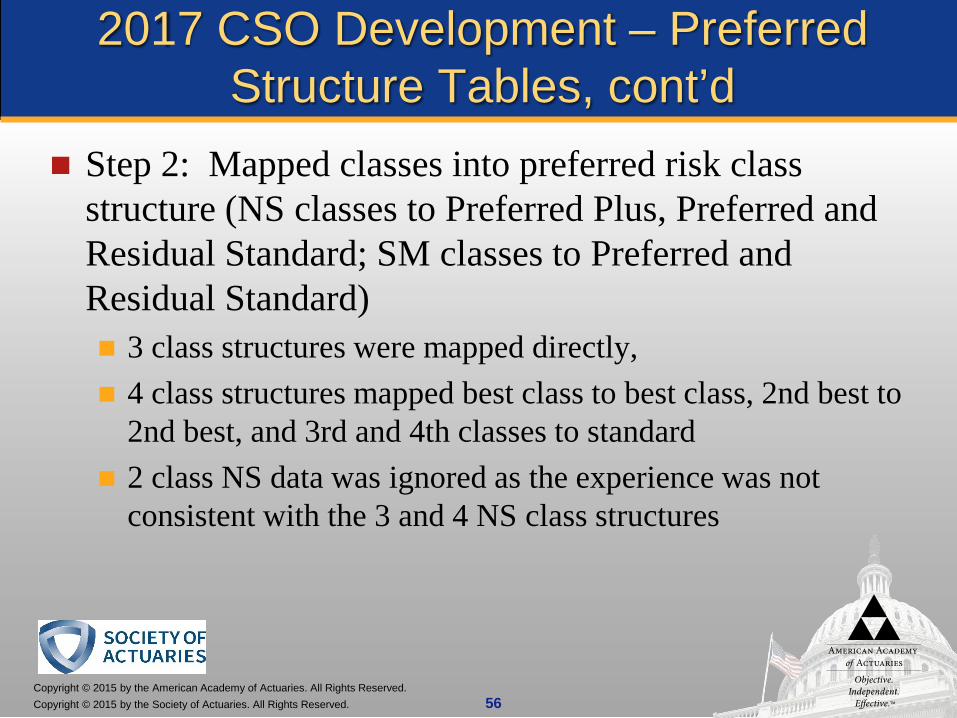
2017 CSO Development – Preferred Structure Tables, cont’d
Step 2: Mapped classes into preferred risk class structure (NS classes to Preferred Plus, Preferred and Residual Standard; SM classes to Preferred and Residual Standard) 3 class structures were mapped directly, 4 class structures mapped best class to best class, 2nd best to
2nd best, and 3rd and 4th classes to standard 2 class NS data was ignored as the experience was not
consistent with the 3 and 4 NS class structures

Copyright © 2015 by the American Academy of Actuaries. All Rights Reserved.Copyright © 2015 by the Society of Actuaries. All Rights Reserved. 57
2017 CSO Development – Preferred Structure Tables, cont’d
Step 3: Determined a single A/E estimate for the experience by combining All available durations Male and female (because UCS scored do not distinguish
between genders)
Step 4: Determined the Relative Risk of each class, using the combined male and female A/E to point to an RR table. For example, if A/E is 72%, then use 80% of RR 70 and 20% of RR 80
Copyright © 2015 by the American Academy of Actuaries. All Rights Reserved.Copyright © 2015 by the Society of Actuaries. All Rights Reserved. 58
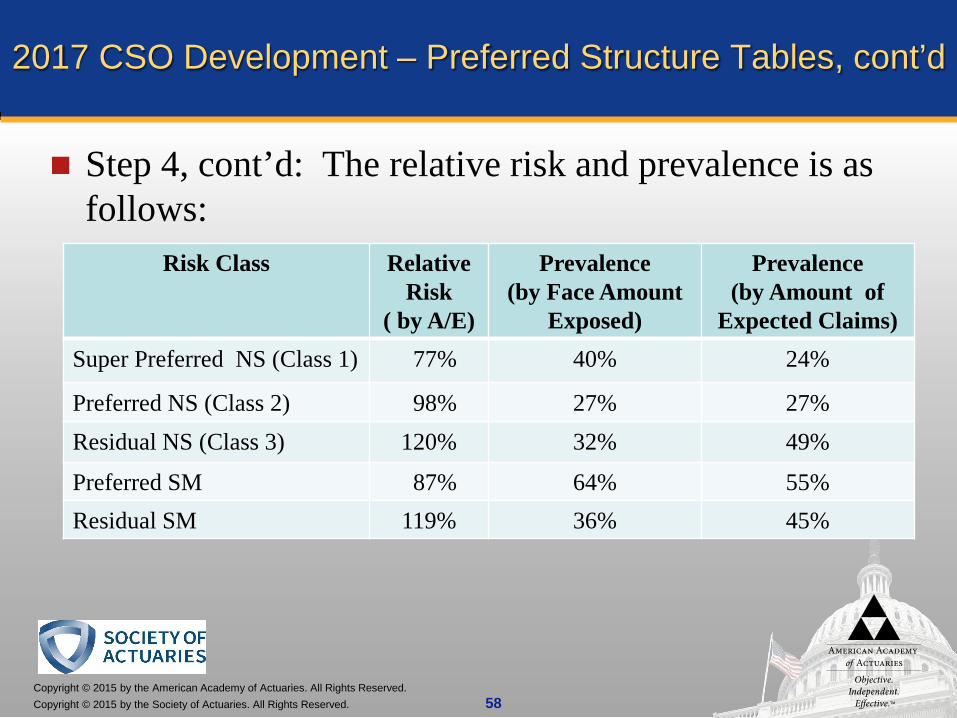
Step 4, cont’d: The relative risk and prevalence is as follows:
2017 CSO Development – Preferred Structure Tables, cont’d
Risk Class Relative Risk
( by A/E)
Prevalence(by Face Amount
Exposed)
Prevalence(by Amount of
Expected Claims)Super Preferred NS (Class 1) 77% 40% 24%
Preferred NS (Class 2) 98% 27% 27%Residual NS (Class 3) 120% 32% 49%
Preferred SM 87% 64% 55%Residual SM 119% 36% 45%
Copyright © 2015 by the American Academy of Actuaries. All Rights Reserved.Copyright © 2015 by the Society of Actuaries. All Rights Reserved. 59
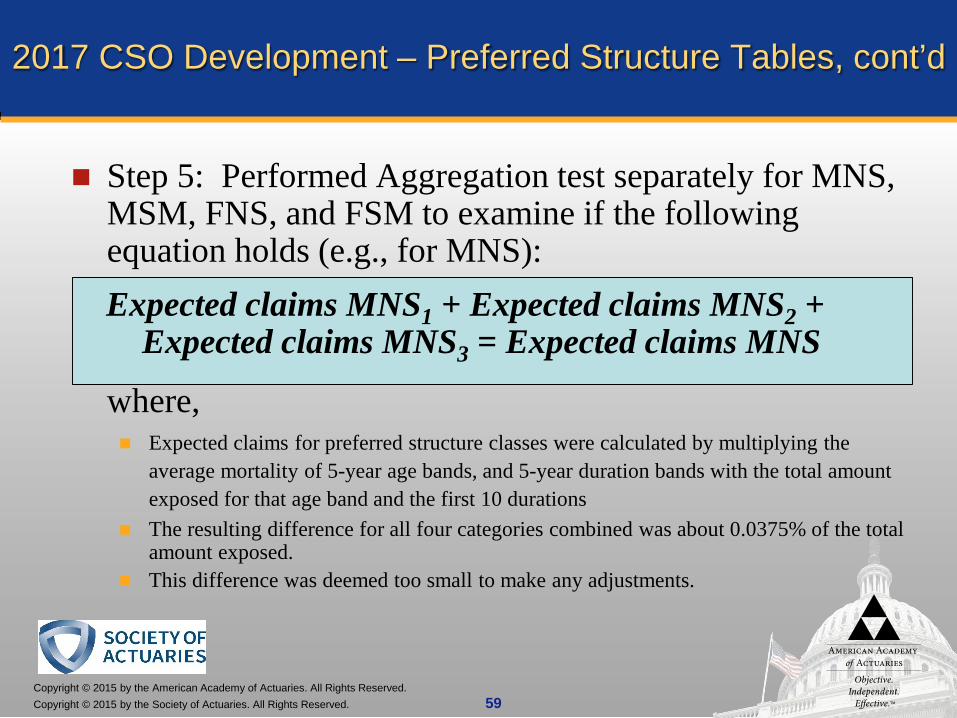
Step 5: Performed Aggregation test separately for MNS, MSM, FNS, and FSM to examine if the following equation holds (e.g., for MNS):Expected claims MNS1 + Expected claims MNS2 +
Expected claims MNS3 = Expected claims MNS
where, Expected claims for preferred structure classes were calculated by multiplying the
average mortality of 5-year age bands, and 5-year duration bands with the total amount exposed for that age band and the first 10 durations
The resulting difference for all four categories combined was about 0.0375% of the total amount exposed.
This difference was deemed too small to make any adjustments.
2017 CSO Development – Preferred Structure Tables, cont’d
Copyright © 2015 by the American Academy of Actuaries. All Rights Reserved.Copyright © 2015 by the Society of Actuaries. All Rights Reserved. 60
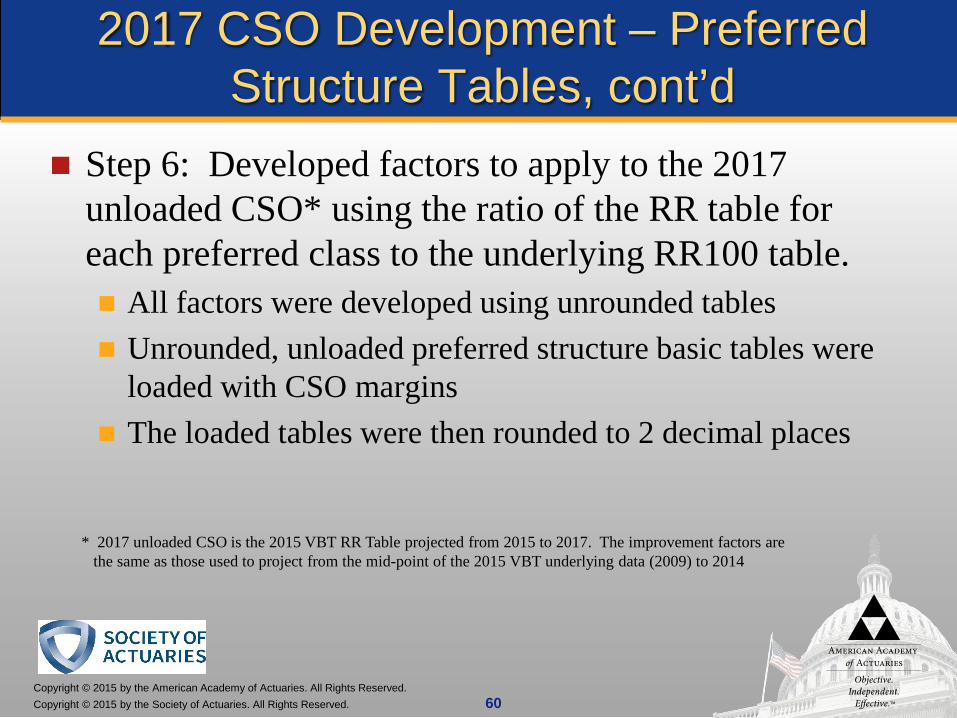
* 2017 unloaded CSO is the 2015 VBT RR Table projected from 2015 to 2017. The improvement factors are the same as those used to project from the mid-point of the 2015 VBT underlying data (2009) to 2014
2017 CSO Development – Preferred Structure Tables, cont’d
Step 6: Developed factors to apply to the 2017 unloaded CSO* using the ratio of the RR table for each preferred class to the underlying RR100 table. All factors were developed using unrounded tables Unrounded, unloaded preferred structure basic tables were
loaded with CSO margins The loaded tables were then rounded to 2 decimal places

Copyright © 2015 by the American Academy of Actuaries. All Rights Reserved.Copyright © 2015 by the Society of Actuaries. All Rights Reserved. 61
Preferred Structure Loads
Proposed 2017 CSO preferred structure tables have same percentage load for all tables Arguments in favor of varying load by class:
Must ‘qualify’ to use the super preferred table, so lesser need for load Resulting volatility of mortality in residual class may be higher than the
aggregate CSO, suggesting potential for higher load Arguments against:
More complicated table construction Need to assure tables weight back to the aggregate CSO table

Copyright © 2015 by the American Academy of Actuaries. All Rights Reserved.Copyright © 2015 by the Society of Actuaries. All Rights Reserved. 62
Preferred Structure Tables – Term Reserve ComparisonsSuper Preferred, Male, NS, Issue Age 40
* Select & Ultimate Table, 4.5% Interest Rate, Fully Continuous
Copyright © 2015 by the American Academy of Actuaries. All Rights Reserved.Copyright © 2015 by the Society of Actuaries. All Rights Reserved. 63
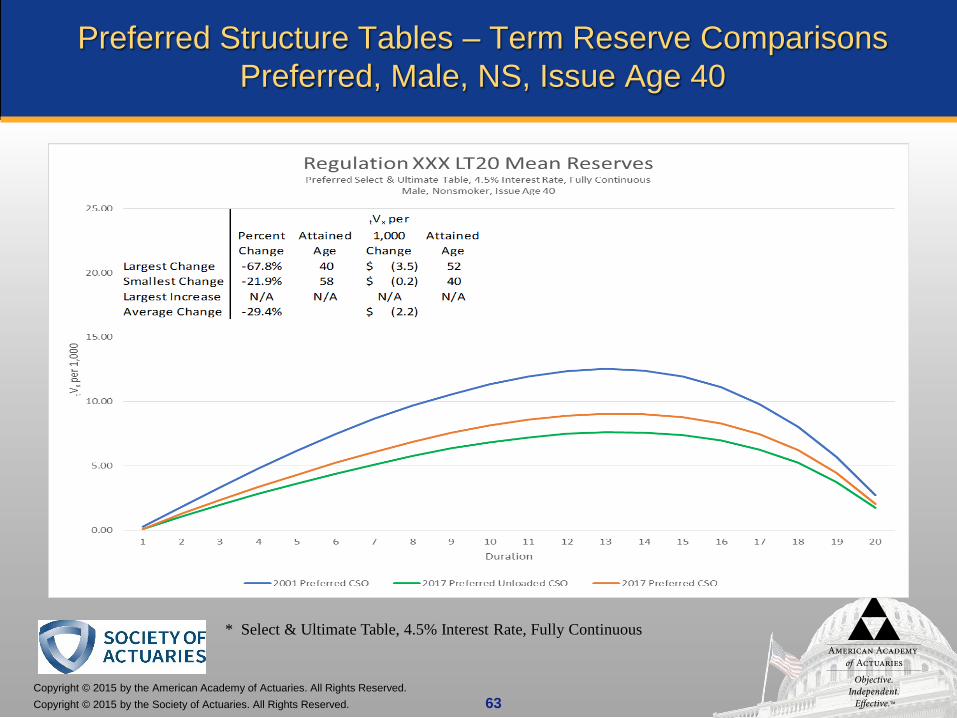
Preferred Structure Tables – Term Reserve ComparisonsPreferred, Male, NS, Issue Age 40
* Select & Ultimate Table, 4.5% Interest Rate, Fully Continuous
Copyright © 2015 by the American Academy of Actuaries. All Rights Reserved.Copyright © 2015 by the Society of Actuaries. All Rights Reserved. 64
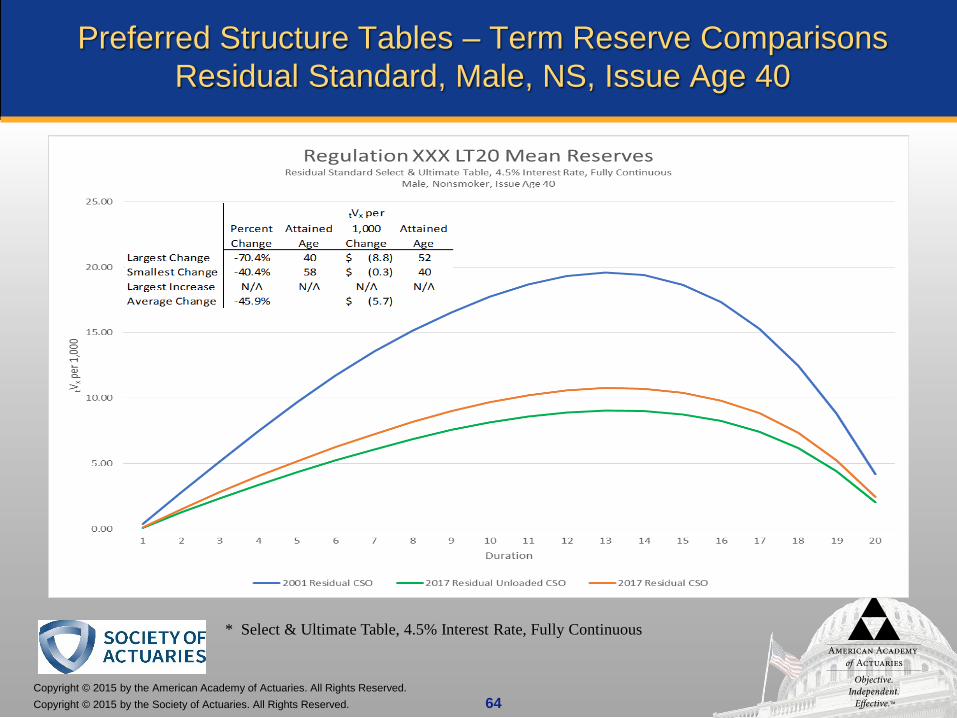
Preferred Structure Tables – Term Reserve ComparisonsResidual Standard, Male, NS, Issue Age 40
* Select & Ultimate Table, 4.5% Interest Rate, Fully Continuous

Copyright © 2015 by the American Academy of Actuaries. All Rights Reserved.Copyright © 2015 by the Society of Actuaries. All Rights Reserved. 65
Preferred Structure Tables – Term Reserve ComparisonsSuper Preferred, Female, NS, Issue Age 60
* Select & Ultimate Table, 4.5% Interest Rate, Fully Continuous
Copyright © 2015 by the American Academy of Actuaries. All Rights Reserved.Copyright © 2015 by the Society of Actuaries. All Rights Reserved. 66
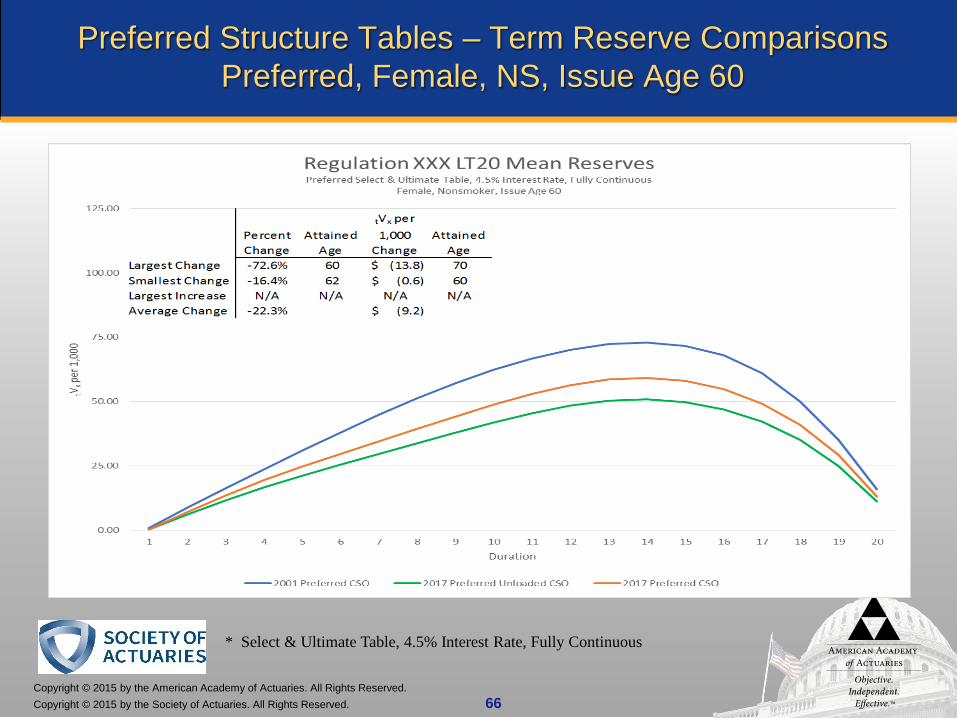
Preferred Structure Tables – Term Reserve ComparisonsPreferred, Female, NS, Issue Age 60
* Select & Ultimate Table, 4.5% Interest Rate, Fully Continuous
Copyright © 2015 by the American Academy of Actuaries. All Rights Reserved.Copyright © 2015 by the Society of Actuaries. All Rights Reserved. 67
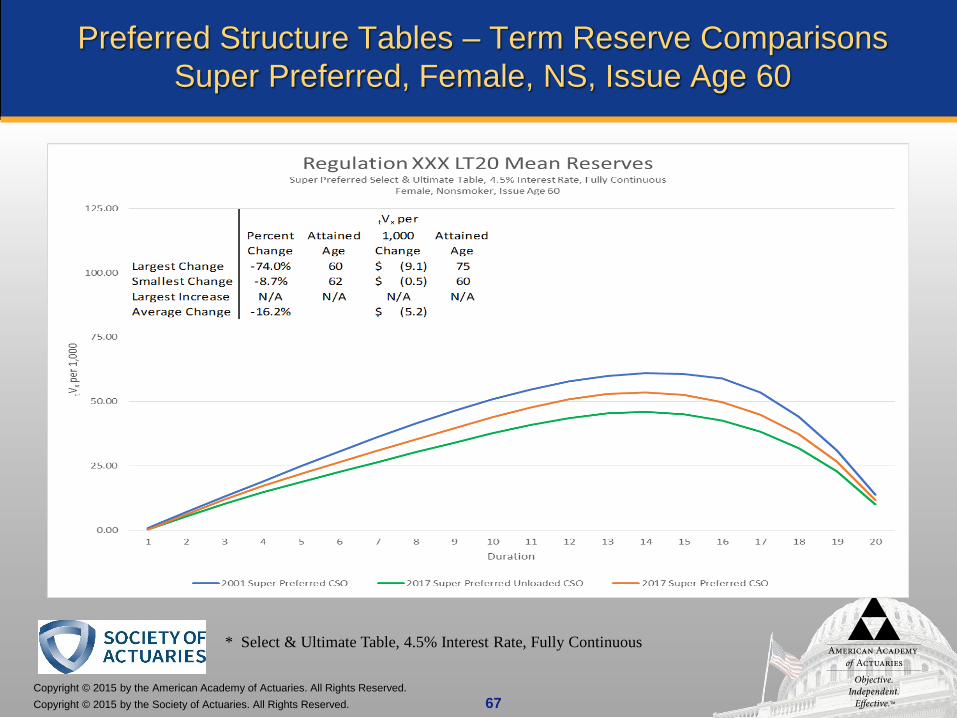
Preferred Structure Tables – Term Reserve ComparisonsSuper Preferred, Female, NS, Issue Age 60
* Select & Ultimate Table, 4.5% Interest Rate, Fully Continuous
Copyright © 2015 by the American Academy of Actuaries. All Rights Reserved.Copyright © 2015 by the Society of Actuaries. All Rights Reserved. 68
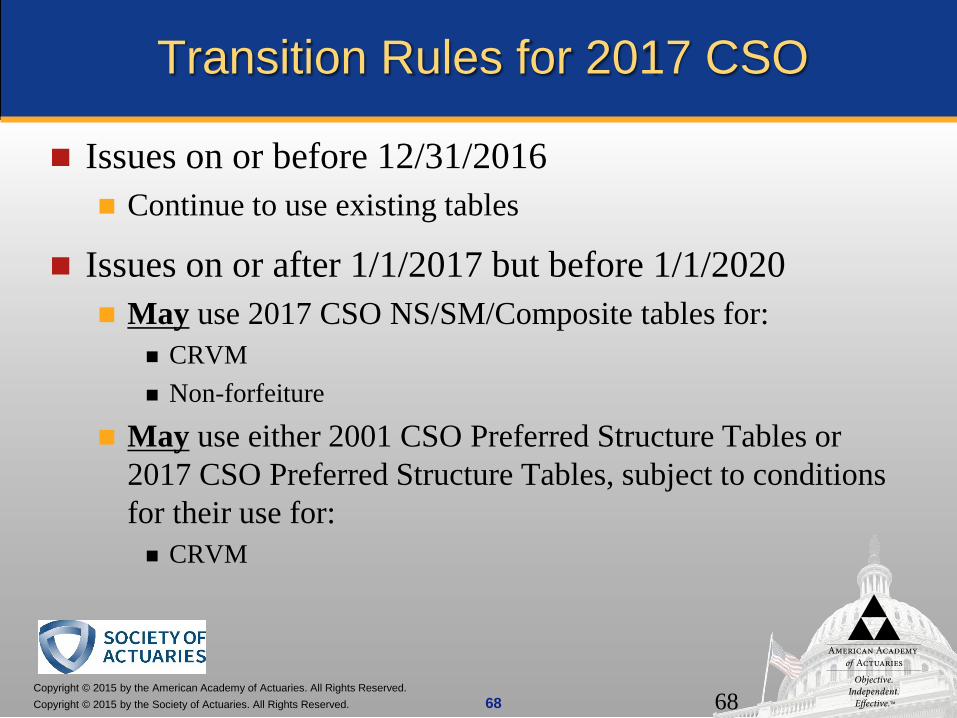
Transition Rules for 2017 CSO
Issues on or before 12/31/2016 Continue to use existing tables
Issues on or after 1/1/2017 but before 1/1/2020 May use 2017 CSO NS/SM/Composite tables for:
CRVM Non-forfeiture
May use either 2001 CSO Preferred Structure Tables or 2017 CSO Preferred Structure Tables, subject to conditions for their use for: CRVM
68
Copyright © 2015 by the American Academy of Actuaries. All Rights Reserved.Copyright © 2015 by the Society of Actuaries. All Rights Reserved. 69
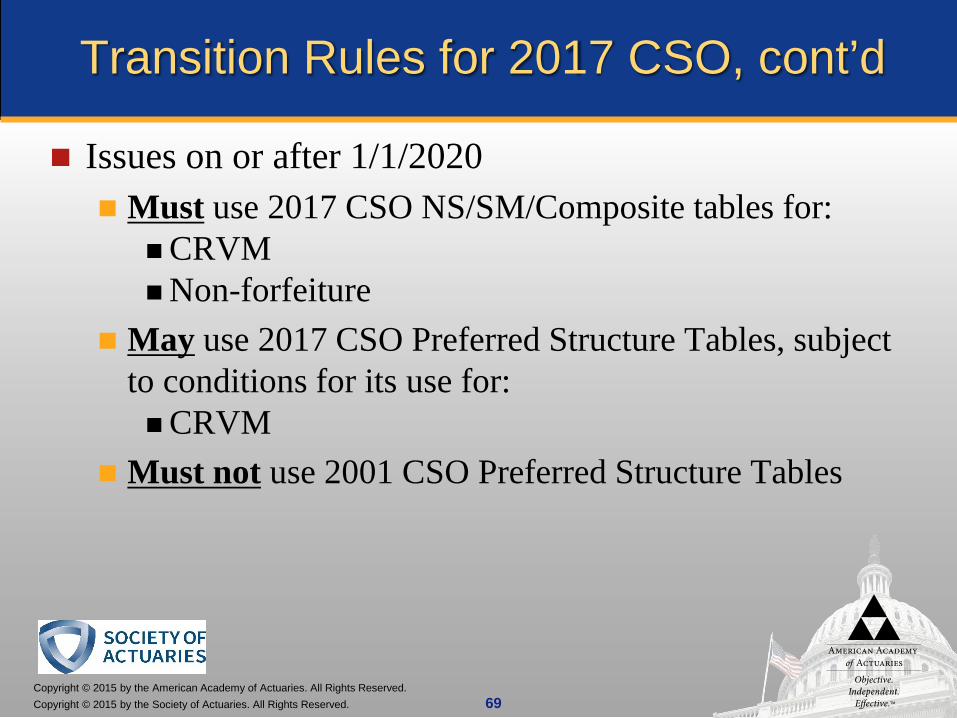
Transition Rules for 2017 CSO, cont’d
Issues on or after 1/1/2020 Must use 2017 CSO NS/SM/Composite tables for:
CRVMNon-forfeiture
May use 2017 CSO Preferred Structure Tables, subject to conditions for its use for:CRVM
Must not use 2001 CSO Preferred Structure Tables
Copyright © 2015 by the American Academy of Actuaries. All Rights Reserved.Copyright © 2015 by the Society of Actuaries. All Rights Reserved.
Dieter Gaubatz
Underwriting Criteria Score Calculator
Copyright © 2015 by the American Academy of Actuaries. All Rights Reserved.Copyright © 2015 by the Society of Actuaries. All Rights Reserved. 71
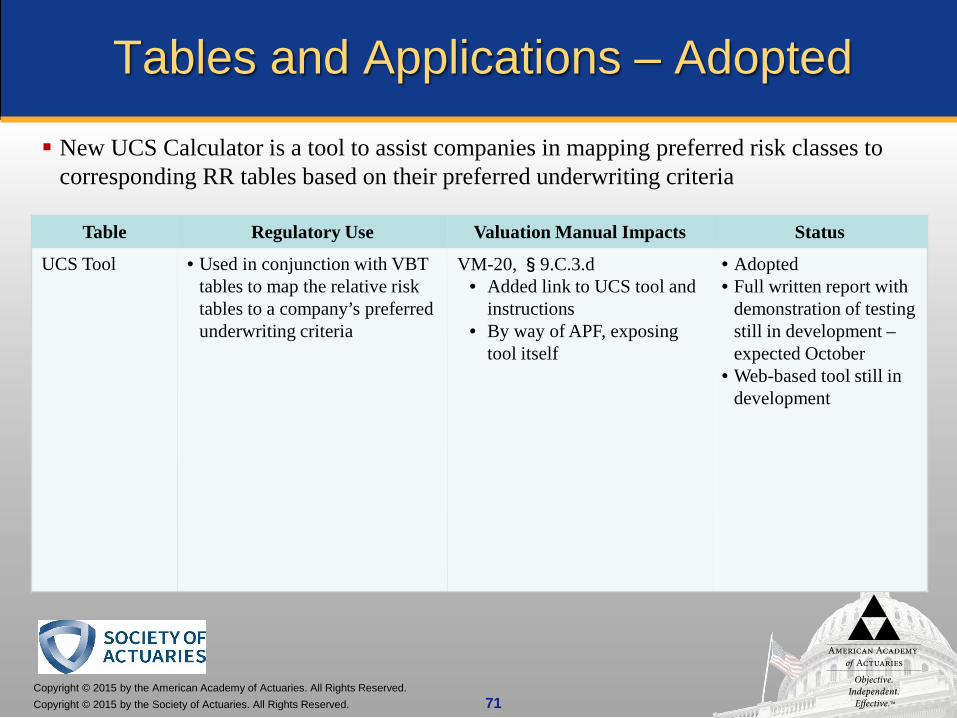
Tables and Applications – Adopted
Table Regulatory Use Valuation Manual Impacts Status
UCS Tool • Used in conjunction with VBT tables to map the relative risk tables to a company’s preferred underwriting criteria
VM-20, §9.C.3.d• Added link to UCS tool and
instructions• By way of APF, exposing
tool itself
• Adopted• Full written report with
demonstration of testing still in development –expected October
• Web-based tool still in development
New UCS Calculator is a tool to assist companies in mapping preferred risk classes to corresponding RR tables based on their preferred underwriting criteria
Copyright © 2015 by the American Academy of Actuaries. All Rights Reserved.Copyright © 2015 by the Society of Actuaries. All Rights Reserved. 72
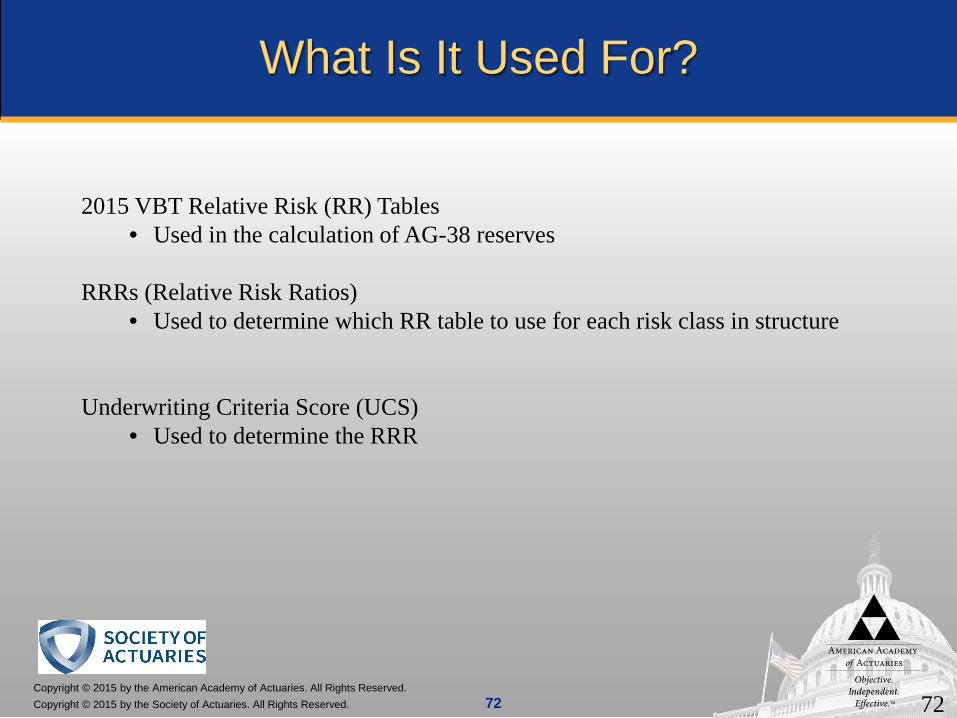
What Is It Used For?
72
2015 VBT Relative Risk (RR) Tables• Used in the calculation of AG-38 reserves
RRRs (Relative Risk Ratios) • Used to determine which RR table to use for each risk class in structure
Underwriting Criteria Score (UCS)• Used to determine the RRR

Copyright © 2015 by the American Academy of Actuaries. All Rights Reserved.Copyright © 2015 by the Society of Actuaries. All Rights Reserved. 73
Definitions
RR(R)
• Relative Risk (Ratio)• Mortality as % of average standard mortality for a specific characteristic cell(i.e. risk class mortality compared to average mortality for a specific gender, smoking status, issue age and duration issued as a standard risk)
UCS
• Underwriting Criteria Score• Equals RRR (at issue) score for a particular risk class
• Standard definition: Not classified as sub-standard (doesn’t require a table rating or flat extra, nor declined) in the underwriting process
73
Copyright © 2015 by the American Academy of Actuaries. All Rights Reserved.Copyright © 2015 by the Society of Actuaries. All Rights Reserved. 74
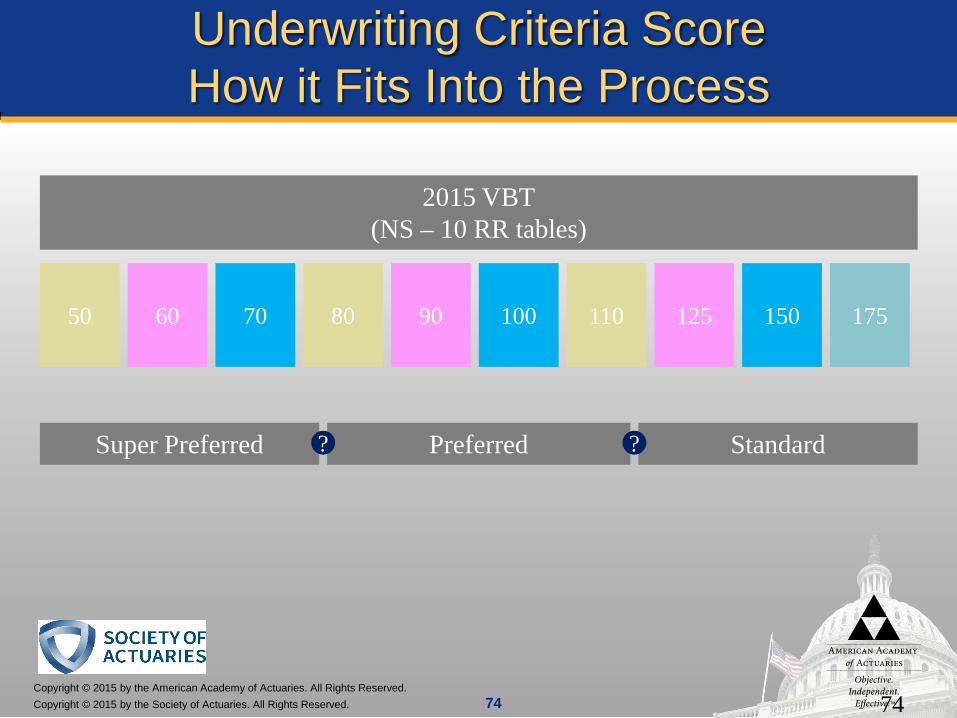
Underwriting Criteria ScoreHow it Fits Into the Process
2015 VBT(NS – 10 RR tables)
50 60 70 80 90 110 150100 125 175
Super Preferred Preferred Standard? ?
74
Copyright © 2015 by the American Academy of Actuaries. All Rights Reserved.Copyright © 2015 by the Society of Actuaries. All Rights Reserved. 75
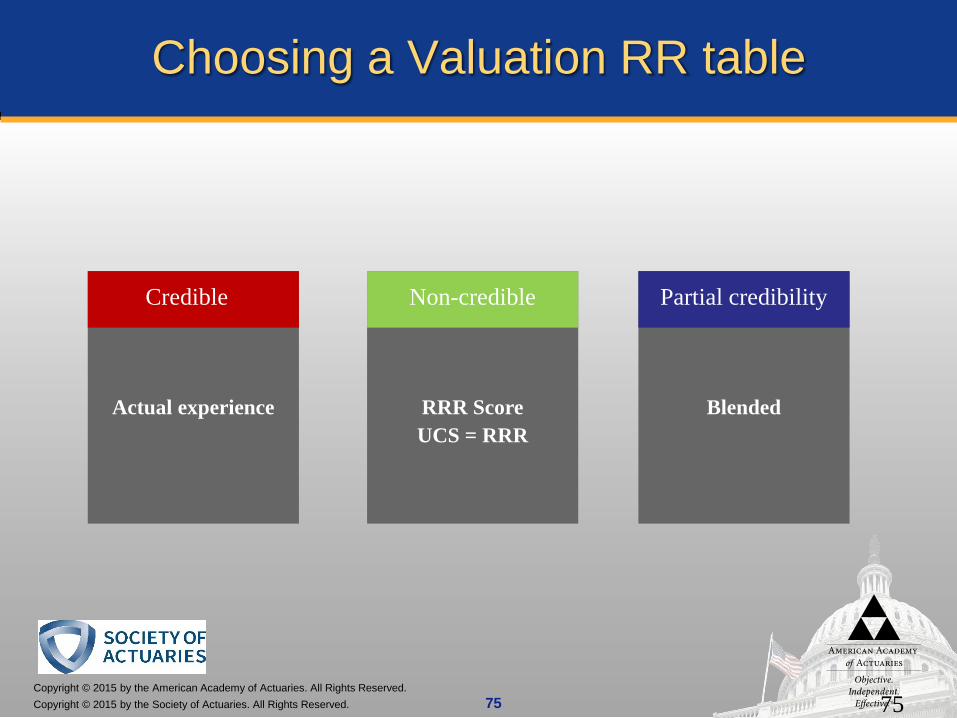
BlendedRRR Score UCS = RRR
Actual experience
Choosing a Valuation RR table
Credible Non-credible Partial credibility
75
Copyright © 2015 by the American Academy of Actuaries. All Rights Reserved.Copyright © 2015 by the Society of Actuaries. All Rights Reserved. 76
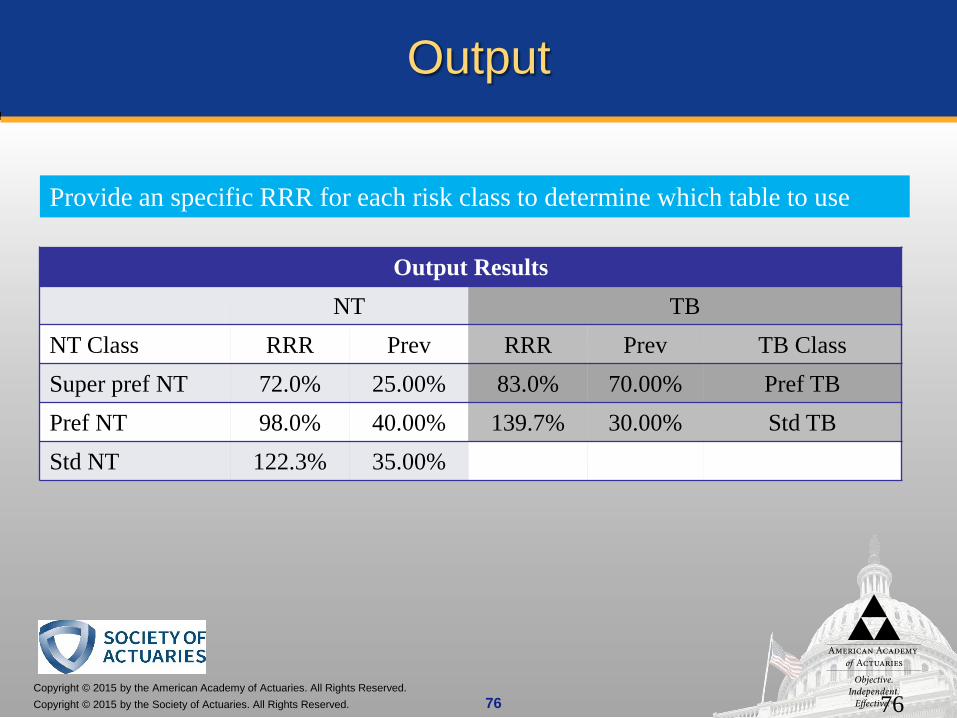
Output
Provide an specific RRR for each risk class to determine which table to use
Output ResultsNT TB
NT Class RRR Prev RRR Prev TB ClassSuper pref NT 72.0% 25.00% 83.0% 70.00% Pref TBPref NT 98.0% 40.00% 139.7% 30.00% Std TBStd NT 122.3% 35.00%
76
Copyright © 2015 by the American Academy of Actuaries. All Rights Reserved.Copyright © 2015 by the Society of Actuaries. All Rights Reserved. 77
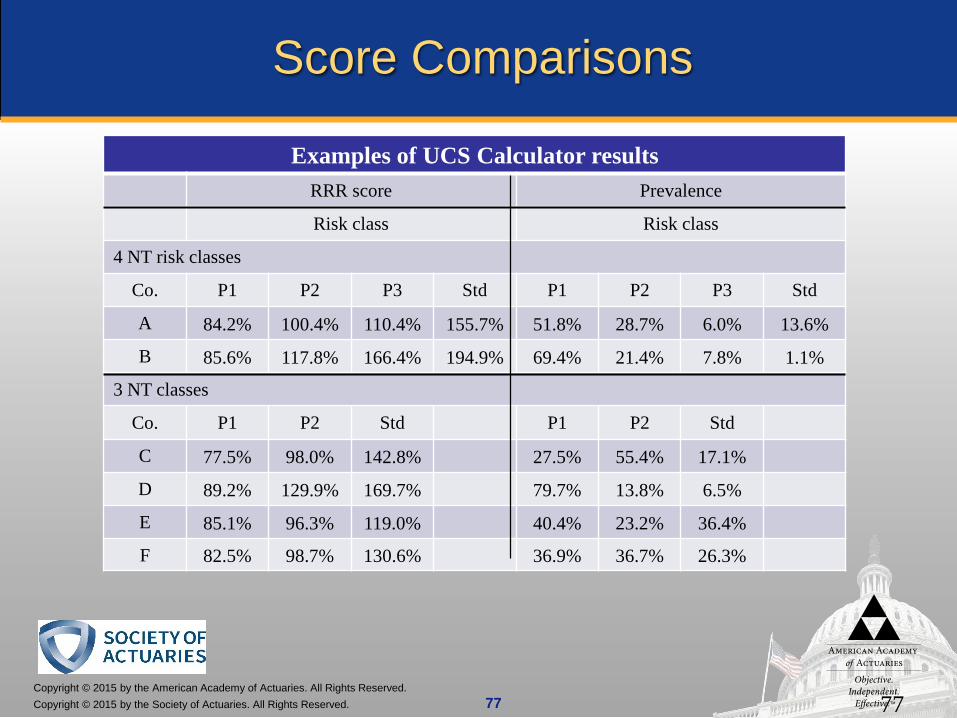
Score Comparisons
Examples of UCS Calculator resultsRRR score Prevalence
Risk class Risk class
4 NT risk classes
Co. P1 P2 P3 Std P1 P2 P3 Std
A 84.2% 100.4% 110.4% 155.7% 51.8% 28.7% 6.0% 13.6%
B 85.6% 117.8% 166.4% 194.9% 69.4% 21.4% 7.8% 1.1%
3 NT classes
Co. P1 P2 Std P1 P2 Std
C 77.5% 98.0% 142.8% 27.5% 55.4% 17.1%
D 89.2% 129.9% 169.7% 79.7% 13.8% 6.5%
E 85.1% 96.3% 119.0% 40.4% 23.2% 36.4%
F 82.5% 98.7% 130.6% 36.9% 36.7% 26.3%
77
Copyright © 2015 by the American Academy of Actuaries. All Rights Reserved.Copyright © 2015 by the Society of Actuaries. All Rights Reserved. 78
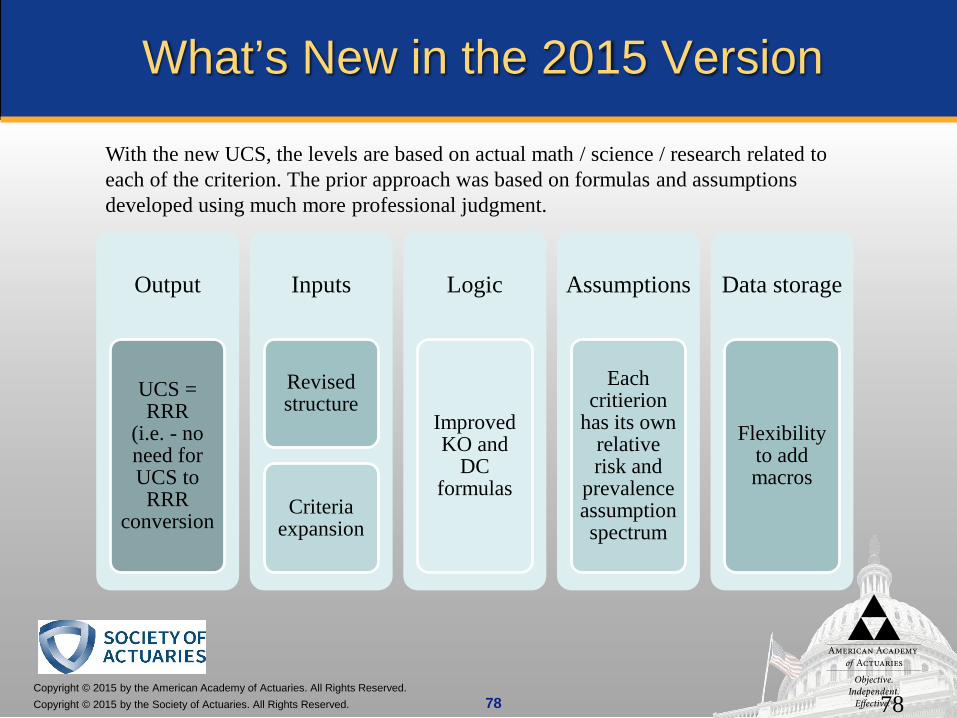
What’s New in the 2015 Version
Output
UCS = RRR
(i.e. - no need for UCS to RRR
conversion
Inputs
Revised structure
Criteria expansion
Logic
Improved KO and
DC formulas
Assumptions
Each critierion
has its own relative risk and
prevalence assumption spectrum
Data storage
Flexibility to add macros
78
With the new UCS, the levels are based on actual math / science / research related to each of the criterion. The prior approach was based on formulas and assumptions developed using much more professional judgment.
Copyright © 2015 by the American Academy of Actuaries. All Rights Reserved.Copyright © 2015 by the Society of Actuaries. All Rights Reserved. 79
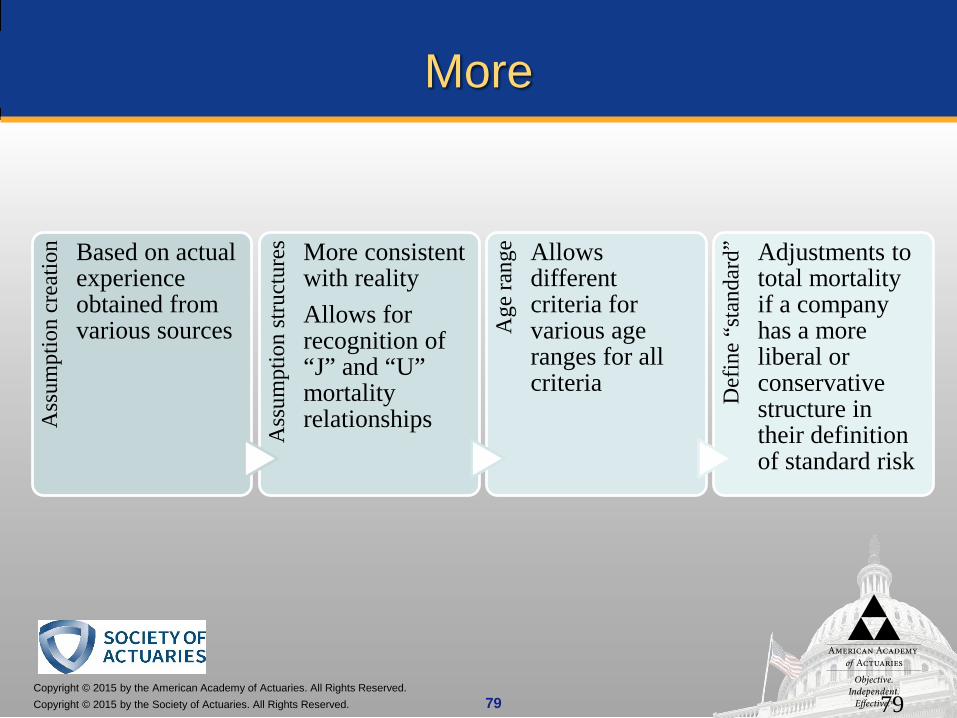
MoreA
ssum
ptio
n cr
eatio
n Based on actual experience obtained from various sources
Ass
umpt
ion
stru
ctur
es More consistent with realityAllows for recognition of “J” and “U” mortality relationships
Age
rang
e Allows different criteria for various age ranges for all criteria D
efin
e “s
tand
ard” Adjustments to
total mortality if a company has a more liberal or conservative structure in their definition of standard risk
79
Copyright © 2015 by the American Academy of Actuaries. All Rights Reserved.Copyright © 2015 by the Society of Actuaries. All Rights Reserved. 80
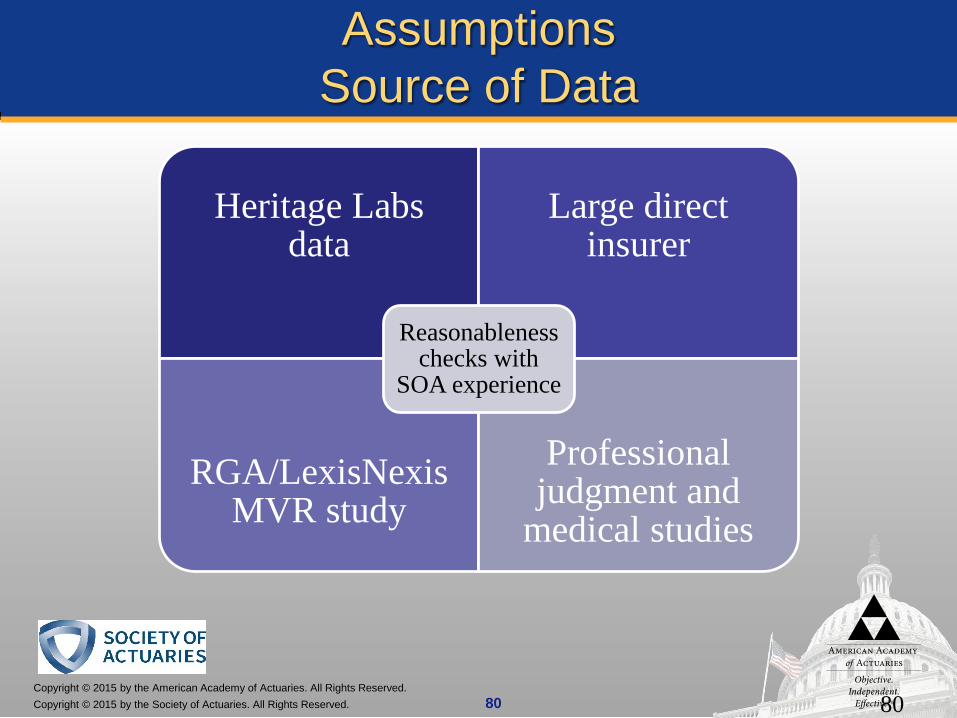
AssumptionsSource of Data
Heritage Labs data
Large direct insurer
RGA/LexisNexis MVR study
Professional judgment and
medical studies
Reasonableness checks with
SOA experience
80
Copyright © 2015 by the American Academy of Actuaries. All Rights Reserved.Copyright © 2015 by the Society of Actuaries. All Rights Reserved. 81
0%
2%
4%
6%
8%
10%
12%
14%
0%
50%
100%
150%
200%
250%
300%
15 19 23 27 31 35 39
Prev
RRR
Prevalence
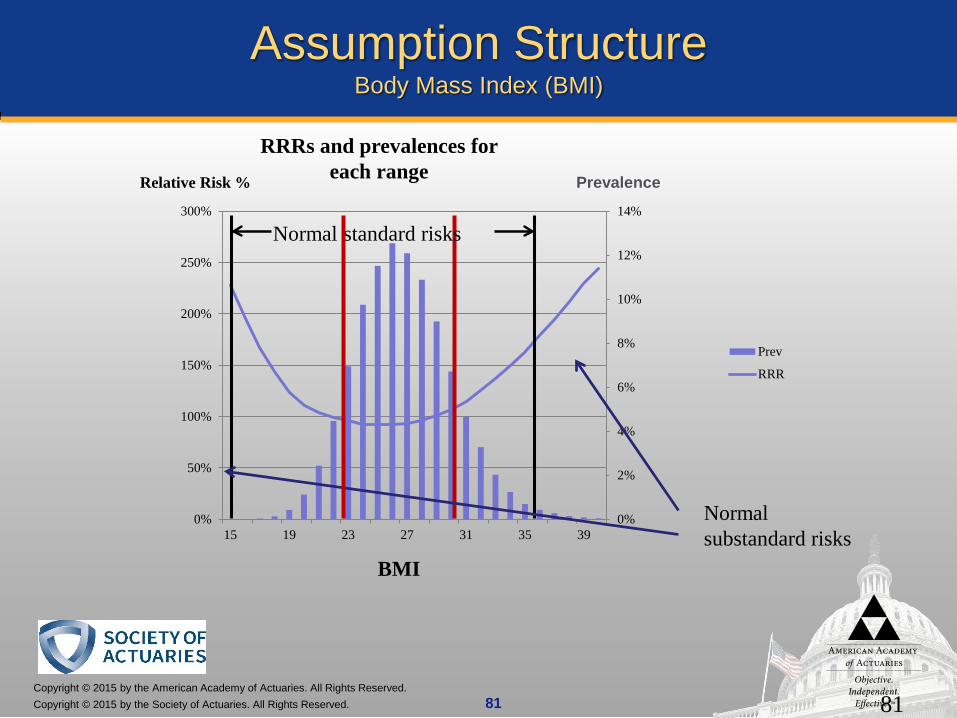
Assumption StructureBody Mass Index (BMI)
Relative Risk %
BMI
RRRs and prevalences for each range
Normal substandard risks
Normal standard risks
81
Copyright © 2015 by the American Academy of Actuaries. All Rights Reserved.Copyright © 2015 by the Society of Actuaries. All Rights Reserved. 82
0%2%4%6%8%10%12%14%
0%50%
100%150%200%250%300%
15 19 23 27 31 35 39
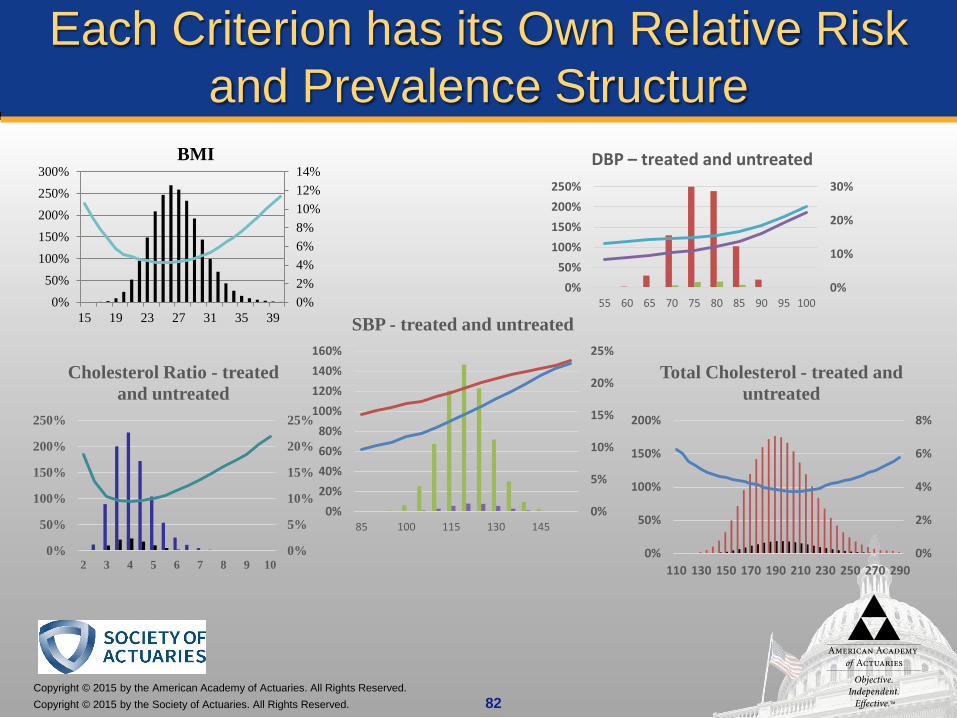
Each Criterion has its Own Relative Risk and Prevalence Structure
BMI
0%
10%
20%
30%
0%50%
100%150%200%250%
55 60 65 70 75 80 85 90 95 100
DBP – treated and untreated
0%
5%
10%
15%
20%
25%
0%
50%
100%
150%
200%
250%
2 3 4 5 6 7 8 9 10
Cholesterol Ratio - treated and untreated
0%
2%
4%
6%
8%
0%
50%
100%
150%
200%
110 130 150 170 190 210 230 250 270 290
Total Cholesterol - treated and untreated
0%
5%
10%
15%
20%
25%
0%20%40%60%80%
100%120%140%160%
85 100 115 130 145
SBP - treated and untreated
Copyright © 2015 by the American Academy of Actuaries. All Rights Reserved.Copyright © 2015 by the Society of Actuaries. All Rights Reserved. 83
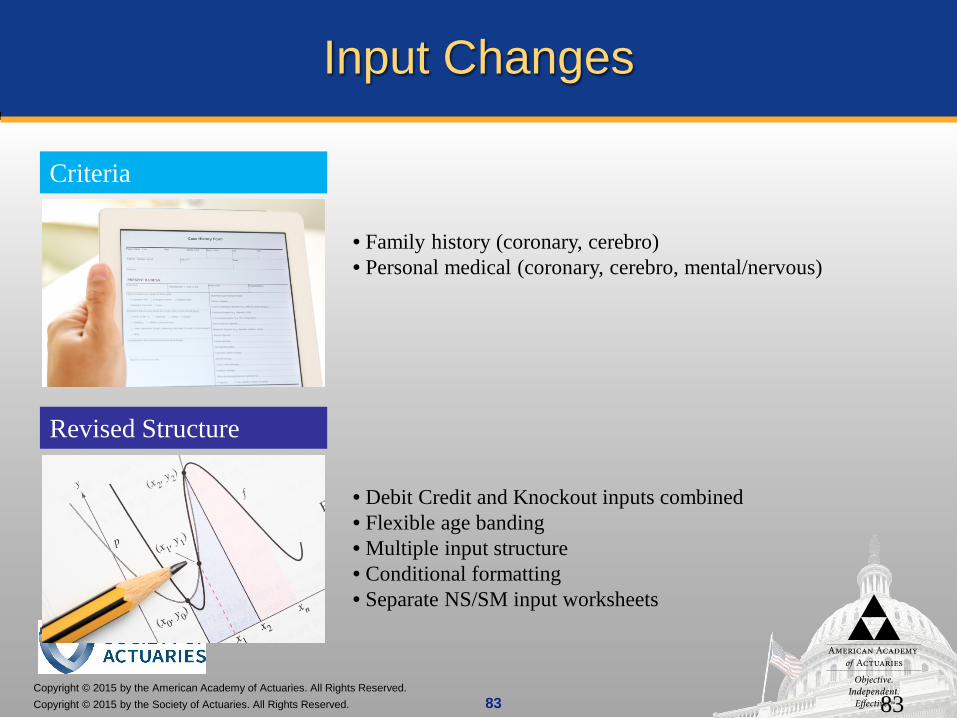
Input Changes
Criteria
Revised Structure
• Family history (coronary, cerebro)• Personal medical (coronary, cerebro, mental/nervous)
• Debit Credit and Knockout inputs combined• Flexible age banding• Multiple input structure • Conditional formatting• Separate NS/SM input worksheets
83
Copyright © 2015 by the American Academy of Actuaries. All Rights Reserved.Copyright © 2015 by the Society of Actuaries. All Rights Reserved. 85
What’s Next?
Remaining work
Full reportWeb-based
chassis solution
85
Copyright © 2015 by the American Academy of Actuaries. All Rights Reserved.Copyright © 2015 by the Society of Actuaries. All Rights Reserved. 86
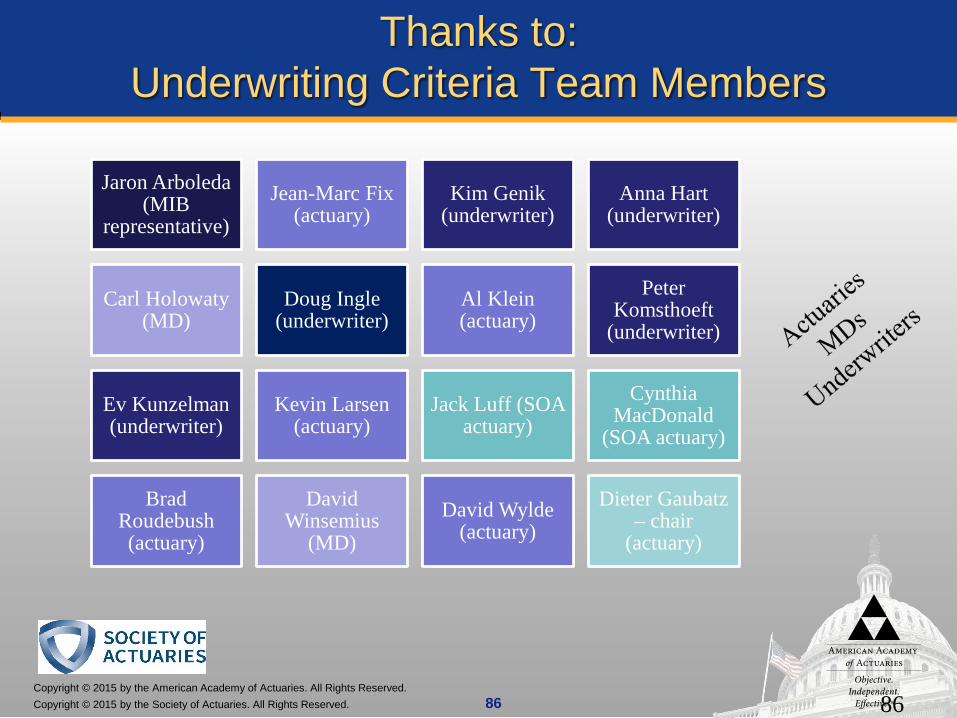
Thanks to:Underwriting Criteria Team Members
Jaron Arboleda (MIB
representative)Jean-Marc Fix
(actuary)Kim Genik
(underwriter)Anna Hart
(underwriter)
Carl Holowaty (MD)
Doug Ingle (underwriter)
Al Klein (actuary)
Peter Komsthoeft
(underwriter)
Ev Kunzelman (underwriter)
Kevin Larsen (actuary)
Jack Luff (SOA actuary)
Cynthia MacDonald
(SOA actuary)
Brad Roudebush (actuary)
David Winsemius
(MD)David Wylde
(actuary)Dieter Gaubatz
– chair (actuary)
86

Copyright © 2015 by the American Academy of Actuaries. All Rights Reserved.Copyright © 2015 by the Society of Actuaries. All Rights Reserved. 87
Calculation Logic – Combining CriteriaKnock-out
Risk Class RRR Prev
1 94% 74.1%2 109% 12.5%3 122% 13.4%
Risk Class RRR Prev
1 90% 60.0%2 105% 30.0%3 145% 10.0%
Risk Class Prev RRRBuild DBP RC Build DBP Final Build DBP Final
1 1 1 74.1% 60.0% 44.5% 94.4% 90.0% 85.0%1 2 2 74.1% 30.0% 22.2% 94.4% 105.0% 99.1%1 3 3 74.1% 10.0% 7.4% 94.4% 145.0% 136.9%2 1 2 12.5% 60.0% 7.5% 109.4% 90.0% 98.4%2 2 2 12.5% 30.0% 3.8% 109.4% 105.0% 114.8%2 3 3 12.5% 10.0% 1.3% 109.4% 145.0% 158.6%3 1 3 13.4% 60.0% 8.0% 122.1% 90.0% 109.9%3 2 3 13.4% 30.0% 4.0% 122.1% 105.0% 128.2%3 3 3 13.4% 10.0% 1.3% 122.1% 145.0% 177.1%
Build Diastolic BP
x = x =
Assumes independence
RC Prev RRR
1 44.5% 85.0%
2 33.5% 100.7%
3 22.1% 129.2%
sum
RRR is a sumproduct
© 2014 Munich American Reassurance Company. All rights reserved. 87
Copyright © 2015 by the American Academy of Actuaries. All Rights Reserved.Copyright © 2015 by the Society of Actuaries. All Rights Reserved.
Questions?Contact Information
Mary J. Bahna-Nolan, MAAA, FSA, CERAExecutive Vice President, Head of Life R&DSCOR Global [email protected](312) 544-5029
Dieter Gaubatz, MAAA, FSA, FCIA2nd Vice President, Client LiaisonMunich [email protected](770) 350-3278