session 44ab new models for efficient & effective ... · 1 new models for efficient &...
TRANSCRIPT

Prepared for the Foundation of the American College of Healthcare Executives
Session 44AB New Models for Efficient & Effective
Healthcare Operations: Lessons Learned
Presented by: Stephen Sibbitt, MD
Robert Pryor, MD


1
New Models for Efficient & Effective Healthcare Operations: Lessons
Learned
Disclosure of Relevant Financial Relationships
The following faculty of this continuing education activity has no relevant financial relationships with commercial interests to disclose:
• Stephen Sibbitt, MD, MBA, FACP
• Robert Pryor, MD, MBA
2
2
Introduction of Speakers
Robert W. Pryor, MD, MBASenior Vice President
Kaufman Hall
Stephen Sibbitt, MD, MBA, FACP Chief Medical Officer
Baylor Scott & White Health, Temple Region
3
Learning Objectives
• Discuss how to become an adaptive healthcare organization
• Learn an approach to systematic assessment and improvement of clinical and administrative processes
• Understand how Baylor Scott & White Health applied the Toyota Lean principles of complex adaptive systems, and the results achieved to date
4

3
Agenda
• Physician Integration in Health Systems: Two Different Models
• How the Clinic Model Promotes “Practice Efficiency”
– The Scott & White Clinic model as example
• Ten Examples of Clinic Model Success
– Factors Contributing to Success
• Introduction of Lean Leadership Management
– Building a Culture of Continuous Improvement
– Examples of Successful Projects
• Practice Efficiency and Other Considerations
• Adoption of Change: Focus on Advanced Practice Professionals
• Summary
5
Physician Integration in Health Systems: Two Different Models
Clinic Model
• Strategic growth– Rationalization of subspecialties
– Advanced practice professionals
– New sites
– Access
• Have governance structure and administrative structure
• Low‐margin specialties can becross‐subsidized within clinic
• Best care is clinic care
• Clinic culture
Acquire Practices
• “Targets of opportunity”– Hospital based
– Cardiology
– Orthopedic
• Fit them into existing hospital structure
• Physician compensation: individual profit/loss
• Leakage vs. “keepage”
• Retain independent culture
6

4
Issues Related to Growth/Scale
• Network Adequacy
– Contracted lives
• Economies
– Purchasing
– Overhead
– Management
– Access to capital
• Diseconomies
– Communication
– Maintain and promote culture
– Redundancies
7
MIPS Proposed Rule Estimated Impact on Total Allowed Charges by Practice Size
Practice SizeEligible
Clinicians*
Eligible Clinicians with Negative Adjustment
Eligible Clinicians with
Positive Adjustment
Solo 102,788 87.0% 12.9%
2‐9 Eligible Clinicians 123,695 69.9% 29.8%
10‐24 Eligible Clinicians 81,207 59.4% 40.3%
25‐99 Eligible Clinicians 147,976 44.9% 54.5%
100+ Eligible Clinicians 305,676 18.3% 81.3%
*Note: For years 1 and 2, eligible clinicians are physicians (MD/DO and DMD/DDS), physician assistants, nurse practitioners, clinical nurse specialists, and certified registered nurse anesthetists; in years 3+, CMS may broaden the definition
8

5
Sample Clinic Structure
9
How Does the Clinic Model Promote “Practice Efficiency?”
• Consider within context of:
– Local environment
– Market forces
– Cultural norms of practices
• Broader than visits/RVUs and direct costs
• We will discuss from the perspective of a group model in CTX
– Description of that to follow
10

6
Building Culture
• Long history is helpful, but not necessary
• Culture is passed by telling stories
11
The Early Years in Temple, Texas and the Scott & White Clinic
12

7
The Early Years in Temple, Texas and the Scott & White Clinic
13
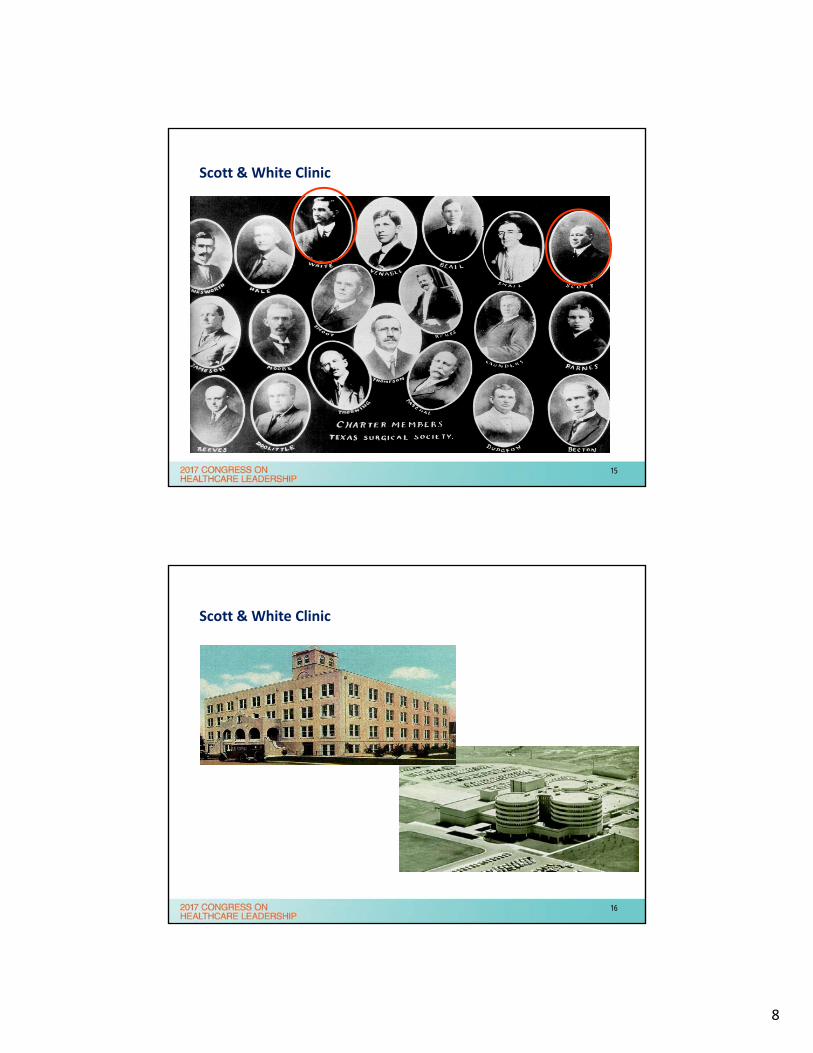
History of the Scott & White Clinic
• Origin as a physician‐led group practice from late 1890s
• Quality focus/one‐stop shopping
• Research and education always part of mission…
– Large GME program and affiliation with a medical school
– Research department begun in the early 60s
• Embraced HMO concept in late 70s
– Developed Primary Care Regional system of clinics
• Consolidated for‐profit clinic with NFP hospital in early 2000s
• Regional clinic expansion into Waco, College Station, Round Rock, and Hill Country
14
8
Scott & White Clinic
15
Scott & White Clinic
16

9
Scott & White Clinic
17
October 2013 Merger Created Baylor Scott & White Health
18

10
October 2013 Merger (continued)
19
Ability to Assume Risk
Working together as an integrated delivery system, Scott & White Memorial Hospital, the Scott & White Clinic, and the Scott & White Health Plan were ranked in the Dartmouth Atlas as among the lowest cost and highest quality healthcare systems in the mid‐2000s.
20

11
Health Plan Market Reach
• Contracts with more than 8,500 physicians and 90 hospitals
• Approximately 300,000 members
• #1 plan in Texas for commercial and Medicare for 3rd year in a row, as ranked by NCQA
• Rated 4 stars by Centers for Medicare and Medicaid Services
North TexasCentral TexasSW Health PlanSW Health Plan Filings
21
Management
• Coordinated and integrated clinic management
22

12
Operating Structure/Principles at Legacy S&W
Keys to efficiency and effectiveness
• Physician/Admin dyad evolved
– Triad …and eventually a team of 4
• CMO/CNO/Admin/CFO
• Regional budgetary control over inpatient and outpatient services
– Coordination of ISFP across regions
• MORs
– Performance goals for Finance, People, Quality/Safety, Service, Growth, and Academics
23
Operating Principles
• Promotion (early adoption) of Lean
– Lean management training
• Promotion of APPs
– Role in governance and ex‐officio member with Board of Directors
• Adoption of PCMH with team‐based care
– Mental health services within primary care settings
• Clinical Pathway development
– QA work
• Access improvement efforts
– Same‐Day Access
24

13
Ten Examples of Clinic Model Success
• Speed and efficiency of implementation
• Positive outcomes (administrative and/or clinical)
25
1. Same‐Day Clinic Appointments – Background
• Access was a problem: S&W = Sit and Wait
• Service metrics and revenue challenges prompted action
• Leadership decision
• SDA = same‐day appointment offered with any provider in any site if call received before noon, or next day if received after noon
• Few excluded: Dermatology, Mental Health, and Pain clinics
26

14
1. Same‐Day Clinic Appointments – Plan
• Immediate implementation of same‐day appointments—all regions, all clinics (few exceptions)
– CEO mandate… MAKE IT HAPPEN
– Endorsed by Senior Executive Committee and Board of Directors
– SDA Task Force working since August 13
• Comprised of 70 individuals, including regional leadership, regional Contact Center managers, Chairman, IT, marketing
– Rapid training of Contact Centers and clinic staff commencing
• Rapid implementation related to clinic management structure and shared values with common mission
27
1. Same‐Day Clinic Appointments – Success
From 2/01/2014 to 7/28/2016
SDA Requests SDA AccommodatedPercent
Accommodated 1,324,351 1,259,142 95.08%
28

15
2. EPIC Roll Out
• Large single day “go‐live” for large region that included 3 hospitals and 30+ clinic sites
• Physician Resistance (http://www.healthcareis.com/blog/why‐your‐hospital‐should‐aim‐for‐cpoe‐adoption‐rates‐of‐90 )
– Often one of the main barriers to CPOE adoption
– Concern that CPOE systems will create more work; cling to their traditional paper‐based ordering methods
29
2. EPIC Roll‐Out: CPOE ComplianceProject Phoenix – Go‐Live KPI Report
What is the overview of the metric?
The graph is measuring CPOE usage based on the HIMSS requirement of 90% for inpatient hospitals and 95% for clinics
Reporting As of 12:00AM 4/10/2014
30

16
What is the overview of the metric?
The graph is measuring CPOE usage based on the HIMSS requirement of 90% for inpatient hospitals and 95% for clinics
2. EPIC Roll‐Out: CPOE ComplianceProject Phoenix – Go‐Live KPI Report
Reporting As of 12:00AM 4/10/2014
31
What is the overview of the metric?
The graph is measuring CPOE usage based on the HIMSS requirement of 90% for inpatient hospitals and 95% for clinics
2. EPIC Roll‐Out: CPOE ComplianceProject Phoenix – Go‐Live KPI Report
Reporting As of 12:00AM 4/10/2014
32

17
What is the overview of the metric?
The graph is measuring CPOE usage based on the HIMSS requirement of 90% for inpatient hospitals and 95% for clinics
2. EPIC Roll‐Out: CPOE ComplianceProject Phoenix – Go‐Live KPI Report
Reporting As of 12:00AM 4/10/2014
33
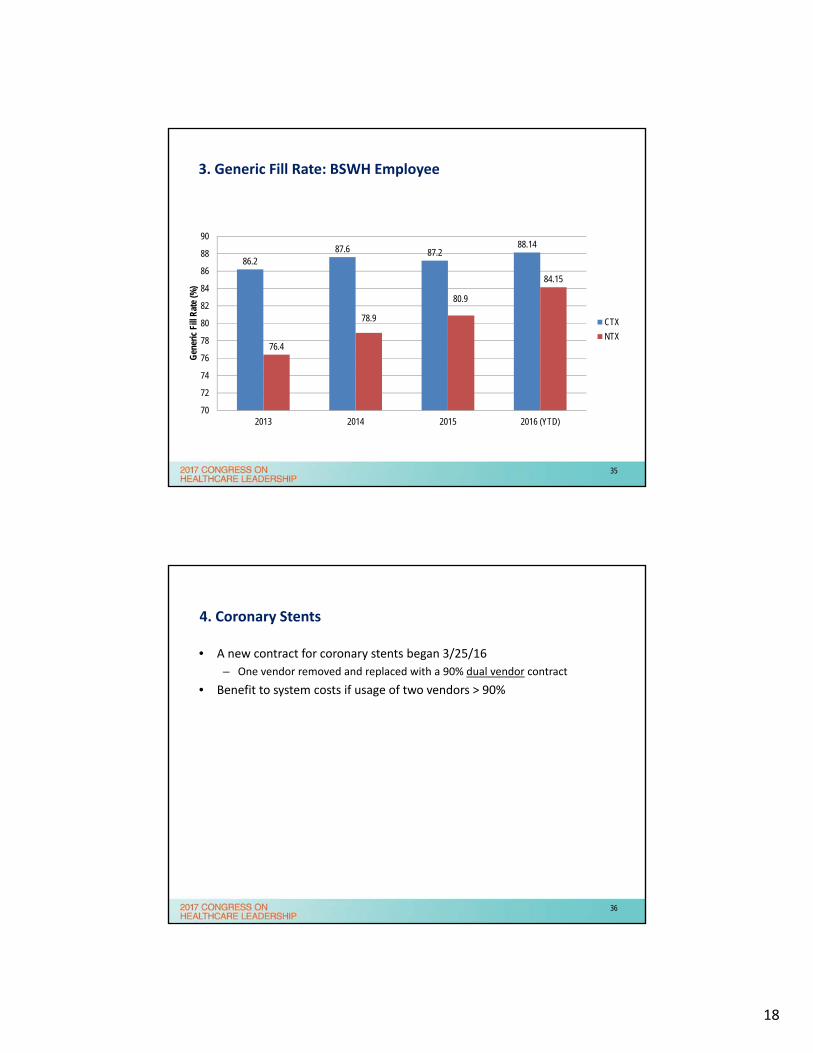
3. Generic Prescription Usage
• Favorable pricing on generic prescriptions
• Cost savings for patients and Health Plan with increased utilization
• Requires providers to be engaged in prescribing
34
18
3. Generic Fill Rate: BSWH Employee
86.287.6 87.2
88.14
76.4
78.9
80.9
84.15
70
72
74
76
78
80
82
84
86
88
90
2013 2014 2015 2016 (YTD)
Gen
eric
Fill
Rat
e (%
)
CTX
NTX
35
4. Coronary Stents
• A new contract for coronary stents began 3/25/16
– One vendor removed and replaced with a 90% dual vendor contract
• Benefit to system costs if usage of two vendors > 90%
36

19
System Compliance = 94%
Target Compliance = 90%
*Facilities in RED are below the SharedClarity compliance level
Vendor 1 Vendor 2 Vendor 3
Facility NON-ABSORB % ABSORB % SYNERGY % NON-SYN % QTY %
MEMORIAL 0% 0% 102 39% 161 61% 0%
COLLEGE STATION 0% 0% 127 92% 11 8% 0%
ROUND ROCK 51 54% 0% 22 23% 22 23% 0%
GRAPEVINE 30 33% 0% 54 59% 7 8% 0%
HILLCREST 43 23% 0% 125 66% 18 9% 4 2%
MCKINNEY 8 10% 0% 8 10% 60 77% 2 3%
GARLAND 143 74% 0% 28 15% 15 8% 6 3%
THHBP 532 90% 30 5% 0% 2 0% 30 5%
CARROLLTON 27 93% 0% 0% 0% 2 7%
BHVH 290 29% 22 2% 329 33% 278 28% 69 7%
IRVING 47 87% 0% 0% 0% 7 13%
THHBD 16 21% 0% 0% 0% 60 79%
BSW Total 1187 43% 52 2% 795 29% 574 21% 180 6%
4. Coronary Stents: Drug Eluding Stent Market ShareJuly 1 – Sept 30
37
System Compliance = 83%
Target Compliance = 90%
*Facilities in RED are below the SharedClarity compliance level
Vendor 1 Vendor 2 Vendor 3
Facility QTY % QTY % QTY %
MEMORIAL 23 96% 1 4% 0%
GRAPEVINE 3 21% 11 79% 0%
IRVING 10 100% 0% 0%
CARROLLTON 7 100% 0% 0%
HILLCREST 3 100% 0% 0%
ROUND ROCK 1 100% 0% 0%
GARLAND 10 71% 3 21% 1 7%
BHVH 12 55% 0% 10 45%
THHBP 6 50% 0% 6 50%
BUMC 0% 0% 1 100%
THHBD 0% 0% 1 100%
BSW Total 75 69% 15 14% 19 17%
4. Coronary Stents: Bare Metal Stent Market ShareJuly 1 – Sept 30
38

20
5. Blood Product Utilization
• Overuse of blood products in healthcare settings has several negative impacts
– Higher mortality in specific populations
– Higher costs without proven benefits
• Effort to reduce inappropriate blood utilization
39
5. Blood Product Utilization: Total Units Transfused8/1/11 – 10/31/16 Entire Program History
• 40% reduction in units consumed over a 5‐year period – Not related to a decrease in patient volume– Significant cost savings (conservative: direct savings of $1M/year)
40

21
6. Provider ICD 10 Education
0
10
20
30
40
50
60
70
80
90
1008-
Sep
9-Se
p
10-S
ep
11-S
ep
12-S
ep
13-S
ep
14-S
ep
15-S
ep
16-S
ep
17-S
ep
18-S
ep
19-S
ep
20-S
ep
21-S
ep
22-S
ep
23-S
ep
24-S
ep
25-S
ep
26-S
ep
27-S
ep
28-S
ep
29-S
ep
30-S
ep
1-O
ct
2-O
ct
3-O
ct
4-O
ct
5-O
ct
6-O
ct
7-O
ct
Senior Staff Residents APPs
Perc
ent C
ompl
etio
n
41
7. Medicare Spending per Beneficiary
0.92
0.93
0.95
0.88
0.9
0.92
0.94
0.96
0.98
1
FFY 2014 FFY 2015 FFY 2016
MSPB
42

22
Hospital Compare Provides information about
hospital quality to help patients make informed decisions and encourage quality care improvement at the hospital level
More than 100 quality measures, and 4000 hospitals
Aim is to summarize information in a way that is useful and interpretable for patients
8. CMS Star Ratings
Domain Rating per National Average
Mortality Above
Safety Above
Readmissions Below
Patient Experience Above
Effectiveness Care Same
Timeliness Same
Efficiency Imaging Same
22% each
12% total
1
2
3
4
5
Jul-15 Apr-16 Jul-16 Oct-16 Dec-16
43
9. Leapfrog Rankings
LeapfrogSurvey
CMSData
Outcomes Process
Hospital Safety Score
933
50
0 10 20 30 40 50 60
B
C
D
% RISK OF AVOIDABLE DEATH Spring2015
Fall 2015Spring2016
Fall 2016
Score 2.9164 3.254 3.4384 3.4885
22.22.42.62.8
33.23.43.6
C A A A
44

23
10. NCQA Patient‐Centered Medical Home Recognition
• BSWH mandate: all 52 CTX primary care clinics achieve PCMH recognition
• All 52 primary care sites submitted applications
– All sites received recognition within 9 months (September 2014 – June 2015)
– All sites achieved “Level 3”— highest‐possible level
45
Factors Contributing to Success
• Integrated and aligned Clinic Group Practice Model
• Proven process to reduce waste
– Lean Leadership Management
– Applying Toyota Production System
46

24
Introduction of Lean Leadership Management
• Links strategy to operations
• Uses a “bottom up” operating system
• Management sets goals, some weekly, some monthly, and some yearly
• Cascades of huddles create communication up and down the organization daily
• Frees management time
• Combines management by metrics with management by walking around
• Quality, safety, cost, delivery, and morale
No central coordination
Command and control (monthly operating reports)
Lean leadership management (complex adaptive systems)
47
Building a Culture of Continuous Improvement
A culture of improving every important measure—every day by every employee
Objectives:
1. Rapidly increase the agility, flexibility, and speed with which we lead change and improvement, focused on the consumer/patient
2. Refine and deepen our operational excellence
3. Align leaders, practices, policies, and decisions with the belief that people are BSWH’s most valuable resource
4. Increase employee satisfaction, engagement, and meaning
48

25
Building a Culture of Continuous Improvement: Training
Trained: through Dec 2016
• Orientation – All new staff
• FUNdamentals (#101) – All new staff
• Practitioner (#201) – 4,650 staff
• Practitioner Project (#301) – tracking great gains
• LMS (#401) – 2,350, plus 1,800 LMS Quickstart
• ~1,200+ A3s – tracking great gains, and self‐sufficient Supervisors
49
Building a Culture of Continuous Improvement: Idea Huddles
NTX
*Jul thru Nov 2016
CTX
SYSTEM69 Hospitality
40 HR16+ IS
1,283 huddles x 20/ea = 25,660 staff engaged daily/weekly!
Region Boards
Cumulative
Ideas
Implemented
FY17
%
Round Rock 101 967
Waco 103 1131
College Station 96 901
Hill Country 63 376
Temple 279 3180
Children's 41 196
CCH (PACS) 21 147
TOTAL 704 6898
Site
Pilot' or
Current
Boards
("N")
(Eventual)
Expected
Boards or
Badged
Ee's/20
Cum
Ideas
Gener
FY17
Cum
Ideas
Impl.
FY17
Irving 49 49 848 584
Grapevine 43 43 697 432
All Saints 43 75 825 347
Carrollton 42 42 626 396
McKinney 36 36 360 250
THHB ‐ Pla/Den 44 51 746 371
Plano 48 48 1187 559
Garland 32 32 609 370
BUMC 92 234 1236 584
Waxahachie 25 25 681 411
BHVH 0 18
BIR
TOTAL: 454 654 7815 4304
West
East
Central
50

26
Building a Wider and Deeper Culture of Continuous Improvement
Faster PDCA Cycles by MoreStaff Toward Better Care
Coach‐led
Major Projects(DMAIC, Workshops, etc.)
Efforts
Minor Projects(local A3s) Supervisor‐led
Supervisor‐ledIdea HuddlesPositive Experience!
All Systems do Projects, mainly by Black Belts. Few build a culture that engages all!
51
Examples of Successful Projects
Increase UTI/Strep Same‐Day Appointments for Copperas Cove Family Med
– Number patients seen same day for UTIs or Strep up from 41.4% to consistently > 90%
– Recovered revenue of UTI: $1423.95, Strep: $991.44 per month; 294 additional patients FY16
– CGCAHPS “right‐away appointment as soon as needed” score increased from 46.7 to consistently > 95
Austin/Round Rock Recruiting
– Decreased clinic open positions from 75 to 38 and total region openings from 180 to 87 while adding ~250 new growth positions
– Spreading new standard work practices throughout system
52

27
CBRE Maintenance Room Renovation Time
– Reduced room renovation time by 83% from 5.9 to 2.0 days
– Reduced average monthly number of rooms blocked for maintenance issues by 39%
– Increased annual patient bed availability to additional 2,138 days
– Estimated $2.02M in recovered room billing potential,* per year
Austin/Round Rock Prescription Refill Center
– Refill turnaround time: Same‐day refill closure 86%
– MyChart refill message TAT is 6‐7 hours vs >12
– Patient satisfaction from 37% to 91%
BUMC Interv. Radiology: Improved On‐Time Starts and Increased Cases
– On‐Time Starts – Improved to 100%
– Increased IR Cases Completed – 80 additional per month = $480,000 (approx.)
Examples of Successful Projects (continued)
53
Practice Efficiency and Other Considerations
• Staff turnover rates
• Provider turnover rates
• Overall provider satisfaction
• Patient satisfaction
• Quality
• Cost and delivery (budget)
54

28
Operating Principles (continued)
• Practice redesign work
– Putting joy back into practice became a focus
– CMA expanded roles
– Pharm techs and Rx refill centers
– Decentralization of Call Centers
– Optimization of EHR
– Pilots with scribes
– Salary models with team goals for access/quality/service metrics
55
Pilots
CMA (Shepherd Model)
• Started pilot with four locations
• CMA stays with patient from start to finish and assists provider in the room with documentation
• Strong early returns; interest in expansion
Scribes
• Vendor provided scribes to 11 selected doctors
• Strong early returns; program expanding
Expansion of Centralized Refill for Primary Care
• Divert appropriate refills from provider’s in‐basket to central pool
• Staffed by LVNs and pharmacy tech trained staff working from approved protocols
Killeen Contact Center
• Removed Killeen market (4 clinics) from larger Divisional Call Center
• Will focus on continuity of care for clinic teams (important to doctor and patient)
Value Comp Pilot
• Moved doctor compensation in two clinics from RVU‐based pay to salary
• Incentives around team‐based care, quality, access, patient satisfaction, etc.
56

29
Pilot Progress: Trending Upward in Meaningful Metrics
Provider Satisfaction (survey sample size of 33)
• Ability to deliver effective quality care: pilot group 27 percentage points higher than the field
• Satisfied with current environment: pilot group 31 percentage points higher than field
Scribes
• Time in Epic after hours: 40% decrease
• RVUs: 8% increase
Shepherd Model (Enhanced Care Team)
• Time in Epic after hours: 5% decrease (data from total pool – some providers realizing significantly more reduction in time); lessons learned continue
• RVUs: 8% increase
Patient Satisfaction
• Survey data not yet compiled for group; on‐site (informal) surveying results show improved patient satisfaction; they like additional time/attention from provider
• One FM Clinic with Shepherd Model hit 100% previous month
57
People Provision
• Supporting the needs and development of our providers
• Overcoming burnout, enhancing resilience, and increasing quality for providers, care teams, and patients within our Clinics
– Provider Retreat (Internal BSWH Program)
• Find attendees by way of open invite and recommendations from others
• Mix of different specialties and varied levels of “burnout” – seek balance in each session
• 98%+ satisfaction
– Lunch and Learns
• Meet providers where they are
• Facilitate time of community and team building
– Medical Director Equipping
• Leader development for front‐line medical directors
• Initial program is one year (demonstrated gains already in first quarter)
• Percentage indicating confidence in their role as a Medical Director doubled
• Percentage indicating being better equipped to lead as Medical Director also doubled
58

30
Adoption of Change
• Advanced practice professionals (APPs)
59
Focus on Advanced Practice Professionals
• Town Hall meetings held to hear “concerns” from APPs
– Variable reporting structures
• Clinic admin vs. RNs vs. physicians
– Variable expectations from providers
• Acute vs. chronic care
• Autonomy vs. micro‐management
– Professional respect
– Compensation issues
• Market competitiveness
• CME
60

31
APP Professional Environment Improvement Efforts
• Education for leaders and providers
• Engagement with HR– Management structure created
• APP Council established
• Leaders elected
• Development and validation of standardized tools for selecting APP leaders
• Standardization of reporting/evaluating
– Wage/market corrections
– CME enhancement
• Future projects – APP fellowships (Internal Medicine)
• Recognition with Board of Director attendance
• Expanded roles and numbers– Primary care
– Hospitalist teams
61
Growth of Provider Workforce
984 10001112 1177 1224
0
200
400
600
800
1000
1200
1400
2011 2012 2013 2014 2015
PHYSICIANS
317 331358 364
428
0
50
100
150
200
250
300
350
400
450
2011 2012 2013 2014 2015
APPs24% increase 36% increase
62

32
Growth in Visits (in 000s): 16 Percent
2.504
2.577
2.692
2.816
2.911
2.3
2.4
2.5
2.6
2.7
2.8
2.9
3
2011 2012 2013 2014 2015
63
Summary
“Group Practice” vs. “Confederation” of Clinic Practices?
• Group– Shared MVV and goals
– Shared management structure
– Physician management
– Common quality standards
– Cross subsidies
– Common EHR
– Coordinated care
– Governed by physician BOM
– Care management
• Confederation– Disparate MVV and goals
– Independent practices
– Non‐physician managers
– +/‐ Quality standards
– Little/no cross subsidies
– +/‐ Shared EHR
– Fragmented care
– +/‐ Governed by physicians
– +/‐ Care management
64

33
Questions?
65
Biography—Stephen Sibbitt, MD, MBA, FACP
Dr. Sibbitt is the Chief Medical Officer, Temple Region, and Associate Chief Medical Officer, Central Division, for Baylor Scott & White Health. Dr. Sibbitt served on the Scott & White Clinic Board of Directors, and is a current member of the Metroplex‐Adventist Hospital Board of Directors, and the Baylor Scott & White Health‐Continuing Care Hospital Board of Directors. Dr. Sibbitt also currently serves on the Texas Hospital Association Board of Trustees, and the Texas Care Alliance Board of Directors.
Dr. Sibbitt completed his Medical Degree at the American University of the Caribbean and his Internal Medicine training at the University of Texas Medical Branch. He joined Baylor Scott & White Health in 2003, was inducted into the Alpha Omega Alpha Medical Honor Society in 2011, and earned a Masters of Business Administration degree with Baylor University in May 2016, graduating Beta Sigma Gamma.
Contact InformationStephen Sibbitt, MD, MBA, FACP,
Chief Medical OfficerBaylor Scott & White Health,
Temple [email protected]
66

34
Biography—Robert Pryor, M.D.
Robert Pryor, M.D., is a Senior Vice President of Kaufman Hall with more than 40 years of healthcare experience as a physician, educator, and administrator. Dr. Pryor is a member of the Strategic and Financial Planning practice, and focuses on assisting hospitals, health systems, and other healthcare organizations nationwide with population health management, physician leadership and alignment, and organizational transformation for value‐based healthcare.
Prior to joining Kaufman Hall, Dr. Pryor was President and Chief Medical Officer (CMO) of Baylor Scott & White Health, the largest not‐for‐profit health system in Texas with 49 hospitals and more than 850 outpatient clinics, pharmacies, and senior health, ambulatory surgery, and emergency medical centers. At the time of the 2013 merger of Baylor Health Care System and Scott & White Healthcare, Dr. Pryor was President and ChiefExecutive Officer of Scott & White Healthcare and Chairman of the Scott & White Health Plan.
Dr. Pryor has held numerous academic, hospital, and medical staff appointments, and served on industry boards at the local, regional, and national levels. He has delivered more than 100 presentations in the U.S. and abroad, coauthored a book, and authored book chapters and articles in more than two dozen publications.
Dr. Pryor received an M.D. from the University of Texas Medical Branch at Galveston, Texas, and an M.B.A. from Arizona State University. He is a board‐certified pediatrician and a Fellow of the American College of Chest Physicians and the American College of Critical Care Medicine.
Contact InformationRobert Pryor, M.D., Senior Vice President
847.441.8780, ext. [email protected]
67