serving the oil and gas industry in ontario for 50 years
TRANSCRIPT

PUBL
ICAT
ION
MA
IL A
GRE
EMEN
T #4
0934
510
Oil Gas& 2012
Serving the oil and gas industryin Ontario for 50 years.

Leaders in Hydrocarbons Engineering & Project Delivery• Refining
• Petrochemicals
• Unconventional Gas
• LNG & GTL
• Onshore Pipelines & Terminals
• Gas Processing
• Sulphur Management
Extraordinary ResultsWe deliver engineering, procurement, project management, construction, and construction management services to the hydrocarbon, infrastructure & environment, power, and minerals & metals markets across Canada.
WorleyParsons Sarniaphone +1 519 332 0160email [email protected]
www.worleyparsons.com

Serving the Oil and Gas Industry since 1965
ABC
ABC VALVES
3245 S. Hattie • Oklahoma City, Oklahoma 73129Phone: 405-677-3321 • Fax: 405-677-3917 • Email: [email protected] • www.balon.com
VALVES
Designed... to give superior performance where superior performance is critical - in the field. Simple, yet effective. Safe, yet practical. Versatile, yet economical.
Built... for demanding oil and gas applications. Stronger. Tougher. Crafted for rugged use and extra staying power.
Proven... with millions of valves in the field - exceptionally dependable, more trouble free, and capable of extended maintenance-free service life.
CSA Certified
DIFFERENT BY PHILOSOPHY • BETTER BY DESIGN
OPI.indd 1 4/30/2012 4:43:59 PM

Ontario Petroleum Institute | 50th Anniversary Edition4
CONTENTS
Published by:DEL Communications Inc.Suite 300, 6 Roslyn RoadWinnipeg, MB R3L 0G5www.delcommunications.com
Publisher:DavID LanGStaff
associate Publisher:JaSon StEfanIk
Managing Editor:CaRLy [email protected] advertising Sales Manager: Dayna ouLIon
advertising Sales:GaRy BaRRInGtonMIChELLE RaIkEanthony RoMEoCoLIn JaMES tRakaLo
Production services provided by:S.G. Bennett Marketing Serviceswww.sgbennett.com
art Director / Design:kathy CaBLE
advertising art:REannE DaWSonDana JEnSEnJuLIE WEavER
©Copyright 2012. Ontario Oil & Gas. all rights reserved. the contents of this publication may not be reproduced by any means, in whole or in part, without the prior written consent of the publisher.
While every effort has been made to ensure the accuracy of the information contained herein and the reliability of the source, the publisher in no way guarantees nor warrants the information and is not responsible for errors, omissions or statements made by advertisers. opinions and recommendations made by contributors or advertisers are not necessarily those of the publisher , its directors , officers or employees.
Publications mail agreement #40934510Return undeliverable Canadian addresses to:DEL Communications Inc.Suite 300, 6 Roslyn RoadWinnipeg, Manitoba, Canada R3L 0G5Email: [email protected]
PRIntED In CanaDa06 | 2012
DELCommunications Inc.
Oil Gas&
Baker Hughes ........................................................................................23
Balon Corporation ..................................................................................3
C.R. Wall & Co. Inc. .............................................................................. 17
CanCaRd Inc. ......................................................................................27
Canlon Limited ..................................................................................... 42
dundee Energy L.P. .................................................................................6
Elexco Ltd. ...........................................................................................OBC
Fairbank Oil Properties Ltd. ................................................................ 19
Genivar ................................................................................................... 30
Harold Marcus Ltd. ................................................................................9
Hodgson Custom Rolling Inc. ..............................................................5
Holland Testers Ltd. .............................................................................. 11
Holstead & Redmond Limited ...........................................................27
Jim Mcintosh Petroleum Engineering Ltd. ...................................... 41
Liberty Oil & Gas Ltd. .......................................................................... 47
nPT+ LLP ................................................................................................. 11
Oil Museum of Canada ...................................................................... 30
Oil Well Supply..................................................................................... 43
Ontario Ground Water association ................................................ 59
Ontario Oil Gas & Salt Resources Library ..................................... 29
Penny Crossan Insurance & Financial Services ............................ 47
PTS – Petrochem Training Solutions Inc......................................... 49
PGM Oilfield Services Inc. .................................................................40
Pro Mechanical .......................................................................................7
Provident Energy Ltd. .........................................................................IBC
Raymond E. neal Chartered accountant........................................ 17
Rivard Excavating Ltd..........................................................................40
S & S Energy Resources Inc. ...............................................................55
Spartan Sling Mfg. ............................................................................... 24
Stevenson Oil .........................................................................................52
Tartan Systems Inc. ............................................................................. 65
T.W. Marsh Well drilling & Servicing ..............................................57
Union Gas Limited ................................................................................ 15
Westerman Companies ......................................................................33
WorleyParsons Canada .................................................................... IFC
INDEX TO ADVERTISERS
6 PRESIdEnT’S MESSaGE
8 COnGRaTULaTIOnS FROM OnTaRIO EnERGY aSSOCIaTIOn
8 MInISTER’S MESSaGE
10 PaST, PRESEnT & FUTURE OPI still delivers after all these years.
14 CEnTEnnIaL CELEBRaTIOn Union Gas celebrates over 100 years of serving customers and communities.
18 a PIECE OF HISTORY Four generations and still going strong, the
tradition of Fairbank Oil continues.
22 WORKInG TOGETHER Baker Hughes is partnering with operators
in Ontario’s oil and gas industry to deliver solutions.
25 CROWn JEWEL Corunna becomes prized asset for Provident
Energy.
28 TaPPInG InTO POTEnTIaL FOR GROWTH Ontario libraries offer fountain of information
on oil and gas history.
32 BUILdInG BRIdGES Breaking down barriers between First Nations
and industry.
34 CREaTInG CaPaCITY A look at natural gas storage after
deregulation.
38 TaKInG a LOOK aT FRaCKInG Love it or hate it, fracking has been used for
over 60 years and remains an important component of oil and gas production.
42 PLUGGEd In Requirements for well abandonment.
44 aLL IS WELL Regional groundwater systems in southern
Ontario.
49 nO STOnE UnTURnEd Applied research in Ontario’s petroleum
geology.
Technical Features53 CaMBRIan RESERvOIRS OF
SOUTHWESTERn OnTaRIO
56 MIddLE ORdOvICIan TREnTOn-BLaCK RIvER GROUP CaRBOnaTE PLaY In SOUTHWESTERn OnTaRIO
63 LOWER SILURIan SandSTOnE RESERvOIRS OF SOUTHWESTERn OnTaRIO
66 RESERvOIRS and PROdUCTIOn FROM THE SILURIan CaRBOnaTE ROCKS OF SOUTHWESTERn OnTaRIO
69 MIddLE dEvOnIan RESERvOIRS OF SOUTHWESTERn OnTaRIO

ROLLING TO 10” THICK

Ontario Petroleum Institute | 50th Anniversary Edition6
Welcome to the Ontario Petroleum Institute’s (OPI) Ontario Oil &
Gas Magazine.
We are proud of our heritage at the OPI from the beginning with the
Fairbanks family to the oil and gas producers of today who continue
to develop the energy potential for Ontario. The dedicated people
working in exploration and development, service and support com-
panies throughout southwestern Ontario continue to inspire us.
They remind us of the future potential in Ontario for collaborative
growth in a dynamic energy marketplace, and of the enthusiasm
that companies bring to the “patch.”
OPI members are from industries that are committed to the explo-
ration and development of oil and gas, hydrocarbon storage and so-
lution mining that supports sustainable and responsible economic
development. As a part of this commitment the OPI provides sup-
port to the industry through the services provided by the Ontario
Oil, Gas & Salt Resources Library which is an integral resource cen-
tre for the research and development necessary to tap the potential
for oil and gas in Ontario.
We continue to have a good working relationship and partnership with the Ontario Ministry of Natural Resources anchored by our mutual interest in the effective stewardship of the province’s natu-ral resources.
Times are also changing at the OPI. We welcome a new Executive Director, Hugh Moran who brings with him new energy and signifi-cant professional experience that will benefit the Ontario oil and gas industry.
We hope you enjoy Ontario Oil & Gas, and that reading the maga-zine will help you gain a greater understanding of the role of the oil and gas sector in Ontario.
Sincerely,
Ian Colquhoun
President, Ontario Petroleum Institute
PRESIdEnT’S MESSaGE
IAN COLQUHOUN
TORONTODundee Place, 1 Adelaide St. E.Toronto, ON M5C 2V9T: 416.350.3250 F: 416.363.4536
PORT COLBORNEP.O. Box 98, 953 Elm StreetPort Colborne, ON L3K 5V7T: 905.834.4390 F: 905.834.4397
CALGARY Suite 250, 435-4th Avenue S.W.Calgary, AB T2P 3A8T: 403.264.4985 F: 403.262.8299
LONDONUnit B, 1030 Adelaide St. S.London, ON N6E 1R6T: 519.433.7710 F: 519.433.7588
Dundee Energy Limited Partnership applauds the achievements of the
Ontario Petroleum Institute over the Past Fifty Years
Happy Anniversary
SAFELY HARVESTING ENERGY TO MEET ONTARIO’S NEEDSNOW AND IN THE FUTURE

PO Box 899, Dresden, ON N0P 1M0Phone: 519-683-4639 • Fax: 519-683-1566 • Email: [email protected]
TSSA Certified for;
Process Piping Fabricators B31.1 and B31.3.
ASME Sect.VIII DIV.I and B51 Pressure Vessel Fabrication
Category H Welded and Non Welded Fitting Fabricator to
B31.3 B31.1 and B51 Standards
Repair and Alteration of Boilers, Piping and Pressure Vessels
as well as Category A,B,E and H Type Fittings
Serving the Oil and Gas, Food and Ethanol Industries as well as Municipal Sewage and Water Treatment Agencies

Ontario Petroleum Institute | 50th Anniversary Edition8
COnGRaTULaTIOnS from
ONTARIO ENERGYASSOCIATION
On behalf of the Ontario Energy Association’s (OEA) Board of Directors and members, heartfelt congratulations to the Ontario Petroleum Institute (OPI) on the achievement their 50th Anniversary.
As the OEA embarks on our 10th anniversary, we look to the OPI as a model association and a distinguished example of longevity and quality service for its members.
Once again, congratulations on 50 fantastic years!
Sincerely,
Elise Herzig President and CEO, Ontario Energy Association

LTD.
Harold Marcus Ltd. has expanded from hauling crude oil with one wooden tank trailer and a four-wheel-drive army tractor to today’s modern fleet of about 230 trailers and 90 power units.
T: 519-695-3734 | F: 519-695-224915124 Longwoods Road, RR#3, Bothwell, ON N0P 1C0 Canada
Service to the Oil Patch since 1946

Ontario Petroleum Institute | 50th Anniversary Edition10
The Ontario Petroleum Institute (OPI) may be able to trace its
roots back to an industry social club, but the real heart of the non-
profit association can be attributed to the insightful, undertaking of
three individuals. It was thanks to the work of these three “found-
ing members” that the focus of the then Ontario Petroleum Club
changed from being a mere social entity to a dedicated organization
representative of all sectors of the oil and natural gas industry – one
that would stand the test of time and come to earn the respect of
both industry and government.
All for One and One for All
Back in the early 1960s, Hank O’Shea had already established him-
self as an oil industry insider. His buddies, Tim Rodger and Rollie
Hall, were also working in the field in southern Ontario.
“We were good friends,” explains O’Shea. “All three of us had spent
time out west. Nobody out there knew about the Ontario industry
– and Ontario was where it all began. We felt there was a real need
for an organization here in Ontario that would align all sectors of the
oil industry and, at the same time, raise the profile of the industry.”
PAST, PRESENTFUTURE &
OPI still delivers after all these years.

Ontario Oil & Gas 2012 11
The three friends got together and decided to change the existing
organization that was dedicated solely to social activities. The On-
tario Petroleum Club had been in existence for only a couple years
when the three friends joined and, at the next annual general meet-
ing, discreetly got themselves and six new members voted onto the
12-seat Board of Directors.
“It was an interesting operation,” states O’Shea. “Our guys were a
fix from the start. They knew we wanted to take over the club and
were all for it.”
The year was 1962, and the Ontario Petroleum Club officially be-
came the Ontario Petroleum Institute. Its new mandate – “to broad-
en industry representation and raise the profile of the Ontario oil
industry.” The change had been a success.
The Better Way
One of the first objectives of the new association was the creation
of an annual technical conference. To help raise awareness, it was
important to attract a large following of industry personnel.
“During that first conference, we had a number of people from
western Canada,” comments O’Shea. “We persuaded some of them
to be official speakers.”
O’Shea was voted in as president that first year, and did a lot to
help form the foundation of OPI. Although he was asked to serve a
second term, he respectfully declined, citing the need for change as
critical to OPI’s ongoing success.
“The industry was quite active at the time,” says O’Shea. “We drilled
about 200 holes a year.”
Word of OPI and its new mandate soon spread and within a few
years, the association had garnered broad representation and sup-
port from the industry, from explorers to producers, contractors,
geologists, engineers, consultants – and more.
Thank you OPI for 50 years of industry support.
Canadian Public Accounting Board registered since 2005 and energy sector specialists
Contact Sandy McCallum to learn more about how NPT can [email protected]
P: 519-432-5534F: 519-432-6544
300-633 Colborne St., London, ON N6B 2V3
www.nptca.com
HOLLAND TESTERS LTD. RR 3 Wheatley, Ontario N0P 2P0
“Where people make the
difference”
Drill Stem Testing
Production Testing
Service Tools
Production Tools
Inflatable Packers
Annulus Casing Packers
Stage Tools
Drill Bits (Reed/Hycalog)
Fishing Tools
Slickline
Phone: 1-519-825-3680 | Fax: 1-519-825-9348 | Cell: 1-519-322-8015
K. DALE HOLLAND President

Ontario Petroleum Institute | 50th Anniversary Edition12
Within a couple of years, OPI was being asked by the provincial gov-
ernment to provide input into new regulations.
“There has been a lot of enjoyment over the years,” recalls O’Shea.
“But I would say that the more memorable moments were with the
first conference we ever held. It was a milestone in a way. It brought
a certain validation to the organization.”
Although O’Shea is no longer active in the industry (at age 89, he
has since retired), he does continue to stay current through his son,
Kieran “known as Kerry,” who is an industry environmentalist with
Dillon Consulting Limited and a current member of the OPI Board
of Directors.
“We helped put the industry on the map,” states O’Shea. “We want-
ed to sell the oil industry to Canada. And we did achieve that suc-
cess to a large extent.”
Of course, it wouldn’t have been possible without the underhanded,
unassuming work of three close friends who were brought together
in their single-minded mission to change the course of history.
“We weren’t surprised that we were able to do what we did,” con-
cludes O’Shea. “We were good salespeople and the industry was
looking for a voice. Every industry needs one. We just happened to
be there at the right time.”
An Evolution
Since O’Shea and his friends put OPI on the map so to speak, the as-
sociation has changed. The 60 to 70 members of 1962 have grown
to 300+. Revenues continue to be generated through membership
sales and industry activities. And, despite the fact that the Ontario
oil industry has dwindled significantly since its humble beginnings,
OPI’s membership numbers have held their own.
“Having seen the consolidation that has taken place in this indus-
try over the past few years, we’re very happy with our membership
numbers,” states Joe Van Overberghe, who has served as executive
director of OPI for the last eight years.
“The primary role of OPI has evolved. We’ve become a bit more of
a government relations organization and a bit of public relations as
well.”
Of course, the social aspect that founded the association has also
remained. The annual conference continues to draw a minimum of
200+ attendees and continues to provide good networking oppor-
tunities for business and industry. Every other year, the OPI annual
conference partners with the conference of its sister organization,
the Independent Oil and Gas Association of New York, for better
networking and educational opportunities for members on both
sides of the border.
That being said, the areas represented by OPI members haven’t
changed much.
“Our association is similar to a four-legged chair,” explains Van
Overberghe, who cites these four legs as representing exploration
and production, natural gas storage, solutions mining and cavern
storage. “All of these industries are mature industries.”
Other social activities organized by OPI include an annual golf tour-
nament, industry meetings and a curling bonspiel (re-introduced
this year after a few years on hiatus).
“The social aspect is still a big part of OPI,” states Van Overberghe.
“I think it always will be.”
Van Overberghe defines OPI’s current role as being as significant
as it has been in past, adding the caveat that it is significant in a
different way.
“We’ve evolved into more of a lobbyist organization,” he states.
“We’ve never had that role in the past.”
Van Overberghe himself officially became a lobbyist two years ago.
“Our association is similar to a four-legged chair,”explains Van Overberghe, who cites these four legs
as representing exploration and production,natural gas storage, solutions mining and cavern storage.

Ontario Oil & Gas 2012 13
“We’re also have more of a role with other industry groups and or-
ganizations,” he adds, suggesting that the association has become
more representative as a result. “OPI is more connected nationally
than it ever has been.”
Icing on the Cake
In addition to continuing to speak on behalf of the Ontario oil indus-
try, OPI has also done its share in promoting the industry. Milestone
events, as identified by Van Overberghe, include: the fourth edition
of its magazine, a key vehicle that aids in marketing the industry; be-
coming more in tune with industry regulations, specifically as they
relate to the environment and the increased pressure stemming
from this field; and the ongoing quiet promotion of a responsible
and significant industry.
There’s also the educational aspect, with this year being the first
that OPI has partnered with a university to provide financial and re-
source support. This year saw OPI working with Western University
for its recently introduced “Petroleum Geology” program.
On the other side of the coin, Van Overberghe is the first to admit
that there are some significant challenges ahead for OPI. The larg-
est of these he sees is to increase drilling in the province by way of
creating an environment that is more socially and financially com-
pelling.
“The oil and gas industry has been here in Ontario for 150 years
now,” states Van Overberghe. “We’re lucky in that it’s more accept-
able in Ontario than in other areas of the country. And, we’re for-
tunate that our landowners are our industry stakeholders. We’re a
small industry but we’ve managed to maintain the rhythm for all of
these years. We just have to focus on ways to keep that rhythm go-
ing well into the future.”
A Look Ahead
As to where Van Overberghe hopes to see the Ontario oil and gas
industry in five to 10 years from now, he is quick to reply.
“The reality is that our membership numbers will be about the same
as what they are now,” he concludes. “What we would like to see is
our members drilling more. We’d also like to see the many compa-
nies that are currently using our library to access data to actually
come out and set up business in southern Ontario.”
That library to which Van Overberghe refers is the Oil, Gas & Salt
Library (OGSRL), a true fount of information that contains every-
thing about the collection, generation and distribution of informa-
tion on the subsurface geology, petroleum and salt resources of
Ontario. It’s an extremely useful industry tool, as well as historic
minder, of everything important to the once bountiful oil and gas
industry in southern Ontario. And, it may very well hold the key for
future exploration that can resurrect the industry to the glory days
of its past. n

Ontario Petroleum Institute | 50th Anniversary Edition14
Over the past century, Union Gas has built a tremendous reputa-
tion for safe, reliable and affordable service to their now nearly 1.4
million customers. And, thanks to the generous spirit of their dedi-
cated employees, they are also recognized as a long-standing com-
munity partner, supporting local schools, charities and non-profit
organizations large and small in the more than 400 communities
where they live and work.
Union Natural Gas Company of Canada was founded in 1911
through the amalgamation of three southern Ontario local gas dis-
tribution companies – Volcanic Oil and Gas Company, United Fuel
Supply and Ridgetown Fuel Supply – all who had been rivals until
then. It was an interesting time to be founding what would become
a long-standing company.
In 1911, the entire population of Canada was just over seven million,
the average life expectancy was 52 years, less than one per cent of
families had a car and fewer than eight per cent of Canadians had
a telephone. Natural gas pipelines were built of wood, natural gas
was used mostly for lighting and cooking and the cost of heating a
home with natural gas was about $4 a month.
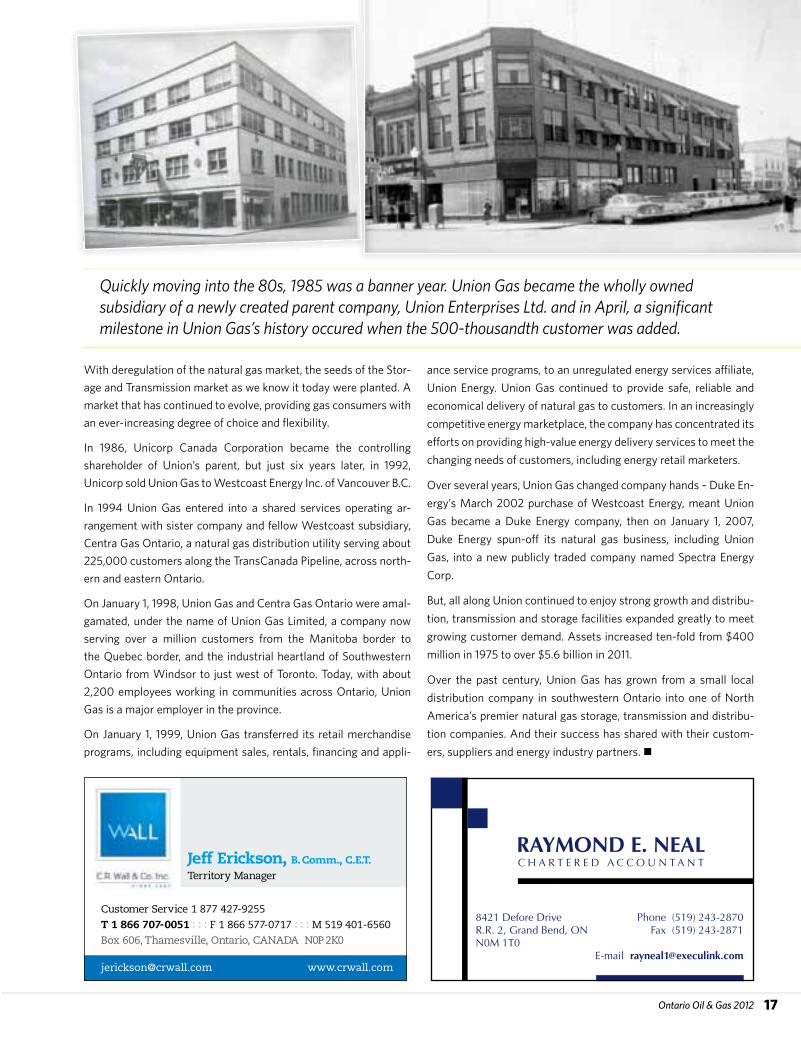
Originally headquartered in Niagara Falls, Union Gas moved its
head office to Chatham in 1918 to be closer to the centre of Ontario
gas production. During the 1920s, Union expanded its operations
into Sarnia, Wallaceburg and Windsor. From 1930 to 1960, Union
Union Gas celebrates over 100 yearsof serving customers and communities.
Centennial CELEbRATION


Ontario Petroleum Institute | 50th Anniversary Edition16
continued to expand its operations throughout southwestern On-
tario, adding the cities of London, Stratford, Waterloo, Guelph and
Brantford.
Now, it would be an understatement to say that a lot has changed
since those days. In the three decades following their founding, the
oil and gas industries in North America experienced tremendous
growth, driven by the introduction of mass-produced automobiles,
the movement of the population to urban centres in search of work
and World War II, during which natural gas was used in camps,
barracks and military hospitals.
In southwestern Ontario, the Union Gas distribution system was
also expanding rapidly and by the early 1940s, local gas supplies
had become scarce as existing production wells ran empty. Neces-
sity being the mother of invention, Union Gas’ first full-time geolo-
gist Dr. Evans, and Chief Engineer, R. L. Bevan, proposed to convert
depleted underground gas production wells into storage pools to
hold gas in reserve for peak cold weather demands. The idea was
tested, and in 1942, Union Gas began feeding gas into two depleted
storage pools at Dawn, southeast of Sarnia, Ontario.
This proved to be one of those memorable milestones for Union
Gas, as it launched the company’s diversification into the gas stor-
age and transmission business.
Using Dawn for storage wasn’t just significant for Union Gas, it
changed the industry too, opening the door to transporting natural
gas from the U.S. and western Canada into Ontario.
Two years later in 1944, Union Gas signed its first long-term con-
tract with the Panhandle Eastern Pipe Line Company to import
Texas gas into Ontario. With that contract, Union Gas began a pro-
ductive 67-year relationship with Panhandle.
From that point forward, the pipeline interconnects to the Dawn
area continued to grow, as did Union’s own storage and transmis-
sion capacity. In 1946, two pipelines were built across the Detroit
River connecting Dawn with Panhandle Eastern Pipe Line Company
storage in Michigan. And, the following year, Union Gas began to
store U.S. gas at Dawn for the first time.
In 1957, Union Gas finished building their first transmission pipe-
line, the 142-mile long, 26-inch diameter Trafalgar Line, connect-
ing the Dawn facility to TransCanada Pipelines and Enbridge Gas,
a distribution company that serves Toronto. In 1959, Union Gas ex-
tended its system north to Owen Sound. That same year, the first
deliveries of Western Canadian Gas were received by Union Gas
for storage and use by our customers.
Nineteen sixty-seven was another great year for connections. The
TransCanada Great Lakes Pipeline connected to the Dawn facility,
and Two years later, in 1969, ANR/Enbridge Pipeline connected to
Dawn.
Quickly moving into the 80s, 1985 was a banner year. Union Gas
became the wholly owned subsidiary of a newly created parent
company, Union Enterprises Ltd. and in April, a significant mile-
stone in Union Gas’s history occured when the 500-thousandth
customer was added.
On October 31, 1985, the Agreement on National Gas Markets and
Pricing – otherwise known as the Halloween Agreement – elimi-
nated the regulation of gas commodity prices in Canada, and es-
tablished a more flexible, market-oriented gas price system. Large
industrial natural gas consumers in Canada could now purchase
their gas supplies at a negotiated price directly from producers.
The development of the direct purchase market introduced new
players, including gas agents, brokers and marketers. Union Gas
played an active role in facilitating the very first direct purchase ar-
rangement in Canada with CIL in Courtright, Ontario. Nova Chemi-
cals Canada and LANXESS (and their predecessor companies Poly-
sar and Bayer), followed just a few weeks later and are also among
the first direct purchase customers in Canada.
Ontario Oil & Gas 2012 17
With deregulation of the natural gas market, the seeds of the Stor-
age and Transmission market as we know it today were planted. A
market that has continued to evolve, providing gas consumers with
an ever-increasing degree of choice and flexibility.
In 1986, Unicorp Canada Corporation became the controlling
shareholder of Union’s parent, but just six years later, in 1992,
Unicorp sold Union Gas to Westcoast Energy Inc. of Vancouver B.C.
In 1994 Union Gas entered into a shared services operating ar-
rangement with sister company and fellow Westcoast subsidiary,
Centra Gas Ontario, a natural gas distribution utility serving about
225,000 customers along the TransCanada Pipeline, across north-
ern and eastern Ontario.
On January 1, 1998, Union Gas and Centra Gas Ontario were amal-
gamated, under the name of Union Gas Limited, a company now
serving over a million customers from the Manitoba border to
the Quebec border, and the industrial heartland of Southwestern
Ontario from Windsor to just west of Toronto. Today, with about
2,200 employees working in communities across Ontario, Union
Gas is a major employer in the province.
On January 1, 1999, Union Gas transferred its retail merchandise
programs, including equipment sales, rentals, financing and appli-
ance service programs, to an unregulated energy services affiliate,
Union Energy. Union Gas continued to provide safe, reliable and
economical delivery of natural gas to customers. In an increasingly
competitive energy marketplace, the company has concentrated its
efforts on providing high-value energy delivery services to meet the
changing needs of customers, including energy retail marketers.
Over several years, Union Gas changed company hands – Duke En-
ergy’s March 2002 purchase of Westcoast Energy, meant Union
Gas became a Duke Energy company, then on January 1, 2007,
Duke Energy spun-off its natural gas business, including Union
Gas, into a new publicly traded company named Spectra Energy
Corp.
But, all along Union continued to enjoy strong growth and distribu-
tion, transmission and storage facilities expanded greatly to meet
growing customer demand. Assets increased ten-fold from $400
million in 1975 to over $5.6 billion in 2011.
Over the past century, Union Gas has grown from a small local
distribution company in southwestern Ontario into one of North
America’s premier natural gas storage, transmission and distribu-
tion companies. And their success has shared with their custom-
ers, suppliers and energy industry partners. n
Customer Service 1 877 427-9255
T 1 866 707-0051 : : : F 1 866 577-0717 : : : M 519 401-6560
Box 606, Thamesville, Ontario, CANADA N0P 2K0
[email protected] www.crwall.com
Jeff Erickson, B. Comm., C.E.T. Territory Manager
RAYMOND E. NEALC H A R T E R E D A C C O U N T A N T
8421 Defore Drive Phone (519) 243-2870 R.R. 2, Grand Bend, ON Fax (519) 243-2871 N0M 1T0 E-mail [email protected]
Quickly moving into the 80s, 1985 was a banner year. Union Gas became the wholly owned subsidiary of a newly created parent company, Union Enterprises Ltd. and in April, a significant milestone in Union Gas’s history occured when the 500-thousandth customer was added.

Ontario Petroleum Institute | 50th Anniversary Edition18
When John Henry Fairbank
agreed to take on a surveyor
job in Oil Springs, Ontario, way
back in March 1861, little did he
know that it would be the start
of a long and industrious journey
that would eventually see him
become the largest oil producer
in Canada, employing some
400 people in Petrolia and the
surrounding area. His was a life
marked by hard work and good
fortune, and when John Henry died in 1914 at the ripe old age of 83,
he would leave behind a legacy of oil that would be picked up and
passed on from father to son for three more generations.
Today, John Henry’s great grandson, Charles Oliver Fairbank III,
or “Charlie” as he is commonly known, presides over Fairbank Oil.
True, the company no longer can claim to be the largest oil producer
in the country, but it can lay claim to being a National Historic Site.
It also remains a working oil field, producing 24,000 barrels each
year using the same 19th century technology of the pioneers. Cel-
ebrating its 150th anniversary in 2011, it is the family that has been
producing oil longer than anyone in the world. It has also been sup-
plying Imperial Oil with crude since 1880, the year Imperial Oil was
created in London, Ontario.
The Road Less Travelled
John Henry Fairbank (J.H.) was born in Rouse’s Point, New York in
1831. When he was 22, he decided to try to better his fortune by
moving to Canada. It was while in Niagara Falls, Ontario, that he
met and later married Canadian Edna Crysler. After unsuccessfully
trying his hand at farming, J.H. accepted a surveying assignment
that took him to Oil Springs. While there, he got caught up in the oil
fever, which was triggered in 1858 when James Miller Williams dug
a well, refined the crude and began marketing his lamp oil. It was the
birth of the modern oil industry and the oil rush began.
J.H. began his remarkable journey with the lease of a half-acre lot.
The year was 1861. He christened his first oil well ‘Old Fairbank’ and
he would run the well until 1865 before selling it and moving 12 kilo-
metres north to Petrolia, where some oil finds had been reported. It
was while running ‘Old Fairbank’ that J.H. developed the jerker line
system, which used one engine to run 20 wells, as opposed to need-
ing a single steam engine for each well. The new system proved to
A Piece ofHISTORYFour generations and stillgoing strong, the traditionof Fairbank Oil continues.BY MELanIE FRannER

Ontario Oil & Gas 2012 19
be a huge success and was
quickly adopted through-
out the area. It continues
to be used at Fairbank Oil
today.
Over time, J.H. would branch out into other business ventures.
He entered into various partnerships that eventually brought un-
der his helm a dry goods/hardware store (which would become the
largest hardware store west of Toronto), a bank (which would be-
come one of Canada’s last private banks), a refinery and a mortgage
centre. He also continued to buy up the land and add to his growing
number of oil wells.
As the oil continued to flow in Petrolia, J.H. assumed more and more
of a leadership role in society. He was the president and general
manager of the Home Oil refinery for eight years. He served three
terms as the Chief of the Petrolia Fire Brigade and he served as
president of the Crown Savings and Loan mortgage company for
30 years.
Throughout all of this, J.H. continued to acquire farmland, forests
and real estate. In the early 1880s, he had added a 120-acre oil field
property to his Oil Springs holdings. This property became Fairbank
Oil and continues to pump oil to this day. The acquisition of adja-
cent land a few years later would bring J.H.’s total land holdings to
350 acres.
J.H. also entered politics. He was elected the Liberal Member of
Parliament for East Lambton in 1882 and would retain that position
until 1887.
By 1891, J.H. had put the finishing touches on his mansion, the
largest in Lambton County, replete with a ballroom. He continued
to add to his growing list of enterprises by purchasing Stevenson
Boiler Works. He also opted to back the Petrolia Wagon Works – a
move that would end up costing the Fairbanks a third of their for-
tune when the company went bankrupt in 1920, six years after J.H.’s
death in 1914.
The Next Generation
Charles Oliver Fairbank, the son of J.H., took over the reins of the
company in 1912. He was 54 years old at the time. Although Charles
learned a lot about the oil business from his father, his career took
a different path until his brother died in 1881. Prior to that, Charles
studied at Helmuth College in London, Ontario, before enrolling in
the Royal Canadian Military College in Kingston. He subsequently
took on more military training in England and eventually, earned his
medical degree at Columbia University in New York in 1891.
Upon his return to Petrolia, Charles teamed up with a partner to dis-
cover new oil wells in Bothwell, a town located 30 kilometres south-
east of Petrolia. Charles was also the first (and only) of the Fair-
banks to discover oil outside of Canada. He and his partner bought
land in Elk Hills, California, and leased the rights to Standard Oil. It
proved to be a huge success – so much so that the U.S. government
eventually took back the land.
One month after the death of his father, Charles struck Canada’s
P.O. Box 10, Petrolia, ON N0N 1P0
Mainoffice:(519) 882-0230 Homeoffice:(519) 834-2677 Fax:(519) 882-3363 Email:[email protected] Website:www.fairbankoil.com

Ontario Petroleum Institute | 50th Anniversary Edition20
first gas gusher in Oil Springs. By August of 1914, World War I had
begun and Charles resumed his military career and despite being
56, he fought at The Battle of the Somme. He continued to oversee
the family business until he died of Bright’s Disease at the age of 66.
Carrying on the Tradition
Like his father, Charles Oliver Fairbank II never really expected to run
the family business. He was 21 when his father died in 1925, and the
business was passed on to him and his three brothers, as well as his
father’s sister and her children. But, circumstances changed things.
Charles’ older brother died shortly thereafter and Charles became
the eldest son. He had studied at Ridley College in St. Catharines
and earned a petroleum engineering degree from the University
of California. In 1932, at his mother’s behest, Charles returned to
Petrolia to take over the family business.
Like his grandfather, Charles did a stint in politics, becoming the pro-
vincial Liberal Member of Parliament from 1938 to 1942.
Charles was also responsible for bringing the Fairbank Oil business
under his sole ownership. He accomplished this in 1973. His son,
Charlie, then purchased the property and took over the mortgage.
This allowed Charles to focus solely on the hardware store – a busi-
ness that had carried on from the time of J.H. Charles died in 1982
at the age of 77.
The Tradition Continues
With many of the Fairbank’s fortunes being at the mercy of the
ebb and flow of the oil market and its fluctuating prices, Charles
Oliver Fairbank III (a.k.a Charlie) took his father’s advice and sought
out a career independent of the oil fields – just in case he needed
something to fall back upon. He attained a biology degree from the
University of Western Ontario and a teaching degree from Queen’s
University. But, despite this calculated move, Charlie’s love of oil
soon drew him back to Fairbank Oil.
In August 1973, just before the Arab Oil Embargo, Fairbank Oil had
70 producing wells and 70 idle wells spread over 350 acres in Oil
Springs. The oil embargo’s impact was immediate and sent prices
skyrocketing. Being an oil producer was suddenly a viable business
– until the crash of 1986. To counter the collapse of oil prices, Char-
lie bought adjacent fields – adding 250 acres and 180 producing oil
wells.
It had been Charlie who encouraged his father to buy out the other
members of the family and become the sole owner of the company –
which was accomplished in 1973. Charlie’s subsequent purchase of
the family business resulted in the official name change to Charles
Fairbank Oil Properties Ltd.
What’s in a Name
Today, Charlie continues to run the company and his wife, Patricia
McGee, is a journalist who handles the communications end of the
business. The two met through a mutual friend and have been to-
gether since 1990.
“I didn’t know of the legacy of Fairbank Oil the first time I met Char-
lie,” explains McGee, who adds that she slowly came to realize the
significance of the family in Canada’s oil history. “It came on me by
degrees.”
Charlie and Patricia – along with their two sons young Charlie and
Alex – continue to live on the Fairbank property in Oil Springs in the
original foreman’s farmhouse that was built in 1888. The house has
since been expanded and upgraded to accommodate green energy
– a technology that both Charlie and Patricia strongly support.
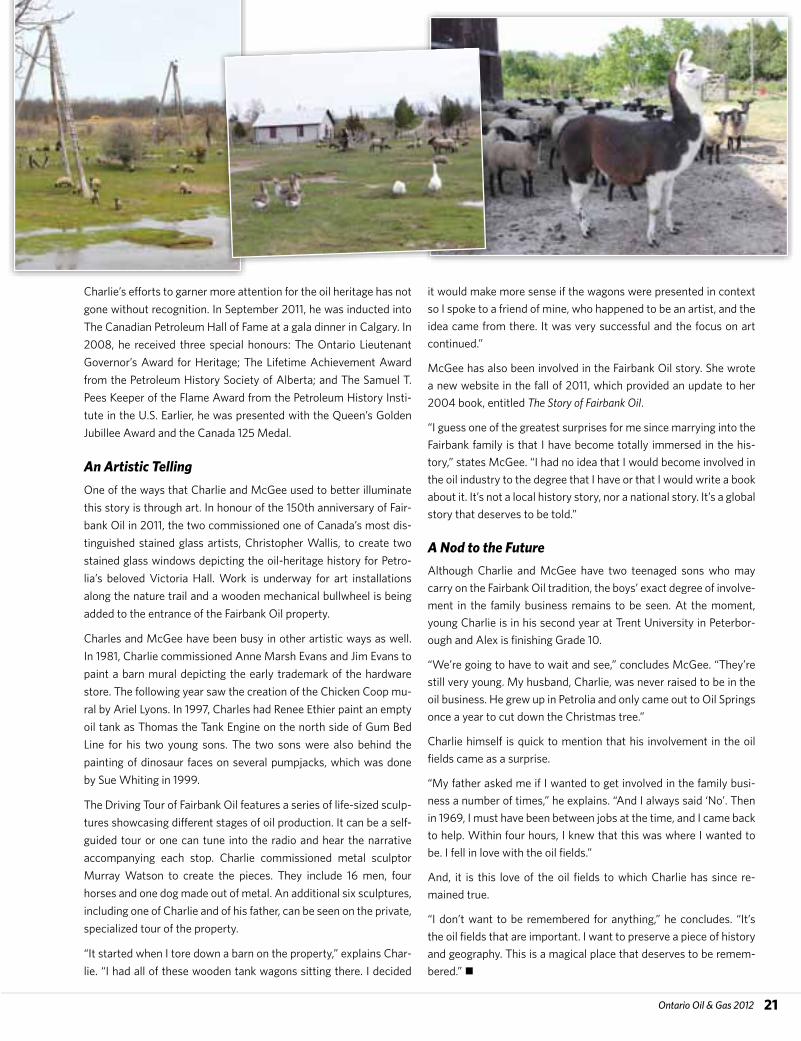
“Many people think of oil as being environmentally destructive,”
comments McGee. “People who come here continue to be sur-
prised. We have wetlands, woodlands and wildlife. Wild turkeys
strut around here and there are guinea hens and geese too. We
have llamas and keep over 100 sheep. We use the sheep manure
as organic fertilizer on our gardens. We also have over half a million
honeybees on the property. Yes, we produce crude oil but we also
believe oil is a precious resource that we have to use carefully.”
Although Charlie continues to run the family business, he and his
wife are committed to educating people on the history of Canada’s
oil industry and of the vital role that Ontario’s Oil Heritage District
played in this history.
“Charlie wants people to know that the modern oil industry began
here in Oil Springs, a year before the Americans,” notes McGee.
“We feel that people should know about this part of Canada’s histo-
ry, especially because energy is such an important factor in so many
things today. There’s a story to be told and we’re working hard to tell
it. Charlie gives speeches and tours all the time to a wide range of
professionals, associations and the public.”
“I didn’t know of the legacy of Fairbank Oil
the first time I met Charlie,” explains McGee,
who adds that she slowly came to realize the
significance of the family in Canada’s oil history.
“It came on me by degrees.”
Ontario Oil & Gas 2012 21
Charlie’s efforts to garner more attention for the oil heritage has not
gone without recognition. In September 2011, he was inducted into
The Canadian Petroleum Hall of Fame at a gala dinner in Calgary. In
2008, he received three special honours: The Ontario Lieutenant
Governor’s Award for Heritage; The Lifetime Achievement Award
from the Petroleum History Society of Alberta; and The Samuel T.
Pees Keeper of the Flame Award from the Petroleum History Insti-
tute in the U.S. Earlier, he was presented with the Queen’s Golden
Jubillee Award and the Canada 125 Medal.
An Artistic Telling
One of the ways that Charlie and McGee used to better illuminate
this story is through art. In honour of the 150th anniversary of Fair-
bank Oil in 2011, the two commissioned one of Canada’s most dis-
tinguished stained glass artists, Christopher Wallis, to create two
stained glass windows depicting the oil-heritage history for Petro-
lia’s beloved Victoria Hall. Work is underway for art installations
along the nature trail and a wooden mechanical bullwheel is being
added to the entrance of the Fairbank Oil property.
Charles and McGee have been busy in other artistic ways as well.
In 1981, Charlie commissioned Anne Marsh Evans and Jim Evans to
paint a barn mural depicting the early trademark of the hardware
store. The following year saw the creation of the Chicken Coop mu-
ral by Ariel Lyons. In 1997, Charles had Renee Ethier paint an empty
oil tank as Thomas the Tank Engine on the north side of Gum Bed
Line for his two young sons. The two sons were also behind the
painting of dinosaur faces on several pumpjacks, which was done
by Sue Whiting in 1999.
The Driving Tour of Fairbank Oil features a series of life-sized sculp-
tures showcasing different stages of oil production. It can be a self-
guided tour or one can tune into the radio and hear the narrative
accompanying each stop. Charlie commissioned metal sculptor
Murray Watson to create the pieces. They include 16 men, four
horses and one dog made out of metal. An additional six sculptures,
including one of Charlie and of his father, can be seen on the private,
specialized tour of the property.
“It started when I tore down a barn on the property,” explains Char-
lie. “I had all of these wooden tank wagons sitting there. I decided
it would make more sense if the wagons were presented in context
so I spoke to a friend of mine, who happened to be an artist, and the
idea came from there. It was very successful and the focus on art
continued.”
McGee has also been involved in the Fairbank Oil story. She wrote
a new website in the fall of 2011, which provided an update to her
2004 book, entitled The Story of Fairbank Oil.
“I guess one of the greatest surprises for me since marrying into the
Fairbank family is that I have become totally immersed in the his-
tory,” states McGee. “I had no idea that I would become involved in
the oil industry to the degree that I have or that I would write a book
about it. It’s not a local history story, nor a national story. It’s a global
story that deserves to be told.”
A Nod to the Future
Although Charlie and McGee have two teenaged sons who may
carry on the Fairbank Oil tradition, the boys’ exact degree of involve-
ment in the family business remains to be seen. At the moment,
young Charlie is in his second year at Trent University in Peterbor-
ough and Alex is finishing Grade 10.
“We’re going to have to wait and see,” concludes McGee. “They’re
still very young. My husband, Charlie, was never raised to be in the
oil business. He grew up in Petrolia and only came out to Oil Springs
once a year to cut down the Christmas tree.”
Charlie himself is quick to mention that his involvement in the oil
fields came as a surprise.
“My father asked me if I wanted to get involved in the family busi-
ness a number of times,” he explains. “And I always said ‘No’. Then
in 1969, I must have been between jobs at the time, and I came back
to help. Within four hours, I knew that this was where I wanted to
be. I fell in love with the oil fields.”
And, it is this love of the oil fields to which Charlie has since re-
mained true.
“I don’t want to be remembered for anything,” he concludes. “It’s
the oil fields that are important. I want to preserve a piece of history
and geography. This is a magical place that deserves to be remem-
bered.” n

Ontario Petroleum Institute | 50th Anniversary Edition22
Baker Hughes is a well-known member of the Ontario oil and gas
sector with a long history of providing a wide range of services from
reservoir engineering, to specialty chemicals used in downstream
applications. In fact, our history stretches back to almost as far as
the oil and gas industry in Ontario.
Although Baker Hughes was formed in 1987, with the merger of Bak-
er International and Hughes Tool Company, both companies were
founded more than century ago. Prior to the merger, both compa-
nies conceived ground-breaking inventions that revolutionized the
petroleum industry. In 1907, Reuben C. Baker developed a casing
shoe that modernized cable tool drilling, while in 1909, Howard R.
Hughes Sr. introduced the first roller cutter bit that dramatically im-
proved the rotary drilling process. Over the ensuing decades, Baker
International and Hughes Tool Company continued to lead the in-
dustry with innovative products in well completions, drilling tools
and related services. Since those earliest advancements, we’ve
never stopped searching for solutions to conquer the next frontier.
With offices in various locations across Ontario, backed up by a
solid Canadian infrastructure, Baker Hughes offers a complete suite
of expertise including reservoir consulting, drilling, formation evalu-
ation, completions, pressure pumping and production products and
services. Baker Hughes has a long, successful history assisting cus-
tomers with well inspections, according to Gord MacKenzie, station
manager and wireline engineer.
“Baker Hughes’ cased-hole and open-hole wireline services offer
fit-for-purpose technology, enabling us to solve the operational
and evaluation needs of customers across Ontario. We know our
customers,” says MacKenzie, who started his career in the South-
ern Ontario oil patch in the early ‘90s, and in 2000 transferred to
gain additional experience in other areas. He has worked offshore
in eastern Canada, the North Sea and the Gulf of Mexico, as well as
on land in north western Canada and in various parts of the United
States including Alaska.
“Working in these other locations, I rarely see the same people
again,” he says.
However, MacKenzie’s experience with the Ontario “oil patch” is
comfortingly different, operating more like a close-knit family.
“It’s a pleasure to know the majority of people when you arrive on
location. When you know the people you are working with in an
operation, people have the confidence to make suggestions and
speak freely, which makes for a safer working environment,” says
MacKenzie.
Safety is a paramount concern for Baker Hughes. ”Our focus on
health and safety, along with ensuring the environment is also pro-
tected before considering rig time and service costs, has led to very
safe working conditions with minimal environmental impact.”
Baker Hughes’ wireline experts, including MacKenzie and the other
four staff working from the Sarnia office, have more than 80 com-
bined years of knowledge and work experience. With Baker Hughes’
complete range of downhole electric wireline services for every well
environment, including cased-hole advanced formation evaluation,
production and reservoir engineering and petrophysical and geo-
physical data-acquisition services, MacKenzie is confident he has
the tools and expertise required to meet the needs of the Ontario
oil patch.
Baker Hughes can minimize interventions and nonproductive time
because our customers value our ability to efficiently and accurately
evaluate well performance through our production logging services,
explains MacKenzie.
He and his team can customize these services for optimal measure-
ment of a wide range of production conditions, including vertical,
highly deviated or horizontal wells, and also use them for a variety
of well completion types, including open hole (barefoot), cased and
perforated, gravel-packed or slotted-liner configurations.
“One of our primary objectives is to determine and quantify a well’s
production profile with the ultimate goal of increasing reservoir
production and reducing downtime. Production logging allows us
to evaluate production operations and diagnose potential problems
WORkING TOGETHERBaker Hughes is partnering with operators inOntario’s oil and gas industry to deliver solutions

we are the people of Baker Hughes.
and we want to help you get maximum value from your reservoir.
www.bakerhughes.com/canada
Every day, in oil and gas fields in Canada and around the world, our experts
work with clients like you to evaluate their needs and then engineer
wellbore construction systems and production solutions to match each
application. The result: improved operating efficiency, lower risk, and
maximum hydrocarbon recovery.
Whether you are exploiting existing reserves or exploring new fields, you
can count on Baker Hughes for innovative technologies and solutions that
meet your needs in every phase of hydrocarbon recovery and processing.
Contact your local Baker Hughes
representative or visit us online
and find out how we can help you
cut costs while advancing the
performance of your reservoir.
© 2012 Baker Hughes Incorporated. All Rights Reserved. 31663

Ontario Petroleum Institute | 50th Anniversary Edition24
like water or gas breakthrough, crossflow of thief zones and chan-
neling – all in real time,” he elaborates.
Production logging measurements are often combined with cased-
hole reservoir evaluation services like pulsed-neutron logging. This
combination provides saturation and production logging data for a
complete well-performance evaluation. MacKenzie says the equip-
ment performs in conditions ranging from simple single-phase pro-
duction to complicated annular three-phase flow in a horizontal well
completed with a slotted liner.
One area of well inspections that has experienced growth, according
to MacKenzie, is well casing inspection. Since some of the wells are
getting older, customers want to know beforehand about any poten-
tial problems. That’s where Baker Hughes’ Vertilog™ casing-inspec-
tion service, which uses magnetic flux-leakage measurements, can
identify and quantify internal and external corrosion defects. This
service, which relies on the overlapping arrays of flux-leakage sen-
sors and discriminator sensors, offers full-circumferential inspec-
tion of the tubing or casing string. This process differentiates be-
tween metal-loss (corrosion) and metal-gain (hardware) features,
and distinguishes between general corrosion and isolated pitting.
While the Vertilog system provides very good information, Baker
Hughes’ High-Resolution Vertilog™ (HRVRT™) system delivers
even a higher resolution. The HRVRT service delivers the highest-
resolution electromagnetic casing inspection in the industry. The
system’s 360-degree defect map accurately pinpoints the location,
size and shape of a casing defect, whether internal or external. The
advanced information and processing of the HRVRT data can save
customers costly well repairs, mitigate production loss or delay
well abandonment.
MacKenzie adds that all of his experiences and interactions
throughout his career, including those with the OPI – which he says
“acts as the hub to bring all the spokes together” – have provided
him with one of the most enjoyable working environments he’s ex-
perienced.
From Downhole to Downstream
According to Craig McNairn, business development manager in
the Industrial Processes Portfolio, Baker Hughes has been working
many years in the Sarnia area.
“The reach of Baker Hughes in supporting similar downstream
sectors across the world means we have proven technology and
products in pipeline, hydrocarbon processing and petrochemical
industries that will help increase production, improve plant safety
and equipment reliability,” says McNairn.
Baker Hughes is well prepared to support hydrocarbon processing
with environmentally friendly additives used to treat crude oils, as
well as finished fuels.
When it comes to the specialty chemical needs of refiners, Baker
Hughes has products for this activity as well.
“When a plant is doing a turn-around, they have come to trust the
specialty cleaning chemicals we offer knowing that the product will
give them repeatable results so they can get the job done safely
and quickly,” he expresses.
At Baker Hughes we are proud to be a long-term partner in a viable,
active and important industry in the province of Ontario.
Congratulations OPI on 50 years of being a voice for the industry. n
Phone: 519-250-8288 • Fax: 519-250-9977
www.spartansling.com
“The reach of Baker Hughes in supporting similar downstream sectors across the world means we have proven technology and products in pipeline, hydrocarbon processing and petrochemical industries that will help increase production, improve plant safety and equipment reliability,” says McNairn.

Ontario Oil & Gas 2012 25
In its early days, Calgary-based Provident Energy’s portfolio was
heavily influenced by its oil and gas assets. Over the last decade, in
its effort to focus its business direction and respond responsibly to
market and analyst demands, it has changed course.
In 2003, the company bought a portion of the natural gas liquid
(NGL) midstream business from Williams Energy and, in 2005,
added EnCana’s midstream business.
Today, it has sold off its entire oil and gas segment to become
“the second largest midstream player in Canada,” says Andrew
Gruszecki, executive vice president of midstream business units.
Assets now span from northeastern British Columbia to Sarnia, On-
tario and Lynchburg, Virginia. Major facilities include the Redwater
West System (north of Edmonton and containing one of the largest
NGL rail yards in Canada) and the Empress East System (from Em-
press, Alberta and extending into eastern Canada). Offices in Cal-
gary, Houston and Sarnia facilitate access to a wide range of viable
North American markets.
This dividend-paying, public company’s services include NGL ex-
traction, fractionation, storage, transportation, logistics and market-
ing of its own product and the product of third parties. It currently
has over 300 employees and functions within a corporate structure
(moved from an income trust model early in 2011).
Strategic growth is a key component of the company’s vision, adds
Gruszecki. Last year the company developed new cavern storage at
Redwater, acquired a trucking company in Saskatchewan and con-
structed an NGL terminal in Manitoba. The company is well posi-
tioned to develop further in the Montney and Appalachian natural
gas plays, the Bakken oil play and the Alberta Oilsands.
Another Provident Energy location which is proving to be “a crown
CROWN JEWELCorunna becomes prized asset for Provident Energy.
BY COLLEEn BIOndI

Ontario Petroleum Institute | 50th Anniversary Edition26
jewel with significant growth prospects” is Corunna, Ontario, a tiny
town of just under 15,000 people located 15 minutes from Sarnia.
The company already had fractionation presence in the community.
Recently, it made another key acquisition – a storage and terminal-
ling facility.
Previously owned by Dow Chemical Canada, the facility had been
used to store petrochemical and derivative products converted
from ethylene feedstock supplied from its Fort Saskatchewan fa-
cility via the Cochin Pipeline. But, when a repair to a pipeline leak
resulted in lower operating pressures and reduced throughput, eth-
ylene could no longer be transported to Cochin. In addition, when
the global ethylene market provided debilitating competition, Dow
made a big decision.
“They decided to get out of the ethylene business in eastern Can-
ada,” says Mike Hantzsch, vice president of business development,
and solicited bids for the facility. “We were the successful party and
acquired the property in March 2010.”
The property is 1,100 aces in size. It has 12 million barrels of un-
derground storage capacity -- five million are available for the stor-
age of hydrocarbons like propane, butane and crude oil and seven
million currently contain brine (in earlier times, Dow used to mine
brine as a feedstock for the production of chlor alkali). The site is
affectionately referred to as The Farm and 400 of its acres are actu-
ally leased to local farmers to grow corn and soybeans.
Dow had used the facility for its own proprietary use, explains
Gruszecki. But Provident bought it as an “open access” site with a
view to offer integrated, fee-based, logistical services to other com-
panies. “It has great connectivity to facilities in the Sarnia area,” he
adds.
One of the unique aspects of this purchase was the fact it involved
a union environment. “It was the first time Provident had a union-
ized labour force and had to negotiate a collective bargaining agree-
ment,” says Hantzsch. But the CEP Union was excellent to work
with; there was a lot of respect and good will on both sides. “It was a
great learning experience and was relatively painless.”
In addition, the town’s citizens were pleased about the purchase
as it represented great potential for renewed job growth, giving
Corunna a much-needed, economic shot-in-the-arm after several
troubling, recessionary years.
Provident has already spent $50 million to refurbish the complex,
getting it up to safety and operational standards and providing a
“They decided to get out of the ethylene business in eastern Canada,” says Mike Hantzsch, vice president of business development, and solicited bids for the facility.“We were the successful party and acquired the property in March 2010.”

Ontario Oil & Gas 2012 27
full suite of services. And they are not finished. “It is going to require money but the
analogy we use is that this could become equivalent to our Redwater facility,” says
Gruszecki.
Provident will not only run this facility, but is committed to investing in the broader
community as well. The company has been in talks with the mayor of Corunna, Steve
Arnold, about ways it can become a valuable corporate citizen. To date, it has signed
off on modernizing an historical museum in nearby Sombra, just south of Corunna,
and there will be more projects on the books soon, says Hantzsch. “It is our civic
responsibility.”
It is this focused, strategic and prudent vision along with a plan to work closely and
respectfully with key petrochemical customers and community citizens which bodes
well for Provident Energy’s ongoing success, says Gruszecki. ”It is an exciting time to
be in the energy infrastructure business.” n
• Site & Grading Plans• Severance Applications• Mortgage Surveys (New & Resale)• Reference Plans• Horizontal and Vertical Well
Surveys• Pipeline Surveys• Condominium & Subdivision Plans• Topographical Surveys• Boundaries Act Plans• Construction & Engineering
Surveys• Mapping• Geographical Information Systems• Global Positioning Applications• Drafting, Plotting & Scanning
Services• Quantity Surveying• Database Programming
(519) 672-4551 649 Colbourne Street London, ON N6A 3Z2
Toll free: 1-800-265-4945 • fax: 672-4587 • www.hrlimited.com

Ontario Petroleum Institute | 50th Anniversary Edition28
The Ontario oil and gas industry may be small compared to its western
counterpart, but it’s one well researched and well documented. And,
by far, most of this information can be found in the Ontario Oil, Gas &
Salt Resources Library (OGSRL), located in the southwestern city of
London. The library specializes in the collection, generation and distri-
bution of information on the subsurface geology, petroleum and salt
resources of Ontario. It is home to rock samples from some 14,000
drillings, along with field reports outlining well history, construction,
location, stratigraphy, oil, gas and water-bearing intervals. It also hous-
es an ever-broadening collection of research reports and publications.
TAPPING INTOPOTENTIALFOR GROWTHOntario libraries offer a fountain ofinformation on oil and gas history.
1091 Gorham St., Suite 301, Newmarket, ON, L3Y 8X7 T 1 905 853-3303
•ExplorationProjectManagement•ShaleGasExplorationProjectManagement•WellSiteSupervision•WellAbandonmentandWellSiteReclamation•GeologicalStudies
…a National Historic Site
… the Birthplace of the Modern Oil Industry
OIL MUSEUM CANADAof
2423 Kelly Road, Box 16, Oil Springs, ON N0N 1P0
www.lclmg.org 519 834-2840

Ontario Oil & Gas 2012 29
What is The OOGSR Library?
The Ontario Oil, Gas & Salt Resources Library
is a resource centre for the study
of the subsurface geology, petroleum,
salt and underground hydrocarbon
storage resources of Ontario
ogsrlibrary.com669 Exeter Road London, ON, N6E 1L3 Canada
Telephone: (519) 686-2772 q Fax: (519) 686-7225
“It’s hard to put a value on something like this,” explains Richard
Ostrowski, facilities and program manager, OGSRL. “It’s incredibly
important. This is where companies come to get information. Oth-
erwise, they would have to spend hundreds of thousands of dollars
to build their own libraries.”
An Industry Commitment
The OGSRL owes its beginnings to the late 1800s and early 1900s,
when the Geological Survey of Canada began requesting voluntary
submissions of drill cuttings and core from oil and gas wells drilled
in Ontario and other parts of the country. This led to the creation
of a core and sample processing, storage and study institution in
Ottawa. In 1950, a similar facility was established in the city of
Calgary and all samples from western Canada were sent to this
location.
In 1971, the Petroleum Resource Laboratory (predecessor to the
OGSRL) became the new home to all of the Ontario core and cut-
tings. The current building which houses the OGSRL was built in
1987 and in the following year, responsibility for the library facil-
ity was transferred to the Oil, Gas and Salt Resources Trust, a cre-
ation of the Ministry of Natural Resources. The Minister of Natural
Resources then appointed the Ontario Oil, Gas & Salt Resources
Corporation, a wholly owned subsidiary of the Ontario Petroleum
Today, the OGSRL has a 30+ member base, comprised of corporations and geological consultants and/or individuals.

Ontario Petroleum Institute | 50th Anniversary Edition30
Institute, as the Trustee. This change marked a significant point in
the history – and future – of the OGSRL.
“In 1998, the Ministry of Natural Resources wanted to discard our
entire collection,” explains Ostrowski, adding that it was meant
as a cost-cutting measure at the time. “That’s when the industry
stepped in and took over management of the library.”
Today, the OGSRL has a 30+ member base, comprised of corpora-
tions and geological consultants and/or individuals. Much of the
cost of its day-to-day operation (which currently consists of two
full-time employees, one contract employee and one part-time
contract employee) is covered through these membership fees.
Other funding comes from the cost of preparing and filing the re-
quired cuttings from drilled wells (at a fee of 90 cents per metre)
and from preparing and filing the required core samples (at a fee
of $10 – $30 per metre, depending if they arrive pre-cut or full di-
ametre). All companies that drill wells licensed under the Oil, Gas
and Salt Resources Act are required to collect cuttings samples of
bedrock from the entire length of the drill hole at three-metre in-
tervals and to deliver these samples to the OGSRL. The rest of the
OGSRL’s funding is derived from royalties paid out by every com-
pany that produces oil and gas in the province.
Moving Out of the Stone Age
According to Ostrowski, the primary role of the OGSRL is to provide
data to the industry – be it the geophysical logs of historical or es-
tablished wells, production data or anything in between. The facil-
ity’s files and sample storage areas are available primarily on a self-
serve basis during operating hours (Monday to Friday from 8 a.m.
to 4:30 p.m.). However, staff is available to help if help is required.
Although requests for information may be taken by phone, fax or
email, the majority of current requests occur over the Internet.
As a result, the OGSRL has strived to meet the needs of its mem-
bers over recent years by making sure its wealth of information is
available online.
“I would estimate that about 75 per cent of our information is now
available to our members online,” explains Ostrowski, who adds
that the employees have been busy scanning and digitizing this in-
formation since around the year 2000. “We should have the rest of
our library online within the next two to four years.”
In addition to making the library records accessible to members via
the Internet, the OGSRL also adds value to its ever-growing wealth
of information in other ways.
“Mistakes happen,” states Ostrowski. “One of our roles is to use
historical data to correct misinformation before it goes online.”
Another area in which the OGSRL gets involved is research. A case
in point is the Targeted Geoscience Initiative, which involved the
OGSRL, the Ministry of Natural Resources and Ontario Geologi-
cal Survey in a two-phase initiative known as the Southern Ontario
Hydrocarbon Resource Evaluation and Regional Stratigraphic Syn-
thesis. The project involved the hydrocarbon resource evaluation of
the Ordovician Trenton-Black River hydrothermal dolomite play in
southern Ontario and regional stratigraphic correlations. As to up-
date the evaluation of Ontario’s resources of oil and gas, which was
completed by the Ontario Geological Survey in the early 1980s.
The objective of the second phase of the project was to produce
and publish an updated report based on Paper 67-2 of the Ontario
Department of Energy and Resources Management. The work was
completed in 2005.
“This was a fairly large project for us,” explains Ostrowski, who
adds that the work was completed to all party’s satisfaction. “Ev-
eryone was happy with the results.”
The OGSRL is currently working on a government Emergency Re-
sponse project that will enhance the data available to inspectors
so that the inspectors have a quicker means of responding while
out in the field.
“Due to the generosity of our members, the government and our
industry, we continue to receive support for data and publications
development,” states Ostrowski, who adds that as more and more of
the OGSRL’s data resources are transferred online, there will be more
and more time and resources to pursue other research projects.
Supporting Future Growth
Of course, one of the most significant roles that the OGSRL has
today is to help promote future growth within the Ontario oil and
gas industry. Providing access to data is, of course, one way to ac-
complish this. And the OGSRL remains committed to doing just
that. But an unstable global economy has played havoc on what
was once a thriving industry.
“There has been only about six new wells drilled this year,” states
Ostrowski. “Five to 10 years ago, that number was closer to 80.”
Despite this downturn, Ostrowski remains positive about the fu-
ture – and about the potential for companies to find new resources.
If and when companies begin to tap into this as yet undiscovered
wealth of oil and gas, the OGSRL will be at the ready to step in
and help in any way it can. Comfortably housed in a 6,000 square-
metre facility, the OGSRL is well positioned to support those com-
panies and individuals who are looking to build upon the industry’s
strong history – and the 26,000 existing wells in Ontario – to create
an even brighter and more profitable future.

Ontario Oil & Gas 2012 31
A National StoryAnother oil and gas institution with a strong story to tell is the Oil Museum of Canada (OMC). Opened in July 1960, in commemoration of the 100th anniversary of the dig-ging of the first commercial oil well in North America, the OMC pays tribute to the area’s long and strong history seeped in oil. Visitors to the museum, which is located in the Village of Oil Springs in Lambton County, get to view the site of Canada’s first oil well, dug by James Miller Williams in 1858, or they can take a self-guided Oil Patch Driving tour (that tunes into their FM radio) past some of the adjacent oil wells that continue to produce oil to this day. The museum itself contains four galleries, indoor and outdoor exhibits, tours and some 3,000+ artifacts that help tell the history of what was once the nation’s largest oil-producing area before 1900.
“On average, we get about 4,500 visitors a year,” explains Connie Bell, supervisor, OMC, and a 22-year veteran of the institute. “We get a lot of local visitors, as well as quite a range of international visitors from around the world.”
Preserving a Slice of HistoryInside the two-storey building is an array of exhibits that contain a wealth of information and artifacts. This in-cludes: the Theatre Room (where an introductory DVD explains the history of the area’s oil production); a Main Gallery that explains the historical and geological side of oil; the Oil Springs Gallery that offers insight into the so-cial history of the area; and the Foreign Drillers’ Gallery, which is dedicated to the early oil men who helped shape the industry.
Exhibits located outside of the main building include: Power House, Jerker Lines, Oil Tanker Wagon, Holding Tanks, Langbank Post Office, Canadian Pole Drilling Rig, Blacksmith Shop, Three Pole Derricks, Gum Beds, Procar Tank Car, 1895 Oil Springs Railway Station, Natural Gas Industrial Building, Picnic Area – and the site of the first commercial oil well in North America.
Located nearby are several other significant must-see items, including Ontario’s last Receiving Station, Cribbed Holding Tanks, Modern Holding Tanks, Jerker Lines, His-toric Black Creek, the Shaw Gusher of 1862, Morningstar Holding Tank, the Fairbank Barn Mural, 1904 Morningstar Oil Producers property, the former Watson’s Machine Shop building and the Plank Road to Sarnia.
“This is a national historic site,” explains Bell. “It’s the birthplace of the modern oil industry. The tools, technol-ogy and techniques developed in the Oil Heritage district of Lambton County are significant and helped to lay the foundation for the industry. Local drillers learned their
skills here in Lambton County and then travelled around the world with their expertise. These drillers were re-spectfully known as the Foreign Drillers and they were in high demand.”
A Successful OperationThe OMC employs one full-time employee and three part-time employees. Funding is attained through the sales of items from the OMC gift shop, admissions and donations, as well as through a provincial grant and funding from the Corporation of the County of Lambton.
In addition to an array of international visitors, the OMC also attracts its share of students.
“We do get school tours, although we would like to see more take advantage of this national site,” states Bell. “Our school tours span all grade levels, right into high school.”
A special provincial grant received in 2008 helped mark the 150th anniversary of North America’s first commer-cial oil well at the site and provided money to update the OMC exhibits.
“We were able to use the grant to upgrade museum ex-hibits and signage,” explains Bell. “Today’s generation is looking for bells and whistles. It’s no longer enough to just provide a range of photographs and static displays. We used the money for a variety of different initiatives, including developing the FM radio driving tour, creating a new, introductory DVD, erecting a Foreign Drillers’ tent exhibit inside the museum and tweaking a lot of the ex-hibits to better connect with our visitors.”
As for the future of the OMC, Bell envisions a day when the museum moves beyond its current provincial and na-tional designations.
“Our ultimate goal is to be designated a UNESCO World Heritage site,” she concludes. “There are a lot of steps to be put into place along the way, but that’s the ultimate goal.” n

Ontario Petroleum Institute | 50th Anniversary Edition32
The National Energy Business Centre of Ex-
cellence is a program of the Indian Resource
Council that was officially started in 2008.
The Centre of Excellence has been an evolv-
ing organization that creates programs to
suit the needs of First Nations and the oil
and gas sector.
In January 2012, the National Energy Busi-
ness Centre of Excellence launched our new
water module in our Introduction to Oil and
Gas Development training. This module was
designed to educate First Nations on own-
ership and jurisdiction of water and create a
better understanding around Shale gas de-
velopment, fracing and possible effects on
water. This module was created after con-
sulting fracing companies, various oil and
gas companies and First Nations leadership
to ensure that an un-biased approach was
taken. The issue of water use by the indus-
try has been at the forefront of discussions
surrounding oil and gas development.
In December 2011, in the Introduction to Oil
and Gas Development training, there was a
component where successful First Nations
have been brought in to discuss a “how
to” towards development. The models that
each First Nations hold are specific to their
Nation and the Centre of Excellence recog-
nizes cannot be transplanted from one Na-
tion to another, but the lessons and tools
of “how to” can. The goal of training using
successful First Nations is to give other First
Nations an opportunity to learn and move
forward towards successful development.
In September 2011, the Centre of Excellence
also completed its GAP analysis with the
oil and gas industry to understand the gaps
that exist with First Nations. This will assist
the centre in directing and evolving services
that best fit the needs of the industry to cre-
ate meaningful working relationships with
First Nations nationally.
Over the last four years, the National Energy
Business Centre has been working diligently
to maintain a national mandate and include
First Nations from the various regions in
Canada.
Background – Indian Resource Council
The Indian Resource Council was founded
in 1987 by First Nations Chiefs represent-
ing oil and gas producing First Nations. The
Indian Resource Council was to ensure that
the federal government under Indian Oil
and Gas Canada (IOGC) fulfilled their fi-
duciary and statutory obligations related to
the management of oil and gas resources on
First Nations lands and to further First Na-
tions initiatives to manage and control their
own oil and gas resources. IOGC is a Spe-
cial Operating Agency under the authority
of the Department of Indian and Northern
Affairs Canada.
The Chiefs wanted to establish an orga-
nization that worked alongside IOGC as a
“watchdog” to ensure that IOGC fulfilled its
mandate, especially those mandates that
pertained to their fiduciary and trustee re-
sponsibilities.
The Indian Resource Council has been in-
volved in various developments. Recently,
the Indian Resource Council has been as-
sisting the regulatory changes for the Indian
Oil and Gas Act (that has not been changed
since 1970s). The Joint Technical Commit-
tee 1 is involved in this work.
The Joint Technical Committee 2 has re-
cruited various First Nation people who are
involved in the IRC Board as leaders, busi-
ness leaders and from those communities
that have set up successful business ven-
tures on their lands. This committee serves
in an advisory capacity to the strategic
direction of the National Energy Business
Centre of Excellence.
The National Energy Business Centre of
Excellence was started as a means for First
Nations to receive business development
assistance in oil and gas development.
The Indian Resource Council conducted
a national “First Nations Business Devel-
opment Needs and Priorities” survey and
compiled a report on its findings. All First
Nations expressed a strong will to succeed
and develop their resources to benefit their
communities, but difficulties experienced
in trying to move forward towards develop-
ment. Each First Nation is at different stages
of development whether they have a longer
history with oil and gas activity or whether
they are just starting out. Each approach
that many First Nations take has different
requirements and this is where the National
Energy Business Centre of Excellence has
bUILdING bRIdGESBreaking down barriers betweenFirst Nations and industry
BY CHERYL CaRdInaL, aCTInG dIRECTOR, naTIOnaL EnERGY BUSInESS CEnTRE OF ExCELLEnCE

Ontario Oil & Gas 2012 33
created services to better assist First Na-
tions in gaining economic success.
Services of the National Energy Business Centre of Excellence – First Nations
There were four main service areas that were
developed as a result of the “First Nations
Business Development Needs and Priori-
ties.” These areas are Business Information,
Business and Technical Expertise, Capacity
Enhancement and Networking.
The GAP analysis conducted with First Na-
tions was completed back in 2008, and was
the creation of the centre. Through our busi-
ness and technical expertise, our analysis
with First Nations found that they lacked
the technical knowledge and the dollars to
get involved. This is why the Centre of Ex-
cellence created a program that provides
financial assistance for the “initial stages”
of development. It is important to under-
stand the need of each First Nation varies.
The Business Centre has provided a variety
of assistance to various First Nations. For
business reasons, the names of the First Na-
tions are not disclosed but the type of assis-
tance that they receive is. First Nations have
received assistance with feasibility studies,
abandoned wells, joint venture expertise
and valuation of land to name a few. Each
area of assistance is tailored to the First Na-
tion interested in developing their resources.
The Centre of Excellence developed a work-
shop “Introduction to Oil and Gas Develop-
ment” designed to enhance First Nations
capacity in understanding the oil and gas
industry. This service has been delivered six
times across Canada with a variety of First
Nations communities and organizations.
This service was developed in modules to
adapt to needs of the First Nations.
It’s important to realize there are many op-
portunities where First Nations have been
getting involved. The networking function
of the National Energy Business Centre of
Excellence creates many opportunities for
networking for First Nations with other First
Nations, federal government and oil and gas
industry.
Services of the National Energy Business
Centre of Excellence – Oil and Gas Industry
The same four core service areas exist for
the oil and gas sector that exist for First
Nations. These four service areas are: Busi-
ness Information, Business and Technical
Expertise, Capacity Enhancement and Net-
working.
These areas are still under development, but
major strides have been taken with those
companies that have engaged the Centre of
Excellence towards meaningful relationships
with First Nations.
The National Energy Business Centre of Ex-
cellence has improved these relationships
by assisting some oil and gas companies.
One particular client of the Business Centre
had an issue working with a group of Na-
tions. Within this area, there were five First
Nations that were being consulted with. Of
the five, four had no issues with the devel-
opment and one was holding back. Break-up
was coming fast and if this nation did not
give consent then this company was set to
lose millions of dollars and would cause a
delay in their project. The Centre of Excel-
lence provided assistance to how to best
deal with the situation. In this particular situ-
ation, communication was key to move the
project forward.
The National Energy Business Centre of
Excellence, in partnership with our parent
company the Indian Resource Council, or-
ganized “Chief to Chief meetings” where it
brought together First Nations leaders and
oil and gas executives. These meetings were
to bring together key initiatives and have
frank discussions with the two groups to un-
derstand issues surrounding involvement in
working together.
The National Energy Business Centre of Ex-
cellence has been working to improve good
working relationships with First Nations and
the oil and gas industry. Improving these
economic opportunities and having greater
First Nations participation in the oil and gas
industry will lead to a stronger Canadian
economy for all.
For more information about the National En-
ergy Business Centre of Excellence: please
visit our website at www.nebce.com or
phone at (403) 252-1702. n
API Monogram Tanks (12F) Oil & Gas Separator + 6 PO’s
Sand Traps, Oil & Gas Drips, Controls
Westerman Companies 245 N. Broad Street Bremen, Ohio 43107
800-338-8265
Westerman Companies

Ontario Petroleum Institute | 50th Anniversary Edition34
The Ontario Energy Board’s (OEB) 2006 decision to deregulate
non-utility natural gas storage in the province has opened the door
to a subsequent boom in the market. Several major players an-
nounced development of new storage as a direct result of the de-
cision. Among these are the likes of Union Gas, Altagas, Enbridge
and Market Hub Partners Canada. Additional activity has also taken
place with smaller, independent firms, which are opting to partner
up with the larger industry giants or choosing to go it alone in their
quest for new storage.
“Deregulation has had a positive impact on the development of
storage in Ontario,” states Jim Redford, Director of Business De-
velopment, Union Gas. “Deregulation has encouraged investment
in storage infrastructure by providing investors like Union Gas and
Market Hub Partners Canada the opportunity to manage the costs
and revenues associated with the provision of services in a competi-
tive market.”
According to a Market Operations report from the OEB, natural gas
storage capacity in the province was less than 250 billion cubic feet
(Bcf) in January 2007. By January 2010, that number had increased
to over 260 Bcf. And the OEB’s projections see that number rising
to close to 275 Bcf by January 2013.
Union Gas is by far the largest player in the market. The company
currently has approximately 166 Bcf of working gas storage capacity
in the province.
“Union Gas is ideally situated close to markets and has direct ac-
cess to premium quality storage assets,” comments Redford, who
adds that the company’s Dawn Hub is central to the North Ameri-
can supply and transportation of natural gas. “The Union Gas Dawn
facility features more than 166 Bcf of storage in 23 depleted reser-
voirs, the largest underground natural gas storage facility in Canada,
with all reservoirs interconnected to Dawn and acting as one inte-
grated system.”
The Consumer Choice
According to Natural Resources Canada, more than half of all Ca-
nadian homes are heated by natural gas. And by all accounts, that
number continues to rise. Statistics from the Canadian Gas Associ-
ation (CGA) suggest that there were approximately 5.7 million nat-
ural-gas “customers” in 2005. By 2009, that number had increased
to almost 6.2 million.
Natural gas storage is used as a way to better meet the demands
of these customers. Storage facilities are filled in the summer when
demand is low and then drawn upon during the peak-demand win-
ter months. The Ministry of Natural Resources states that demand
on a very cold, winter day can be as much as five to six times more
than on a warm summer day.
There are three main types of underground natural gas storage that
are currently used today. These include: aquifers, salt caverns and
CREATING CAPACITY
A look atnatural gas
storage afterderegulation
BY MELanIE FRannER

Ontario Oil & Gas 2012 35
depleted gas reservoirs. The latter
represents by far the most com-
mon form of storage because they
are generally the least expensive
and easiest of the three options
to develop, operate and maintain.
The first successful underground
storage of natural gas occurred in a
depleted gas reservoir in Ontario in
Welland County in 1915.
“Most of the natural gas storage in
Ontario is in old gas wells and old
depleted facilities in the Chatham/
Tecumseh area,” says Bryan Gorm-
ley Director of Policy, Economics
and Information, CGA, who adds
that there has been a record amount of storage in Ontario going into
the winter season over the last couple of years. “This is a testament
to the value of storage in the market.”
Gormley suggests that approximately 15 per cent of the total annual
North American natural gas demand is in storage by the month of
October.
“The biggest load for natural gas in North America is, by far, heat-
ing,” adds Gormley. “Winter is the biggest peak in demand. A sec-
ond peak is starting to appear in the summer months, due to a
changing pattern with power generators.”
The development of new natural gas storage facilities is a critical
component of the natural gas distribution infrastructure.
“Deregulation has drawn investment, especially from those entre-
preneurial types that are ready to risk some money,” states Gormley.
“New facilities are being developed. It turns out that storage is one
of the more valuable assets in the integrated natural gas system.”
Boosting Capacity
The post-2006 focus on storage led to the development of signifi-
cant natural gas storage capacity from a number of industry play-
ers. The OEB has identified the following improvements and/or new
storage areas since deregulation:
• Market Hub Partners, new storage area in Lambton County (St.
Clair Gas Storage Pool) with approximately 1.1 Bcf, completed in
June 2007;
• Tribute Resources Inc. and Tipperary Gas Corp., new storage area
in Huron County (Tipperary Gas Storage Pool) with approximately
1.8 Bcf, completed in April 2008 (Union Gas subsequently pur-
chased 75 per cent of storage facility);
• Enbridge Gas Distribution, enhancement in Lambton County
(Kimball Colinville Pool, Wilkesport Pool, and Coveny Pool) with
no incremental capacity, completed August 2008;
• Union Gas, enhancement in Lambton County (Dow A Pool, Oil
Springs East Pool, Payne Pool and Enniskillen 28 Pool) with ap-
proximately 2.0 Bcf, completed November 2008;
• Enbridge Gas Distribution, enhancement in Lambton County (Wil-
kesport Pool) with no incremental capacity, completed March
2009;
• Market Hub Partners and AltaGas, new storage area in Lambton
County (Sarnia Airport Gas Storage Pool) with approximately 5.26
Bcf, completed April 2009;
• Union Gas, enhancement in Huron County (Tipperary Storage
Pool), with no incremental capacity, completed September 2009;
• Union Gas, enhancement in Lambton County (Bentpath East Pool,
Oil City Pool and Bluewater Pool) with approximately 0.52 Bcf,
completed November 2009; and
• Enbridge Gas Distribution, enhancement in Lambton County (Cor-
runa Pool, Seckerton Pool and Dow Moore Pool) with approxi-
mately 4.5 Bcf, scheduled for late 2011 completion.
Other projects currently in the works include:
• Tribute Resources and Bayfield Resources, new storage area in Hu-
ron County (Bayfield Pool and Stanley Pool) with approximately
six Bcf; and
• Union Gas, new storage area in Lambton County (Jacob Pool) with
approximately 2.45 Bcf, scheduled for completion sometime after
2012.

Ontario Petroleum Institute | 50th Anniversary Edition36
These latter two new storage pools provide evidence of the contin-
ued interest in growing the storage capacity in Ontario. They also
represent two of the more interesting additions to the market in that
they involve smaller, entrepreneurial players.
Heralding in Huron County
Tribute Resources Ltd. was founded in 1997 with the intention of
exploring for new natural gas storage. The publicly traded company
initially looked for new storage in existing geological reef pinnacles
(where most of the natural gas pools are usually found and then
converted into storage upon depletion of the reserves). For the most
part, most of the storage pools in southwestern Ontario had been
found in the reef pinnacles in Lambton County. This was due primar-
ily to the location being readily accessible to the existing pipeline
system that connects pools in this area to Union Gas’ Dawn Hub.
“We got the idea of developing storage in Huron County,” explains
Jane Lowrie, president, Tribute Resources Ltd. “There wasn’t a lot
of exploration in the area because there weren’t any pipelines con-
necting it to the main pipeline at the time.”
Tribute Resources undertook the construction and commission-
ing of its first natural gas storage pool. The Tipperary Pool, as it is
known, has up to three Bcf of storage capacity. Tribute Resources
attained approval from the OEB and subsequently sold 75 per cent
interest in the pool in 2007 to Union Gas. The pool became opera-
tional in 2008. It represents one of the first non-utility, competitive
storage facilities to be connected to the Union Gas system and one
of the first to be located in Huron County. Tribute Resources also
owns a number of other pools and prospects located in Lambton,
Huron and Kent Counties.
Of these pools, there are two in particular in which the company
is currently seeking approval from the OEB. Together, the Bayfield
Pool and Stanley Pool represent an estimated six Bcf of storage ca-
pacity in Huron County. As to whether the company will approach
Union Gas once the storage areas are on-line, Lowrie remains mum
about it.
“These two pools were part of our initial purchase of properties,” she
states, adding that today’s current natural gas prices have slowed
down exploration but she remains optimistic about the future. “We
believe that storage prices will rebound soon.”
Discovering New Formations
Up until recently, most of the gas storage within Ontario consisted
of depleted gas pools found within reef pinnacles located in the Si-
lurian “Guelph” geological formation. Most of these reefs, according
to Simon Brame, President and Chief Executive Officer of Liberty
Oil & Gas Ltd., were discovered in the 1950s and 1960s and have
since been developed into storage facilities. But Liberty Oil & Gas
and Union Gas could potentially change this scenario.
Liberty Oil & Gas was founded in 2005 via the acquisition of the
assets of Veteran Resources, which also included a 50 per cent
working interest in the Dover East Pool located in Kent County. The
Dover East Pool consists of two producing formations: a natural
gas-producing pool located in the Trenton Formation (about 850
metres below the surface) and, about 100 metres below that, an oil-
producing pool located in the Black River zone. Unlike the majority
of existing storage pools in southwestern Ontario, the Dover East
Pool is situated in Ordovician aged rocks. The reservoirs in the Tren-
ton and Black River Formations are in fractured and hydrothermal
dolomites, which is quite different from the usual pinnacle reefs.
“The Dover East pool was discovered in 1983 and we thought that it
would have storage capability because it has produced a significant
amount of gas since then,” explains Morley Salmon, director and
vice president, Liberty Oil & Gas. “We’re not in the storage business
so we worked with Union Gas and said that we thought the Trenton
pool would be good for storage. It was risky because no one had
ever done something like this before. It was a completely new geo-
logical storage model for Ontario because it wasn’t located in the
reef pinnacles. The lack of recent discoveries in the pinnacles and
the proximity to the Panhandle gas line were also important factors
in looking at this as a new storage opportunity. ”
Union Gas undertook a series of technical and engineering stud-
ies and eventually agreed that the Trenton Formation in one area
of Dover East Field would be a candidate for natural gas storage.
The final deal was signed in the summer of 2010 and this area of
the Trenton Formation officially became the property of Union Gas.
Union Gas subsequently developed the Jacob Pool in the Trenton
Formation. The OEB approved the facility in July 2011 and Union Gas
is now evaluating the capital and budget plans for proceeding with
this project.

Ontario Oil & Gas 2012 37
“The Jacob Pool is a depleted natural gas reservoir with approxi-
mately 2.63 Bcf of storage capacity,” explains Union Gas’ Redford.
“It is located north of the Thames River and approximately 10 ki-
lometres west of Chatham, Ontario. When completed, it will be
connected to the Dawn Hub through new and existing Union Gas
pipeline assets. It could be the first storage pool in Ontario to be
developed within the Trenton formation.”
In the meantime, Liberty Oil & Gas has given Union Gas the option
to develop other natural gas pools in the area for additional storage.
“This option is pending the outcome of the Jacob Pool conversion,”
adds Salmon.
The company, however, has retained ownership of the oil-producing
Black River pool, which could also become part of the storage proj-
ect in the future.
“I think that the pinnacle reefs will continue to be the primary stor-
age facility in Ontario,” states Brame. “There are still many more Si-
lurian pinnacles to be found, although they will typically be smaller
than previously discovered. Given the interest that Union Gas has
demonstrated in the Trenton zone, I hope that the Trenton under-
goes some increased interest as an area for gas storage. Our next
push will be the Black River. We’re in no rush to give up the oil pro-
duction of Black River but, as far as storage capacity goes, it seems
the next logical step. “
Here Today, Gone Tomorrow
Although deregulation heralded in some brisk growth in natural gas
storage in the province, it came with some challenges. The sharp
growth in natural storage growth can be indirectly attributed to one
of the contributing factors in the currently low price of natural gas.
This may be good news for consumers but not so good for those
companies looking to invest in new facilities.
“Natural gas storage values across North America have weakened
recently due, in part, to the softening demand for natural gas, the
number of storage additions placed in-service across North Amer-
ica in the past three years and the year-over-year increase in new
production from unconventional supply basins, such as the Marcel-
lus shale,” states Union Gas’ Redford.
According to numbers from the CGA’s North American Natural Gas
Supply: Increasingly Unconventional report, unconventional gas
sources (which include coal bed methane and shale gas) represent
an increasingly larger portion of the industry’s natural gas supply.
CGA reports that the amount of natural gas from unconventional
sources has risen from nine per cent of the supply in 2000 to 25 per
cent of the supply in 2010.
At the same time, the discovery of Marcellus shale gas basin (lo-
cated throughout Pennsylvania, West Virginia, southern New York
State, eastern Ohio, western New Jersey and western Maryland) is
anticipated to play a significant role in the North American natural
gas industry.
“If Marcellus production increases as forecast, it will impact flows
of natural gas to Ontario and the U.S. northeast from their tradi-
tional supply regions in western Canada and the U.S. Gulf Coast.
Already, the Marcellus shale has initiated several pipeline proposals
that would connect Marcellus gas to the southern region of Ontar-
io, where it could be connected to the existing pipeline system and
stored in Ontario’s largest underground facilities or sent directly to
market,” states the report, which goes on to suggest that unconven-
tional gas will account for one third of total North America natural
gas supply by the year 2030.
A Positive Outlook
Although current natural gas prices are lower than many utilities
and industry players would like, the fact remains that natural gas
remains a hot commodity still very much in demand.
“The storage business is cyclical, with growth expected over the
long term,” states Union Gas’ Redford. “Storage will continue to pro-
vide security of supply, economical, high-demand seasonal balanc-
ing and optimum pipeline utilization. When gas isn’t burned (but
still being produced), pipelines can still maintain a level of capacity
to fill storage for high-demand periods.”
The need for storage in the Ontario market will be ever-present.
True, there will be times when it may not make economical sense to
invest in and develop new storage capacity but, if history is any indi-
cation, these times will come and go. Eventually, natural gas prices
will rise and companies – big and small – will come flocking to the
storage market.
“I think storage will remain a valuable asset,” concludes CGA’s
Gormley. “The big distribution and utilities companies will always
be looking to own some storage because it is so useful for them to
have. And I think that over the next few years, we will probably see
some more private entities getting into the game.” n

Ontario Petroleum Institute | 50th Anniversary Edition38
Natural gas was first put to work in America,
1816, in Baltimore street lights, but never in
the past two centuries has the debate over
its production been more vociferous than
today. So what’s the issue?
Natural gas is a fossil fuel that emits less
harmful emissions when burned than any
other fossil fuel. The proportion of North
American gas production coming from
shale sources is growing rapidly and has al-
ready reached 30 per cent of all production.
Shale gas production is not practical – and
certainly not economically viable – with-
out the use of hydraulic fracturing (frack-
ing) as a vital production aid. According to
the American Exploration and Production
Council, “90 per cent of all natural gas wells
drilled in America (about 35,000 a year) re-
quires fracture stimulation.”
The American Petroleum Institute says,
“Hydraulic fracturing is a proven technol-
ogy, used safely, for more than 60 years in
more than a million wells. Without it, we
would lose 45 per cent of domestic natu-
ral gas production and 19 per cent of our
oil production within five years.” (Hydrau-
lic Fracturing: Unlocking America’s Natural
Gas Resources, July 19, 2010.) In Canada
fracking has been used since the 1990s.
David MacLean, vice-president of the Al-
berta Enterprise Group, told Resource World
magazine, “Fracking is the future of the
natural gas (NG) industry and it’s critical
for industry to work hard to maintain a so-
cial license to develop these resources. Un-
like man-made pollutants, most oil and gas
seeps are produced by natural geologic pro-
cesses that take place over millions of years.
Though natural, they can pollute our air and
waterways.”
Oil and NG are part of the natural world and
because they are comprised, in part, of toxic
chemicals, they can have naturally-derived
effects on parts of the environment.
Natural gas is comprised chiefly of methane,
which is the smallest and lightest hydrocar-
bon molecule (one atom of carbon and four
of hydrogen.) In part, because of the small
size of the molecule, NG moves freely. Shale
rock structures are so incredibly tight and
non-porous that NG cannot flow at any
reasonable rate to allow for commercial
production. Hydraulic fracturing is used to
crack open the shale in tiny fissures and al-
low the natural gas to be produced.
Fracking uses a water/sand/chemical slurry
that is pumped underground at pressures of
up to 15,000 psi, though usually less. Over
99 per cent of the fracking slurry is water
and sand, but the chemical composition
of the remaining one per cent causes con-
cern. Chemicals such as ethylene glycol
(antifreeze), isoproponal, 2-butoxyethanol,
formaldehyde and others can be used. Die-
sel fuel is often used down hole in many oil
TAkING A LOOk ATFRACkINGLove it or hate it, fracking has been used for over 60 years and remains an importantcomponent of oil and gas production
BY CHRIS BUnKa

Ontario Oil & Gas 2012 39
and gas well drilling operations – not just in
fracking – which is, of course, toxic in itself.
Oil and gas reserves are overwhelmingly
most often found by identifying the subter-
ranean geological formations called anti-
clines that “trap” hydrocarbons with their
sealing characteristics. An underground oil
or gas reservoir exists by virtue of the pres-
ence of that geological seal – preventing
the “leakage” of the hydrocarbons in that
location from traveling through the earth to
some other location.
The issue of groundwater contamination is
driven less from the presence of harmful
chemicals deep underground (that occurs
everywhere there are natural oil and gas re-
serves and regardless of whether we exploit
them) but one of the movement of those
substances to locations where they are not
currently present.
Typically two to four million gallons of wa-
ter is used to fracture a single well, and
with multi-stage fracking and hundreds of
wells in a region, even 1/10th of a percent
of a harmful chemical can be significant.
Some 50 to 80 per cent of the fluids used
are recovered and usually re-used, while a
significant portion remains in the earth. Oil
and gas drilling and completion operations
are large users of water, but as a whole, they
are only incremental to overall consump-
tion. “Calculations indicate that water use
for shale gas development will range from
less than 0.1 per cent to 0.8 per cent of total
water use by basin.” (USDOE Modern Shale
Gas Development)
Companies are approaching the challeng-
es in a variety of ways. EnCana Corp. and
Apache Corp. have jointly spent over $10
million on a pilot project in northeastern
British Columbia to utilize previously unus-
able salt water already naturally contami-
nated with hydrogen sulphide. Such low-
quality water would normally never be used,
but by treating it and removing the worst of
the contaminants, the partnered companies
are hoping to defuse some of the criticism
they face regarding the use of fresh water
for industrial purposes – water that their
adversaries such as ranchers and environ-
mentalists are adamant should be used for
more benign, but vital purposes.
There is no form of energy production used
today that does not use water somewhere
in the process. This includes nuclear en-
ergy which uses vast quantities of water
for cooling that is released back into the
environment. Even solar energy production
uses water in the manufacturing process for
solar cells, for heat transfer in solar thermal
systems and as cooling for concentrated so-
lar systems.
Fracking is designed to open tiny cracks in
the rock. The most commonly used size of
frac sand, the sand that is designed to keep
the cracks propped open. is between 0.42
milimetres and 0.84 milimetres. Typically
a 10-foot or 20-foot crack would be suffi-
cient. There is no commercial gain by ex-
tending the cracks beyond the limits of the
NG reservoir.
It is not impossible that geological seals
in the immediate vicinity of the well bore
could, in theory, be compromised as a re-
sult of high pressure fracking. However, it
is highly unlikely that hydraulically induced
fracturing, designed to open tight rock for a
distance of five to 20-feet, would normally
be capable of destroying a geological seal
that is often hundreds, even thousands of
feet thick.
Still, the industry needs to acknowledge that
simply by random chance, there is the pos-
sibility previously undetected, weak fissures
in underground formations could serve
as a conduit of weakness from an existing
hydrocarbon trap. Millions of oil and gas
wells have been drilled around the world.
The production from every well involves the
movement of hydrocarbons from a relative-
ly stable underground source through a well
bore and into a production facility.
An oil or gas well is much more than a hole
in the ground; it is typically a multi-layered
steel and concrete assembly. Surface cas-
ing is steel pipe that is surrounded by ce-
ment to isolate deeper oil and gas zones
from the shallower zones or even ground
level; any fluids or gases within that pipe
are thereby prevented from “leaking” into
the shallow ground that typically contains
water aquifers.
The depth to which surface casing must be
installed is strictly regulated. In Alberta, the
Energy Resources Conservation Board ap-
proved a Directive on Surface Casing Depth
Requirements as recently as December 14,
2010. Required depths of surface casing are
complex, but, in almost all cases, must be a
minimum of 25 metres below the deepest
water well located within 200 metres of the
proposed well. In many cases, the surface
casing must also extend a minimum of 10
per cent of the true vertical depth of the hy-
drocarbon well.
A detailed series of papers were published
by the American Petroleum Institute in the
1980s, detailing the suitability of well cas-
ings and the likelihood of well casing failure
due to corrosion. The API study found that
in a “modern horizontal well completion in
which 100 per cent of the USDWs [Under-
ground Source of Drinking Water] are pro-
tected by properly installed surface casings,
the probability that fluids injected at depth
could impact a USDW would be between 2
x 10^5 (one well in 200,000) and 2 x 10^8
(one well in 200,000,000).” (DOE: Modern
Shale Gas Development)
Daniel Whitten, vice-president of Strategic
Communications for America’s Natural Gas
Alliance (ANGA) asserts that, “Hydraulic
fracturing is critical to our nation’s clean
energy future.” Because of its vital impor-
tance, he believes it is in industry’s own best
interests to conduct all aspects of explora-
tion and production under the highest stan-
dards possible. “Before hydraulic fracturing
chemicals go “downhole,” integrity tests are
conducted to ensure wells are properly ce-
mented and secure.”
Improper or deficient well construction
presents risks to the environment from
fracking as well as production. The infa-
mous 2010 Macondo oil spill in the Gulf of
Mexico has been blamed, in part, on inad-
equate well construction. David MacLean of
the Alberta Enterprise Group told Resource
World that, “The Gulf Coast spill reminded
us that there is no risk-free method of re-
source extraction, but fracking has been
around for a long time, so this technology
has proven itself.”
Regulation of shale gas production and hy-

Ontario Petroleum Institute | 50th Anniversary Edition40
draulic fracturing is extensive. Most oil and
gas (O&G) regulation is at the provincial
or state level. In Canada, this includes the
National Energy Board, the Alberta Utili-
ties Commission and the Energy Resources
Conservation Board. While over 30 U.S.
states produce some NG, just five – Texas,
Wyoming, Oklahoma, Louisiana and New
Mexico – together produced 65 per cent of
all the gas produced in the U.S. in 2009. Al-
berta alone produces five trillion cubic feet
per year. Regulations in these jurisdictions
are paramount.
In the U.S., the Department of Energy
(DOE) formed the Energy Advisory Board
Subcommittee on Shale Gas Production to
produce “a report on the immediate steps
that can be taken to improve the safety and
environmental performance of shale gas de-
velopment.”
This subcommittee is chaired by MIT pro-
fessor, John Deutch, who said, “Industry,
working with state and federal regulators
and public interest groups, should increase
their best field engineering practices and
environmental control activities by adopting
the objective of continuous improvement,
validated by measurement and disclosure
of key operating metrics. This is the surest
path forward to assure that shale gas is pro-
duced in an environmentally sound fashion,
and in a way that meets the needs of public
trust.”
“The development of shale gas is one of
the biggest energy innovations, if not the
biggest, in several decades,” continued
Deutch. “It has reduced energy costs and
created hundreds of thousands of jobs. But
to ensure the full benefits to the American
people, environmental issues need to be ad-
dressed now – especially in terms of waste
water, air quality, and community impact.”
Recently, the Secretary of Energy Advisory
Board Subcommittee (SEAB) on Shale Gas
Production released its final report on the
environmental and safety aspects of shale
gas development. Their judgment was, “that
if action is not taken to reduce the environ-
mental impact accompanying the very con-
siderable expansion of shale gas production
expected across the country, there is a real
risk of serious environmental consequences
and a loss of public confidence that could
delay or stop this activity.”
On December 8, 2011, the EPA released
a preliminary report that said it may have
found a link between chemicals used in well
fracking in a field in Pavillion, Wyoming, and
a nearby water aquifer. According to the re-
port, “the EPA constructed two deep moni-
toring wells to sample water in the aquifer.”
The draft report indicates that ground water
in the aquifer contains compounds likely
associated with gas production practices,
including hydraulic fracturing. EPA also
re-tested private and public drinking wa-
ter wells in the community. The samples
were consistent with chemicals identified
in earlier EPA results released in 2010 and
are generally below established health and
safety standards.
The testing methodology was quickly criti-
cized by industry, pointing out the depth
of the two test wells far exceeded that of
any actual water wells in the area and pro-
vided an indication only of the migration of
substances below the traps that separate
most drinking water sources from deeper
geologic horizons. It does seem to indicate,
however, a potential link of migration from a
hydrocarbon reserve to a water reserve.
Canada’s Federal Environment Minister, Pe-
ter Kent, requested a study on the develop-
ment of Canada’s shale gas resources from
the nonprofit Council of Canadian Acad-
emies. This is expected to be an indepen-
dent, expert-panel assessment of the state
of scientific knowledge on potential envi-
ronmental impacts.
Maude Barlow’s Council of Canadians Act-
ing for Social Justice has criticized the study
(not expected before early 2013) as too
slow in arriving, and is calling for a morato-
rium on all hydraulic fracking in Canada. The
province of Québec has already imposed a
temporary two-year moratorium, expiring in
March, 2013, as it examines the issues sur-
rounding its use.
Hydraulic fracturing has already been the
subject of a number of exhaustive studies.
The U.S. EPA is conducting a detailed study
of the impact on drinking water from frack-
Oil & Natural Gas Prod Consulting
Project Management
Well Abandonment Design
Rig Supervision
Class I, II, IV MNR Examiner
MNR Liaison
Land Negotiations
Production Optimization
519-671-0876 [email protected] Mantle Place, London, Ontario, N6H 4Z9
Peter G. Miller, B.Sc.PGM Oilfield ServiceS inc.
In Business for 25 years!
• BULL DOZING • SEPTIC TANK INSTALLATION• TRUCKING • WATER LINES• EARTH MOVING • OIL FIELD CONSTRUCTION
MARC RIVARDOwner
R.R. 3, TILBURY, ONTARIO N0P 2L0
OFFICE: (519) 682-1522 FAX: (519) 682-1522 CELL: (519) 358-8544
RIVARD EXCAVATINGLTD.

Ontario Oil & Gas 2012 41
ing activities. The Energy Policy Act of
2005 is criticized by those displeased with
the decision to exempt hydraulic fracturing
under the Safe Drinking Water Act (SDWA)
because of former Halliburton executive
Dick Cheney’s perceived influence. The U.S.
Congress instead maintained the state reg-
ulatory system long in place. Congress did
reserve the right of applying the SDWA al-
ready in place to hydraulic fracturing if and/
or when diesel fuel was utilized down hole.
In May 2009, the Ground Water Protection
Council released a review of oil and gas reg-
ulations as they existed in 27 states in the
U.S., and among many findings, reported
that most have existing requirements to
protect groundwater through the encase-
ment of wells with cement.
Michael Nickolaus was the author of the
report, and as reported by ProPublica.org,
says, “well construction, especially the ce-
menting process that keeps drilling fluids
and gas from seeping into groundwater, is
more important than the fracturing issue.”
The report points out that casing regula-
tions are inconsistent and, in many cases,
may not be thorough enough to reliably
protect against contamination.
All jurisdictions need to require that O&G
companies, in advance of undertaking a
fracking project, provide a list of all chemi-
cals and substances to be used downhole.
The ANGA and its member companies
support publicly available disclosure of
hydraulic fracturing fluids through a stat-
based registry launched by the IOGCC and
the GWPC. Companies need to be held re-
sponsible for any contamination of drinking
water aquifers that does occur as a result of
their activities. Deeper well casings might
reduce the likelihood of unintended migra-
tion and would be easy to regulate.
The O&G industry would do itself a favour
and make the world a better place if it
stopped using any toxic chemicals down-
hole in the fracking process, and found non-
toxic replacement compounds. Most rea-
sonable people will not vilify an industry if it
is not just following existing regulations, but
in particular, when it is continually improv-
ing itself. Daniel Whitten, vice-president
of ANGA says, “continued advancements
mean fewer wells recovering even greater
reserves and creating less surface distur-
bance and waste in the communities where
we work.”
Consider the automotive industry: 33,963
people died in automobile accidents in the
U.S. in 2010. There is no public call for a
banning of all automobile use because so-
ciety understands that the collective use
of the automobile outweighs the damages,
however tragic those damages might be.
Instead, all parties work together to make
automobiles safer. In fact, the death rate in
2010 of 1.16 deaths per 100 million miles
travelled, is the lowest traffic caused death
rate ever recorded in the U.S.
Oil and NG travel naturally through under-
ground rock formations; that technology is
not capable of preventing. Hydraulic frack-
ing unlocks vast quantities of NG for our
use. The benefits of NG use outweigh the
potential damages from the possibilities of
rarely occurring underground migration of
NG.
Humanity has an obligation to hold itself to
a higher standard than it holds the natural
world. After all, we benefit greatly from ma-
nipulating that world to suit our needs. As
we develop natural resources to improve the
lives of all, we must use the best practices
that science and economics will permit, and
continually upgrade those practices. This
will form the foundation of a vibrant North
American natural gas industry for genera-
tions to come.
Republished with permission from Resource
World Magazine Inc. n
Jim McIntosh Petroleum Engineering Ltd.9Drilling and completion design,
wellsite supervision and reporting
9Wellsite and production facility design, construction and optimization
9Gas gathering and compression/dehydration system design, procurement and installation
9Well testing, supervision and interpretation
9Pool and individual well reserve estimation, forecasting and reserve reporting
9Well plugging and abandonment design and supervision
9Government reporting, liaisoning and approvals
519-878-1006 [email protected]

Ontario Petroleum Institute | 50th Anniversary Edition42
Oil and gas industry practices in Ontario are governed by the Oil,
Gas and Salt Resources Act (OGSRA), as administered by the On-
tario Ministry of Resources (MNR). The requirements for oil and
gas well abandonment are specified in the Ontario Standards ref-
erenced in O.Reg. 245, under the OGSRA.
In July 2011, Ontario Regulation (O.Reg.) 511/09 amending O.Reg
153/04 – Records of Site Condition (RSC), under the Environmental
Protection Act, came into full effect. The amendments included up-
dated soil, groundwater and sediment standards, detailed require-
ments for conducting and reporting Phase I and II Environmental
Site Assessments (ESAs), a streamlined risk assessment tool, and
updated requirements to support the filing of an RSC. The Ontario
Ministry of the Environment (MOE) administers O.Reg. 153/04.
The amendments to O.Reg. 153/04 brings the environmental com-
ponent of site reclamation and restoration under the purview of the
MOE. The downhole component of the well abandonment, and the
removal of equipment, is covered off in the Ontario Standards and
administered by the MNR.
The vast majority of oil and gas wells in Ontario are located in rural
agricultural areas. In many cases, once a well has been drilled and
tied into a production facility, the “footprint” of the activity is less
than 10 m2. O.Reg. 153/04, by definition, regardless of the small
footprint of the ongoing activity, considers the individual well site
to be an industrial site. When a well has reached the end of its ef-
fective production capacity and is abandoned, the land comprising
the well site is typically returned to the landowner. The abandon-
ment of the well is undertaken by the well owner in accordance
with the requirements in the Ontario Standards. Since the well site
was used for an industrial purpose, as defined by O.Reg. 153/04,
and it is intended that land use at the well site may be returned to a
more sensitive land use (e.g., agricultural), reclamation of the well
site must follow the O.Reg. 153/04 process and an RSC must be
filed with the MOE before the land use changes.
The minimum requirement to file an RSC is the completion of
a Phase I ESA. The objective of the Phase I ESA is to determine
the likelihood that contaminants have affected land or water on,
in or under the subject property, or in this case the well site and
to identify potentially contaminating activities and corresponding
contaminants of concern. In the past, a Phase I ESA was completed
following the Canadian Standards Association (CSA) Phase I ESA
Standard (Z768-01). The new requirements for a Phase I ESA pre-
scribed in O.Reg. 153/04 are more prescriptive and go beyond the
CSA Standard. Under O.Reg. 153/04, the Phase I ESA must be con-
ducted or supervised by a Qualified Person (as defined by the regu-
lation). A Qualified Person for Environmental Site Assessments is
PLUGGEd INRequirements for well abandonment
BY MUnTazIR PaRdHan, P.EnG., aSSOCIaTE, dILLOn COnSULTInG LIMITEdK.J. O’SHEa, P.GEOL., PaRTnER, dILLOn COnSULTInG LIMITEd
Canlon LimitedAIR AND GAS TREATMENT SYSTEMS
Deliquescent Dryers - Regenerative Dryers
Desiccants - Filtration
Tel: 519-649-7578 • Email: [email protected] • www.canlon.ca
Factory Stocking Distributors for Van Air and Van Gas Systems Specialize in Natural, Fuel, Bio, Digester & Instrument Gas Custom Designed, Engineered to Order Systems Available
Explosion Proof and Hazardous Area Classification
Suite 300, 6 Roslyn Road, Winnipeg, Manitoba, Canada R3L 0G5
Toll Free:1.866.831.4744Toll Free Fax: 1.866.711.5282
www.delcommunications.com
We offer outstanding personal serviceand quality in the areas of:
CREATIVE DESIGN | ADVERTISING SALES
TRADE PUBLICATIONS
QUALIFIED SALES & EDITORIAL TEAM
��� �������������� ���� ��� ����
��� ��� �� ��������
DELCommunications Inc.

Ontario Oil & Gas 2012 43
someone who holds a current licence as a Professional Engineer or
a Professional Geoscientist in the Province of Ontario. The assess-
ment itself includes a considerable amount of background research
on the well site and the surrounding lands, and requires that a legal
survey of the well footprint to be completed for the Phase I ESA.
If the Phase I ESA determines that it is likely “one or more con-
taminants have affected any land or water on, in or under the Phase
One property,” the need for a Phase II ESA is trigged as an addition-
al prerequisite to filing an RSC. In part, this determination is based
on the identification of potentially contaminating activities (PCAs)
on the Phase One property. O.Reg. 153/04 contains a list of PCAs
that includes “discharge of brine related to oil and gas production”
and “hydrocarbon production.” As a result, if an individual well has
produced oil/natural gas or has discharged brine, it triggers the re-
quirement for a Phase II ESA to be completed in support of an RSC.
A Phase II ESA must also be conducted or supervised by a quali-
fied person, and typically includes intrusive soil and groundwater
collection and testing. As with a Phase I ESA, O.Reg. 153/04 is
prescriptive in the approach that must be followed to conduct the
assessment and report the results.
For an RSC to be filed based on a Phase II ESA, soil, groundwater
and sediment samples that are collected and analysed as part of
the Phase II ESA must meet the appropriate standards in the Soil,
Ground Water and Sediment Standards for Use Under Part XV.1 of
the Environmental Protection Act (April 15, 2011). The appropriate
standards are selected based on land use, ground water use (i.e.
potable or non-potable), and soil texture (i.e. coarse or medium/
fine-textured). The contaminants that are often associated with oil
and gas wells include hydrocarbons, salts and other inorganics. At
a site that has soil, groundwater or sediment that does not meet
the applicable standards, the following actions are often taken
prior to filing an RSC:
• Remedial actions (e.g. soil excavation) can be undertaken to re-
duce the level of contamination to below the applicable standards
• A risk assessment can be completed to show that the levels of
contamination present are not a significant risk to human health
or the environment, generate property specific standards that are
protective of human health and the environment and identify risk
management measures to reduce potential risks to acceptable
levels; or
• A combination of remedial actions, risk assessment, and risk
management measures may be implemented to support the RSC.
Once the RSC is filed by a QP, the MOE can either acknowledge
the RSC, return the RSC for revision (for a prescribed defect) or
request that the supporting Phase I and/or Phase II ESA reports be
submitted for review prior to making a decision. The prescriptive
nature of the Phase I and Phase II ESA requirements suggests the
MOE may reject any Phase I and Phase II, and hence the RSC, that
does not absolutely adhere to those prescriptive elements. n
THE OIL WELL SUPPLY CO. (1980) LTD.
P.O. Box 520, 4184 Robert Street, Petrolia, Ontario, Canada N0N 1R0Tel: (519) 882-0310 | Cell: (519) 339-0804 | Fax: (519) 882-3377
The Oil Well Supply Co. Ltd. was established in 1866 to fill the demands of the drilling industry. Located at its original site in Petrolia, our facility consists of a machine shop, welding fabrication shop and forging shop.

Ontario Petroleum Institute | 50th Anniversary Edition44
According to the Geological Survey of Canada, roughly a quarter
of Ontario’s residents, representing half a million households, are
reliant on groundwater as a source of potable fresh water. Most of
these households are rural and represent an even larger propor-
tion of the land area of southern Ontario. But where does this wa-
ter occur? How much is there? Is it all potable? This information is
needed by Ontario municipalities to protect source water supplies.
In the context of this article, groundwater is loosely defined as any
water, fresh or otherwise, occurring in the subsurface, as opposed
to surface water. Groundwater occurs in pore spaces of rocks and
sediments. Surface water occurs in lakes, rivers, streams, wetlands
and oceans, in the atmosphere and frozen in polar ice caps. An
aquifer is any underground layer of water-bearing rock or sediment
from which water can be usefully extracted using a water well. An
aquitard is a layer of rock or sediment that does not readily yield
water and may act as a barrier to water movement.
To date, groundwater mapping in Ontario has been inadequate
to provide even a basic understanding of where our groundwater
resources are located, and the quality and quantity of these re-
sources. This article is a brief summary of progress on an ongo-
ing study by the Petroleum Operations Section of the Ministry of
Natural Resources (MNR) to partially address this lack of informa-
tion. This study is complementary to groundwater mapping being
undertaken by the Ontario Geological Survey which is directed at
shallow fresh water aquifers in the glacial drift overlying bedrock
and in shallow bedrock. Long-term goals of the MNR study are to
document:
• rocks which contain water (aquifers) and oil and gas (reservoirs)
• water type in the aquifers, i.e. fresh water v.s. saline and sulphu-
rous water
• rocks that form aquitards
• regional flow directions of water
• subsurface drilling hazards posed by highly permeable rock for-
mations (loss of circulation)
• areas underlain by aquifers capable of flowing at the surface (ar-
tesian flow)
• geochemical fingerprints of water in regional aquifers
All petroleum wells drilled in southern Ontario intersect at least
one potable water zone, may intersect several aquifers containing
saline and/or sulphurous water in deep bedrock and are anticipated
to encounter hydrocarbons in the target formation. These aquifers,
and the hydrocarbon-bearing formations, must be isolated from
each other so that fluids cannot move from one to the other. This
is of particular importance to prevent contamination of potable
groundwater by the deeper fluids. Some aquifers are locally ca-
pable of flow at the surface and must be isolated during drilling.
Other formations contain sulphur water (dissolved H2S) which is
corrosive to steel casings and must be isolated by sulphur-resistant
cement. Bedrock aquifers with high permeability caused by cavern-
ous porosity or open fractures constitute drilling hazards that may
result in loss of drilling fluid circulation and possibly loss of well
control. The results from this study will result in better well designs
and drilling and plugging programs by the petroleum industry and
reduce the associated risks and hazards to workers, the public and
the environment.
The improved understanding of subsurface conditions will be used
by MNR, as regulator of the industry, to develop and design oper-
ating standards, inspections and investigations, and plugging pro-
grams for orphan wells. The information will also enhance and pro-
vide a scientific basis for the Ministry’s regulatory review process
of proposed drilling programs, injection permits for the purpose of
secondary recovery and proposals for subsurface disposal of oil
field fluids.
Groundwater Data Sources
Two databases are the principal sources of basic information on
the occurrence of groundwater and subsurface geology in south-
ern Ontario. The Water Well Information System, maintained by
the Ontario Ministry of Environment, contains over 600,000 water
well records, including basic data on well location, sediment or rock
type, water quality and quantity, static water level, pump rates and
well construction. These wells are relatively shallow, reaching total
depth only a few metres or tens of metres into bedrock or within
the glacial drift overlying the bedrock.
The principal source of information on water in deep bedrock is the
Ontario Petroleum Data System, which consists of a relational da-
ALL ISWELL
Regional groundwater systems in southern Ontario.
BY TERRY CaRTER, CHIEF GEOLOGIST, PETROLEUM OPERaTIOnS,MInISTRY OF naTURaL RESOURCES, LOndOn, OnTaRIO

Ontario Oil & Gas 2012 45
tabase maintained by the Petroleum Operations Section of the On-
tario Ministry of Natural Resources. These records provide geologi-
cal, drilling and engineering information for over 26,000 petroleum
wells drilled in Ontario since 1858. Stored data include geographic
coordinates for well location, status, depths, geological formation
tops, well construction, oil/gas/water intervals, geophysical logs,
cored intervals and drill cutting rock samples. Water interval data
includes depth, elevation, static level, water type and geological
formation. Without this database the present study would not have
been possible.
Basic well data can be viewed, queried, mapped and downloaded
free of charge from the Oil, Gas and Salt Resources Library’s web-
site www.ogsrlibrary.com. Access to digital geological data, includ-
ing water intervals, is restricted to corporate and individual mem-
bers of the Oil, Gas and Salt Resources Library or can be purchased.
Water well data from across southern Ontario is publicly available
at www.gw-info.net. The water well data has been reformatted
by the Oil, Gas and Salt Resources Library and is available to their
members on their website.
Geology
Bedrock in southwestern Ontario is comprised of marine sedimen-
tary rocks deposited in thick layers on the floor of a shallow sea that
covered this part of eastern North America from approximately the
late Cambrian to at least the early Mississippian and possibly into
the Permian (approximately 501 to 250 million years ago). The
youngest preserved strata in southern Ontario are Upper Devonian
(360 million years old). Maximum preserved thickness of sedimen-
tary rock is 1,400 metres. Approximately 1,300 to 2,000 metres
of younger bedrock was eroded away during the past 250 million
years.
Generalized bedrock geology map of southern Ontario, showing
linear outcrop belts of stratified Paleozoic sedimentary rocks rang-
ing from Cambrian to Upper Devonian in age. Crystalline metamor-
phic and igneous rocks of the Canadian Shield are shown in pink.
Regional dip of the Paleozoic strata is to the southwest.
Preserved rock types include limestone, dolostone, sandstone,
shale, siltstone, and beds of salt. These rocks have varying porosity
and permeability depending on how they were formed or altered
over time. Of particular importance are the presence of several
regional unconformities and disconformities which represent peri-
ods of post-depositional exposure and erosion in the geologic past.
During these periods, where the exposed rocks were carbonates or
evaporites they were subject to dissolution by acidic surface waters
that greatly enhanced the rock’s porosity and permeability. These
rock features, known as “karst” intervals, appear to form most of
the regional bedrock aquifers in southern Ontario.
In most of southern Ontario the bedrock is overlain by a relatively
thin veneer of unconsolidated sediments of glacial or recent ori-
gin. The thickness of these sediments ranges from zero to about
200 metres, but most commonly measures several tens of metres.
These sediments are collectively referred to as overburden or drift
and consist of clay, silt, sand, gravel and glacial till. They are over-
lain by variable amounts of topsoil and sometimes locally with peat
beds in areas of poor drainage.
The glacial sediments were deposited during several episodes of
continental glaciation which affected all of Ontario from 10,000
Steel casings recovered from orphan wells plugged by the Abandoned Works Program of the MNR, illustrating corrosion by exposure to sulphur water in subsubsurface aquifers.
Locations of petroleum wells in southern Ontario. Locations of water wells in southern Ontario.

Ontario Petroleum Institute | 50th Anniversary Edition46
to 1.8 million years ago. These sediments can have pore
space that exceeds 40 per cent to 50 per cent of its total
volume, resulting in a large groundwater storage capac-
ity. Glacial sediments are highly variable and can result in
complex local aquifer systems having multiple layers and
limited lateral extent. Glacial sediments usually exhibit
much greater porosity and permeability than bedrock for-
mations.
Aquifers
At a regional scale, aquifer systems in southern Ontario
can be divided into a complex shallow fresh water system
of local aquifers and aquitards within drift and the upper-
most few metres of bedrock; and a deep bedrock system
comprising thick regional aquitards of low-porosity and
relatively impermeable bedrock containing a few confined
thin aquifers of saline and sulphurous water of local to re-
gional extent.
A scaled geological cross-section across southern Ontar-
io showing regional southwesterly dip of bedrock forma-
tions and occurrence of water, oil and natural gas in these
layered rocks. Fresh water (blue) is confined to a thin ve-
neer of glacial drift and very shallow bedrock. Salty water
containing dissolved H2S (sulfur water), shown in yellow,
occurs at intermediate depths. The deepest rocks contain
highly saline water with no dissolved H2S (orange). Wa-
ter flows downwards from topographic highs and down
regional dip of confining geological formations. There may
be lateral movement of water along strike (circles with x
symbols) due to buoyancy effects of deep saline brines.
The drift sediments are porous and permeable to varying
degrees and act as a sponge soaking up and filtering rain-
Left: Generalized bedrock geology map of southern Ontario, showing linear outcrop belts of stratified Paleozoic sedimentary rocks ranging from Cambrian to Upper Devonian in age. Crystalline metamorphic and igneous rocks of the Canadian Shield are shown in pink. Regional dip of the Paleozoic strata is to the southwest.
Below: Stratigraphic chart of bedrock of southern Ontario showing named geological formations from youngest (at top) to oldest (at bottom), their geological ages and positions of major unconformities (vertical hatch pattern). Karstification of carbonate rocks and evaporites associated with some of these unconformities created extensive aquifers in the bedrock.
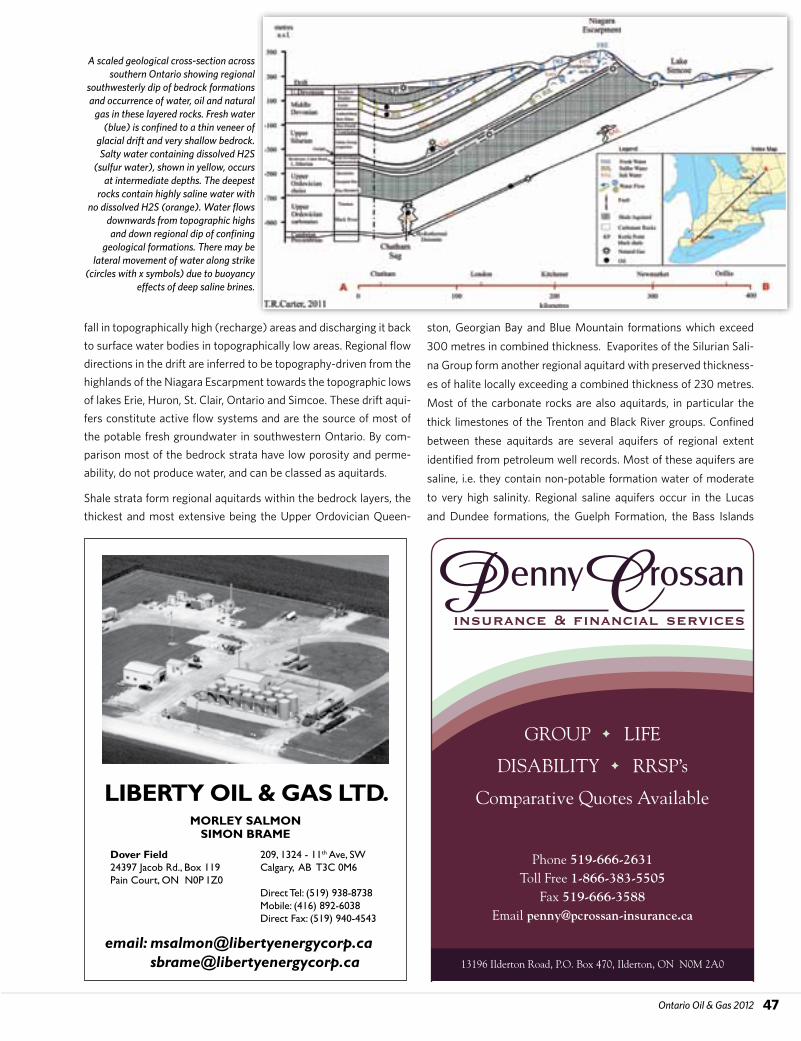
Ontario Oil & Gas 2012 47
fall in topographically high (recharge) areas and discharging it back
to surface water bodies in topographically low areas. Regional flow
directions in the drift are inferred to be topography-driven from the
highlands of the Niagara Escarpment towards the topographic lows
of lakes Erie, Huron, St. Clair, Ontario and Simcoe. These drift aqui-
fers constitute active flow systems and are the source of most of
the potable fresh groundwater in southwestern Ontario. By com-
parison most of the bedrock strata have low porosity and perme-
ability, do not produce water, and can be classed as aquitards.
Shale strata form regional aquitards within the bedrock layers, the
thickest and most extensive being the Upper Ordovician Queen-
ston, Georgian Bay and Blue Mountain formations which exceed
300 metres in combined thickness. Evaporites of the Silurian Sali-
na Group form another regional aquitard with preserved thickness-
es of halite locally exceeding a combined thickness of 230 metres.
Most of the carbonate rocks are also aquitards, in particular the
thick limestones of the Trenton and Black River groups. Confined
between these aquitards are several aquifers of regional extent
identified from petroleum well records. Most of these aquifers are
saline, i.e. they contain non-potable formation water of moderate
to very high salinity. Regional saline aquifers occur in the Lucas
and Dundee formations, the Guelph Formation, the Bass Islands
A scaled geological cross-section across southern Ontario showing regional
southwesterly dip of bedrock formations and occurrence of water, oil and natural
gas in these layered rocks. Fresh water (blue) is confined to a thin veneer of
glacial drift and very shallow bedrock. Salty water containing dissolved H2S
(sulfur water), shown in yellow, occurs at intermediate depths. The deepest
rocks contain highly saline water with no dissolved H2S (orange). Water flows
downwards from topographic highs and down regional dip of confining
geological formations. There may be lateral movement of water along strike
(circles with x symbols) due to buoyancy effects of deep saline brines.
MORLEY SALMON SIMON BRAME
email: [email protected] [email protected]
Dover Field 24397 Jacob Rd., Box 119 Pain Court, ON N0P 1Z0
209, 1324 - 11th Ave, SW Calgary, AB T3C 0M6
Direct Tel: (519) 938-8738 Mobile: (416) 892-6038 Direct Fax: (519) 940-4543
LIBERTY OIL & GAS LTD.
GROUP è LIFE
DISABILITY è RRSP’s
Comparative Quotes Available
Phone 519-666-2631Toll Free 1-866-383-5505
Fax 519-666-3588Email [email protected]
13196 Ilderton Road, P.O. Box 470, Ilderton, ON N0M 2A0

Ontario Petroleum Institute | 50th Anniversary Edition48
and the Cambrian. Saline aquifers of more limited extent have been
documented in other formations. Sulphur water is frequently pres-
ent at shallow to intermediate depths in these bedrock aquifers. This
may represent a mixing zone between meteoric water and brines at
deeper depths but there is currently insufficient data to support this
hypothesis. Flow in these deep aquifers has not been demonstrated.
They may be stagnant or at best exhibit very slow flow due to lack of
pathways for discharge.
The only potable water within bedrock occurs where porous bed-
rock occurs at the surface or immediately beneath drift, in particular
where the bedrock is karstic, i.e. carbonate rocks have been dis-
solved by acidic surface water or groundwater. To date, the deepest
documented occurrence of fresh water beneath the top of bedrock is
200 metres, but usually is confined to the uppermost few metres or
tens of metres of bedrock. At these shallow depths the saline forma-
tion waters have been replaced by fresh water of meteoric or glacial
origin.
The most regionally extensive fresh water aquifer in southern On-
tario occurs at the contact between the drift and bedrock. Except for
the uppermost few metres, the bedrock is relatively impermeable
and forms a barrier to downward percolation of fresh meteoric water
through the overlying drift. Fresh water collects at this lower confin-
ing surface beneath a very large portion of southern Ontario. The
uppermost few metres of bedrock are usually porous and permeable
due to fracturing and weathering, regardless of bedrock type. These
few metres of porous bedrock form part of this “contact” or “inter-
face” aquifer. Flow directions in the contact aquifer are controlled by
topography of the bedrock surface.
Work in Progress
The MNR is producing maps to document the geographic distribu-
tion of water, by type, in each of the regional bedrock aquifers. Maps
showing static levels of water will also be constructed for some of
these aquifers. Publication is anticipated sometime in the next year.
A three-year project to document unique geochemical fingerprints
of the deep saline aquifers is underway, using the knowledge gained
from the present work to identify and constrain locations and inter-
vals for water sampling. The project is a joint investigation with the
University of Western Ontario, under the direction of Dr. Fred Long-
staffe. Geochemical parameters which will be determined include
isotopes of sulfur, hydrogen, and oxygen, and concentrations of dis-
solved cations and anions including Ca, Na, Mg, K, Br, Cl, HCO3 and
SO4. Natural gases are also being sampled to determine the unique
isotopic compositions of carbon, oxygen and hydrogen diagnostic
of different geological reservoir types and plays. The results will be
used to design a practical geochemical tool to enable Abandoned
Works Program staff to determine the geological source of waters
and gases escaping to the surface up unplugged orphan petroleum
wells. This knowledge will improve design of plugging programs and
help reduce plugging costs. The results of the geochemical analyses
will be made available to industry and the public for development of
additional practical applications.
Practical Applications
Drilling and operation of petroleum wells in Ontario is regulated un-
der the Oil, Gas and Salt Resources Act, regulation 245/97 and the
Provincial Operating Standards. Section 3 of the Standards requires
the operator of a well, “plan and effect a casing and cementing pro-
gram for the well to protect all fresh water horizons and all potential
oil-bearing or gas-bearing horizons penetrated during drilling opera-
tions and to prevent the migration of oil, gas or water from one ho-
rizon to another.”
The new understanding of groundwater occurrence in the deep
subsurface provides the regional information needed by industry
to comply with this requirement and by the MNR to monitor com-
pliance. Protection of potable groundwater is achieved in the early
stages of drilling a new well by installation of a steel “surface casing”
that prevents contamination by any saline and sulphurous water or
hydrocarbons encountered in deep bedrock formations. Installation
of additional casings at deeper depths prevent migration of saline or
sulphurous water or hydrocarbons up the well-bore to the surface.
The study has identified and mapped localities with deeper occur-
rences of fresh water than previously appreciated and is already in
use by the MNR to review new drilling proposals. These deep aqui-
fers also constitute a previously unmapped potential supply of po-
table water.
Deep saline aquifers do not produce potable water but may have
other uses. Salty formation water is a nuisance by-product of pro-
duction of crude oil and natural gas from petroleum wells in south-
ern Ontario. This “oil-field fluid” is injected into subsurface saline
aquifers, often the same formations from which it was produced,
using oil-field fluid disposal wells. The deep saline aquifers mapped
in this project and shown above are candidate horizons for disposal
of oil field fluids. A total of 39 oil field fluid disposal wells are cur-
rently licensed for this use in Ontario under the Oil, Gas and Salt
Resources Act.
Some subsurface brines have unique chemical compositions, such
as high calcium content, which make them valuable for commer-
cial purposes. This formation water is produced from special brine
production wells in a very few locations. Where the water contains
dissolved H2S, steel casings must be protected from corrosion by a
sheath of sulphur-resistant cement. Detailed mapping of these ar-
eas is in progress.
Saline aquifers in neighbouring parts of the United States are pro-
posed to be used for injection and permanent storage of carbon
dioxide, captured from large industrial point sources, as a climate
change strategy. There have been preliminary investigations of its
feasibility in Ontario.
The results of this study and ongoing work by the Ontario Geological
Survey is improving our knowledge of the occurrence of groundwa-
ter in Ontario. This information is critical for protection of potable
water supplies, design of drilling programs by the petroleum indus-
try and effective regulation by the MNR. n

Ontario Oil & Gas 2012 49
Enform H2S Alive certification, TDG, WHMIS, Lockout/Tagout as well as many other courses available online.
www.ptscanada.com
The village of Oil Springs is a quiet place, typical of many of the
small hamlets scattered amidst the gently rolling farmlands of
southwestern Ontario. It is a destination requiring a deliberate
sense of purpose, offset and partially obscured from infrequent
travellers on Lambton County Road 21. Attentive drivers may take
note of the alternative name for this stretch of rural highway, Oil
Heritage Road, and momentarily ponder the significance.
The bucolic hush of contemporary Oil Springs belies a clamorous
legacy that fundamentally shaped the modern world, setting into
motion economic and political forces propelling the fate of nations,
and humanity writ large. For it is on this site, in 1858, that James
Miller Williams seized upon an unexpected discovery of free oil
while digging a water well and, with entrepreneurial acumen, set
about the construction and operation of a pot still for the purpose
of manufacturing, transportation and sale of a refined petroleum
product. In doing so, Williams founded the first integrated oil com-
pany in North America. His success did not go unnoticed.
Within the year, word of the Williams operation attracted a wave of
fortune-seekers to the Oil Springs area ,as well as the Oil Creek Val-
ley of Pennsylvania, where Edwin Laurentine Drake demonstrated
the practicality of drilling using pipe to prevent collapse of the well.
The singular accomplishment of both Williams and Drake was not
the discovery of new oil pools, but demonstration of the ability to
produce petroleum in large volumes. This allowed them to capital-
ise on Abraham Gesner’s research and development of the process
to refine crude oil into kerosene, a value-added illumination product
that would displace whale oil in lamps, and ultimately create en-
tirely new markets.
Many competing claims have been made with respect to founding
of the modern petroleum industry, and contentions of prior art con-
tinue to be debated to this day. Indeed, national pride hangs in the
balance for the champions of opposing arguments. The objectivity
of history, disputatious in its own right, inclines to the point of view
that both Williams and Drake benefited greatly from the precedent
research of their time. In both cases, the oil was not “discovered,”
having been procured at sites of surface seeps described by prior
surveys. The Williams No. 1 well was situated in the Enniskillen
Township “gum beds” described by chemist and geologist Thomas
Sterry Hunt, who reported on his analysis of the potential commer-
cial value of the bitumen in the Geological Survey of Canada’s 1849
Report of Progress.
Drake’s “discovery” on the bank of Oil Creek, Pennsylvania was in-
NO STONEUNTURNEdApplied research inOntario’s petroleum geology.
BY BURnS a. CHEadLE, aSSOCIaTE PROFESSOR andBILL BELL CHaIR In PETROLEUM GEOLOGY,
dEPaRTMEnT OF EaRTH SCIEnCES, THE UnIvERSITY OF WESTERn OnTaRIO
Suite 300, 6 Roslyn Road, Winnipeg, Manitoba R3L 0G5Toll Free:1.866.831.4744 | Toll Free Fax: 1.866.711.5282
www.delcommunications.com
DIRECTORIESTRADE PUBLICATIONS
ADVERTISING DESIGN & LAYOUTQUALIFIED SALES & EDITORIAL TEAM
DEL Communications Inc. has in excess of100 years combined experience working for you.
We offer outstanding personal serviceand quality in the areas of:

Ontario Petroleum Institute | 50th Anniversary Edition50
spired by an encouraging research report written in 1855 by Yale
chemist Benjamin Silliman, Jr. Silliman had been supplied with a
sample of “rock oil” swabbed from Oil Creek (so named in 1755)
where both European settlers and the indigenous Seneca people
had been skimming oil from the creek water for various uses since
first settlement of the area.
A pattern was set at the dawn of the modern petroleum industry
that has continued to this day – applied scientific research is a vi-
tal catalyst to propel exploration and development of this essential
commodity. Chemical and engineering studies have been instru-
mental in developing production and processing technologies, but
geological research has played the critical role of identifying new
resources. Ontario’s oil and gas industry has benefited from the
products of such research throughout its storied past, and will rely
on new innovations for its future vitality.
There is a well-established tendency for early exploration efforts to
discover the largest and most easily-detected prospects, with sub-
sequent campaigns increasingly resorting to the search for smaller
and more subtle targets. Ontario has not enjoyed an exception to
this general pattern. Whereas early oil exploration in southwest-
ern Ontario yielded large oil and gas pools from shallow structural
domes in the Devonian play, later drilling proved disappointing and
new plays required significantly more perseverance for detection
and production.
In Ontario’s case, that persistence paid off with the discovery of sig-
nificant natural gas reserves in the Silurian sandstones and carbon-
ate reefs beginning in the late 1800s and continuing through to the
1960s. Oil discoveries, however, proved to be more elusive. It was
not until the 1980s when the combination of evolving seismic tech-
nology and sophisticated applied research into porosity creation by
circulating basinal fluids gave rise to a string of oil discoveries in the
Ordovician Trenton-Black River play.
Although many details of this mechanism are hotly contested and
remain fertile ground for future research, the oil discoveries in On-
tario’s Trenton-Black River hydrothermal dolomite play are proof of
the catalytic power of applied geoscience research in reinvigorat-
ing a dormant industry. The afterglow of successful integration of
research insights, however, is tempered by the inevitable decline of
new discoveries.
Today’s Ontario oil and gas industry faces an all too familiar chal-
lenge of reviving flagging production. The past decade has witnessed
a 65 per cent drop in oil production and 45 per cent drop in natural
gas production (Figure 1). The oil decline is particularly vexing as it
has occurred during the same period that oil prices have tripled. Not
only is the loss of royalty revenues a hard blow to strained provincial
coffers, but vital investment and spin-off benefits are being drawn
away at a time when every job saved is a exacting victory in Ontario.
One hundred and fifty years of intense exploration of a relatively
small oil patch has left few stones unturned, begging the question
if applied research can reprise past victories by lighting the way to
new prospects. The answer, it seems, is to look at those stones that
were previously dismissed as unworthy of attention.
For most of their history, petroleum explorers single-mindedly
sought after only those reservoir rocks that exhibited the large,
interconnected pores that afforded easy flow of oil and gas from
their sponge-like texture. Wells drilled into such rocks yielded their
treasure with little more effort than installation of a pump, some
obligingly flowing oil and gas to the surface ready for the taking. As
the supply of these prolific reservoirs dwindled, the need to replace
declining production forced operators to turn to ever more reluctant
reservoirs that required increasingly sophisticated encouragement
to stimulate production. Throughout this dismal exercise, though,
the hunt continued to focus on target formations that bore at least
a superficial resemblance to the sandstones and limestones that
once delivered prodigious flows. Even these pale pretenders are
now becoming scarce, and attention has now turned to an unlikely
replacement.
Figure 1: Ontario’s oil and natural gas production has declined considerably through the past decade.

Ontario Oil & Gas 2012 51
Once dismissed as the “overburden” or “cap seal” that presented
an unwelcome interval to be drilled on the way to a reservoir target,
clay-rich mudstones (“shale”) formations have now become the
prey. It has been long-recognized that some dense and very fine-
grained shales can store enormous volumes of oil and gas. Provided
they are enriched in organic carbon that has been converted to pe-
troleum and natural gas (“source rocks”), and those products have
not been expelled into adjacent beds of sandstone or limestone, the
opportunity to capture a vast energy supply from shale is enticing.
Shales, however, do not give up their prize easily.
The petroleum industry’s sudden enthusiasm for shale reservoirs
has presented geoscience researchers with unexpected challenges.
Despite comprising almost two-thirds of the sedimentary rock re-
cord, surprisingly little was known of the fundamental character-
istics of shales as recently as 10 years ago. Industry and academic
researchers have worked furiously to close this knowledge gap.
Employing tools and methods from basic fieldwork to sophisticated
scanning electron microscopy, geologists have recorded and inter-
preted observations from the very large to the very small in order to
glean insights into the inner workings of the deceptively complex
shales. New models have recently emerged that confront some of
the enduring beliefs about how mud is deposited, how it evolves
into shale rock and how that rock can store and transmit fluids.
The challenge for oil and gas producers is that the pore spaces that
store hydrocarbons between the microscopically small particles
comprising shales are so infinitesimally tiny that flow from the rock
is effectively nonexistent. Without the benefit of the superhighways
of interconnected pores that characterise conventional reservoir
rocks, the minuscule droplets of petroleum in shale formations
must squeeze their way through a winding maze of narrow corridors
and blind alleys. In many cases, the porosity passageways are so
narrow that flow is marshalled into queues of individual molecules.
Under special circumstances, nature provides a remedy to this con-
stricted flow in the form of natural fractures. Compared to the shale
micropore network, a fracture that appears as a hairline crack to
the naked eye is, in fact, a vastly wider artery that connects isolated
capillaries and cul-de-sacs into an effective drainage system. Nat-
urally-fractured “tight” reservoirs such as the Austin Chalk in Texas
and the Monterey Formation in California can be bountiful produc-
ers of oil and natural gas, but natural fractures can be unreliable
contributors with uncertain extent and a frustrating tendency to
snap shut as formation pressure declines with production. In many
instances, natural fractures simply do not develop in organic-rich
shale formations because the rock is not sufficiently brittle. In oth-
ers, fractures have been sealed shut by mineral cements. In either
case, without fractures to provide access to the myriad microscopic
pores, the oil and gas will remain entombed.
Hydraulic fracture treatments were designed to mimic beneficial
natural fractures, but to do so in a targeted and enduring fashion. By
pumping highly-pressurized water into the formation, the rock will
crack open in a direction dictated by the geology. Sand or ceramic
beads are injected into the induced fractures in order to prop them
open for the duration of production. Hydraulic fracturing has been
in routine use for conventional oil and gas well stimulation since
the late 1940s, and proponents point to this long uneventful history
as evidence of the safety of the procedure. The design of hydrau-
lic fracture treatments, however, has evolved significantly from the
programs used throughout most of that history, and the safety and
effectiveness of modern treatments should be evaluated in the con-
text of specific design parameters.
Two characteristics distinguish many of the current fracturing oper-
ations from their historical predecessors. First, in order to stimulate
flow from a shale reservoir, 10 or more stages of hydraulic fracture
treatments are performed along the length of a well drilled horizon-
tally through a target zone. The combination of induced fracturing
with long horizontal wells increases the well’s contact with the shale
reservoir by over 1,000 times.
Secondly, the cumulative volume of water, proppant and additives
injected in a multistage treatment program can exceed 10,000 cu-
bic metres. In contrast, a typical conventional fracture treatment
requires just 200 cubic metres of fluid.
The commercial development of petroleum and natural gas re-
sources produced from naturally-fractured or hydraulically frac-
tured carbonaceous mudstone reservoirs (colloquially known as
“shale oil” and “shale gas”) accelerated rapidly in the latter half
of the past decade. Buoyed by early success in the prolific Barnett
Shale natural gas play of the Fort Worth Basin and the Bakken Shale
oil play of North Dakota and Saskatchewan, operators have aggres-
sively developed a growing number of active shale plays in North
America (Figure 2).
Figure 2:Shale gas (red)and shale oil (green)have become thegrowth engine for theNorth American oiland gas industry overthe past decade.

Ontario Petroleum Institute | 50th Anniversary Edition52
Recent successes announced by various operators in the eastern
Ohio Utica Shale / Point Pleasant oil play trend raise the possibility
that similar oil production potential may extend to related forma-
tions in southwestern Ontario (Figure 3). Previous work has con-
firmed good to excellent source rock characteristics in the Upper
Ordovician Collingwood Member and the lower part of the overly-
ing Blue Mountain Formation. Much of the understanding comes
from a provincial program to characterise oil shale potential in
Ontario during the 1980s, as well as Geological Survey of Canada
research programs. The exploration concept that is now under con-
sideration is that some of the more deeply-buried occurrences of
these carbon-rich shales in the onshore lands adjacent to Lake Erie
may hold oil resources that could be produced using hydraulic frac-
ture treatments of horizontal wells.
A modest degree of enrichment of organic carbon in a shale unit
like the Blue Mountain Formation is no assurance of commercial
prospectivity. Numerous other geological factors remain to be as-
sessed, including considerations of how much of that carbon has
been converted to petroleum, whether the oil has been retained
in the shale, and if the rock is amenable to horizontal drilling and
hydraulic fracture treatments. These are all fertile ground for new
applied research programs that will help communicate the resource
potential in the public domain, but they only touch upon one facet of
the question. It is in the public interest of Ontario’s citizens, regula-
tors and landowners to form a complete understanding of the po-
tential value and costs of developing a new energy resource.
Development of shale-based oil and gas plays has touched off a
chorus of concerns regarding the environmental impacts of such
activity, particularly in the areas of the U.S. northeast most affected
by drilling in the Marcellus and Utica shale gas plays. Peer-reviewed
scientific research has been divided on the topic, but public con-
cerns are primarily focused on the potential for groundwater con-
tamination resulting from hydraulic fracturing operations. The lack
of baseline information about groundwater conditions prior to drill-
ing and production operations has had the chilling effect of polaris-
ing the debate between landowners who claim that contamination
has occurred and operators who argue that anomalies are natural
background variation.
Applied geological research has much to contribute to an informed
conversation about the relative merits of shale oil exploration and
development in Ontario. Beyond an objective assessment of the
size and quality of the resource, a geological evaluation of the un-
derlying tectonic controls, uncertainties and risks of induced frac-
ture propagation in potential development regions would be a valu-
able asset for all stakeholders. As a complementary component of a
baseline hydrogeological survey, knowledge of the range of possible
outcomes of hydraulic fracturing operations could guide project
planning, regulatory framework, and landowner consultations to-
ward responsible development decisions.
Today, the dim echo of Oil Springs frenetic beginnings reverberates
through a global industry that permeates virtually every aspect of
modern life. Discoveries based on ever-evolving geological insights
have pushed back exploration frontiers in the relentless quest for
energy supplies. Deep below the depleted oil pools that once fu-
elled the economic growth of a young Ontario lies a new frontier in
shales that may hold the promise of reinvigorating North America’s
oldest oil patch once again. New days bring new expectations, how-
ever, compelling geological research to shed light on promise and
peril alike. n
Figure 3: The Utica Shale and Point Pleasant Formation that host eastern Ohio’s emerging shale oil play are closely related to source rocks in
southwestern Ontario. The Rouge River Member is a local name for the lower petroliferous unit of the Blue Mountain Formation.
Douglas R. Munro Owner/Operator
h. 519-882-2459 c. 519-383-3353
4520 Marthaville Rd. R.R. No. 3
Petrolia, ON N0N 1R0Stevenson Oil
Please support the advertisers who
help make this publciation possible.
Our Index to Advertisers can be found on
page 4.

Ontario Oil & Gas 2012 53
Introduction
Upper Cambrian siliciclastic and carbonate rocks are the oldest pre-
served Paleozoic strata in southwestern Ontario and lie directly on
the Precambrian basement. They underlie approximately 48,000
km2 (Bailey and Cochrane, 1984), an area slightly less than 50 per
cent of that underlain by Paleozoic strata. The regional Precambrian
basement structure of southwestern Ontario is dominated by a
broad, northeast-trending high known as the Algonquin Arch. It is
an extension of the Findlay Arch to the southwest, separated by a
structural depression known as the Chatham Sag. The Algonquin
and Findlay Arches separate the Appalachian Basin from the Michi-
gan Basin (Figure 1).
During Upper Cambrian time sediments were deposited throughout
southwestern Ontario, onlapping and extending over the Algonquin
Arch as early Paleozoic seas transgressed the Precambrian surface
(Johnson et al., 1992). Subsequent exposure and erosion during de-
velopment of the regional pre-Middle Ordovician Knox unconfor-
mity resulted in the removal of Lower Ordovician and much of the
Cambrian strata from southwestern Ontario (Johnson et al., 1992).
The distribution of Cambrian strata around the edges of the Algon-
quin arch with successively younger units overlapping one another
to lie directly on the Precambrian basement indicates that the arch
had a configuration very similar to the present during Upper Cam-
brian time (Sanford and Quillian,1959).
Hydrocarbon reservoirs (Figure 2) are found in stratigraphic traps
along the Cambrian subcrop edge and in structural traps associated
with faulting. The depth of the reservoir varies from 700 to 1,200
metres. All commercial oil and gas pools discovered to date are on
the Appalachian Basin side of the Algonquin Arch. On the Michigan
Basin side, where the Cambrian lies virtually untested, no commer-
cial accumulations have been found.
Formation Description
Thickness of the Cambrian section ranges from approximately 175
metres in the centre of Lake Erie to zero metres at the pinch-out edge.
In the western part of southwestern Ontario (west of about longi-
tude 81º or approximately London, Ontario) the basal rocks consist
of mainly quartz sandstone (Mount Simon Formation); overlain by
sandstone, sandy and shaly dolomite (Eau Claire Formation); and
then buff to grey-buff dolomite (Trempealeau Formation). In the
eastern part (east of about longitude 81º), the basal rocks consist
of arkose, and quartz sandstone (Potsdam Formation); overlain by
dolomite, sandy dolomite, and sandstone (Theresa Formation); and
then light buff, crystalline dolomite (Little Falls Formation). As the
Cambrian strata approaches its pinch-out edge on the Algonquin
Arch these units become less distinct and the formation terminol-
ogy becomes less appropriate (Bailey and Cochrane, 1984).
Trap and Seal
Cambrian stratigraphic traps occur along the updip pinch-out edge
of porous strata (Figure 3a). The pinch-out edge is present in south-
western Ontario on both sides of the Algonquin Arch. The Innerkip
Cambrian Reservoirs ofSOUTHWESTERN ONTARIO
BY MICHaEL dORLand, OnTaRIO OIL, GaS & SaLT RESOURCES LIBRaRY
Figure 1. Regional structural setting of southern Ontario (shaded area), show-ing position of major arches and basins.
Figure 2. Cambrian oil and gas pools and the subcrop distribution of Cambrian sediments in southwestern Ontario. Modified from Sanford and Quillian (1959) and Trevail (1990).
Technical Feature

Ontario Petroleum Institute | 50th Anniversary Edition54
and Gobles pools are the best examples of Cambrian (Cam-
bro-Ordovician) stratigraphic traps. These pools are formed
by porous sandstones preserved within a north-to northwest
trending embayment on the irregular surface of the Pre-
cambrian basement. The sand in the embayment extends
40 kilometres north of the regional pinch-out edge on the
southern flank of the Algonquin Arch. Some of the overly-
ing Middle Ordovician Shadow Lake Formation sediments
are also porous sandstones and are believed to form part of
the reservoir, especially high on the crest of the Algonquin
Arch. Shales and sandy shales of the Middle Ordovician Shadow
Lake Formation provide the top seal and create conditions favorable
for stratigraphic entrapment of hydrocarbons. The reservoir is only
a few metres in thickness.
A small number of Cambrian oil and gas pools have been discovered
in structural traps on the Appalachian Basin side of the Algonquin
Arch. Basement faulting and vertical movement of fault blocks that
cut through and uplift overlying Cambrian strata create structural
traps through juxtaposition of porous and permeable strata against
non-permeable lithologies. One excellent example is the Clearville
oil pool (Figure 3b). Here, the reservoir is formed by porous sand-
stone and sandy dolostone in the crest of a tilted horst block sealed
by overlying shales of the Shadow Lake Formation and laterally by
Middle Ordovician Gull River Formation limestones.
More detailed information pertaining to each reservoir type and
most of the Cambrian pools can be found in Bailey and Cochrane
(1984), Burgess (1962), Pounder (1964) and Trevail (1990).
Historical ProductionThere are 21 pools in southwestern Ontario where wells have been completed to produce hydrocarbons from the Cambrian. Of these pools, 11 have produced commercial quantities and are still on production. Clearville, Dunwich 16-I, Dunwich 18-I, Dunwich 8-22-ABF, Ekfrid 8-V-S, Ekfrid 10-V-S and Willey North produce oil; Gobles and Willey produce oil and gas; and Innerkip and Raleigh 1-17-XIII produce gas. Aldborough 4-Z-II and Shanks pools pro-duced oil and gas for a short period of time before recompletion to produce from shallower formations. Glanworth, New Glasgow and Rockton pools produced gas but were abandoned with no produc-tion records. Small quantities of oil and gas were produced from Electric, Southwold 8-22-NNBTR, St. Patricks, Verschoyle and Zone
5-III pools before abandonment.
The first Cambrian gas reservoir, the Electric pool, was discovered
in 1948, with cumulative production of 789 E6m3 (28 Bcf) from
Cambrian gas pools to the end of 2002. Over 89 per cent of the
Cambrian gas production has been derived from the Innerkip gas
pool, which had a cumulative production of 782 E6m3 (27.6 Bcf) to
the end of 2010. The Innerkip gas pool was discovered in 1961, but a
major extension of the pool was discovered in 1986. Development
of the Innerkip gas pool continued to the end of 2001 and in 2002
the pool produced 6.5 per cent of annual Ontario gas production.
The first Cambrian oil reservoir, the Shanks pool, was discovered in
1923 but it was the Gobles pool, discovered in 1960, that stimulat-
ed exploration for Cambrian oil. Over 93 per cent of the Cambrian
oil production has been derived from three pools. These are the
Clearville, Gobles, and Willey pools which had a cumulative pro-
duction of 820 E3m3 (5.1 MMBO) to the end of 2002.
Reservoir Characteristics
Core analyses show average porosity of 9.2 to 11.8 per cent to a
maximum of 20 per cent and average permeability of 1 to 67md
and locally up to 300md for the major pools (Bailey and Cochrane,
1984). Within the known reservoirs the Cambrian units are gener-
ally porous and permeable throughout but mixed lithologies cause
large fluctuations in porosity and permeability values. The pres-
ence of mixed grain sizes, filling of pores by clays and cementa-
tion has resulted in reduction of primary interparticle porosity and
permeability in the siliciclastic units. In the Innerkip pool primary
porosity has been substantially reduced by authigenic and diage-
netic illite and chlorite clays and extensive quartz and K-feldspar
overgrowths, calcite, dolomite and anhydrite cements (Dorland,
2001). Secondary intercrystalline porosity and permeability by do-
lomitization has occurred in the carbonate units, which also has
been reduced by clays and cements.
Current Exploration & Development and Exploration Methods
A total of 112 wells tested the Cambrian for oil and gas from 1992 to
Figure 3. A. Diagrammatic cross-section through a Cambrian stratigraphic trap such as the Gobles and Innerkip pools. Porous
Cambrian sandstone and/or dolostone and possible Middle Ordovician Shadow Lake Formation sandstone are filled with
hydrocarbons where they pinch-out against the Algonquin Arch. B. Diagrammatic cross-section through a Cambrian fault trap such as
the Clearville pool. Porous Cambrian sandstone and/or dolostone in the crest of the fault block are filled with hydrocarbons. Adapted
from Bailey and Cochrane (1984).
Technical Feature
Ontario Oil & Gas 2012 55
2001. Extension and development of the Innerkip gas pool account-
ed for 104 of these wells, of which 72 were completed as gas pro-
ducers. The other eight tests resulted in one new pool (Aldborough
4-Z-II), two oil and gas shows, one oil show, one gas show and three
dry holes. No wells were drilled to test Cambrian targets for oil and
gas in 2002. At the time of writing in 2003, one new pool well was
completed in the Cambrian and four additional well licences with
Cambrian targets have been issued.
Stratigraphic prospects in the Cambrian play are usually defined
with subsurface geology. Seismic is useful if the reservoir shows
some degree of structural control as with Cambrian structural traps
in tilted fault blocks. Seismic is of limited use along the pinch-out
play because of the thin pay zone. Locating stratigraphic traps along
the Cambrian pinch-out requires reconstruction of the meandering
Cambrian erosional edge and if possible the Precambrian basement
configuration as Cambrian sandstones tend to thicken in structural
lows. Gravity and magnetic surveys may be of assistance in inter-
preting the Precambrian surface or finding areas deserving further
investigation using seismic.
Future Potential
The Cambrian play is largely underdeveloped leaving considerable
potential for additional discoveries. Cambrian sediments underlie
an area of over 48,000 km2 in southwestern Ontario, but only 1050
wells have tested Cambrian targets to the end of 2002. Potential oil
and gas reserves for the Cambrian play were estimated by Bailey
and Cochrane (1984) at 20.9 E6m3 (131.3 MMBO) and 6.3 E9m3
(222 Bcf), respectively. Total potential reserves for the stratigraphic
pinch-out edge play are 3.0 E6m3 (19.1 MMBO) oil and 5.1 E9m3
(180 Bcf) gas and for the structural play area 17.9 E6m3 (112.3
MMBO) oil and 1.2 E9m3 (42 Bcf) gas. To the end of 2002, cumula-
tive oil production is 802 E3m3 (5.0 MMBO) and cumulative gas
production is 789 E6m3 (28 Bcf).
Possible areas for future exploration might also include areas over
the Algonquin Arch where Cambrian strata are absent due to ero-
sion during development of the Knox unconformity. Bruce Bailey, an
Ontario geologist, has proposed (personal communication, paper in
progress) that the Innerkip and Gobles pools may not contain Cam-
brian sediments but are composed of sediments remaining after
the Knox erosional episode and sandstones of the Middle Ordovi-
cian Shadow Lake Formation. Therefore exploration for an “Innerkip
style” reservoir would not be confined to areas where the Cambrian
pinches out against the Precambrian basement .Prospective areas
could be any place where porous Paleozoic sediments are present
at the Precambrian-Paleozoic unconformity since the unconformity
has acted as a major fluid conduit throughout its history (Sanford et
al., 1985; Harper et al., 1995). The Arthur pool located in Wellington
County on top of the Algonquin Arch 65 km. north of the Innerkip
pool has anomalous production from the Shadow Lake Formation
and is an example of a reservoir at the unconformity far removed
from Cambrian strata.
ReferencesBailey Geological Services, and Cochrane, R.O. (1984) Evaluation of the con-
ventional and potential oil and gas reserves of the Cambrian of Ontario. Ontario Geological Survey Open File Report 5499, 72 p.
Burgess, R.J. (1962) Cambrian hydrocarbon traps on the north-west rim of the Appalachian Basin. Proceedings of the 1st Annual Conference of the Ontario Petroleum Institute, 24p.
Dorland, M.J. (2001) Petrography and Diagenesis of Cambro-Ordovician Reservoir Rocks from the Innerkip Gas Pool and Gobles Oil Pool, South-western Ontario. Unpublished B.Sc. thesis, University of Western Ontario, 88p.
Harper, D.A., Longstaffe, F.J., Wadleigh, M.A. and McNutt, R.H. (1995) Sec-ondary K-feldspar at the Precambrian-Paleozoic unconformity, south-western Ontario. Canadian Journal of Earth of Earth Sciences v.32, p. 1432-1450.
Johnson, M.D., Armstrong, D.K., Sanford, B.V., Telford, P.G., and Rutka, M.A. (1992) Paleozoic and Mesozoic geology of Ontario, in Geology of Ontario: Ontario Geological Survey Special Volume 4, Part 2, p. 906-1008.
Pounder, J.A. (1964) Cambrian of Ontario. Proceedings of the 3rd Annual Conference of the Ontario Petroleum Institute, 24p.
Sanford, B.V. and Quillian, R.G. (1959) Subsurface stratigraphy of Upper Cambrian rocks in southwestern Ontario. Geological Survey of Canada, Paper 58-12, 17p.
Sanford, B.V., Thompson, F.J. and McFall, G.H. (1985) Plate Tectonics – a possible controlling mechanism in the development of hydrocarbon traps in southwestern Ontario. Bulletin of Canadian Petroleum Geology v.33, p. 52-71.
Trevail, R.A. (1990) Cambro-Ordovician shallow water sediments, London area, southwestern Ontario. In Geology of Southwestern Ontario, A Core Workshop (ed. T.R.Carter), p.29-51. American Association of Petroleum Geologists, 1990 Eastern Section Meeting, London, Ontario. n
Doug Swayze, President
S & S Energy Resources Inc
R.R. # 3 20289 Moore Road Ridgetown, ON
N0P 2C0
Ph: 519-674-2358 Fx: 519-674-2532
Technical Feature
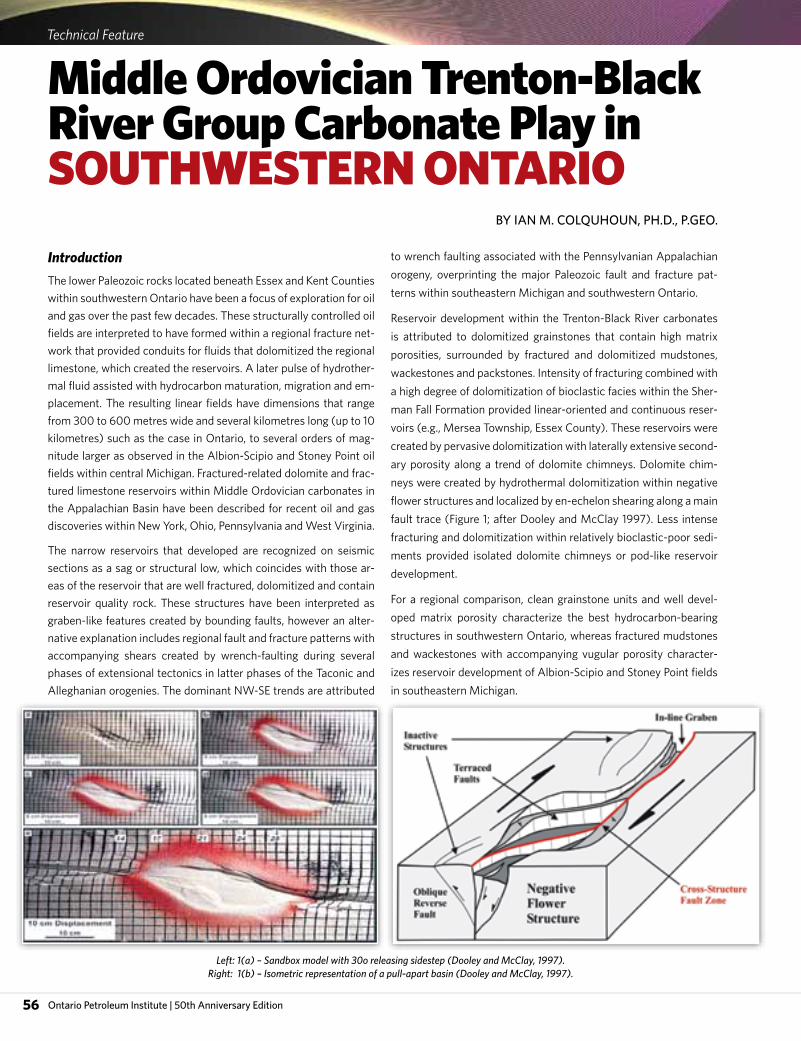
Ontario Petroleum Institute | 50th Anniversary Edition56
Introduction
The lower Paleozoic rocks located beneath Essex and Kent Counties
within southwestern Ontario have been a focus of exploration for oil
and gas over the past few decades. These structurally controlled oil
fields are interpreted to have formed within a regional fracture net-
work that provided conduits for fluids that dolomitized the regional
limestone, which created the reservoirs. A later pulse of hydrother-
mal fluid assisted with hydrocarbon maturation, migration and em-
placement. The resulting linear fields have dimensions that range
from 300 to 600 metres wide and several kilometres long (up to 10
kilometres) such as the case in Ontario, to several orders of mag-
nitude larger as observed in the Albion-Scipio and Stoney Point oil
fields within central Michigan. Fractured-related dolomite and frac-
tured limestone reservoirs within Middle Ordovician carbonates in
the Appalachian Basin have been described for recent oil and gas
discoveries within New York, Ohio, Pennsylvania and West Virginia.
The narrow reservoirs that developed are recognized on seismic
sections as a sag or structural low, which coincides with those ar-
eas of the reservoir that are well fractured, dolomitized and contain
reservoir quality rock. These structures have been interpreted as
graben-like features created by bounding faults, however an alter-
native explanation includes regional fault and fracture patterns with
accompanying shears created by wrench-faulting during several
phases of extensional tectonics in latter phases of the Taconic and
Alleghanian orogenies. The dominant NW-SE trends are attributed
to wrench faulting associated with the Pennsylvanian Appalachian
orogeny, overprinting the major Paleozoic fault and fracture pat-
terns within southeastern Michigan and southwestern Ontario.
Reservoir development within the Trenton-Black River carbonates
is attributed to dolomitized grainstones that contain high matrix
porosities, surrounded by fractured and dolomitized mudstones,
wackestones and packstones. Intensity of fracturing combined with
a high degree of dolomitization of bioclastic facies within the Sher-
man Fall Formation provided linear-oriented and continuous reser-
voirs (e.g., Mersea Township, Essex County). These reservoirs were
created by pervasive dolomitization with laterally extensive second-
ary porosity along a trend of dolomite chimneys. Dolomite chim-
neys were created by hydrothermal dolomitization within negative
flower structures and localized by en-echelon shearing along a main
fault trace (Figure 1; after Dooley and McClay 1997). Less intense
fracturing and dolomitization within relatively bioclastic-poor sedi-
ments provided isolated dolomite chimneys or pod-like reservoir
development.
For a regional comparison, clean grainstone units and well devel-
oped matrix porosity characterize the best hydrocarbon-bearing
structures in southwestern Ontario, whereas fractured mudstones
and wackestones with accompanying vugular porosity character-
izes reservoir development of Albion-Scipio and Stoney Point fields
in southeastern Michigan.
Middle Ordovician Trenton-blackRiver Group Carbonate Play in SOUTHWESTERN ONTARIO
BY Ian M. COLqUHOUn, PH.d., P.GEO.
Left: 1(a) – Sandbox model with 30o releasing sidestep (Dooley and McClay, 1997).Right: 1(b) – Isometric representation of a pull-apart basin (Dooley and McClay, 1997).
Technical Feature

Ontario Oil & Gas 2012 57
Historical Production
Ordovician dolomites of the Trenton and Black River groups of the
Michigan Basin have been prolific oil and gas producers since the
late 1800s with the discovery of gas in the Trenton Group carbon-
ates east of Findlay, Ohio and oil outside of Lima, Ohio in 1894 and
1895, respectively. The field that developed following these discov-
eries produced more than 500,000 bbls of oil and approximately 1
Tcf of gas during the late 1800s and into the early 1900s (Caprarotta
et al. 1988). Bownocker (1903) documented the first oil and gas dis-
coveries that started on the northern flanks of the Findlay-Kankakee
Arch in Indiana and Ohio in 1884. Oil production since then exceeds
500 million barrels from linear highly dolomitized reservoirs around
the Bowling Green fault zone (Keith 1985).
The first linear fracture-related, hydrocarbon bearing Trenton-Black
River pool in Ontario was discovered at Dover in 1917 (refer to pools
map insert). The Dover field is also an elongated, east-west trend-
ing, dolomitized reservoir located within a synclinal sag structure
(Burgess 1960). The Dover pool has produced ~14 Bcf of gas and
280,000 bbls of oil. The first commercially produced Trenton oil-
field was discovered in 1936 from the Deerfield oil pool located in
Monroe County, Dundee Township, in the state of Michigan. This
oilfield is located along the Lucas-Monroe monocline that is an ex-
tension of the Bowling Green fault zone.
The Northville field was the next Trenton oilfield to be discovered in
1954. This reservoir was unique in that it produced oil and gas from
Dundee (Devonian), the Salina-Niagarian (Silurian) and Trenton-
Black River rocks (Ordovician). The Trenton-Black River production
came from dolomitized and fractured limestones located on the
east flank of the Northville fault structure (Landes 1970). It was
this discovery of linear, fault/fractured, structurally bound, and do-
lomitized units that lead to the discovery of the Albion-Scipio field
in 1957. During the 1950s and 1960s a number of new discover-
ies in Ontario occurred including Colchester, Malden and Kings-
ville; these small pools also appeared to be fracture-related. The
Colchester oil field produced from the Cobourg and Sherman Fall
formations, which form a porous bioclastic limestone succession.
Since then, significant discoveries include Dover 7-5-VE (1982),
Hillman (1983), Stoney Point (1983), Wheatley (1985) and Ren-
wick (1987) oil pools - all of these fields are linear features that have
fracture-related reservoir development (refer to pools map insert).
In Michigan, the Stoney Point oil pool was discovered just eight kilo-
metres east of the Albion Scipio pool, located primarily on the basis
of soil-gas geochemistry.
In southwestern Ontario the largest Ordovician oilfield is Gold-
smith (6.2 MMbbls) and the largest gas field is Dover (>14 Bcf re-
covered). The Ordovician play area is approximately 120,000 km2
with an estimated 100 million barrels of oil in place. Only 23 million
barrels have been recovered with approximately 40 million barrels
recoverable, leaving 17 MMbbls to be discovered. The estimates on
gas production are more speculative, but are estimated at 281 Bcf
recoverable with only 41 Bcf recovered (Golder Associates 2005).
Technical Feature
Well Drilling & Servicing
For all your drilling needsSOil SWater SGas
P.O. Box 53, Bothwell, ON N0P 1C0Office: (519) 695-6060 | Cell: (519) 359-9804

Ontario Petroleum Institute | 50th Anniversary Edition58
Total number of wells drilled for Ordovician oil and gas targets in
SW Ontario are estimated at ~1700.
Trap and Seal
Hydrocarbons produced from Ordovician oilfields may have origi-
nated within the Middle Ordovician shales and migrated at depth
along fractures into the Cobourg and Sherman Fall formations
(Sanford 1961). Hydrocarbons were thought to be trapped strati-
graphically on the flanks of a synclinal structure within dolomitized
rocks bounded by limestones of the Cobourg and argillaceous and
bioclastic limestones of the Sherman Fall Formation. Alternatively,
the hydrocarbons may have originated from within the Ordovician
carbonates themselves since they contain sufficient organic carbon
content (up to three weight per cent) to be its own source rock. The
Ordovician dolomites contain thermally mature organic matter and
have been exposed to high enough temperatures to generate their
own hydrocarbons (Colquhoun 1991). Trapping mechanisms in-
clude the overlying Middle Ordovician shales (~200 metres thick),
a thin cap dolostone atop the Cobourg (one to five metres thick), re-
gional and tight limestones along the lateral edges of the reservoirs,
and hydrothermal dolomite textures provide local permeability bar-
riers between shear planes and individual dolomite chimneys.
Sanford (1961) suggested exploration for oil within the Trenton
Group carbonates that exhibited thinner (<120 metres) and cleaner
(i.e. without a high argillaceous content) lateral facies changes ex-
tending to the north and south of the central part of the Michigan
Basin. He further suggested that many stratigraphic and sedimen-
tologic traps exist within areas of Essex and Kent Counties because
the Findlay Arch passes through both counties. He postulated that
higher degrees of deformation have taken place in these areas pro-
ducing tectonically inclined reservoirs.
Seismic data throughout Essex and Kent counties suggests that
negative flower structures created these traps but are not, in most
cases, responsible for hydrocarbon traps within overlying Silu-
rian and Devonian carbonates. Negative flower structures are not
unique to Essex and Kent counties since they have been identified
on seismic in Lambton County but display different timing and func-
tion not directly associated with hydrocarbon trapping features.
Subsequent producing wells along existing trends have been dis-
covered through recognition of the linear trend of the reservoir, the
sag at the top of the Trenton above producing wells observed on
seismic, and the adopted NW-SE trending line from known produc-
ers. Explorationists working in Michigan and southwestern Ontario
referred to the synclinal sag structure as the “Golden Gulch.”
Rock Formation Description
The Middle Ordovician (Caradocian) limestones of southwest-
ern Ontario have been interpreted on the basis of outcrop studies
(refer to stratigraphic section insert). It was proposed that these
sediments were generated during the development of the Appala-
chian foreland basin (Brett and Brookfield 1984). The depositional
sequences represent deepening-upwards cycles of shallow marine
sedimentation. Glacio-eustatic sea-level changes are postulated to
have controlled some aspects of carbonate sedimentation onto the
Ordovician shelf (Brett and Brookfield 1984). The sediments are
described as a series of crinoidal limestone and marlstone belts
extending out from the shallow basin edge, whereby the facies pat-
terns are the result of a storm-dominated, shallow crinoidal ramp
(Kobluk and Brookfield 1982). The shallow crinoidal ramp of amal-
gamated grainstones adjacent to the shoreline grades seaward into
the subtidal slope that is dominated by interbedded wackestones
and mudstones (Kobluk and Brookfield 1982).
In the crinoidal ramp model, the highest energy conditions are
close to shore along the bank and the lower energy conditions oc-
cur offshore as the seafloor gradually deepens (Aigner 1985). The
resulting facies pattern is a series of belts from massive crinoidal
limestones at basin edge to marlstones within the basin centre.
Lime muds with interbedded grainy beds and continuously chang-
ing facies characterize the offshore environments. Potential modern
analogues for these Ordovician environments are the Arabian shelf
of the Persian Gulf and the Sahul shelf of northern Australia (Brett
and Brookfield 1984).
The muddy sediments occur on the distal ramp or basinal deposi-
tional setting. The crinoid content decreases further offshore where
the brachiopod wackestones, mudstones and marlstones predomi-
nate. The cleaner, graded skeletal wackestones are deposited as
storm layers or tempestites (Aigner 1985) on muddy bioturbated
distal ramp sediments. These sediments formed as coarse-grained
fossil debris fell out of suspension followed by fine calcisiltite ma-
terial after each storm. The beds are encased in bioturbated mud-
stones that are commonly deposited on the distal portion of the
ramp. The ramp dynamics and resulting facies patterns can be
observed in several cores within the workshop, with excellent ex-
amples of amalgamated grainstones from the proximal portion of
the ramp to the interbedded wackestones and mudstones of the
distal environments. Similar facies patterns have been described in
Trenton outcrop from Peterborough to Lake Simcoe, Ontario (Kob-
luk and Brookfield 1982).
Relatively minor fluctuations in sea level provided wide lateral
depositional facies shifts over southwestern Ontario. Depo-centres
during Trenton-time are interpreted to the southeast in the Allegh-
eny Basin and to the northwest in the Michigan Basin, therefore
carbonates deposited on the ramp are replaced by muds as water
depths and distance from the area of primary carbonate production
increase.
The main reservoir rock within the Ordovician Trenton-Black River
carbonates is the Sherman Fall Bioclastic (Fragmental) member of
the Trenton Group, an oil-bearing unit over much of Essex and Kent
counties and a significant gas-bearing unit within Dover Township,
Kent County (i.e. Dover Pool). A second oil-bearing reservoir is
the Coboconk Formation within the Black River Group within both
Rochester and Dover Townships of SW Ontario.
Technical Feature

Ontario Oil & Gas 2012 59
The lithologies that make up these reservoirs within both Sherman
Fall and Coboconk formations include bioclastic units contain-
ing abundant type 2 and 3 facies with less muddy rock types, de-
scribed as facies types 4a,b, c and 5 (Aigner 1985 and described in
Colquhoun 1991, 2001). The Trenton and Black River Group carbon-
ates vary in thickness from 120 to 150 metres up to a total thickness
of approximately 300 metres throughout oil producing areas within
SW Ontario. Diachronous sedimentation patterns resulted from an
active arch system that began during the Middle Ordovician, which
affected carbonate facies distribution within the Cobourg and Sher-
man Fall formations of the Trenton Group. Reservoir development is
best developed within uppermost bioclastic rocks of the Sherman
Fall Formation (Trenton Group) that varies in thickness from 10 to
15 metres in southern Essex and Kent counties, and the Coboconk
Formation (Black River Group) is fairly uniform in thickness (~30
metres).
Reservoir Characteristics
The reservoir was created by an early pulse of warm waters pre-
dating maturation, migration and emplacement of hydrocarbons as
suggested by extensive geochemical analyses of reservoir and hy-
drothermal dolomite types and produced fluids (Colquhoun 1991).
Core analyses demonstrate wide ranges in matrix porosity from 3
to 15% with accompanying vugular and fracture porosity, which can
range from 18% to >45% for large open fractures. Permeability es-
timates range between tens and several hundred millidarcies within
specific portions of the reservoir and as high as 10 Darcies when
large open fractures are encountered, which greatly enhance initial
productivity rates. Homogeneous reservoir quality grainstones ex-
hibit average porosities of 8% with an average permeability of 150
millidarcies. Hydrothermal fluids were responsible for maturation
of organic material, the migration and emplacement of the hydro-
carbons (Colquhoun 1991), and the creation of hydrothermal karst
or solution-enhanced porosity zones with porosities that vary be-
tween 30% and >45% on density logs. Well productivity is variable
depending upon the number of open fractures encountered by the
well bore, which increases local permeability.
Typical water saturation within normal hydrodynamic regimes for
Trenton-Black River reservoirs vary between 15 and 40 per cent, ir-
reducible water saturation commonly ranges between 15 and 25 per
cent. These reservoirs also contain prolific water production zones
located much higher within the stratigraphic column, sometimes
accompanied by small to large quantities of oil depending on well
location within the structure. These discrete zones contain rem-
nants of the hydrothermal karst waters responsible for creation of
a wide variety of reservoir destructive mineral phases and features.
Two distinct types of Ordovician reservoirs exist within SW On-
tario, the first has a prominent NW-SE trend and the second has a
prominent W-E trend. The main characteristics of the NW-SE trend
include more pervasive dolomitization throughout both Trenton and
Black River group carbonates, oil reservoir in Sherman Fall Bioclas-
tic (Fragmental), and linear or continuous reservoir connecting sev-
eral chimneys. The main characteristics of the W-E trend include
pervasive dolomitization in the Black River Group carbonates with
local dolomite in Sherman Fall Bioclastic (Trenton), dual reservoir
potential with gas in Sherman Fall Bioclastic and oil in the Coboconk
Formation, and a pod-like reservoir where dolomite chimneys are
commonly isolated.
In constructing a dolomitization model for a thick sequence of car-
bonates, which is overlain by a relatively thick sequence of marine
shales and sediments, the question of subaerial or submarine ex-
posure has major implications for the model of dolomitization and
reservoir development. There is no evidence of subaerial exposure
for Trenton Group carbonates (Wilman and Kolata, 1978; Fara and
Keith, 1984) with the possible exception of sediments in the Albi-
on-Scipio area of southern Michigan. Lack of subaerial exposure
in southwestern Ontario implies that meteoric fluids had little to
do with early burial diagenesis or early dolomitization of the lime-
stones. Major, minor and trace element data and stable isotope
compositions of the carbonates demonstrated that meteoric fluids
were not present during dolomitization of the precursor limestone.
Interpretation of the paragenetic history of the rocks and an inter-
pretation of the structural framework of these reservoirs has pro-
vided a basis for a reservoir development model that best describes
the reservoir character encountered during drilling operations for
hydrocarbons.
A structural development model was proposed by Colquhoun and
Please support the advertisers who
help make this publciation possible.
Our Index to Advertisers can be found on
page 4.
We are the OGWA… Let us help with your ground water issues!
We are Ministry of Environment (MOE) Licenced Water Well Contractors... Water Well Drillers Pump Installers Environmental / Geotechnical Drillers
Ground Water Scientists & Engineers Manufacturers & Suppliers Associates
Ontario Ground Water Association “Dedicated to protecting and promoting Ontario’s
most precious resource - ground water”
Technical Feature

Ontario Petroleum Institute | 50th Anniversary Edition60
Johnston (2004) using detailed 3-D and 2-D seismic data over the
Dover 7-5-VE oil field. A modified version of this structural devel-
opment model is proposed in this article for Ordovician reservoirs
within Essex and Kent counties of southwestern Ontario. The fea-
tures within the structural model are proposed to be the result of
wrench faulting from extensional tectonics. Within southwestern
Ontario extensional faulting occurred as early as Upper Ordovi-
cian and was active up to Middle Devonian time, therefore includes
tectonic adjustments during both Taconic and Appalachian orog-
enies. The resultant sinistral shearing most likely occurred in several
stages and the following series of diagrams summarize the evolu-
tion of structure and fluid migration during major stages, including
hydrothermal dolomitization and reservoir creation, hydrothermal
alteration and hydrocarbon emplacement, and continued tectonic
adjustments and evolution of formation waters coincident with lat-
est shearing events.
Stage 1: Dolomitization
Structural development of Ordovician lows is interpreted to be the
result of wrench-faulting from extensional tectonics. Within south-
western Ontario extensional faulting occurred as early as upper
Ordovician and was active up to middle Devonian time, and there-
fore includes tectonic adjustments during both the Taconic and
Appalachian orogenies. The resultant sinistral shearing must have
occurred in stages. This interpretation is supported in part by ex-
tensive geochemical evaluation of the host rocks, secondary miner-
als, and produced fluids and the burial history modeling of the rocks
within southwestern Ontario (Colquhoun, 1991) that also suggest
a succession of events lead to the creation and alteration of these
reservoirs.
The first stage includes dolomitization of the host limestone and
creation of the reservoir, or at least a major part of it, by warm
basinal fluids. These warm fluids migrated through the Cambrian
sandstones by hydrostatic pressures influenced by basinal circula-
tion of brines, up along faults and fractures into the overlaying car-
bonates and progressively dolomitized the limestone. Dolomitiza-
tion occurred along the faults and fractures but also along preferred
pathways within porous bioclastic-rich carbonates. Dolomitization
likely occurred prior to maximum subsidence of the basin (>300
Ma) and during initial development of the pull-apart structures dur-
ing upper Ordovician time ~440 mya.
Stage 2: Hydrothermal Alteration and Hydrocarbon Emplacement
During successive tectonic adjustments progressive shearing cre-
ated larger and broader structures predicted by analogue modeling
such as Dooley and McClay (1997). This was likely coincident with
the migration of hot basinal brines into the Ordovician sediments
that were responsible for hydrocarbon migration and emplacement,
perhaps including hydrocarbon maturation, followed by cementa-
tion within the faults and fractures by saddle dolomite (HTD), cal-
cite (HTC) and high temperature quartz. Cementation within the
faults and fractures and the creation of localized breccia zones with-
in the section effectively sealed the reservoir at the end of stage 2.
Geochemical evaluation of the rocks supports the concept that hy-
drothermal fluids followed the earlier dolomitization event that cre-
ated the reservoirs (Colquhoun 1991). This allowed the migration
of gas into the Sherman Fall Bioclastic and oil within the Coboconk
Formation resulting in stacked reservoirs in some places and segre-
gated reservoirs in others. However, there have been occurrences of
both gas and oil in the same reservoir.
The timing of this event was estimated using
Lopatin basin modeling techniques to be ~250 Ma
or during late Permian (Colquhoun 1991). Several
tectonic events occurred over a short time frame
including a structural overprinting event during
Pennsylvanian time. This occurred during later
stages of the Appalachian Orogeny throughout
southwestern Ontario and Michigan as a result of
the progressive formation of Pangaea ~300 mya.
The event is observed as the collision between
Gondwana and Laurasia that led to the formation
of the Appalachian belt in North America. Later
tectonic adjustments occurred during late Perm-
ian time coincident with the creation of the super
continent Pangaea around 250 mya. Paleomag-
netic and rock magnetic analysis (Garner, 2006)
estimated a subsequent remagnetization date for
the dolomitization event between Late Paleozoic
and Early Mesozoic, or from 265 to 240 Ma. The
structural events provided the push and hydro-
static conditions necessary for regional fluid mi-
Technical Feature

Ontario Oil & Gas 2012 61
gration to occur but the second critical component is the source
of heat, sediment burial is important but an external or additional
source is required to provide hot fluids at shallow burial depths
within southwestern Ontario.
Approximately 252.6 million years ago the largest extinction event
in geologic history occurred and is recorded in rocks in Siberia. A
total of 1.6 million square kilometers of fiery, gassy lava erupted
across Siberia, an event so massive that the new timing points a
finger at extinction. High precision 40Ar/39Ar data confirms that
the West Siberian Basin basalts, located west of the Siberian Traps,
are actually part of the Siberian Traps and therefore at least double
the confirmed area of the volcanic province as a whole (Reichow et
al, 2002). These results strengthen the link between the Siberian
flood basalts and the end Permian crisis.
It has been suggested that a huge meteorite or comet plunged into
the northwest coast of Australia and was responsible for trigger-
ing the Siberian volcanism. Such a significant heat source would be
necessary to create the conditions that led to hydrothermal miner-
alization within the shallow Ordovician rocks of southwestern On-
tario, which experienced temperatures of alteration similar to those
estimated for Ordovician rocks at much deeper depths in Michigan
and Appalachian Basins. A single mechanism for heat generation
is required to affect such an extensive area and possibly including
large areas across North America that experienced hydrothermal
alteration around the same time. It is proposed that mantle plumes
may have also concentrated at depth along the borders of the North
American plate with the European and African plates that previ-
ously created the Appalachian Mountains. This was the future site
where mantle convection would have concentrated to begin separa-
tion of the plates during the breakup of the super continent known
as Pangaea.
Stage 3: Evolution of Fluid and Structure
During later stages of tectonic adjustment the diagenetic seal be-
came partially breached and rejuvenated and/or newly formed
faults and fractures developed lower within the structures allowing
formation waters and hydrocarbons to migrate into higher strati-
graphic positions around the main reservoir. These evolved forma-
tion waters were no longer saturated with respect to dolomite or
limestone and therefore had the ability to dissolve rock and create
cavernous porosity or extensive lost circulation zones. These po-
rous zones occurred along the edges of the reservoir and contain
formation water but in some cases also contain hydrocarbons. The
timing of this last stage is currently unknown but occurred during
later stages of basin unloading and cooling).
Exploration Methods
Surface reconnaissance methods that are good indicators of physi-
cochemical processes related to hydrocarbon oxidation from near
surface hydrocarbon migration includes organic and inorganic soil
gas geochemistry, magneto-telluric, and airborne multi-spectral
and photographic surveys. Airborne magnetic surveys show a mod-
est correlation of magnetic highs located along either side of these
linear features. These surveys allow a first order investigation into
unknown parts of a basin for chemical and structural leads related
to hydrocarbon traps within the subsurface but can’t approximate
the depth at which to find them.
Traditional exploration methods include 2-D seismic used to identi-
fy the structural low or sag feature atop the Trenton. In recent years,
operators began using more robust seismic methods such as Mega
Bin 3-D seismic surveys or 2-D swaths, which simulates a 3-D sur-
vey but for less cost. The 3-D seismic survey allows the operator to
more easily identify the dolomite chimney characteristics within the
hydrothermal dolomite play.
Current Exploration and Development
Drilling in the Ordovician play by Consumers’ Gas, Pembina Explo-
ration, Ram Petroleum and Paragon Petroleum Corporation (and its
predecessors) during the 80s and 90s boasted up to 67 per cent
success for exploration wells and over 80 per cent for development
wells. Their successor, Talisman Energy, posted development suc-
cess numbers above 90 per cent. Dundee Energy LLP acquired Tal-
isman’s Ontario assets in 2010 and is the current operator of the
majority of Ordovician oil pools in southwestern Ontario.
Future Exploration Areas
In order to assess new areas for future exploration and development
for Ordovician oil and gas requires detailed mapping of the bioclas-
tic facies within the Sherman Fall and Coboconk formations on a
regional scale. This will be reliant upon the availability of subsurface
data, well logs and samples to evaluate the facies relationships on
a sequence stratigraphic framework in order to determine the pres-
ence, orientation and continuity of bioclastic rocks and to predict
reservoir style. It is recommended to explore east of Kent County
along the north shore of Lake Erie and on the south side of the Al-
gonquin Arch where Cambrian sandstones are present.
Since the reservoir is structurally controlled it is necessary to deter-
mine the orientation and intensity of fracturing and faulting within

Ontario Petroleum Institute | 50th Anniversary Edition62
an area in order to predict reservoir orientation. It is also necessary
to determine the timing of faulting and fracturing in relation to res-
ervoir formation to assess if the reservoir has remained intact or if it
has been breached. The most important task is the ability to evalu-
ate the presence or absence of fluids that create a reservoir, the hy-
drothermal fluids necessary for hydrocarbon maturation, migration
and emplacement and suitable conduit(s) in the form of underlying
Cambrian sands. All of these criteria are important to determine if
reservoir creation and hydrocarbon migration was possible within a
new play area.
There is a modest to strong correlation between magnetic highs and
the location of HTD reservoirs in the middle Ordovician carbonates
of SW Ontario. It is recommended to use high resolution magnetic
surveys (HRAM) and lineament analysis as a first order exploration
method to identify areas that are prospective for HTD reservoirs pri-
or to shooting 2-D seismic surveys. Lineament analyses of HRAM
data over existing Trenton-Black River pools in southwestern On-
tario can be used to identify the magnetic and structural character-
istics associated with HTD reservoirs. Lineament analysis should be
used to identify structures that appear similar to the analogue pools.
Successful identification of predominant fault orientations and the
presence of linear trends should be followed up with 2-D seismic
surveys to confirm the presence of a wrench fault-generated sag
structure. It is recommended to drill an exploratory well to confirm
the presence of oil and gas reservoir in the Trenton and/or Black
River Group carbonate rocks. Successful exploratory drilling should
be followed up with a 3-D seismic survey over the entire linear trend
defined on 2-D seismic to delineate the location and size of reservoir
pods located within the pool boundaries prior to extensive develop-
ment drilling and production facility construction.
ReferencesAigner, T. (1985). Storm depositional systems: Dynamic stratigraphy in
modern and ancient shallow marine sequences; Lecture Notes in Earth Sciences, 3, Springer-Verlag, Berlin, 174p.
Bownocker, J.A. (1903). The occurrence and exploitation of petroleum and natural gas in Ohio; Geological Survey of Ohio, 4th series, Bulletin 1, 325p.
Brett, C.E., and Brookfield, M.E. (1984). Morphology, faunas and genesis of Ordovician hardgrounds from southern Ontario, Canada; Palaeogeogra-phy, Palaeoclimatology, Palaeoecology, 46, p. 233-290.
Burgess, R.J. (1960). Eastern Canada has a new exploratory target...oil in Trenton synclines; Oil and Gas Journal, 58, No. 33, p. 124-131.
Caprarotta, D.W., Schrider, L.A., Natoli, M.A., and Sawyer, W.K. (1988). A case study for exploration and development of the Trenton reservoir in northwest Ohio; in B.D. Keith (ed.), The Trenton Group (Upper Ordovician Series) of Eastern North America, American Association of Petroleum Geologists, Studies in Geology #29, p. 191-205.
Colquhoun, I.M. (1991). Paragenetic history of the Ordovician Trenton Group carbonates, southwestern Ontario; Unpublished M.Sc. thesis, Brock Uni-versity, 250p.
Colquhoun, I.M. (2001). Carbonate cores of the Middle Ordovician Trenton and Black River Groups of Southwestern Ontario; OPI 40th Annual Con-ference, London, ON, November 17, 2001, CD.
Colquhoun, I.M. and Johnston, H.P. (2004). A comprehensive evaluation of the Dover 7-5-VE Trenton-Black River field. In: Ontario Petroleum Insti-tute Forth-Third Annual Conference, Ontario-New York Oil and Gas Con-ference, November 8-10, 2004, v. 43, Technical Paper No. 16, 15p.
Dooley, T. and McClay, K. (1997). Analogue modeling of pull-apart basins. American Association of Petroleum Geologists Bulletin, v. 81, p. 1804-1826.
Fara, D.R. and Keith, B.D. (1984). Depositional facies and diagenetic history of Trenton limestone in northern Indiana (Abstract), American Associa-tion of Petroleum Geologists, Bulletin, v. 68, p. 1919.
Garner, N. (2006). Magnetizations of Ordovician petroleum reservoir rocks, southwestern Ontario: Unpublished M.Sc. thesis, University of Windsor, 113p.
Golder Associates Ltd. (2005). Hydrocarbon resource assessment of the Trenton-Black River Hydrothermal Dolomite Play in Ontario; Ontario Oil, Gas, and Salt Resources Library, 35 pages, 27 figures, 8 tables, 11 cross-sections, 7 pool maps, 4 appendices.
Keith, B.D. (1985). Facies, diagenesis and the upper contact of the Trenton limestone of northern Indiana; in R. Cercone and J.M. Budai (eds) Ordovi-cian and Silurian Rocks of the Michigan Basin, Michigan Basin Geological Society Symposium, Special Paper 4, p. 15-32.
Kobluk, D.R., and Brookfield, M.E. (1982). Lower Paleozoic carbonate rocks and paleoenvironments in southern Ontario; IAS, Eleventh International Congress on Sedimentology, Excursion Guidebook 12A, 62 p.
Landes, K.K. (1970). Petroleum geology of the United States; Wiley-Inter-science, New York, 571 p.
Reichow, M.K. et al. (2002). 40Ar/39Ar Dates from the West Siberian Ba-sin: Siberian Flood Basalt Province Doubled. Science 296, p. 1846.
Sanford, B.V. (1961). Subsurface stratigraphy of Ordovician rocks in south-western Ontario; Geological Survey of Canada, Paper 60-26, 54 p.
Wilman, H.B. and Kolata, D.R. (1978). The Platteville and Galena groups in northern Illinois. Illinois state Geological Survey Circular 502, 75p. n

Ontario Oil & Gas 2012 63
Technical Feature
Introduction
Lower Silurian Whirlpool, Grimsby and Thorold sandstone reser-
voirs form one of the most significant gas plays in the Appalachian
Basin. The play spans a large area of 700 kilometres in length by
200 kilometres in width extending from northeastern Kentucky,
into Ohio, Lake Erie, southwestern Ontario, northwestern Pennsyl-
vania, to western New York. These sandstones have been and con-
tinue to be economically important gas reservoirs in southwestern
Ontario. They have accounted for about 46 per cent of total Ontar-
io gas production in the past decade, producing over 2.3 billion cu-
bic meters (82.5 Bcf) of gas. The bulk of current production comes
from offshore Lake Erie fields. Smaller contributions come from
fields in Norfolk and Haldimand counties. The trapping mechanism
is primarily stratigraphic. Gas productivity appears to be related to
porosity and permeability variations caused by clay content, dia-
genetic histories, and, on a basin-wide scale, burial depths. Burial
depth of productive reservoirs in Ontario ranges from 60 meters in
Niagara County to 625 meters in Central Lake Erie.
Formation Description
Siliciclastic reservoirs of Early Silurian age comprise the Whirlpool
and Grimsby formations of the Cataract Group (Medina Group in
New York State) and the Thorold Formation of the Clinton Group.
The Whirpool Formation disconformably overlies red marine silt-
stones and shales of the Upper Ordovician Queenston Formation
and is conformably overlain by argillaceous, fossiliferous dolomites
of the Manitoulin Formation in Central Lake Erie and marine shales
of the Cabot Head Formation in East Lake Erie. The Whirlpool com-
prises two main units: a fluvial unit and an estuarine to transitional
marine unit (Zagorski, 1991; Cheel and Middleton, 1993; Cheel et
al., 1994; Johnson, 1998). The fluvial unit is white to grey in co-
lour and is dominantly composed of unfossiliferous, very fine- to
fine-grained, cross-stratified quartzose sandstone. The estuarine
to transitional marine unit is also composed of very fine- to fine-
grained quartzose sandstones but is typically overlain or inter-
stratified with shale and exhibits varying degrees of bioturbation
(Johnson, 1998). Whirlpool thickness is irregular ranging from nine
to zero meters, generally thinning and pinching out to the north
and northwest where it becomes transitional with dolomites of the
Manitoulin Formation.
The Grimsby Formation, also referred to as the Clinton sandstone
as a result of miscorrelations that took place during the early de-
velopment of the play, overlies marine shales of the Cabot Head
Formation. In Ontario, the contact is delineated by a ravinement
surface characterized by channel cuts and associated lag deposits
(Benincasa, 1996).
The Grimsby can be subdivided into two units. The lower unit is
composed of fine- to medium-grained, large-scale cross-stratified,
quartzose sandstones with common mud couplets. Sandstones are
commonly white in colour. This lower unit is interpreted to have
been deposited in subtidal channel complexes (Benincasa et al.,
1997). The upper unit is composed of very fine- to fine-grained,
small scale cross-stratified, quartzose sandstone, interstratified
with bioturbated shale partings/beds. Sandstones in this unit are
commonly red in colour. Deposits of the upper unit are interpret-
ed to represent discrete tidal channels and associated mud flats
(Benincasa et al., 1997). It is important to note that colour in the
Grimsby is controlled by variations in the oxidation state of iron-
rich sediment and relative abundance of organic matter within the
sediments (Duke et al., 1991). As such, changes in colour are dia-
genetic in origin and do not correspond to unit boundaries.
Grimsby thickness ranges from zero to twenty meters. Thickest
sections are located near the international border in East and Cen-
tral Lake Erie. The Grimsby thickens south of the border and gener-
ally thins to the west and north where it passes laterally into shales
of the Cabot Head Formation.
The Thorold Formation is also known as the “Stray Clinton” and
overlies the Grimsby Formation. It is generally composed of finer
grain sediment and is also typically more highly bioturbated than
the Grimsby Formation. Lithologically, it is composed of very fine
quartzose sandstone interbedded with shale and contains abun-
dant accessory minerals (Fisher, 1954, Benincasa, 1996). The
Thorold has been interpreted to represent the basal transgressive
deposits of the Reynales-Irondequoit succession (Clinton Group),
and its sediments to have been derived from reworked Grimsby
deposits (Sanford, 1969). It reaches a maximum thickness of six
metres and is mainly distributed in Haldimand-Norfolk counties
and in parts of East and Central Lake Erie.
Lower Silurian SandstoneReservoirs ofSOUTHWESTERN ONTARIO
BY M. MOLGaT, TaLISMan EnERGY InC.

Ontario Petroleum Institute | 50th Anniversary Edition64
Technical Feature
Reservoir Characteristics
Lower Silurian reservoir characteristics are highly variable. Pay
thickness is generally thin and commonly vertically discontinuous,
ranging from 0.5 to a total of 15 net metres. Porosity ranges from
two to 18 per cent. Producing wells generally have values greater
than eight per cent and are generally non-economic below this.
Similarly, permeability varies greatly, ranging from 0.1 to 100 mil-
lidarcies. Better reservoirs typically have values over five millidar-
cies. Water saturations also vary significantly from pool to pool,
ranging from 15 per cent to over 85 per cent. Gas-water contacts,
where present, are observed at different structural levels, which re-
flects the laterally discontinuous nature of these reservoirs. The
producing wells from sandstones in Lake Erie have estimated pro-
duction of up to 85 million m3 of natural gas (3 Bcf).
There appears to be little correlation between depositional facies,
net sand and production. Commercial gas production is largely
controlled by porosity and permeability variations within the reser-
voir, which, in turn are controlled by three main factors: grain size,
clay content, and degree and type of cementing (Overbay and Hen-
niger, 1971). The principal reason for low porosity and permeability
values in many wells, is the almost complete occlusion of primary
intergranular porosity by authigenic silica and carbonate cements.
Silica cementation is pervasive in the Cataract Group, whereas car-
bonate cementation is secondary in importance, although locally
significant.
Good reservoirs that have a cumulative production greater than
8.5 million m3 (>0.3 Bcf) seem to have well developed secondary
intergranular porosity related to partial dissolution of primary cal-
cite cement, and to a lesser extent, corrosion of silica cement, and
selective dissolution of feldspars. In Ohio and Pennsylvania, high
porosity trends tend to be linear and align with major surface linea-
ments that are interpreted to be expressions of reactivated deep-
seated fractures and fault zones (Zagorski, 1991). In this example,
the presence of natural fractures allowed for a large volume of flu-
ids to circulate locally through the strata, partially dissolving feld-
spar grains and calcite cement, creating enhanced secondary po-
rosity. Relationships between structure and production have also
been observed along the north flank of the East Ohio fault system
where best Cataract production is located on “upthrown” blocks
that parallel the fault system (McCormac et al, 1996), and in Whirl-
pool reservoirs of East Lake Erie, which also appear to be linear.
In Ontario, Lower Silurian reservoirs are sweet gas reservoirs and
are generally devoid of oil. The natural gas is primarily composed
of methane (82.5% methane, 7% ethane, 2% propane) with an
average specific gravity of 0.66. Its average heating value is 40.4
megajoule/m3 (1084.3 BTU/ft3). Whirlpool, Grimsby, and Thor-
old gas production is commonly commingled.
Ontario Historical Production
Gas in the Whirlpool, Grimsby and Thorold sandstones was first
discovered in 1889 in Welland Township, in relatively shallow and
permeable reservoirs that could be produced without stimulation.
Its discovery and proximity to market provided the momentum that
led to further drilling activities and the discovery of all of the large
onshore pools in Niagara, Haldimand, Norfolk, and Brant Counties
by 1910. Despite having over a century of drilling history, the de-
velopment and extension of these pools continues to this day. Cu-
mulative gas production from onshore pools to the end of 1994 was
6.5E^9m^3(231 Bcf)
The Silurian sandstone play was pursued into Lake Erie in the early
1960s, at which time rotary drilling, hydraulic fracturing, and elec-
tric well logging had become readily available. Between 1959 and
1970, all the large Lake Erie sweet gas pools were discovered. Off-
shore seismic programs commenced in 1968. Presently, over 8,000
kilometres (5000+ miles) of two-dimensional seismic lines have
been acquired. Drilling activities, number of operating companies,
number of drilling rigs, and production, peaked in the mid 1980s.
Today, only one operator is actively pursuing the Silurian sandstone
play in Lake Erie. Cumulative gas production from the offshore
pools to the end of 1994 was 5.4E^9m^3( 191Bcf). It should be not-
ed that regulators in the province of Ontario require offshore wells
to be plugged back from the zones with oil shows or be abandoned
if oil cannot be plugged off.
Exploration Methods
Most of the large onshore and offshore gas pools were discovered
simply by continued drilling activities. New discoveries led to fol-
low-up development in surrounding and adjacent areas until indi-
vidual pools and fields were delineated. Seismic information did not
assist with exploration and development until the 1960s. However,
seismic data is of little use to delineate channels or abundance of
sandstone in most parts of Southwestern Ontario because of poor
data quality. Locally, seismic data has been used to delineate struc-
tural highs interpreted to be potential traps. This method of explo-
ration had mediocre success.
Almost all of Ontario wells that target the sandstones are vertical
wells. There were only three attempts at drilling horizontal wells in
the sandstones in Lake Erie, with no improvements in productivity.
Directional wells are also drilled in Ohio to avoid residential areas
and environmentally sensitive areas like wetlands (Mc Cormac et
al., 1996).
Current Exploration and Development
There was a major rejuvenation of interest and drilling activities
for onshore Lower Silurian gas at the turn of the new millennium
as high natural gas prices made this low-volume, tight sandstone
play more economically feasible. In 2001, a total of 48 wells tested

Ontario Oil & Gas 2012 65
Technical Feature
Tartan Systems is dedicated to providing Ontario and
Eastern Canada Gas and Oil Producers with the highest
quality products and services.
11972 New Scotland LineR.R. #1, Morpeth, ON N0P 1X0
P: 519-674-5061 TF: 1-800-220-0494
C: 519-436-6487 F: 519-674-1341
Follow us on twitter www.twitter.com/npegg
Lower Silurian strata, 44 of which were reported as gas or potential
gas producers. In 2002, activities dropped slightly and a total of 41
wells were drilled for gas in Silurian sandstones, 39 of which were
reported as gas or potential gas producers. The bulk of the 2002-
2003 onshore activities took place in Bayham, Houghton, Walsing-
ham areas, but there were also 13 wells drilled and completed as
private gas wells in parts of the Lincoln, Welland, and Haldimand
gas fields.
Drilling activities for lower Silurian gas in Lake Erie has been in a
lull since 2000 as the preferred target over the past few years has
been Guelph reservoirs. Interest in offshore Lower Silurian gas has
increased in 2003, and 10 wells were licensed with Grimsby and/
or Whirlpool reservoirs being primary targets.
Future Potential Development
Probable gas reserves identified for the Whirlpool, Grimsby, and
Thorold formations in Ontario were estimated at 760 Bcf at the
end of 1981 (Bailey and Cochrane, 1986). The offshore portion
accounted for about 96 per cent of the total, while onshore ar-
eas accounted for just over three per cent, mostly in Norfolk and
Haldimand townships. Onshore gas exploration is limited due to
extensive drilling of pools during in past century, high recovery fac-
tors of >95 per cent, and close spacing between well (10 to 40
hectares or 25 to 100 acres) (Cochrane et al, 1986). Conversely,
offshore spacing is more typically 255 hectares (640 acres), re-
covery factors are estimated at 15 per cent and many tracts have
not been drilled or properly evaluated. Therefore, it is clear the best
area for future exploration and development activities lies offshore
in Central and East Lake Erie. Gas reserves in U.S. Lake Erie remain
undeveloped due to a moratorium on oil and gas related activities.
References
Benincasa, A.J., 1996. Sedimentology and Stratigraphy of the Lower Silu-iran Grimsby Formation, in Subsurface, Lake Erie and Southwestern On-tario. Unpublished M.S. thesis, Brock University, 218 p.
Benincasa, A.J., and Cheel, R.J., 1997. Sedimentology and Stratigraphy of the Lower Silurian Grimsby Formation. In: Subsurface, Lake Erie and Southwestern Ontario. Ontario Petroleum Institute. V. 36.
Johnson, M.F., 1998. The Sedimentology of the Lower Silurian Whirlpool Sandstone, in Subsurface Lake Erie, Ontario. Unpublished M.S. thesis, Brock University, 186 p.
McCormac, M.P., Mychkovsky, G.O., Opritza, S.T., Riley, R.A., Wolfe, M.E.,
Larsen, G.E., and Baranoski, M.T., Ohio Department of Natural Resourc-
es, 1996, Play Scm: Lower Silurian Cataract/Medina Group (“Clinton”)
Sandstone Play in the Atlas of Major Appalachian Gas Plays, John Roen
and Brian Walker eds, West Virginia Geological and Economic Survey.
p. 156 - 163
Overbey, W.K. Jr., and Henninger, B.R., 1971. History, development, and
geology of oil fields in Hocking and Perry counties, Ohio: American As-
sociation of Petroleum Geologists Bulletin, vol. 55, no. 2, p. 183-203.
Sanford, B.V., 1969. Silurian of southwestern Ontario. Ontario Petroleum
Institute Journal, vol. 8, no. 5.
Zagorski, W.A., 1991. Model of local and regional traps in the Lower Silurian
Medina Sandstone Group Cooperston gas field, Crawford and Venango
counties, Pennsylvania: Unpublished M.S. thesis, University of Pittsburg,
131 p. n
WELL PRODUCTIVITY WHIRLPOOL & GRIMSBY Present average production (~ 500 offshore wells) 47 mcf/d
First year average production (1996-2000) 370 mcf/d
First year decline 40%
Second year decline 25%
Long term decline 8%
Table 1. Average flow rate and declines for offshore sweet gas well. Modified from Gordon and Brame, 2000

Ontario Petroleum Institute | 50th Anniversary Edition66
Technical Feature
Introduction
Rocks of Middle and Upper Silurian age in Southwestern Ontario
are predominantly carbonates and evaporites with minor interbeds
of shale. The hydrocarbon reservoirs in this unit are found in reef
buildups and in structural traps associated with porous bands in
carbonate units. The depth of the reservoir varies from 275 to 780
metres. Natural gas is the predominant hydrocarbon. In the 148
fields, 70 are gas producers, 46 produce both oil and gas and 32 are
oil pools. Most of the hydrocarbon production from Silurian car-
bonates originates in Kent and Lambton Counties and in Lake Erie.
Smaller contributions come from Elgin, Middlesex, Essex and Huron
Counties.
Formation Description
The productive formations of the Silurian carbonates are the Salina
A-2 Unit, Salina A-1 Unit and the Guelph. The Guelph, of Upper
Middle Silurian age, is a light brown dolostone of variable thickness;
the equivalent formation is called the Niagaran in Michigan. Three
kinds of reefs have developed within the Guelph as shown on Ex-
hibit 1. Reef mounds occur in a belt around the edges of the Michi-
gan Basin. In Southwestern Ontario, this belt runs through Bruce,
Huron, and Lambton Counties and the top part of Kent County. Reef
buildups in excess of 50 metres are called pinnacle reefs whereas
reefs with buildups less than 50 metres are called incipient or sub-
dued reefs. Bailey (2002) has called the thicker incipient reefs “half
reefs” and suggests a different history of growth for these reefs.
Platform or patch reefs flank the Michigan Basin and run through
Essex, Kent, Elgin Counties and beneath the western and central
parts of Lake Erie.
The Salina A-1 Unit consists of a lower member of anhydrite which
is overlain by lime muds which are dark grey to black at the base
becoming lighter in colour at the top of the unit. In many localities,
the top 5 to 10 metres of the A-1 was deposited in a shallow tidal
flat and has beds of light to medium brown dolomite interspersed
with anhydrite. These beds have secondary porosity which is often
locally enhanced by the presence of a fault.
The SalinaA-2 Unit consists of a basal anhydrite member overlain
by a bed of clean crystalline halite with a thickness ranging from
0 to 30 metres. Above the halite is a medium grey shaly carbon-
ate with a thin universally present shale bed, often called the A-2
Shale Marker. Above the A-2 Shale, the unit grades from a lime mud
at the base upwards to light to medium brown sucrosic dolomite
interspersed with anhydrite beds at the top. The thickness of the
dolomite unit varies from 3 to 10 metres. The A-2 Unit is overlain by
halite of the Salina B Salt; as a result, the porosity in the dolomite at
the top of the A-2 Unit is usually plugged with halite and anhydrite;
however, when the overlying salt has been entirely removed by dis-
solution, the porosity at the top of the A-2 Carbonate can become
effective as a trap for natural gas.
Trap & Seal
Stratigraphic traps in the Silurian carbonates are of two types: reefs
and porous lenses controlled by facies variations.
The primary porosity in the reef mounds is enhanced by dolomitiza-
tion and episodal karsting during and following reef development;
as a result, permeability in the reefs can be exceptional. High de-
liverability in pinnacle reefs makes them ideal reservoirs for storage
of natural gas. Unfortunately, this porosity is often infilled by halite,
anhydrite and carbonate cements during diagenesis and burial. The
incipient reefs and platform reefs are usually sealed by the overlying
anhydrites and impermeable limestones of the A-1 Unit. Pinnacle
reefs are sealed by encapsulating anhydrite and impermeable car-
bonates of the A-2 Unit and in the case of tall mud mounds in Huron
and Bruce Counties by the anhydrites of the Salina B Unit.
Two fields have facies-controlled traps at the top of the Salina A-1
Carbonate. Dolostone lenses in a tidal flat facies are present in the
top 10 metres of the A-1, and contain natural gas. The seal is the
anhydrite bed of the A-2 Unit.
Structural traps can be found on up-thrown side of faults where the
porous zones in the A-1 Carbonate are lifted above regional levels.
Where dissolution of the B-salt occurs near the fault zone, gas may
also be trapped in the upper section of the A-2 Carbonate. If the
fault was active during the deposition of the A-1 Carbonate, poros-
ity is enhanced at a significant distance from the fault trace. The
Becher West and Zone pools are examples of this phenomenon.
A group of fields in Aldborough and Dunwich Townships in Elgin
County produce natural gas and minor crude oil from the A-1 Unit
and to a lesser extent from the A-2 Unit. The trap is controlled in
part by the facies variations at the top of the A-1 Unit and also in
part by structure. The structure is anticlinal and is related to draping
over the Guelph reef, gentle regional folding, or both.
Reservoirs and Production from the Silurian Carbonate Rocks ofSOUTHWESTERN ONTARIO
BY R.O. COCHRanE, CaIRnLInS RESOURCES LIMITEd

Ontario Oil & Gas 2012 67
The third type of structural trap
is a result of dissolution of salt.
The B-Salt is commonly removed
by solution usually along or as-
sociated with a fracture. The
leaching of the salt within the top
of the A-2 carbonate opens up
porosity which traps natural gas.
Three accumulations of this type
have been discovered in Kent
County. The most significant of
these is the Morpeth Field which
covers an area of 1,549 acres and
has produced 163.9 million m3
(5.8 bcf) of gas.
Historical Production
The first gas production from the Silurian Carbonates was recorded
in 1889 with the discovery of the Kingsville Leamington Field in Es-
sex County. The discovery of Tilbury Pool, the largest gas pool in
Ontario, occurred in 1906. Deepening of the Oil Springs shallow
Devonian reservoir led to the discovery of the Oil Springs incipient
reef in 1913, and the first pinnacle reef was the Dawn 59-85 Pool
which was found in 1931.
Table 1 is a summary of the exploration history for Silurian Carbon-
ates to the end of 2002 with cumulative production as of the end of
1999. A total of 217 pools have been discovered with a cumulative
production of 20 billion m3 (709 bcf) of gas and 2.13 million m3
(13.4 million) barrels of oil. The largest gas production originates
in the platform reefs with the most significant contribution com-
ing from one field, the Tilbury Pool, with 7.73 billion m3 (274 bcf).
The Glasgow-Talbot Fields in Lake Erie which are commingled as the
Morpeth Production Unit have provided significant historical gas
production (cumulative 1.78 million m3, 63.2 bcf) and are still on
production. Pinnacle reefs rank second in cumulative production;
the 52 reefs collectively have produced 5.61 million m3 (199 bcf)
and 1.26 million m3 (7.92 million bbl) of oil.
Depleted pinnacle reefs are usually converted to natural gas stor-
age if their reservoirs have high permeability and deliverability
and if they are located near the compressor stations in Dawn and
Moore Townships of Lambton County. To date, 28 depleted pin-
nacle reefs and one incipient have been converted into the storage
of natural gas.
Selected Field Examples
A good selection of examples of Silurian Carbonate fields can be
found in published articles by Koepke & Sanford (1965) and by Bai-
ley and Cochrane (1990).
The Tilbury Pool, a large platform reef, extends over 19,600 acres
in Raleigh Township of Kent County and another 18,200 acres off-
shore in Lake Erie. To the end of 1999, the cumulative production is
7,730 million m3 (274 bcf). The Fletcher Field discovered in 1905
on the north end of the Tilbury Pool produced 192,000 m3 (1.21 mil-
lion barrels) of oil before abandonment.
The Kimball Colinville Pool discovered in 1947 in Moore Township of
Lambton County is the largest of the pinnacle reefs with a cumula-
tive production to the end of 1999 of 970 million m3 (34.4 bcf) of
gas with minor quantities of oil. The Corunna-Seckerton reef com-
plex discovered in 1950 in Moore Township produced less gas, [384
million m3 (13.7 bcf)] than Kimball Colinville but had significant oil
(501,000 m3, 3.14 million barrels)
The most prolific structural pool was the Zone Field in Kent Coun-
ty. It was discovered in 1943, has produced 300 million m3 (10.7
bcf) of gas and lies on the upthrown side of the Electric Fault. On
the upthrown side of the same fault is the Chatham Field in Kent
County. Discovered in 1936, this pool has produced 203 million m3
of gas. The most significant oil production from a structural trap
in the A-1 Unit was discovered in 1946 at the Becher West Pool in
Sombra Township of Lambton County. The field was successfully
waterflooded and has a cumulative production of 417,000 m3 (2.62
million barrels) of oil and 186 million m3 (6.59 bcf) of natural gas.
Production and reserves from incipient reefs are significantly less
than those from pinnacle reefs because of their smaller area and
thinner pay sections. The largest of this type, the Otter Creek reef
complex in Sombra Township, was discovered in 1968 and has pro-
duced 55 million m3 (1.97 bcf) of gas.
Exploration Methods
The rate of discovery of pinnacle reefs reflects the progress of tech-
nology. A gravity anomaly is present over the large pinnacle reefs
because the halite beds in the Salina Formation are locally thinner
over the reef crests. As a result, gravity surveys were the most suc-
cessful method for the detection of reefs and other structural fea-
tures associated with the dissolution of salt. As shown on Exhibit
2, the peak in the discovery rate between the years 1948 and 1956
X PINNACLE REEFS EXHIBIT 2+ INCIPIENT REEFS RATE OF DISCOVERY OF SILURIAN REEFS O ALL REEFS IN ONTARIO
BY: R.O. COCHRANE DATE: 2002-08-14CAIRNLINS RESOURCES LIMITED
0
5
10
15
20
25
30
35
1920 1930 1940 1950 1960 1970 1980 1990 2000 2010 N
UM
BE
R O
F R
EE
FS
YEAR OF DISCOVERY
RATE OF DISCOVERY OF SILURIAN REEFS IN ONTARIO
PINNACLE REEFS
ALL REEFS
INCIPIENT REEFS
SAMPLING FREQUENCY
4 YEARS
1950 - 1960 GRAVITY METHOD
1968 - 1980 2-D SEISMIC
METHOD

Ontario Petroleum Institute | 50th Anniversary Edition68
Technical Feature
is the result of an active drilling program and gravity exploration.
Exploration by seismic methods commenced in 1968 and the peak
in the discovery rate for reefs between the years 1968 and 1980 is
due to the success of this method. Since 1999, three dimensional
seismic has been useful in delineating known reef reservoirs for de-
velopment of natural gas storage. Use of three-dimensional seismic
for exploration has been concentrated in the Townships of Dawn,
Enniskillen, Moore and Sombra Townships of Lambton County and
the southern part of Huron County. The technique has yielded an
increase in the number of incipient reefs but disappointingly very
few new pinnacle reefs.
Horizontal wells have been used for the exploitation of existing reef
reservoirs at the Sombra Pool and Corunna-Seckerton Pool. Suc-
cessful development of the Black Creek Pool in Sombra Township
by horizontal wells was documented by Druet et al 2002. The
combined use of three-dimensional seismic and horizontal drilling
to locate untapped gas reserves at the Mandaumin North reef in
Plympton Township of Lambton County in 2001 was unsuccessful.
Current Exploration & Development
At the present time, exploration for Silurian reservoirs is at low ebb.
In 2002, a total of 8 exploratory wells and 13 development wells
were drilled into Silurian Carbonates. Two of the exploratory tests
were completed for natural gas production. The Sombra 7-A-XI Pool
in Sombra Township of Lambton County is the most recent pinnacle
reef and was found in the year 2000.
Talisman Energy Inc has an ongoing program to exploit the platform
reefs in Lake Erie. In 2002, nine development wells were drilled in
the Glasgow-Talbot Reef and the Silver Creek Reef; five of these
wells were completed for gas production.
Two secondary oil recovery projects in pinnacle reefs have been ini-
tiated since 2001. The Plympton 5-19-VI Pool and the Wanstead
Pool are currently being waterflooded.
Markets & Commodity Prices
Crude oil is trucked from wellsites all over southern Ontario to the
storage facility in Sarnia operated by Marcus Terminals Inc. From
this facility, oil is sold in batches to the immediately adjacent Impe-
rial Oil Limited refinery.
A network of natural gas pipelines is accessible throughout South-
western Ontario. The operator of a well is responsible for the con-
struction of a pipeline to the gas transmission line, the leasing of a
meter site and the purchase of the metering equipment. Gas can be
sold directly to the pipeline operator or can be transported through
the pipeline to a third party upon payment of negotiated transmis-
sion charge.
Future Potential Development
The search for Silurian Carbonate reservoirs is in a mature stage. No
longer can operators blanket an area with seismic and expect to make
reef discoveries which will pay out the exploration costs and still pro-
vide an acceptable return on investment. In the past five years, ex-
pensive 3-D seismic technology has found very few pinnacle reefs in
the heavily-explored four townships (Dawn, Enniskillen, Moore and
Sombra) in Lambton County. The reprocessing of existing seismic
control, the acquisition of prospect-specific 2-D seismic, and geo-
logical studies of existing wells are cost-effective methods to search
for reefs in this area.
Exploration effort to locate reefs outside the four townships is war-
ranted. Although many of the known reefs in the other townships of
Lambton County, and in Bruce and Huron Counties are unproductive
because of absence of permeability, halite plugging, and subnormal
pressures, commercial quantities of hydrocarbons have been dis-
covered in a number of reefs such as Grand Bend, Plympton 5-19-
VI, Sarnia 2-11-VIII, Warwick and Chatham D Pools. A large reef,
Stephen 4-11-XXII, was discovered in 1999 in Stephen Township of
Huron County. A combination of seismic exploration with surface
geochemical surveys is a way to reduce risk in this play. One of the
problems with the search for reefs in Bruce and Huron Counties was
the absence of a market for natural gas; however, the opportunity
to convert natural gas to electricity is now available, and the rising
price of electricity will soon make this process a viable option.
One of side-benefits of seismic exploration is the location of fault
structures. Structural traps in the A-1 and A-2 Units are associated
with faulting. As a result, a re-assessment of existing seismic con-
trol could provide prospects for exploration in the Salina A-1 and A-2
Units. In addition, horizontal drilling techniques should be effective
in draining this type of reservoir more efficiently.
ReferencesBailey, S.M.B., 1986: “A New Look at the Development, Configuration and
Trapping Mechanisms of the Silurian Guelph Reefs of Southwestern On-tario.” Ontario Petroleum Institute Twenty-Fifth Annual OPI Conference Volume 25 No.16
Bailey Geological and Cochrane, R.O., 1990: Geology of Selected Oil and Gas Pools in the Silurian Carbonates of Southern Ontario; Ontario Geo-logical Survey, Open File Report 5722, 50p.
Bailey, S.M.B., 2002: The Geological Implications of Some 3-D “Fishnet” Seismic Images of Guelph Pinnacle Reefs in Ontario: A Different Per-spective on their Growth, Destruction and Complexity.” Ontario Petro-leum Institute Forty-First Annual OPI Conference Volume 41 No.15
Carter, T.R., 2003: “Oil and Gas Exploration and Development Activity in Ontario in 2002” OPI Newsletter, April 2003.
Druet, Paul, 2002: Horizontal Drilling in the Black Creek Storage Pool: A Success Story.
Ontario Petroleum Institute Forty-First Annual OPI Conference Volume 41 No.18
Koepke W.E. and Sanford B.V.,1965: The Silurian Oil and Gas Fields of South-western Ontario Geological Survey of Canada Paper 65-30
Oil Gas and Salt Resources Library, 2001: “Oil and Gas Pools and Pipelines of Southern Ontario, Version June1, 2001
Oil Gas and Salt Resources Library, 2002:”1989 to 2000 Summary, Oil and Natural Gas Exploration, Underground Storage and Solution Mining in Ontario” Oil Gas and Salt Resources Library, London, Ontario. n

Ontario Oil & Gas 2012 69
Technical Feature
Introduction
The Middle Devonian Lucas and Dundee formations of Ontario have
produced approximately 45 million barrels of oil (MMBO), which
equates to approximately 50 per cent of Ontario’s oil production to
date. The first oil discovered in North America was from the shallow
Middle Devonian carbonates in 1858 at Oil Springs, Ontario. One
hundred and fifty-five years later some of these early discoveries
are still producing today. Three of the largest oil fields in Ontario are
Middle Devonian in age and include Petrolia (18.5 MMBO), Rodney
(10.7 MMBO) and Oil Springs (10.3 MMBO). Bothwell-Thamesville
(3.3 MMBO) and Glencoe (1.1 MMBO) were also very significant
discoveries. The Middle Devonian reservoirs therefore, historically
have been a very economically important hydrocarbon play.
Early exploration methods included drilling surface seeps, the use of
dowsers, psychics and rudimentary geological mapping. A number
of modern techniques which have been successfully employed re-
cently include computer mapping, the use of gravity and magnetics,
2D seismic and geophysical logs. The use of modern engineering
applications such as cased-through completions, well stimulations,
horizontal drilling and secondary recovery have significantly im-
proved daily production volumes and ultimate recoverable reserves.
Middle Devonian oil production is confined to two distinct reser-
voir units in the Lucas formation and three types of reservoirs in the
Dundee Formation. Most known Middle Devonian reservoirs are
structurally controlled by the localized preservation of thick sec-
tions of underlying Silurian Salina salts.
From an economic prospective the Middle Devonian reservoirs con-
tinue to be a very attractive geological target, due to their shallow
depth (400 – 500 feet or 120-150 meters), high-gravity oil (38 API),
relatively high yields (eight – 10,000 barrels/acre) and long produc-
tive life-span. Prospective regions in Ontario have been only lightly
explored and the potential exists for new significant discoveries.
History of the Play and Production
The first oil in North America was discovered at Oil Springs in 1858
from Middle Devonian carbonates. A number of other shallow
Middle Devonian pools were found in the late 1800s and include
Petrolia (1862), Bothwell-Thamesville (1862) and Wallacetown
(1898). In the 1900s there were three significant discoveries Glen-
coe (1917), Watford-Kerwood (1938) and the Rodney Pool in 1949
(Table 1). Of these seven significant early discoveries four are still
on production today.
The past 20 years have seen the drilling of approximately 50 wells
directed to Middle Devonian targets and have resulted in the dis-
covery of 10 new infill producers in the Rodney pool, one new oil
pool and one potential natural gas pool. In 1999, Greentree Gas &
Oil Ltd. discovered the Aldborough 7-D-VII pool, which is a sepa-
rate structure on trend of the Rodney pool (Figure 1). The 7-D-VII
pool currently has 10 producing wells of which three are horizontal
completions. In 2000, Rubicon et al #7 Harwich 18-IV was reported
to be a new pool Middle Devonian natural gas discovery.
Middle Devonian reservoirs have produced 45 MMBO out of a total
of 90 MMBO produced in Ontario to the end of 2010. Devonian oil
production in 2010 amounted to 111,347 barrels or approximately 21
per cent of the total production for the year as compared to 41.3 per
cent of Ontario’s production in 1983. The decline in volumetric im-
portance of Middle Devonian reservoirs is primarily due to industry
focus on the Ordovician Trenton-Black River reservoirs and a low-
level of activity directed to Devonian targets.
BY dUnCan HaMILTOn, HaMILTOn GEOLOGICaL SERvICES
Middle devonian Reservoirs ofSOUTHWESTERN ONTARIO
POOL NAME DISCOVERY YEAR CUMMULATIVE PRODUCTION (barrels) ACTIVE
Oil Springs 1858 10,323,000 Yes
Petrolia 1862 18,598,000 Yes
Bothwell-Thamesville 1862 3,329,000 Yes
Wallacetown 1898 253,000 No
Glencoe 1917 1,139,000 No
Watford-Kerwood 1938 132,000 No
Rodney 1949 10,713,000 Yes
Table 1. Major Middle Devonian Oil Pools (Cumulative production current to 2010 incl., rounded to nearest 1000)

Ontario Petroleum Institute | 50th Anniversary Edition70
General Geology
Oil production in the Middle Devonian sediments is confined to the
Lucas Formation and overlying Dundee Formation. Within the pre-
dominantly carbonate sequence a number of reservoir types have
been identified. The Lucas Formation hosts two distinct reservoir
types; a microcrystalline dolomite unit and calcareous sandstone.
The dolomite unit is the primary reservoir in the Oil Springs pool
and has porosity in the range of 12 to 30 per cent and permeability
of five to 430 mD. The sandstone unit is the producing reservoir in
the Glencoe pool where porosity ranges from 10 to 21per cent and
permeability generally varies from 50 to 200 mD.
The Dundee Formation hosts one very significant unit known as
the “Columbus zone” but production has also been derived from
fractured limestones and fractured limestones with a microporous
matrix. The Columbus zone is a siliclastic-rich dolomitized lime-
stone with porosity commonly in the 12 to 30 per cent range and
permeability varying between 50 and 2500 mD . The Columbus
zone is the producing reservoir in the Rodney pool.
Reservoir Example
The Rodney pool is one of the best examples to illustrate a Middle
Devonian pool in Ontario due to the relatively recent timing of de-
velopment and availability of accurate geological and engineering
data. The Rodney pool and a separate Middle Devonian structure
located to the south of the Rodney pool, known as the Aldborough
7-D-VII pool, are situated to the east of a large fault structure that
trends northeast-southwest. The fault was instrumental in pro-
viding the mechanism for dissolving up to 60 metres of Silurian
Salina salt to the west of the fault in post Middle Devonian time.
Approximately 50 to 55 metres of Salina salt is preserved underly-
ing the Rodney and 7-D-VII pools to the east of the fault. The salt
remnant provided the structure and resulting trap for the overlying
Middle Devonian pools. Both pools have between 10 and 15 metres
of structural closure.
The Rodney and 7-D-VII pools are also good examples where the
use of modern exploration and engineering methodology have led
to increased production, recoverable reserves and a new discov-
ery. Rodney is presently undergoing secondary recovery through
water-injection. The pool was placed on water-injection between
1962 and 1964 and resulted in a 232 per cent increase in daily pro-
duction volumes and to date approximately 55 per cent recovery
of the estimated original oil in place. After 60 years of production
Rodney is still producing approximately 80 BOPD with a decline
rate of less than five per cent.
The 7-D-VII pool was initially defined using a combination of com-
puter geological mapping, gravity, magnetics and petrophysical
analysis. Two dimensional seismic (2D) was acquired over the po-
tential feature and an anticlinal structure on the top of the Dundee
formation with closure was imaged and was a good fit with the
other data sets. Subsequent successful drilling results confirmed
the existence of the structure. Cased-through completions, stimu-
lations and horizontal drilling were successfully employed in the
initial development stages of the pool. Due to the shallow depth
of the pool, reservoir pressure is very low and a form of secondary
pressure injection will be implemented to maximize daily produc-
tion volumes and ultimate recoverable reserves.
Summary
Middle Devonian pools remain some of the largest oil produc-
ing reservoirs in southwestern Ontario, although the Ordovician
Trenton-Black River reservoirs are becoming increasingly more
economically important. Exploration activity and success directed
to Middle Devonian targets has been very sporadic and poor in the
past fifty years but there remains opportunities for new discoveries
utilizing modern exploration tools and engineering methods. Com-
puter mapping and the use of gravity and magnetics has proven
valuable in defining fault structures and potential preserved sec-
tions of Silurian Salina salt. 2D and 3D seismic are valuable tools to
more accurately image the potential structures for drilling and de-
velopment. Modern engineering methods such as cased-through
completions, stimulations, horizontal drilling and secondary recov-
ery have led to substantial increases in daily production volumes
and ultimate recoverable reserves. n
Technical Feature
Figure 1 Structure Top of Dundee FormationContour interval = 3 metres

Investor Relations Tel: (403) 231-6710Email: [email protected] 2100, 250-2nd St. SW Calgary, Alberta T2P 0C1
PROVIDENT ENERGY
Ltd. is a natural gas
liquids (NGL) focused
Midstream business,
which processes and
sells higher value NGLs
extracted from the
natural gas stream and
provides infrastructure
and logistics services to
liquids producers and
consumers.
www.providentenergy.com

Elexco provides unique Land Consulting and Land Administrative needs to our extensive clientele in North America – from total land project management to small, one-time acquisitions.
Founded in 1976, we have established a strong reputation and take pride in our ability to meet and exceed our clients’ expectations.
Elexco Ltd.Canada: 1.800.603.5263
Elexco Land Services, Inc.New York: 1.866.999.5865Michigan: 1.800.889.3574Pennsylvania: 724.745.5600www.elexco.com
A FULL SERVICE LAND COMPANY SERVING NORTH AMERICA
Elexco OntOil&Gas BC ad final.pdf 1 12-03-15 8:54 PM