services provision of fee-based knowledge policya … revised framework for the provision of...
TRANSCRIPT

PolicyA Revised Framework for the Provision of Fee-Based Knowledge Services
Bank Access to Information Policy Designation
Public
Catalogue Number
Issued
Effective
September 5, 2008
Retired
February 6, 2017
Content
Applicable to
Issuer
OPCS
Sponsor

OFFICIAL USE ONLYSecM2008-0376
September 5, 2008
FROM: Vice President and Corporate Secretary
A Revised Framework for the Provision of Fee-Based Knowledge Services
1. Attached for information is the paper entitled "A Revised Framework for the Provision ofFee-Based Knowledge Services." The paper outlines a revised approach to the provision offee-based services.
2. Questions on this document should be referred to Mr. Harrold (ext. 36048).
Distribution:Executive Directors and AlternatesPresidentBank Group Senior ManagementVice Presidents, Bank, IFC and MIGADirectors and Department Heads, Bank, IFC and MIGA
This document has a restricted distribution and may be used by recipients only in the performance of their official duties. Its contentsmay not otherwise be disclosed without World Bank Group authorization.

A REVISED FRAMEWORK FOR THE PROVISION OF
FEE-BASED KNOWLEDGE SERVICES
OPERATIONS POLICY AND COUNTRY SERVICES
SEPTEMBER 2, 2008

ABBREVIATIONS AND ACRONYMS
AAAACSCASCAOCDPCPS
Analytic and advisory activitiesActivity Completion SummaryCountry Assistance StrategyChief Administrative OfficerCountry Development PartnershipCountry Partnership StrategyCorporate Resource Management DepartmentDevelopment Committee
CSRRMDCECAEFOESWFBS
Europe and Central Asia RegionExternally financed outputEconomic and sector workFee-based service
FIASGDPIFC
Foreign Investment Advisory ServiceGross domestic productInternational Finance CorporationInformation technologyIT
JERPLCRMICMNAOPCSRAMPTA
Joint Economic Research ProgramLatin America and the Caribbean RegionMiddle-income countryMiddle East and North Africa RegionOperations Policy and Country ServicesReserves Advisory Management ProgramTechnical assistance
TAASTM
Technical assistance and advisory servicesTask manager
UN United NationsVPUWTO
Vice-presidential unitWorld Trade Organization

A REVISED FRAMEWORK FOR THE PROVISION OFFEE-BASED KNOWLEDGE SERVICES
CONTENTS
EXECUTIVE SUMMARY ............................................................................................................................ iiiI. INTRODUCTION ..................................................................................................................................... 1
II. CURRENT POLICIES AND PRACTICES.................................................................................................. 3
III. EXPANDING FEE-BASED KNOWLEDGE SERVICES ............................................................................. 5
IV. CONCLUSION..................................................................................................................................... 11
ANNEX A SAMPLE OF FEE-BASED SERVICES PROVIDED, FY00-09 (BY REGION AND FY)................... 13
ANNEX B SUMMARY STATISTICS: FEE-BASED SERVICES PROVIDED BY REGIONS.............................. 25
ANNEX C EXAMPLES OF FEE-BASED SERVICES PROVIDED OR PLANNED ............................................ 29
ANNEX D COSTING METHODOLOGY FOR INDIRECT AND SUSTAINING COSTS..................................... 35
ANNEX E ANALYSIS OF FULL COST RATES FOR FEE-BASED SERVICES ............................................. 45
ANNEX F REVISED OPERATIONAL MEMORANDUM............................................................................... 47


A REVISED FRAMEWORK FOR THE PROVISION OFFEE-BASED KNOWLEDGE SERVICES
EXECUTIVE SUMMARY
1. In recent years, the World Bank has sought to redefine its strategy of engagementwith middle-income countries and, more broadly, to show greater responsiveness toindividual clients’ needs. Specifically, the Bank has recognized the importance ofoffering a broader and more flexible package of products and services to a heterogeneousgroup of clients that have increasing access to private capital markets. One element ofthis new approach consists in unbundling analytic and advisory services from lendingactivities. While the Bank has been providing fee-based services for years, the challengeis to extend and streamline the provision of knowledge services together with, orunbundled from, lending to offer clients a wider range of options. This paper describes,for Executive Directors’ information, how Management is addressing this challenge.
2. Scope and Issues. The Bank provides two broad kinds of fee-based knowledgeservices. First, Treasury offers financial advisory services in such areas as assetmanagement, public debt management, and capital market access strategy andimplementation; Treasury has its own governance framework for these services. Second,the Regions and some Networks provide analytic and advisory services, which are thesubject of this paper. A recent review of experience found that the volume of suchservices provided or planned remains relatively modest, even though they are animportant line of business in MNA and have grown rapidly in recent years, particularly inECA and LCR. It also found that most fee-based services are delivered broadly in linewith the existing governance framework (set out in the Operational Memorandum TheProvision of Fee-Based Services, May 22, 1998), although staff say that this frameworkis neither easily accessible nor user-friendly, and it is clear that fee income actuallyreceived rarely reflects the full cost of providing the service.
3. Approach. To scale up the provision of fee-based knowledge services,Management is taking the following measures, none of which involves a significantchange in operational policy.
• Mainstreaming fee-based services. To “mainstream” these services in theRegions, they will be added to the menu of Bank assistance options routinelyconsidered in the Country Assistance Strategy/Country Partnership Strategy(CAS/CPS) process.
• Financing and cost-sharing of fee-based services. Management will clarifythe requirement for full cost recovery, distinguishing more clearly between thecosting and pricing of such services and their financing and explicitlyproviding for Bank cofinancing.
• Defining and accessing fee-based services. Management will clarify that theBank may provide project-related services, subject to appropriate safeguardsmitigating liability and reputational risks; and that fee-based services are
iv
available to (a) subnational entities, and (b) developed and graduatedcountries, as long as they are consistent with the Bank’s development andpoverty mandates. In addition, Management will replace the requirement todemonstrate the Bank’s comparative advantage by a requirement to ensureconsistency with the institutional mandate.
• Assuring quality and accountability of fee-based services. Management willalso clarify that fee-based services must comply with all applicable Bankoperational policies—an aspect that would be especially important if theBank’s involvement in project-related services continues to increase. Inaddition, Management will encourage the creation of central and/or Regionaldatabases to satisfy the Bank’s accountability and fiduciary obligations andfacilitate periodic monitoring and evaluation of fee-based services.
• Rationalizing the costing methodology. To ensure that the full costs involvedin providing services are explicitly factored in, Management will introduce auniform and transparent costing methodology to be applied in all Regions andNetworks.
4. Revised Instructions. Management has revised the Operational Memorandum toreflect these changes and will issue it to staff in early September. For information, therevised memorandum is attached to the paper as Annex F.

A REVISED FRAMEWORK FOR THE PROVISION OFFEE-BASED KNOWLEDGE SERVICES
I. INTRODUCTION
1. In the past few years, the World Bank has recognized the need to offer a moretailored set of products and options to its clients—particularly to middle-incomecountries (MICs), whose development challenges, institutional capacity, and assistanceneeds vary greatly. In many MICs the Bank’s ability to provide cutting-edge andtargeted assistance has been increasingly challenged by the combination of strong GDPgrowth and considerably improved access to private capital markets. Many MICs are stillattracted to Bank borrowing terms and conditions and welcome the bundled package ofservices that the Bank provides. Others have gained cheap and relatively secure access tocapital markets and no longer wish to borrow extensively from the Bank—but many ofthem still want to be able to access the Bank’s knowledge services. The Bank, for its part,recognizes that continued engagement with MICs is beneficial to its broader mission:MICs now contribute significantly to the provision of global public goods, and Bankinvolvement generates substantial knowledge externalities and opportunities for South-South learning.
2. Provision of Fee-based Services. The consultation on the MIC strategy paper1
suggested that, to best serve MICs, the Bank must continue to offer both knowledge andlending services and must also expand the palette of services available and the flexibilitywith which they can be delivered. One recommended approach, which was built into theMIC strategy, was that the Bank provides technical assistance and other analytic andadvisory services not only in conjunction with financing, but also as stand-alone activitieson a fee-for-service basis.
3. Context. In recent years, the Bank has significantly increased its analytic andadvisory activities in both borrowing and nonborrowing member countries. Although inthe past such activities were funded almost entirely from the Bank’s administrativebudget, recently third-party resources (mainly trust funds) have become important aswell. In FY06, for example, over 900 individual tasks were delivered to a wide array ofclients at an estimated total cost of about $240 million—about $170 million (70 percent)from the administrative budget, and the remainder from trust funds. At the same time,client countries—both borrowers and nonborrowers—have increasingly contributed tothese tasks, directly or indirectly, in cash or in kind.2
1
2
Strengthening the World Bank’s Engagement with IBRD Partner Countries (DC2006-0014),September 7, 2006.This participation by clients is consistent with the Bank’s commitment in the Paris Declaration, signedat the Second High Level Forum on Aid Effectiveness in 2005, to increase the substantive involvementof client countries in analytic work for greater effectiveness and impact (see Harmonization andAlignment for Greater Aid Effectiveness: An Update on Global Implementation and the Bank’sCommitments, OPCS, October 30, 2006), and with the Bank’s strategy for strengthening itsengagement with 85 MICs, endorsed by the Development Committee (DC) at its September 2006meeting in Singapore (see Development Committee Communiqué, Singapore, September 18, 2006,paragraph 9). Indeed, knowledge services, including analytic and advisory activities, are one of five

2
4. Governance Framework. A recent evaluation by the Independent Evaluation3Group and experience with fee-based services suggest that the Bank’s governance
framework for such services needs to be updated to reflect changing circumstances and tosupport implementation of the MIC strategy. To enhance clarity and transparency, givebetter guidance to operational staff, and facilitate monitoring and evaluation, thegovernance framework for fee-based services needs to be consistent with the updated
4management framework recently recommended for Bank-administered trust funds andwith IFC’s guidelines for the provision of technical assistance and advisory services(TAAS).
5. Purpose of this Paper. This paper addresses the last of the MIC strategy’s threerecommendations relating to knowledge services: expanding the delivery of fee-basedknowledge services in a flexible manner, on a larger scale, and unbundled from lending.5Section II briefly reviews current policies and practices, Section III discusses measures toexpand fee-based analytic and advisory services, and Section IV draws conclusions. Thepaper’s scope is deliberately narrow; at a later date, its substance will be incorporatedinto the broader reform of approaches to the provision of knowledge services that isunder way as part of the overall MIC strategic theme.6
6. Definition. Unless otherwise indicated, this paper uses the definition of fee-basedservices set out in the Operational Memorandum (Op Memo) The Provision of Fee-BasedServices (May 22, 1998): analytic and advisory activities—including technical assistance,institutional development, and training—that a client requests, which the Bank cannotfund in full through the administrative budget, and for which the client agrees toreimburse or pay the Bank. Fee-based services are comparable to the services offered bythe IFC in its TAAS program, and do not include most services provided by theTreasury.7
key business areas targeted for improvement in the MIC strategy and further elaborated under theMiddle-Income Country component of the Bank’s six strategic themes.Development Results in Middle-Income Countries: An Evaluation of the World Bank’s Support,September 2007.
3
45
A Management Framework for World Bank-Administered Trust Funds (R2007-0198), October 9, 2007.The other two recommendations─to be addressed separately─are strengthening the links between Bankresearch and operations and eliminating the impediments to global delivery of expertise.This paper does not investigate the proposition to make fee-based services available to the Bank’smember countries, but rather seeks to rationalize the policy and administrative framework for theprovision of such services. Depending on the evolution of this line of business over the next fiscalyear, it may become necessary to carry out a more strategic assessment of the role of fee-basedservices within the range of Bank assistance options and of its implications for business model andstaffing.
6
7
Most Treasury-provided services—for instance, services provided under the Reserves AdvisoryManagement Program (RAMP)—have their own governance framework. The framework set out inthis paper would apply to other Treasury-provided fee-based services if they are comparable in natureand scope to those typically offered by Regions and are not covered by such special governancearrangements.
3
II. CURRENT POLICIES AND PRACTICES
7. Since the late 1990s, the Bank’s provision of fee-based advisory services has beengoverned by Operational Policy (OP) 8.40, Technical Assistance (para. 7), and, inparticular, by the accompanying Op Memo Provision of Fee-Based Services. Keyfeatures of this governance framework may be summarized as follows:
General Principles
• Fee-based services should be consistent with the Bank’s mandate as set out inits Articles of Agreement and, for borrowing countries, with CountryAssistance Strategy (CAS) priorities.
• They should not normally be available commercially. They may be providedonly where the Bank has a clear comparative advantage, derived from itsglobal knowledge and expertise and its independence and objectivity.
• They should not involve any conflict of interest for the Bank, nor should theyassist one member country to advance its interests over those of another.
Eligibility
• Recipients of fee-based services may be (a) governments and governmentinstitutions of member countries, including those of “graduated” countries; (b)nongovernmental organizations and other not-for-profit private sectorassociations (such as chambers of commerce), subject to any necessaryapproval by the government of the member country concerned; and (c)multilateral institutions, including other development banks.
Costs, Fees, and Financing
• Fee-based services should be priced at full cost recovery, using themethodology of uniform pricing: direct salary and related benefits, travel andsubsistence, and associated overhead costs.
• Clients may pay for fee-based services from their own budgetary resources,from eligible trust funds, or from other third-party resources.
Quality Control
• Fee-based services are subject to all applicable Bank operational policies andto the same Bank quality controls and practices as analytic and advisoryservices funded by the Bank’s administrative budget.
8. Extent of Fee-based Services. The services that this paper considers are analyticand advisory activities managed by sectors and country units in the Bank’s six Regions.Since FY00, the Regions (mainly MNA, ECA, and LCR) have provided over 300 suchactivities (most nonlending technical assistance and institutional development) in 30

4
different countries with an estimated total cost of over US$64 million. Since FY05 therehas been a notable acceleration in the provision of such fee-based services, especially in
8 9ECA and LCR. (Annex A illustrates the size and scope of such services. )
9. Rapid Growth. While the quantity of fee-based services provided to date ismodest in relation to the Bank’s other activities, they are a major line of business inMNA (over 10 percent of the MNA budget) and have been growing very rapidly in recentyears overall and particularly in ECA and LCR (Annex B provides key summarystatistics). In LCR the volume reached some $2 million in FY08, and it is projected thatthis amount will double in the next two years. Likewise, in ECA, fee-based services havebecome a key pillar of the Bank’s engagement in Russia: the total committed amountstands at around $4.3 million and could reach more than $15 million in the near future.While some activities are policy-based analysis or advice, many are nonlending technicalassistance—71 percent of the total—or institutional development, implying that demandhas been more for operational than analytic services. Going forward, the precise extent ofdemand for analytic and advisory services provided on a fee-for-service basis is difficultto gauge, although at least two Regions (ECA and LCR) have plans to market themproactively during FY09 and beyond.
10. Policy Issues. While most fee-based services are delivered broadly in line withthe principles and criteria set out in the Op Memo, these guidelines have occasionallybeen problematic. For example, some Regional staff report that it can be difficult toprovide evidence of the Bank’s comparative advantage (in two recent project-relatedassignments in Russia, the needed expertise was arguably available commercially).Some staff believe that the only criteria should be a country’s request, its willingness andability to pay, and, in particular, the country director’s considered judgment that the taskin question is in the Bank’s institutional interest. Staff in ECA and LCR, where activitiesat state or local government levels are increasingly important, have asked that the threetypes of recipients of fee-based services listed in the Op Memo be defined more preciselyand include subnational governments and related entities.
11. Governance Framework. Feedback from an informal survey of task managersconducted in FY07 suggests that the existing governance framework for fee-basedservices is neither easily accessible nor user-friendly. Specific concerns relate to thedocumentation required, including templates and legal agreements/contracts, internalprocessing steps, quality control, and monitoring and evaluation. Some staff (e.g., inECA) say that these internal bureaucratic constraints have impeded the prompt deliveryof fee-based services.
8 There has also been significant growth in FY05-FY07 in financial advisory services offered byTreasury in three areas: asset management, public debt management, and capital market accessstrategy and implementation. In FY07, they included 29 RAMP engagements or contracts in 24countries with estimated client revenues totaling just over $8 million (up from 20 contracts totalingabout $6.2 million in FY06). As was indicated earlier, these services fall under a distinct governanceframework and would not be governed by the updated framework discussed here.
9
It should be noted that these services are not separately coded in SAP and therefore it is quite possiblethat a number of agreements have been missed or that reported amounts differ from actuals, althoughnot to an extent that would distort the overall picture.
5
12. Cost Recovery. Although the Op Memo calls for fee-based services to be priced atfull cost using the methodology of uniform pricing, the fees actually received for suchservices have not reflected the full costs. This derives from two issues. First, becausethere has not been a widely accepted methodology for calculating these costs, it appearsthat the Bank’s services have frequently been underpriced and that different clients havebeen charged highly variable amounts. Second, for entirely legitimate reasons, managershave frequently used the Bank’s budget to cofinance such services. In Thailand andKazakhstan, for example, the Bank and the country are transparently sharing the costs ofanalytic and advisory activities; the managers concerned judged that other, nonfinancialbenefits to the Bank and the countries justified accepting partial cost recovery. Withlimited Bank budget available to provide knowledge services to clients, cost-sharingarrangements allow the Bank to perform a larger range of services, and clients value theBank’s demonstrating its commitment to the analytic products by using its own budget.Given the Bank’s ambition to expand fee-based analytic and advisory services, as well asthe burgeoning demand for analytic work involving regional and global public goods,there are good reasons to define and mainstream a cost-sharing model.
III. EXPANDING FEE-BASED KNOWLEDGE SERVICES
13. Management is launching an effort to expand the provision of fee-based analyticand advisory services. Although these services are important to specific countryprograms (mainly in LCR, MNA, and ECA) and are a promising avenue for maintainingthe Bank’s engagement in graduating or nonborrowing countries, their use remainslimited. Thus a key first step is for these services to be mainstreamed in Regions—muchas Foreign Investment Advisory Service (FIAS) activities have become a standard ofIFC’s normal business, and financial advisory services have become an increasinglyroutine Treasury function. To this end, Management plans to
• formally add fee-based analytic and advisory services to the menu of Bankassistance options and services routinely available to all MICs;10
• announce, disseminate, and promote the availability of fee-based servicesinternally and externally, as is done for new lending options; and
• encourage country directors/teams to routinely discuss the option of wholly orpartly fee-based analytic and advisory services as part of the periodicCAS/Country Partnership Strategy (CPS) process for MIC clients.11 TheCAS/CPS would obviously not present intentions for specific activities but
10 While low-income countries are also technically eligible to purchase fee-based services, demand islikely to remain low as the costs—even discounted—will remain prohibitive, and significant AAA isalready provided within the framework of lending programs.
11 Annex C summarizes a sample of fee-based services recently provided, or currently planned, in 11MICs (Chile, Czech Republic, Kazakhstan, Malaysia, Mexico, Mauritius, Poland, Russia, SlovakRepublic, South Africa, and Thailand).

6
would discuss recent experience and reflect the possible role of such servicesin the future relationship.
14. Revised Instructions. In addition, Management is revising the Op Memo on fee-based services to provide a more coherent, flexible, and user-friendly governanceframework to facilitate the promotion and implementation of expanded fee-basedservices. This section explains the provisions of the new Op Memo.
A. Financing and Costing Fee-based Services
15. The long experience of FIAS and the recent growth of the Treasury’s financialadvisory services demonstrate effective demand for fee-based services. Whether there issimilar latent demand for fee-based analytic and advisory services—beyond the sampleof countries that are currently demanding them—remains to be seen; several countryoffice staff have indicated their clients’ preference for bundled services and do not see arole for fee-based services in their relations. This raises the question of whether the Bankshould be prepared to offer incentives in marketing or promoting fee-based services,since the Bank itself may benefit at least indirectly from providing these services. Otherinternational financial institutions have earmarked additional resources for advisory and12knowledge services. In addition, in 2007 IFC adopted a cost-sharing model for theprovision of TAAS, which notably allow for “substantial subsidies” to governmentclients, and for private clients propose a cost-sharing starting point of 50 percent,adjustable upward or downward.13
16. Bank Approach. Taking these factors into account, the new Op Memo replacesthe requirement for full cost recovery with a more differentiated model thatacknowledges MICs’ varying ability and willingness to pay in full, formalizes actualexperience and practice to date, and encourages MICs’ demand for analytic and advisoryservices involving regional or global public goods. It makes clear that such services willbe fully costed, but that the Bank may consider financing a share of the activities.Management will take the following approach to the financing of fee-based servicesduring FY09-10:14
• The Bank will contribute to the financing of services whose provision is ofstrategic interest to the Bank. The Bank’s share will be financed fromcountry program or department budgets, at Management’s discretion (as has
12 The Asian Development Bank recently created a $20 million e-Asia and Knowledge Partnership Fund(funded by a grant from South Korea), half of which is earmarked for policy advice/dialogue, capacitybuilding, institutional development, and technical assistance; this fund encourages “contributions,either in kind or in cash, from countries benefiting from activities financed under the Fund.” Inaddition, in 2002 the African Development Bank created a Technical Assistance Fund for MiddleIncome Countries─initially in the amount of UA 1 million and subsequently increased in 2005 toUA15 million─to finance project preparation, capacity and institution building, country economic andsector work, and activities to promote the private sector.
13
14
IFC: “Advisory Services Guidelines and Practices”, available online athttp://ifcnet.ifc.org/intranet/facilities.nsf/Content/Announcement_Advisory_GuidelinesThis approach is in line with IFC’s new guidelines for the provision of TAAS; see IFC’s “TechnicalAssistance and Advisory Services – Pricing Guidelines.”

7
been done in Kazakhstan). Management will decide on the size of the Bank’scontribution in particular countries within the limits of the overall budget,including the budget for analytic and advisory services, according to countryneeds and the Bank’s interest in providing the services.
• Full cost recovery—100 percent financing—will apply to all other cases.This category includes services provided to governments or institutions incountries for which the Bank does not currently have an administrativebudget, United Nations Agencies, and other multilateral institutions.
• The Bank may make variable contributions to the financing of services thatinvolve regional or global public goods—from a starting point of 50%,
15adjustable upwards or downwards. The Bank’s share could be financedfrom country program or department budgets. Eventually, the Bank may wishto consider creating for this purpose a new source of financing from surplus.
17. Relationship with Country Programs. Management does not consider that Bankcontributions to the costs of fee-based services are an entitlement; rather, suchcontributions will be provided at the discretion of Regional Management on the basis oftheir best judgment of the individual country’s and the institution’s best interests andtaking into account the constraints of country program budgets. The amount of cost-sharing available will remain constrained by the envelopes allotted to eachcountry/department program, thus limiting the risk of overcommitment. The risk thatsuch an indirect subsidy might crowd out services that would otherwise be procuredprivately is mitigated by the Bank’s vocation to respond to targeted demands as well asby the many nonmonetary reasons why clients may seek Bank advice over private16alternatives. Taken together with the proposal to cost proposed services systematicallyacross units at full cost recovery, officializing a cost sharing model amounts simply toshifting the margin of discretion from costing to financing and to making the processmore transparent by making individual units/departments internalize eventual subsidies
18. Costing Fee-based Services. The Bank requires that fee-based services be pricedto recover “full costs”—that is, the sum of direct costs and indirect and sustaining costs.The Bank needs a uniform methodology for calculating indirect and sustaining costs.Corporate Resource Management (CSRRM) has developed a methodology (see AnnexD) that can apply to fee-based services as well as to other externally financed activities.17
This methodology accounts for indirect and sustaining costs by “marking up” direct costsby Region-specific factors corresponding to the observed ratios of total costs to directcosts in each Region for the previous available fiscal year. Given the modest spreads inthe resulting markups across Regions (see Annex E), for the sake of simplicityManagement has decided to adopt a single rate—a simple average of Regional rates. Therate will be revised every two years, with any new rate applicable only to new oramended, not ongoing, contracts. Using FY07 data, both simple and weighted averages
1516
Based on regional Management’s overall assessment of the public benefits involved.At the same time, staff who are contemplating providing fee-based services should be sensitive to therisk of crowding out private provision of reasonably priced services of comparable quality and scope.CSRRM: “Fee-based services costing methodology for indirect and sustaining costs.”17

8
amount to roughly 51 percent; therefore, Management has adopted a single markup of 50percent for fee-based services in FY09 and FY10.
19. Sliding Scale. Staff have occasionally expressed interest in a model under whichthe Bank could charge its wealthier clients more than the full cost recovery price and usethese additional resources to subsidize analytic work in less-well-off client countries.Management does not advocate such an approach at this stage, but will reconsider theoption in a year, taking into account observed trends in FY09, a more thorough analysisof latent demand, and consideration of the implications for the Bank’s business model.
B. Defining Fee-based Services
20. The Op Memo’s broad definition of what constitutes fee-based services appears tohave served its purpose well, permitting the Bank to provide a wide range of policy-basedand project-related activities. Thus, Management considered with caution staff’ssuggestion to add more specific definitions, since narrower definitions could becomeconstraining. However, the very diversity of activities—including requests for help withproject design and supervision—as well as growth in other third-party financing options,such as externally financed outputs (EFOs), and the difficulty of applying thecomparative advantage requirement suggest that it is now appropriate to revisit thedefinition of fee-based services.
21. Revised Definition. The revised Op Memo distinguishes fee-based arrangementsfrom activities financed by donor-provided trust funds, including EFOs, by the fact thatthe Bank provides fee-based services in response to a request by a recipient; the recipientpays partly or fully for the services; and the services are for the sole direct benefit of therecipient. Furthermore, the scope of fee-based services is set out in an agreement whosebusiness terms the client has the power to define in detail (including with regard totiming, deliverables, and even team composition) and tailor to its specific needs. Therevised Op Memo recognizes that fee-based services are increasingly provided inconnection with client-financed project implementation by reaffirming that project-related services are clearly an area of the Bank’s development mandate and, therefore,constitute a legitimate line for expanding fee-based services.
22. Risk Management. However, as a corollary, it is important to strengthen riskmanagement. While liability to the client is excluded by the “hold harmless” provision in
18the standard form of the Bank’s fee-based services legal agreements, it is possible thatthird parties may bring claims against the Bank, particularly in connection with project-related services. Liability risk cannot be fully eliminated, but it can be mitigated inseveral ways.
• The revised Op Memo retains the prohibition on the Bank’s taking onactivities that pose an especially high level of liability risk, such as detailedengineering, final project design, or actual implementation of projects,including procurement.
18 Under this “hold harmless” provision, the client agrees that the Bank will not be liable for any loss,cost, damage, or liability that the client may incur as a result of the services provided by the Bank.

9
• The Bank may assert privileges and immunities against judicial process toshield itself against the claims of third parties brought in national courts.
• The standard form of the Bank’s fee-based services legal agreements containsprotective clauses, including an indemnity by the client against any loss, cost,damage, or liability to the Bank arising from claims by third parties.19
• As a last resort the Bank may be able to claim compensation under itsProfessional and General Liability Insurance Policies.
• Finally, the revised Op Memo provides that staff must explicitly considerliability and reputational risks and judge them to be acceptable to the Bank,taking into consideration any risk mitigation measures to be put into place. If,in agreement with the relevant lawyer, Regional Management considers thatthat this condition cannot be met, the Bank will decline to take on the fee-based service.
23. Comparative Advantage. The requirement that services provided on a fee-for-service basis should be limited to areas of the Bank’s clear comparative advantage hasproved problematic and its practical application increasingly less relevant. First, almostall of the Bank’s services are available today on the private market. Second, it can beargued that virtually any activity for which the government’s motive in seeking the Bankderives from the Bank’s ability to deliver neutral advice would be de facto eligible.Finally, taking the requirement literally would seriously compromise the Bank’s ability torespond flexibly and quickly to client requests. For these reasons, the revised Op Memoreplaces the comparative advantage requirement with a provision that Management isresponsible for ensuring that the services provided are congruent with the Bank’sinstitutional mandate. This definition excludes, for instance, activities related to reliefwork or those that have a direct political or human rights dimension, and it requires teamsto demonstrate a clear relation to the Bank’s objectives of promoting development andfighting poverty.
C. Accessing Fee-based Services
24. While the three types of recipients of fee-based services listed in the Op Memoare sufficiently broad to cover most circumstances, some staff have advocated explicitmention of subnational or local governments as well. In addition, the Bank has providedfee-based services to donor countries in the past, and the question has arisen whetherdeveloped and graduated countries should be allowed to access fee-based services, eitherroutinely or on an exceptional basis. Another question that has arisen is whether the OpMemo should more explicitly cover fee-based services to other regional/multilateralinstitutions (e.g., UN agencies) or regional groupings.
25. Subnational Entities. While there is no policy or legal impediment to theprovision of fee-based services to subnational entities—nor any reason not to list them
19 The standard form of legal agreement is being revised, partly to strengthen the Bank’s protections.

10
explicitly in the Op Memo—special legal considerations may apply. For example, insome countries subnational entities may not have the legal capacity to enter intoagreements with international organizations or provide certain assurances (e.g., as to theBank’s privileges and immunities) that the Bank may deem necessary; thus the Bank mayneed to undertake legal due diligence before it can agree to provide fee-based services toa subnational entity. Therefore, the revised Op Memo both mentions subnational entitiesand requires associated legal due diligence. (Since in most cases country lawyersroutinely carry out such legal due diligence, these guidelines do not imply new oradditional steps for country teams.)
26. Developed Countries. There is no legal impediment to the Bank’s providing fee-based services to developed countries or to regional or other international organizations.However, all Bank activities must serve the Bank’s purposes; thus proposals for fee-based services to these countries and organizations in particular should demonstrate howthey would further the Bank’s overall economic development mandate and povertyalleviation mission. The most obvious rationale is that they would increase the Bank’sstock of knowledge relevant to its developing country clients, but the new focus onmanaging global public goods is also expected to require the involvement of developednations and multilateral institutions. For these clients, of course, any services providedwould be on a full cost basis. The new Op Memo adds them to the list of eligiblerecipients, together with the requirement to demonstrate consistency with the Bank’smandate.
D. Quality of Fee-based Services
27. At present, it is unclear whether the quality assurance arrangements and practicesprescribed by the Op Memo are being observed. Anecdotal evidence suggests that manyfee-based services are not being subjected to all applicable Bank operational policies andrelevant quality controls and practices. While such a deficiency is of potential concernfor all types of fee-based services, the consequences of noncompliance with the Bank’soperational policies in cases of project design or supervision could be very serious.
28. Compliance with Policies. Three examples illustrate how these policies shouldapply in practice: first, if the Bank is asked to advise on the design of an infrastructureproject, an environmental assessment needs to be undertaken and reflected in the Bank’sadvice; second, if a client rejects or ignores advice that is based on the Bank’s operationalpolicies, the Bank should reserve the right to terminate its engagement and furtherinvolvement in the project; and third, the Bank should not accept any engagement—forexample, supervision—associating it with a project that does not conform to Bankoperational policies. The updated Op Memo includes more explicit requirementsregarding quality assurance and control, and specifically the applicability of Bankoperational policies to all fee-based services. In addition, Management will providetemplates for project-related services that will reflect these policies. It should be madeclear that applying the Bank’s operational policies, not only to the advice provided by theBank but also to the underlying project, does not imply that client countries or institutionsshould be required to follow the Bank’s policies exactly. Instead, in line with the Bank’smove toward relying increasingly on country systems, Management should ensure that
11
client rules and procedures are consistent with the Bank’s safeguard and fiduciarypolicies and equivalent in terms of the assurances they provide.20
29. Accounting for Fee-based Services. An issue that emerged during thepreparation of this paper is that the Bank lacks a central or Regional information systemto monitor basic cost and reimbursement data related to fee-based services. Given therelatively modest level of activities to date, this has not yet become a significant concern;however, assuming a gradual increase in fee-based services during the next few years,central and/or Regional databases will need to be set up not only to satisfy the Bank’saccountability and fiduciary obligations but also to monitor and evaluate the efficiencyand effectiveness of these services, and to make sure that fee-based services arerecognized as regular tasks on equal footing with conventional technical assistance andeconomic and sector work. To simplify the process of accounting for fee-based services,OPCS will ensure that clear guidance is available to staff who are entering suchoperations into SAP, and will support CSRRM in redesigning the IT architecturesupporting fee-based services and other externally financed activities.
IV. CONCLUSION
30. This paper has discussed expanding the Bank’s delivery of fee-based knowledgeservices in a flexible manner, on a larger scale, and unbundled from lending. It describesManagement’s plan to encourage more proactive mainstreaming of analytic and advisoryservices by Regions and explains the changes Management is making in the overallgovernance framework to expand the delivery of fee-based services among MICs duringthe next few years. In summary, Management will encourage staff to mainstream fee-based services and discuss them in the CAS/CPS, where relevant (paras 16-17), and willissue a new Op Memo (attached as Annex F) that contains the following changes:
• cost-sharing criteria and parameters ;
• expansion of the definition of fee-based services to explicitly includeproject-related services;
• replacement of the comparative advantage requirement with a requirementthat fee-based services must conform to the Bank’s institutional mandate;
• extension of access to subnational and local governments;
• enhanced quality controls and accounting mechanisms; and
• a standard methodology for pricing, with a markup of direct costs initiallyset at 50 percent.
20 Over time, the Bank will need to strengthen its mechanisms for managing reputational risks whenoffering services to subnational and para-public entities whose credentials are not established; thisprocess should take place in a broader framework applicable to Bank operations more generally andincluding not only fee-based services but also EFOs.

12

13
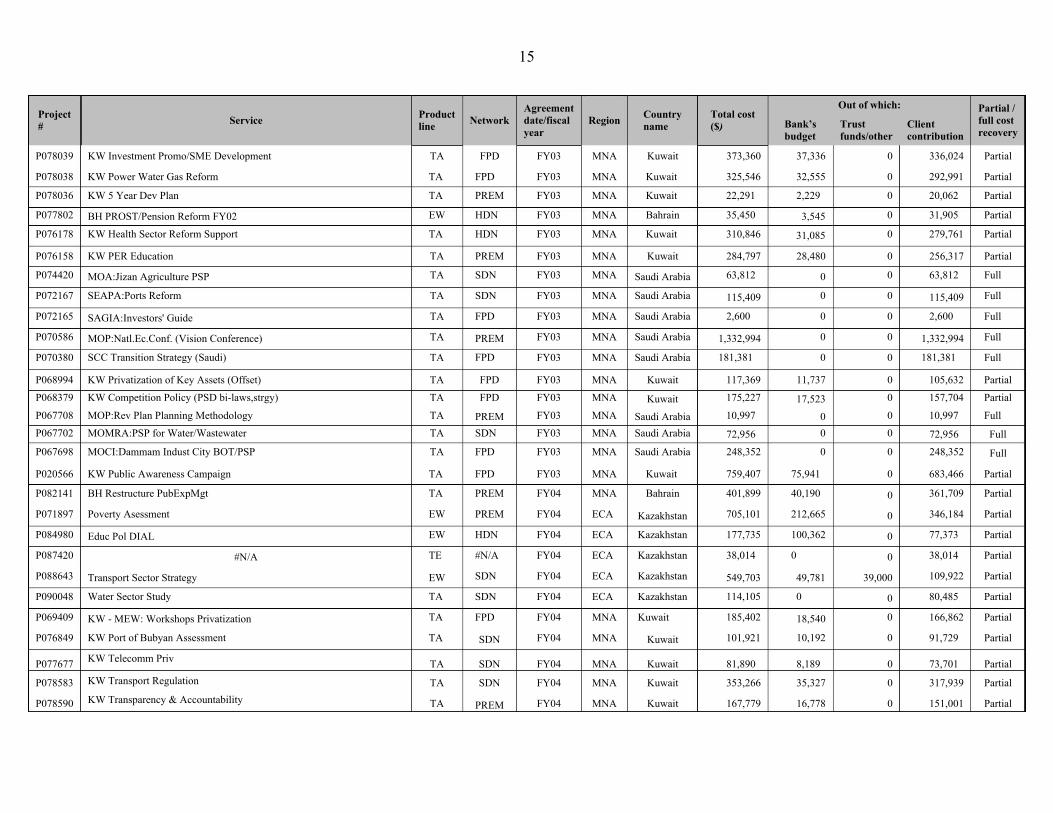
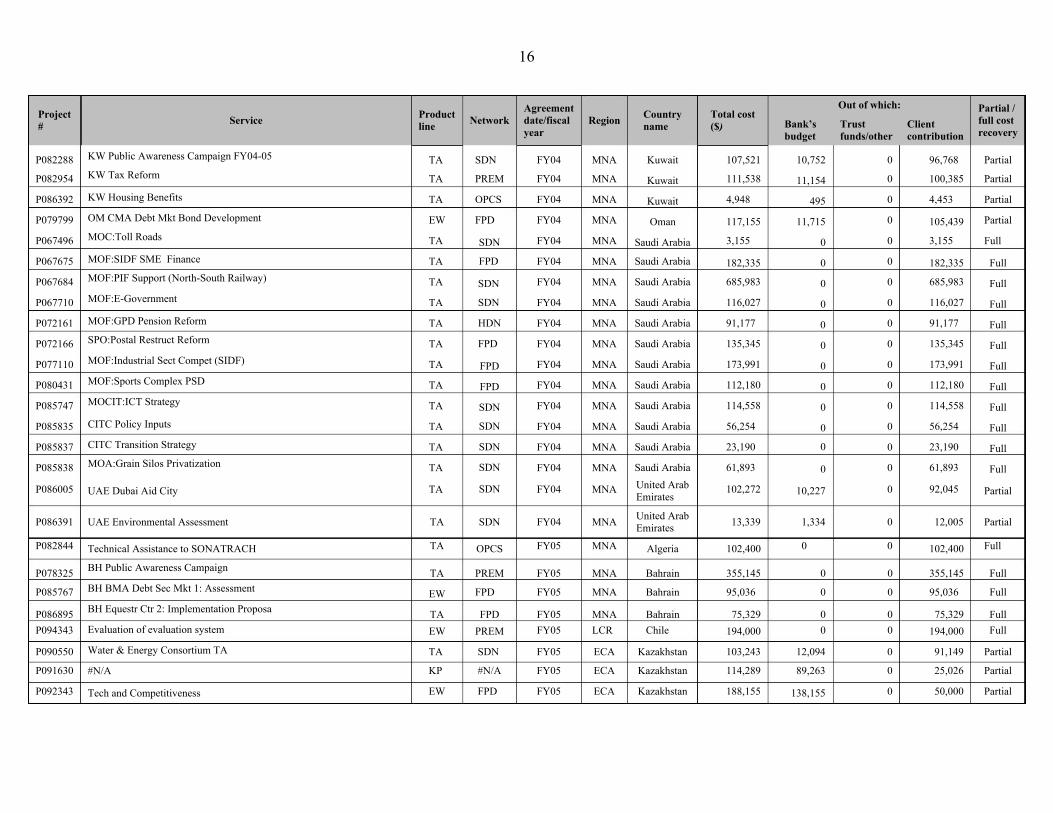
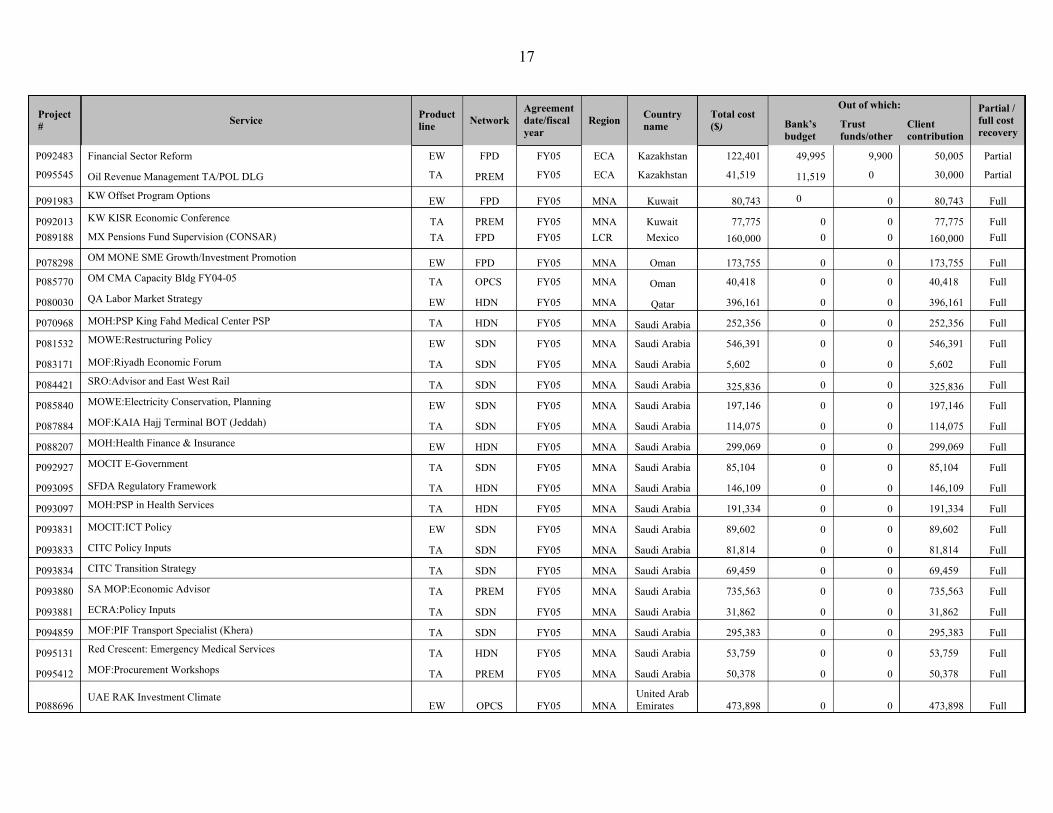
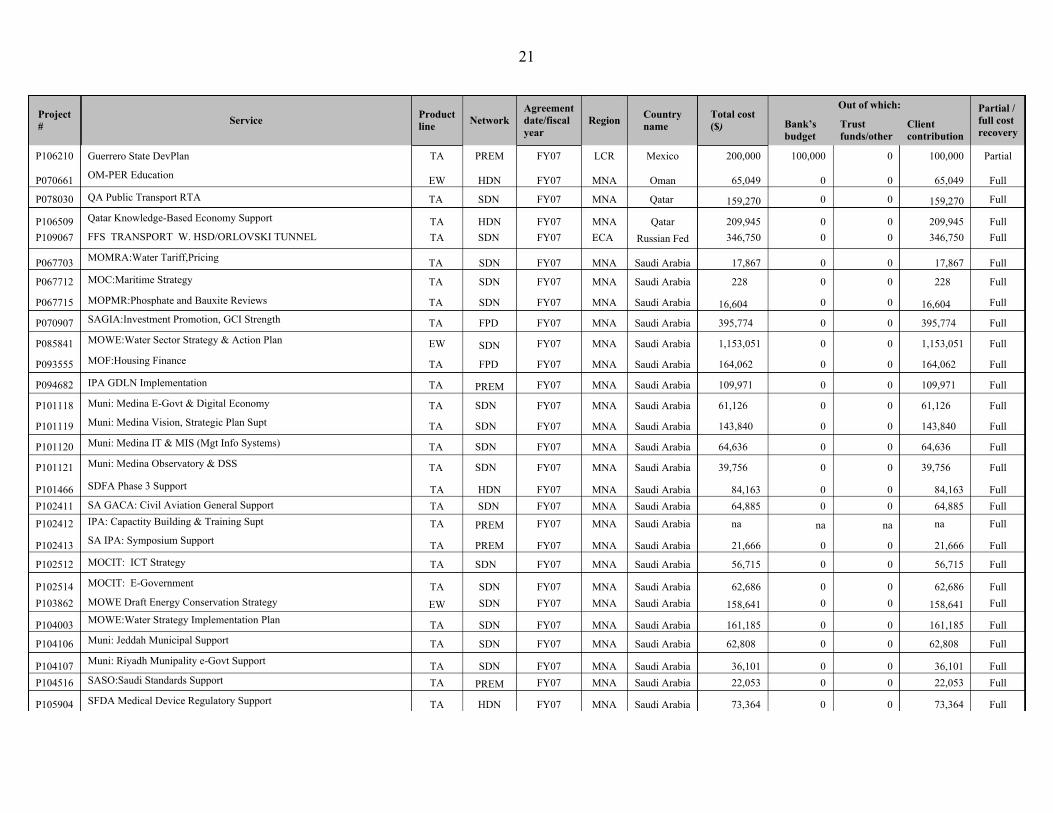
ANNEX ASAMPLE OF FEE-BASED SERVICES PROVIDED, FY00-09 (BY REGION AND FY)
Out of which: Agreement date/fiscal year
Partial / full cost recovery
Project #
Product line
Country name
Total cost ($) Service Network Region Bank’s
budget Trust funds/other
Client contribution
P067639
P067687
P067692
P067694
P068913
P072477
P020638
P067680
P067711
P069782
P072169
P072170
P072478
P076176
P076177
P078300
P078037
P070049
P068993
P050090
P067671
P067697
MOF:Saudia Air Restructuring TA
TA
TA
TA
TA
TA
TA
TA
TA
TA
TA
TA
TA
TA
TA
EW
TA
TA
TA
TA
TA
TA
FPD
SDN
ISN
FY00
FY00
FY00
FY00
FY01
FY01
FY01
FY01
FY01
FY01
FY01
FY01
FY02
FY02
FY02
FY02
FY02
FY02
FY02
FY02
FY02
FY02
MNA
MNA
MNA
MNA
MNA
MNA
MNA
MNA
MNA
MNA
MNA
MNA
MNA
MNA
MNA
ECA
Saudi Arabia
Saudi Arabia
Saudi Arabia
Saudi Arabia
Bahrain
35,000
38,492
37,452
210,000
19,206
7,363
0
0
0
0
0 35,000
38,492
37,452
210,000
17,286
6,627
Full
Full MOF:Mining Investment Promotion
MOF:EDI Implementation (Saudi Net)
MOF: EFS Transition Support
BH PER for Education
0
0 Full
ISN 0 Full
HDN
PREM
PREM
FPD
1,921
736
0
0 Partial
Partial
Full
BH MOFNE Technical Assistance/Support
MOP:Support
Bahrain 0
Saudi Arabia
Saudi Arabia
Saudi Arabia
Saudi Arabia
Saudi Arabia
Saudi Arabia
Bahrain
932,947
361,000
194,271
20,000
60,784
123,728
174,250
249,991
153,516
242,151
183,239
106,465
52,587
68,494
165,940
312,837
0 932,947
361,000
194,271
20,000
60,784
123,728
156,825
224,991
138,165
155,644
164,915
106,465
47,328
68,494
165,940
312,837
MOF:Export Program (Finance) SFD
MOCOM:Railway Expansion Dev, Implmntn
MOF:Knowledge for Development
MOH:Health Insurance
0 0 Full
SDN
PREM
HDN
FPD
0 0 Full
0 0 Full
0 0 Full
STA:Tourism Sector Development
BH Health Insur, Mat Mgt
0 0 Full
HDN
FPD
17,425
24,999
15,352
86,485
18,324
0
0 Partial
Partial
Partial
Partial
Partial
Full
BH Transport Sector PSD Bahrain 0
BH Fiscal Study (Pub Sect Ref/MTEF)
Livestock Study
PREM
SDN
PREM
FPD
Bahrain 0
Kazakhstan
Kuwait
22,000
KW Review of Concessions
Real Time Gross Settlement Initiative
OM PER Health
MNA
AFR
0
0
0
0
0
0
Mauritius
HDN
SDN
FPD
MNA
MNA
MNA
MNA
Oman 5,259
0
Partial
Full MOMRA:Solid Waste Management
SERA:Elect Regl Policy Inputs
MOF:Jeddah Wastewater
Saudi Arabia
Saudi Arabia
Saudi Arabia
0 Full
SDN 0 Full

14
Out of which: Agreement date/fiscal year
Partial / full cost recovery
Project #
Product line
Country name
Total cost ($) Service Network Region Bank’s
budget Trust funds/other
Client contribution
P067701
P067713
P070015
P070379
P072162
P074477
P076898
P074223
P083571
P083363
P082113
MOMRA:Municipal PSP (AUDI) TA
TA
TA
TA
TA
TA
TA
TA
TA
EW
TA
FPD
HDN
PREM
OPCS
HDN
HDN
HDN
FPD
FY02
FY02
FY02
FY02
FY02
FY02
FY02
FY03
FY03
FY03
FY03
MNA
MNA
MNA
MNA
MNA
MNA
MNA
MNA
ECA
Saudi Arabia
Saudi Arabia
Saudi Arabia
Saudi Arabia
Saudi Arabia
Saudi Arabia
Saudi Arabia
Bahrain
4,056
80,593
28,034
92,797
151,281
27,296
66,571
439,950
374,300
168,139
46,856
0
0
0
0
0
0
0
0 4,056
80,593
28,034
92,797
151,281
27,296
66,571
395,955
174,936
102,716
46,856
Full
Full MoE PSP in Education & BOT
MOF:PIF Project Finance Workshop
MOF:Islamic Devel Bank
0
0 Full
0 Full
MOF:Social Safety Net Issues
MOH:Emergency Medical Services
MOE:MIS & Teacher Trg
0 Full
0 Full
0 Full
BH Equestrian Ctr Privatization
(JERP) WTO Accession TA
Fisheries Sector Study
43,995
199,364
65,412
0
0
Partial
Partial
Partial
Partial
PREM
SDN
Kazakhstan
Kazakhstan
Kazakhstan
ECA 11,070
0 Advice on Budget (TA) PREM ECA
Gulf Coop Council P082073 GCC Labor Study TA PREM FY03 MNA 56,954 5,695 0 51,259 Partial
P081646
P081644
P081530
P080928
P080928
P080821
P080299
P080262
P080029
P078926
P078589
P078587
P078319
P078296
P078244
SAGIA:FDI Incentives & Econ Impact
SCC:Policy Inputs
TA
TA
TA
TA
TA
TA
EW
TA
TA
EW
TA
TA
TA
TA
TA
FPD
SDN
FY03
FY03
FY03
FY03
FY03
FY03
FY03
FY03
FY03
FY03
FY03
FY03
FY03
FY03
FY03
MNA
MNA
MNA
MNA
MNA
MNA
ECA
Saudi Arabia
Saudi Arabia
Saudi Arabia
Libya
na
na
na
na
na
na
0
na
na
Full
Full
MOW:Jubail Water Desalination PSP
Payment system development
Libya CB Payment Systems
MT RTA Support (Fiscal Policy)
PEN Policy Note
SDN 90,100
55,000
57,771
87,623
303,938
na
0 90,100
55,000
51,994
78,861
247,555
na
Full
PREM
PREM
PREM
HDN
SDN
0 0 Full
Libya 5,777
8,762
56,383
na
0 Partial
Partial
Partial
Full
Malta 0
Kazakhstan
Saudi Arabia
Oman
0
SERA:Org Structure & Cap Building
OM Finance & Corruption Seminar
CEM
MNA
MNA
ECA
na
0 PREM
PREM
FPD
32,901
526,331
55,290
77,113
56,901
31,691
18,217
3,290
157,375
5,529
7,711
0
29,610
368,956
49,761
69,402
56,901
28,522
18,217
Partial
Partial
Partial
Partial
Full
Kazakhstan
Kuwait
0
KW Housing Subsidies MNA
MNA
MNA
MNA
MNA
0
KW Land Policy PREM
PREM
SDN
Kuwait 0
MOF:Expenditure Management System Reform
BH Ports
Saudi Arabia
Bahrain
0
3,169
0
0 Partial
Full Saudi Seminars & Workshops PREM Saudi Arabia 0
15
Out of which: Agreement date/fiscal year
Partial / full cost recovery
Project #
Product line
Country name
Total cost ($) Service Network Region Bank’s
budget Trust funds/other
Client contribution
P078039 KW Investment Promo/SME Development TA FPD FY03 MNA Kuwait 373,360 37,336 0 336,024 Partial
P078038
P078036
P077802
P076178
KW Power Water Gas Reform
KW 5 Year Dev Plan
TA
TA
EW
TA
FPD
PREM
HDN
HDN
FY03
FY03
FY03
FY03
MNA
MNA
MNA
MNA
Kuwait
Kuwait
Bahrain
Kuwait
325,546
22,291
35,450
310,846
32,555
2,229
0
0
0
0
292,991
20,062
31,905
279,761
Partial
Partial
Partial
Partial
BH PROST/Pension Reform FY02
KW Health Sector Reform Support
3,545
31,085
P076158
P074420
P072167
P072165
P070586
P070380
KW PER Education TA
TA
TA
TA
TA
TA
PREM
SDN
SDN
FPD
FY03
FY03
FY03
FY03
FY03
FY03
MNA
MNA
MNA
MNA
MNA
MNA
Kuwait 284,797
63,812
28,480 0
0
0
0
0
0
256,317
63,812
Partial
Full
Full
Full
Full
Full
MOA:Jizan Agriculture PSP
SEAPA:Ports Reform
Saudi Arabia
Saudi Arabia
Saudi Arabia
Saudi Arabia
Saudi Arabia
0
0
0
0
0
115,409
2,600
115,409
2,600 SAGIA:Investors' Guide
MOP:Natl.Ec.Conf. (Vision Conference)
SCC Transition Strategy (Saudi)
PREM
FPD
1,332,994
181,381
1,332,994
181,381
P068994
P068379
P067708
P067702
P067698
KW Privatization of Key Assets (Offset)
KW Competition Policy (PSD bi-laws,strgy)
MOP:Rev Plan Planning Methodology
MOMRA:PSP for Water/Wastewater
MOCI:Dammam Indust City BOT/PSP
TA
TA
TA
TA
TA
FPD
FPD
FY03
FY03
FY03
FY03
FY03
MNA
MNA
MNA
MNA
MNA
Kuwait 117,369
175,227
10,997
11,737 0
0
0
0
0
105,632
157,704
10,997
Partial
Partial
Full Kuwait 17,523
PREM SDN
FPD
Saudi Arabia Saudi Arabia
Saudi Arabia
0 0
0 72,956 248,352
72,956 248,352
Full
Full
P020566
P082141
P071897
P084980
P087420
P088643
P090048
P069409
P076849
KW Public Awareness Campaign
BH Restructure PubExpMgt
Poverty Asessment
TA
TA
EW
EW
TE
FPD
PREM
PREM
HDN
#N/A
SDN
SDN
FPD
FY03
FY04
FY04
FY04
FY04
FY04
FY04
FY04
FY04
MNA
MNA
ECA
ECA
ECA
ECA
ECA
MNA
MNA
Kuwait
Bahrain
759,407
401,899
705,101
177,735
38,014
75,941
40,190
212,665
100,362
0
0 683,466
361,709
346,184
77,373
38,014
109,922
80,485
166,862
91,729
Partial
Partial
Partial
Partial
Partial
Partial
Partial
Partial
Partial
0
Kazakhstan
Kazakhstan
Kazakhstan
Kazakhstan
Kazakhstan
Kuwait
0
Educ Pol DIAL 0
#N/A 0
Transport Sector Strategy
Water Sector Study
EW
TA
TA
TA
549,703
114,105
185,402
101,921
49,781
0
39,000
0
0
0
KW - MEW: Workshops Privatization
KW Port of Bubyan Assessment
KW Telecomm Priv
18,540
10,192 SDN Kuwait
P077677
P078583
P078590
TA
TA
TA
SDN
SDN
FY04
FY04
FY04
MNA
MNA
MNA
Kuwait
Kuwait
Kuwait
81,890
353,266
167,779
8,189
35,327
16,778
0
0
0
73,701
317,939
151,001
Partial
Partial
Partial
KW Transport Regulation
KW Transparency & Accountability PREM
16
Out of which: Agreement date/fiscal year
Partial / full cost recovery
Project #
Product line
Country name
Total cost ($) Service Network Region Bank’s
budget Trust funds/other
Client contribution
KW Public Awareness Campaign FY04-05
KW Tax Reform P082288
P082954
P086392
P079799
P067496
P067675
P067684
P067710
P072161
P072166
P077110
P080431
P085747
P085835
P085837
P085838
P086005
TA
TA
TA
EW
TA
TA
TA
TA
TA
TA
TA
TA
TA
TA
TA
TA
TA
SDN
PREM
OPCS
FPD
FY04
FY04
FY04
FY04
FY04
FY04
FY04
FY04
FY04
FY04
FY04
FY04
FY04
FY04
FY04
FY04
FY04
MNA
MNA
MNA
MNA
MNA
MNA
MNA
MNA
MNA
MNA
MNA
MNA
MNA
MNA
MNA
MNA
MNA
Kuwait 107,521
111,538
4,948
10,752 0
0
0
0
0
0
0
0
0
0
0
0
0
0
0
0
0
96,768
100,385
4,453
Partial
Partial
Partial
Partial
Full
Kuwait 11,154 KW Housing Benefits Kuwait 495 OM CMA Debt Mkt Bond Development
MOC:Toll Roads Oman 117,155
3,155
11,715 105,439
3,155 SDN
FPD
Saudi Arabia
Saudi Arabia
Saudi Arabia
Saudi Arabia
Saudi Arabia
Saudi Arabia
Saudi Arabia
Saudi Arabia
Saudi Arabia
Saudi Arabia
Saudi Arabia
Saudi Arabia
0 MOF:SIDF SME Finance
MOF:PIF Support (North-South Railway)
MOF:E-Government
182,335
685,983
116,027
91,177
135,345
173,991
112,180
114,558
56,254
23,190
61,893
102,272
0 182,335
685,983
116,027
91,177
135,345
173,991
112,180
114,558
56,254
23,190
61,893
92,045
Full
SDN
SDN
HDN
FPD
0 Full
0 Full MOF:GPD Pension Reform
SPO:Postal Restruct Reform
MOF:Industrial Sect Compet (SIDF)
MOF:Sports Complex PSD
MOCIT:ICT Strategy
0 Full
0 Full
FPD 0 Full
FPD 0 Full
SDN
SDN
SDN
SDN
SDN
0 Full CITC Policy Inputs 0
0
Full CITC Transition Strategy
MOA:Grain Silos Privatization Full
0 Full United Arab Emirates UAE Dubai Aid City 10,227 Partial
United Arab Emirates P086391
P082844
UAE Environmental Assessment TA
TA
SDN FY04
FY05
MNA
MNA
13,339 1,334
0
0
0
12,005 Partial
Full Technical Assistance to SONATRACH
BH Public Awareness Campaign
BH BMA Debt Sec Mkt 1: Assessment
BH Equestr Ctr 2: Implementation Proposa
Evaluation of evaluation system
Water & Energy Consortium TA
#N/A
OPCS Algeria 102,400 102,400
P078325
P085767
TA PREM
FPD
FY05
FY05
MNA
MNA
Bahrain
Bahrain
355,145
95,036
0
0
0
0
355,145
95,036
Full
Full EW
P086895 P094343
TA FPD FY05 FY05
MNA LCR
Bahrain Chile
75,329 0 0
0 0
75,329 Full Full EW PREM 194,000 194,000
P090550
P091630
P092343
TA
KP
EW
SDN
#N/A
FPD
FY05
FY05
FY05
ECA
ECA
ECA
Kazakhstan
Kazakhstan
Kazakhstan
103,243
114,289
188,155
12,094
89,263
0
0
0
91,149
25,026
50,000
Partial
Partial
Partial Tech and Competitiveness 138,155
17
Out of which: Agreement date/fiscal year
Partial / full cost recovery
Project #
Product line
Country name
Total cost ($) Service Network Region Bank’s
budget Trust funds/other
Client contribution
P092483
P095545
Financial Sector Reform EW
TA
FPD FY05
FY05
ECA
ECA
Kazakhstan
Kazakhstan
122,401
41,519
49,995 9,900
0
50,005
30,000
Partial
Partial Oil Revenue Management TA/POL DLG
KW Offset Program Options
PREM 11,519
0 P091983 EW FPD FY05 MNA Kuwait 80,743 0 80,743 Full KW KISR Economic Conference
MX Pensions Fund Supervision (CONSAR)
OM MONE SME Growth/Investment Promotion
OM CMA Capacity Bldg FY04-05
QA Labor Market Strategy
P092013 P089188
TA TA
PREM FPD
FY05 FY05
MNA LCR
Kuwait Mexico
77,775 0 0
0 0
77,775 Full Full 160,000 160,000
P078298
P085770
P080030
P070968
P081532
P083171
P084421
P085840
P087884
P088207
P092927
P093095
P093097
P093831
P093833
P093834
P093880
P093881
P094859
P095131
P095412
EW
TA
EW
TA
EW
TA
TA
EW
TA
EW
TA
TA
TA
EW
TA
TA
TA
TA
TA
TA
TA
FPD
OPCS
HDN
HDN
SDN
SDN
SDN
SDN
SDN
HDN
SDN
HDN
HDN
SDN
SDN
SDN
PREM
SDN
SDN
HDN
PREM
FY05
FY05
FY05
FY05
FY05
FY05
FY05
FY05
FY05
FY05
FY05
FY05
FY05
FY05
FY05
FY05
FY05
FY05
FY05
FY05
FY05
MNA
MNA
MNA
MNA
MNA
MNA
MNA
MNA
MNA
MNA
MNA
MNA
MNA
MNA
MNA
MNA
MNA
MNA
MNA
MNA
MNA
Oman 173,755
40,418
396,161
252,356
546,391
5,602
0
0
0
0
0
0
0
0
0
0
0
0
0
0
0
0
0
0
0
0
0
0
0
0
0
0
0
0
0
0
0
0
0
0
0
0
0
0
0
0
0
0
173,755
40,418
396,161
252,356
546,391
5,602
Full
Full
Full
Full
Full
Full
Full
Full
Full
Full
Full
Full
Full
Full
Full
Full
Full
Full
Full
Full
Full
Oman
Qatar MOH:PSP King Fahd Medical Center PSP
MOWE:Restructuring Policy Saudi Arabia
Saudi Arabia
Saudi Arabia
Saudi Arabia
Saudi Arabia
Saudi Arabia
Saudi Arabia
Saudi Arabia
Saudi Arabia
Saudi Arabia
Saudi Arabia
Saudi Arabia
Saudi Arabia
Saudi Arabia
Saudi Arabia
Saudi Arabia
Saudi Arabia
Saudi Arabia
MOF:Riyadh Economic Forum
SRO:Advisor and East West Rail
MOWE:Electricity Conservation, Planning
MOF:KAIA Hajj Terminal BOT (Jeddah)
MOH:Health Finance & Insurance
MOCIT E-Government
325,836
197,146
114,075
299,069
85,104
146,109
191,334
89,602
81,814
69,459
735,563
31,862
295,383
53,759
50,378
325,836
197,146
114,075
299,069
85,104
146,109
191,334
89,602
81,814
69,459
735,563
31,862
295,383
53,759
50,378
SFDA Regulatory Framework
MOH:PSP in Health Services
MOCIT:ICT Policy
CITC Policy Inputs
CITC Transition Strategy
SA MOP:Economic Advisor
ECRA:Policy Inputs
MOF:PIF Transport Specialist (Khera)
Red Crescent: Emergency Medical Services
MOF:Procurement Workshops
United Arab Emirates
UAE RAK Investment Climate P088696 EW OPCS FY05 MNA 473,898 0 0 473,898 Full

18
Out of which: Agreement date/fiscal year
Partial / full cost recovery
Project #
Product line
Country name
Total cost ($) Service Network Region Bank’s
budget Trust funds/other
Client contribution
United Arab Emirates
UAE RAK Investment Conference P092842 na
TA na
OPCS na
FY05 FY06
MNA MNA
651,261 117,000
0 0
0 0
651,261 117,000
Full Full Gulf States technical cooperation program
Bahrain Stock Exchange Developmt Support
Gulf States technical cooperation program
Health Dialogue
Bahrain
P097901 na
TA na
FPD na
FY06 FY06
MNA MNA
Bahrain Egypt
117,381 286,000
0 0
0 0
117,381 286,000
Full Full
P079077
P085460
P088990
P090555
P092877
P094972
P096661
P096848
P096940
P097536
P097614
P097855
P099510
na
TA
EW
EW
TA
EW
EW
EW
TA
EW
TA
EW
TA
TA
na
HDN
SDN
PREM
SDN
SDN
OPCS
FPD
FY06
FY06
FY06
FY06
FY06
FY06
FY06
FY06
FY06
FY06
FY06
FY06
FY06
FY06
ECA
ECA
ECA
ECA
ECA
ECA
ECA
ECA
ECA
ECA
ECA
ECA
ECA
MNA
Kazakhstan
Kazakhstan
Kazakhstan
Kazakhstan
Kazakhstan
Kazakhstan
Kazakhstan
Kazakhstan
Kazakhstan
Kazakhstan
Kazakhstan
Kazakhstan
Kazakhstan
Kuwait
513,451
226,233
595,933
262,779
325,723
123,927
146,748
77,842
86,219
57,512
297,886
130,207
180,690
98,927
67,596
31,162
193,006
103,157
122,987
155,052
9,744
0 427,232
168,721
154,424
132,572
70,783
Partial
Partial
Partial
Partial
Partial
Partial
Partial
Partial
Partial
Partial
Partial
Partial
Partial
Full
Environment Strategy 0
PEIR/CPAR & FLWP (JERP)
Territorial Development
143,623
0
Agriculture Policy Assessment – JERP
ROSC/JERP – KZ
74,250
0
0
0
0
0
0
0
0
0
25,000
Financial Systems Henhancement (JERP)
MGMT & GOV OF STATE SHAREHOLD TA (JERP)
Tax Policy (JERP)
79,152
PREM
PREM
HDN
PREM
HDN
FPD
46,680
308,963
142,947
200,770
255,052
47,335
115,957
39,790 Education Policy Dialogue (JERP)
E-Govt 77,783
health Dialogue 100,000
37,591 PPP
Gulf States technical cooperation program na 1,070,000 0 1,070,000
KW MOE: KEIAP Project FY04-06 P078899
P087983
P095625
P100384
P100794
EW
TA
TA
TA
TA
HDN
PREM
FPD
FY06
FY06
FY06
FY06
FY06
MNA
MNA
MNA
MNA
MNA
Kuwait
Kuwait
Kuwait
Kuwait
Kuwait
544,523
137,315
204,172
97,227
43,053
0
0
0
0
0
0
0
0
0
0
544,523
137,315
204,172
97,227
43,053
Full
Full
Full
Full
Full
KW Public Private Partnership Law
KW KPC Oil & Gas Regulatory Support
KW KPC 5 Implem Privatizn TA Ph1 (FY06)
KW Cost of Environmental Degradation
Assessing Effectiveness of Fiscal Incentives Phase II
Gulf States technical cooperation program
MT Social Security (Pension) Reform
Gulf States technical cooperation program
FPD
SDN
P099470 na
ESW na
#N/A na
FY06 FY06
EAP Malaysia Malta
168,816 113,000
46,557 0
122,259 0
0 Partial Full MNA 113,000
P087543 na
EW na
HDN na
FY06 FY06
MNA MNA
Malta Oman
112,830 170,000
0 0
0 0
112,830 170,000
Full Full

19
Out of which: Agreement date/fiscal year
Partial / full cost recovery
Project #
Product line
Country name
Total cost ($) Service Network Region Bank’s
budget Trust funds/other
Client contribution
OM MOH: Health Systems & Service P082238 EW HDN FY06 MNA Oman 124,863 0 0 124,863 Full OM CMA Capacity Building FY05-06
Gulf States technical cooperation program
Payment system development
P094736 na
TA na
FPD na
FY06 FY06
MNA MNA
Oman Qatar
36,534 0 0
0 0
36,534 Full Full 231,000 231,000
P093999 TA PREM FY06 MNA Qatar 36,508 0 0 36,508 Full
QA Payment Systems CB P093999
P099598
P100143
TA
TA
TA
FPD
PREM
HDN
FY06
FY06
FY06
MNA
MNA
MNA
Qatar
Qatar
Qatar
36,508
13,643
0
0
0
0
0
0
36,508
13,643
Full
Full
Full
QA Statistics
QA Labor Mkt Dissem, Symposium
QA GCC PPP Workshop 122,865 122,865
P100472 na
TA na
PREM na
FY06 FY06
MNA MNA
Qatar 75,837 0 0
0 0
75,837 Full Full Gulf States technical cooperation program
MOF:PIF No-So Rail Advisory Support
MOP IT Strategy Support
Saudi Arabia 1,470,000 1,470,000
P088904
P093065
P093443
P094613
P095053
TA
TA
EW
EW
TA
SDN
SDN
FPD
FY06
FY06
FY06
FY06
FY06
MNA
MNA
MNA
MNA
MNA
Saudi Arabia
Saudi Arabia
Saudi Arabia
Saudi Arabia
Saudi Arabia
389,254
82,949
81,220
215,884
27,828
0
0
0
0
0
0
0
0
0
0
389,254
82,949
81,220
215,884
27,828
Full
Full
Full
Full
Full
MOF:SIDF Industrial Export Expansion
SAGIA:Investment Climate Assessment
MOF:Budget Expenditure & Control System FPD
PREM MOF:Free Trade Zone P095056
P097154
P097539
TA TA
TA
PREM HDN
SDN
FY06 FY06
FY06
MNA MNA
MNA
Saudi Arabia Saudi Arabia
Saudi Arabia
19,519 47,346
84,946
0 0
0
0 0
0
19,519 47,346
84,946
Full Full
Full
MOF: Gen. Pension Directorate Support MOCIT:Telecommunications and IT Strategy
CITC - Policy Advice (SA) P097544 P097548
TA TA
SDN SDN
FY06 FY06
MNA MNA
Saudi Arabia Saudi Arabia
75,511 59,397
0 0
0 0
75,511 59,397
Full Full CITC Regulatory Advice (SA)
MOCIT E-Government (SA) P097549 TA SDN FY06 MNA Saudi Arabia 79,562 0 0 79,562 Full SFDA: Phase 2 Regulatory Support
MOEP: Disaster Recovery Support
SA IPA: Public Sector Reform Assistance
RCS 2: Emergency Med Svcs Restructuring
GACA: Procurement Workshops
P098542 P099752
TA TA
HDN SDN
FY06 FY06
MNA MNA
Saudi Arabia Saudi Arabia
178,003 9,051
0 0
0 0
178,003 9,051
Full Full
P100215 TA PREM FY06 MNA Saudi Arabia 61,663 0 0 61,663 Full
P100570 P100920 na
TA TA TA
HDN SDN SDN
FY06 FY06 FY06
MNA MNA AFR
Saudi Arabia Saudi Arabia South Africa
47,978 82,958
0 0 0
0 0 0
47,978 82,958
Full Full Full TA facility Ministry of agriculture/land affairs
SONATRACH II
2,112,900 2,112,900
P104074
P085768
TA
TA
PREM
FPD
FY07
FY07
MNA
MNA
Algeria
Bahrain
406,022
44,519
0
0
0
0
406,022
44,519
Full
Full BH Insurance Supervision Cap Building

20
Out of which: Agreement date/fiscal year
Partial / full cost recovery
Project #
Product line
Country name
Total cost ($) Service Network Region Bank’s
budget Trust funds/other
Client contribution
BH Pension Fund Com Strategy 1 P097581
P103988
P108338
TA
TA
TA
PREM
PREM
SDN
FY07
FY07
FY07
MNA
MNA
LCR
Bahrain
Bahrain
Brazil
54,097
165,022
603,676
0
0
0
0
0
0
54,097
165,022
603,676
Full
Full
Full
BH MOF:Privatization Blueprint
Second Fee Based Contract for the Concession of Public Irrigation Perimeters
P106653
P101028
P101312
Management of Financial Assets
Millenium Challenge Georgia Fund(MCG)
PER
TA
TA
EW
PREM
SDN
FY07
FY07
FY07
LCR
ECA
LCR
Chile 304,468
800,000
310,000
0
0
0
0
0
0
0
304,468
800,000
310,000
Full
Full
Full
Georgia
Honduras PREM
P096998
P101627
P101928
P102001
Customs Development Project PE
TA
PE
TA
PREM
PREM
HDN
FY07
FY07
FY07
FY07
ECA
ECA
ECA
ECA
Kazakhstan
Kazakhstan
Kazakhstan
Kazakhstan
323,805
126,343
504,364
254,459
0
0
0
0
323,805
75,806
Partial
Partial
Partial
Partial
Brainstorming with KZ Govt (JERP)
Health Sector Technology Transfer and Institutional Reform
E-Govt Phase 2 (JERP)
50,537
0 504,364 168,000 PREM 86,459
P102271
P102360
P102815
P102829
Health Care Qual (JERP) TA
TA
TA
TA
HDN
PREM
PREM
FPD
FY07
FY07
FY07
FY07
ECA
ECA
ECA
ECA
Kazakhstan
Kazakhstan
Kazakhstan
Kazakhstan
60,895
297,797
130,000
84,829
24,358
117,797
39,983
33,984
0
0
0
0
36,537
180,000
90,017
50,845
Partial
Partial
Partial
Partial
Public Investment & Auditing (JERP)
JERP Tax Administration
Private Partnership TA 1 (JERP) FY2007
P104078
P104082
P104202
P104563
P104941
P107949
Kazakhstan Customs Peer-learning Visits
JERP Enhancing Competitiveness
TA
TA
TA
EW
TA
EW
PREM
PREM
PREM
HDN
SDN
FY07
FY07
FY07
FY07
FY07
FY07
ECA
ECA
ECA
ECA
ECA
ECA
Kazakhstan
Kazakhstan
Kazakhstan
Kazakhstan
Kazakhstan
Kazakhstan
22,168
272,826
400,000
160,785
240,562
150,000
7,168
122,826
160,000
88,785
67,000
51,000
0 15,000
150,000
240,000
72,000
33,000
99,000
Partial
Partial
Partial
Partial
Partial
Partial
0
(JERP) WTO Accession TA 0
0 Educ and Innov Dev (JERP)
Kazakhstan EITI – JERP 140,562
0 Utilities Tarrif Reform 2 (JERP) SDN
KW Offset Implementation (NOC) P101281
P102147
P102151
P102153
P103949
P096611
P107049
TA
TA
FPD
FPD
FY07
FY07
FY07
FY07
FY07
FY07
FY07
MNA
MNA
MNA
MNA
MNA
EAP
Kuwait
Kuwait
Kuwait
Kuwait
Kuwait
Malaysia
Malaysia
138,183
135,155
25,881
111,991
52,052
247,715
68,282
0 0 138,183
135,155
25,881
111,991
52,052
0
Full
Full KW KPC 2 Reimb Priv TA Progrm (Phase 1)
KW Insurance Sector Reform FY07
KW KPC 6 Communication Strategy Support
KW KPC 3 Corp Governce Markt Absorptn
Developing a World Class Higher Education System
Assessing Effectiveness of Fiscal Incentives Phase III
0
0
0
0 EW
TA
FPD Full
FPD 0 0 Full
TA FPD 0 0 Full
ESW
TA
HDN
PREM
160,891
37,637
86,824
30,645
Partial
Partial EAP 0
21
Out of which: Agreement date/fiscal year
Partial / full cost recovery
Project #
Product line
Country name
Total cost ($) Service Network Region Bank’s
budget Trust funds/other
Client contribution
P106210 Guerrero State DevPlan
OM-PER Education
TA PREM FY07 LCR Mexico 200,000 100,000 0 100,000 Partial
P070661
P078030
EW
TA
HDN
SDN
FY07
FY07
MNA
MNA
Oman
Qatar
65,049 0
0
0
0
65,049 Full
Full QA Public Transport RTA 159,270 159,270 Qatar Knowledge-Based Economy Support
FFS TRANSPORT W. HSD/ORLOVSKI TUNNEL
MOMRA:Water Tariff,Pricing
P106509 P109067
TA TA
HDN SDN
FY07 FY07
MNA ECA
Qatar 209,945 346,750
0 0
0 0
209,945 346,750
Full Full Russian Fed
P067703
P067712
P067715
P070907
P085841
P093555
P094682
P101118
P101119
P101120
P101121
TA
TA
TA
TA
EW
TA
TA
TA
TA
TA
TA
SDN
SDN
SDN
FPD
FY07
FY07
FY07
FY07
FY07
FY07
FY07
FY07
FY07
FY07
FY07
MNA
MNA
MNA
MNA
MNA
MNA
MNA
MNA
MNA
MNA
MNA
Saudi Arabia
Saudi Arabia
Saudi Arabia
Saudi Arabia
Saudi Arabia
Saudi Arabia
Saudi Arabia
Saudi Arabia
Saudi Arabia
Saudi Arabia
Saudi Arabia
17,867
228
0
0
0
0
0
0
0
0
0
0
0
0
0
0
0
0
0
0
0
0
0
0
17,867
228
Full
Full
Full
Full
Full
Full
Full
Full
Full
Full
Full
MOC:Maritime Strategy
MOPMR:Phosphate and Bauxite Reviews
SAGIA:Investment Promotion, GCI Strength
MOWE:Water Sector Strategy & Action Plan
MOF:Housing Finance
16,604
395,774
1,153,051
164,062
109,971
61,126
143,840
64,636
39,756
16,604
395,774
1,153,051
164,062
109,971
61,126
143,840
64,636
39,756
SDN
FPD
IPA GDLN Implementation PREM
SDN
SDN
SDN
SDN
Muni: Medina E-Govt & Digital Economy
Muni: Medina Vision, Strategic Plan Supt
Muni: Medina IT & MIS (Mgt Info Systems)
Muni: Medina Observatory & DSS
SDFA Phase 3 Support P101466 P102411
P102412
TA TA
TA
HDN SDN
FY07 FY07
FY07
MNA MNA
MNA
Saudi Arabia Saudi Arabia
Saudi Arabia
84,163 64,885
na
0 0
0 0
84,163 64,885
na
Full Full
Full
SA GACA: Civil Aviation General Support IPA: Capactity Building & Training Supt
SA IPA: Symposium Support PREM na na
P102413
P102512
TA
TA
PREM
SDN
FY07
FY07
MNA
MNA
Saudi Arabia
Saudi Arabia
21,666
56,715
0
0
0
0
21,666
56,715
Full
Full MOCIT: ICT Strategy
MOCIT: E-Government P102514 P103862
TA SDN SDN
FY07 FY07
MNA MNA
Saudi Arabia Saudi Arabia
62,686 0 0
0 0
62,686 Full Full MOWE Draft Energy Conservation Strategy
MOWE:Water Strategy Implementation Plan
Muni: Jeddah Municipal Support
Muni: Riyadh Munipality e-Govt Support
SASO:Saudi Standards Support
EW 158,641 158,641
P104003
P104106
TA
TA
SDN
SDN
FY07
FY07
MNA
MNA
Saudi Arabia
Saudi Arabia
161,185
62,808
0
0
0
0
161,185
62,808
Full
Full
P104107 P104516
TA TA
SDN FY07 FY07
MNA MNA
Saudi Arabia Saudi Arabia
36,101 22,053
0 0
0 0
36,101 22,053
Full Full PREM
SFDA Medical Device Regulatory Support P105904 TA HDN FY07 MNA Saudi Arabia 73,364 0 0 73,364 Full

22
Out of which: Agreement date/fiscal year
Partial / full cost recovery
Project #
Product line
Country name
Total cost ($) Service Network Region Bank’s
budget Trust funds/other
Client contribution
CDP-Infrastructure (Sub-component: Radio Sprectrum Program - Phase I)
Payments System Fee-Based Service P073573 P106189
TA TA
SDN FPD
FY07 FY07
EAP LCR
Thailand Uruguay
88,132 26,532 61,600 0
0 Partial Full 162,622 0
0
162,622
P097546
P099285
Water Sector & Sanitation – Phase 1 TA
TA
SDN
SDN
FY08
FY08
MNA
MNA
Algeria
Algeria
690,000
532,900
0
0
690,000
532,900
Full
Full CNED (Caisse nationale d'equipement pour le developpement) 0
Credit registry P107243 P108793
TA TA
FPD FPD
FY08 FY08
MNA LCR
Algeria 213,500 19,500
0 0
0 0
213,500 19,500
Full Full Fee Based Services BISX Bahamas
Brunei Darussalam P108275 Developing the Framework for Private Equity and Investment Funds TA FPD FY08 EAP 323,390 0 0 323,390 Full
P106231
P106842
P107052
P107052
P107663
P107526
P106586
P090494
P102177
P102198
Evaluation of Mgmt. Enhanc Prog
Strategic diagnosis of national railway company
CL (FFS) Gov. of Nat. Innovation System
Governance of Chile's National Innovation System
Chile Credit Reporting System
NRCU Restructuring
TA
TA
TA
TA
TA
TA
TA
TA
PE
PREM
SDN
FPD
FPD
FPD
FPD
FPD
FPD
SDN
HDN
FY08
FY08
FY08
FY08
FY08
FY08
FY08
FY08
FY08
FY08
LCR
LCR
LCR
LCR
LCR
EAP
ECA
ECA
ECA
ECA
Chile
Chile
200,000
200,000
300,000
300,000
97,500
0 0
0
0
0
0
0
0
0
0
0
200,000
200,000
300,000
300,000
97,500
Partial
Full 0
Chile
0
Full
Chile Full
Chile 0 Full
China 151,000
178,000
125,000
400,000
140,087
0 151,000
178,000
83,000
Full
Social Security Fund Investment Policy
Private Partnership TA 2 (JERP) FY2008
Education
Cyprus
Kazakhstan
Kazakhstan
Kazakhstan
0 Full
42,000
136,000
56,035
Partial
Partial
Partial
264,000
84,052 Pension Study (JERP) EW
P102772 P105979
P106391 P107474
Territorial Development PE TA
TA TA
SDN PREM
HDN
FY08 FY08
FY08 FY08
ECA ECA
ECA ECA
Kazakhstan Kazakhstan
Kazakhstan Kazakhstan
300,000 100,000
1,100,000 73,000
102,000 15,000
0
0 0
0 0
198,000 85,000
Partial Partial
Partial Partial
Policy Advice on PAR & Economic Policy Bota Foundation 1,100,000
48,000 Brainstorming KZ Govt - JERP (FY08) PREM 25,000
P107737
P107930
P108530
P108783
P108810
P108820
Public Finance Review EW
TA
TA
TA
TA
TA
PREM
OPCS
PREM
FPD
FY08
FY08
FY08
FY08
FY08
FY08
ECA
ECA
ECA
ECA
ECA
ECA
Kazakhstan
Kazakhstan
Kazakhstan
Kazakhstan
Kazakhstan
Kazakhstan
600,000
150,000
110,000
100,000
100,000
100,000
204,000
51,000
37,000
34,000
34,000
34,000
0
0
0
0
0
0
396,000
99,000
73,000
66,000
66,000
66,000
Partial
Partial
Partial
Partial
Partial
Partial
Implementation of IFPS (JERP)
Development of Statistical Master Plan
TECHNOPARKS (JERP)
Pension System Support (JERP)
Social Protection (JERP)
HDN
HDN

23
Out of which: Agreement date/fiscal year
Partial / full cost recovery
Project #
Product line
Country name
Total cost ($) Service Network Region Bank’s
budget Trust funds/other
Client contribution
P108938
P109614
Supply Chain Development (JERP) TA
TA
FPD
FPD
FY08
FY08
ECA
ECA
Kazakhstan
Kazakhstan
100,000
100,000
34,000 0
0
66,000
66,000
Partial
Partial Markets with Imperfect Competition 34,000
0 P108006 FFS - Green Investment Scheme TA SDN FY08 ECA Latvia 240,000 0 240,000 Full
Business legal environment P108638
P105787
P108488
TA FPD
PREM
FPD
FY08
FY08
FY08
MNA
EAP
EAP
Libya 150,000
188,813
200,000
0
70,000
50,000
0
118,813
150,000
150,000 Full Knowledge Deepening and Industrial Change in Malaysia
Investment Climate & Firm Competitiveness 2
Improving Services Sector Measurement & Productivity
CONEVAL Monitoring and Evaluation
Adv. Serv. for Ref. of SHCP
ESW
ESW
Malaysia
Malaysia
0
0
Partial
Partial
P108571 P101567
ESW TA
PREM PREM
FY08 FY08
EAP LCR
Malaysia Mexico
120,000 150,000
20,000 0
100,000 0
0 Partial Full 150,000
P106230
P106419
TA
TA
PREM
PREM
FY08
FY08
LCR
LCR
Mexico
Mexico
650,100
184,528
0
0
0
0
650,100
184,528
Full
Full Results Based Management and Evaluation framework in SEDESOL
P109739
P110474
SEDESOL: Increasing the Productivity of the Poor
Mexico Massive Urban Transport Federal Program
TA
TA
PREM
SDN
FY08
FY08
LCR
LCR
Mexico
Mexico
55,358 0
0
0
0
55,358 Full
Full 175,000 175,000 not yet in SAP not yet in SAP not yet in SAP
Na
Na
Na
TA
TA
TA
na
na
na
FY08
FY08
FY08
ECA
ECA
ECA
Russian Fed
Russian Fed
Russian Fed
679,060
496,900
460,200
0
0
0
0
0
0
679,060
496,900
460,200
Full
Full
Full
P108590
P108703
P108985
P109593
P109594
P110048
P110129
P110627
FFS Education Khanty-Mansisk AO
FFS Transport Nadzemny ExpressPPP
FFS Higher Education Kazan
TA
TA
TA
TA
TA
TA
TA
TA
HDN
SDN
FY08
FY08
FY08
FY08
FY08
FY08
FY08
FY08
ECA
ECA
ECA
ECA
ECA
ECA
ECA
ECA
Russian Fed
Russian Fed
Russian Fed
Russian Fed
Russian Fed
Russian Fed
Russian Fed
Russian Fed
144,705
440,100
122,000
521,542
216,300
190,000
506,766
148,000
0
0
0
0
0
0
0
0
0
0
0
0
0
0
0
0
144,705
440,100
122,000
521,542
216,300
190,000
506,766
148,000
Full
Full
Full
Full
Full
Full
Full
Full
HDN SDN FFS Transport Pulkovo Airport ExpansionPPP
FFS Urban PPP Unit in St Petersburg
FBS: AS to Khanti-Mansiysk Okrug-Yugra
FFS HOUSING RTA Niznhevartovsc HCS
FBS: Tatarstan SMLS
SDN
PREM SDN
PREM
P110746
P103382
P109573
Na TA
TA
TA
na FY08
FY08
FY08
ECA
AFR
EAP
Russian Fed
South Africa
Thailand
125,328
65,000
0
0
0
0
125,328
65,000
0
Full
Full 3S-Rapid Response for MICs (FY08)
CDP-Infrastructure
OPCS
SDN 384,250 30,000 354,250 Partial United Kingdom P106516 UK – ROSC EW OPCS FY08 N/A 140,000 0 0 140,000 Full
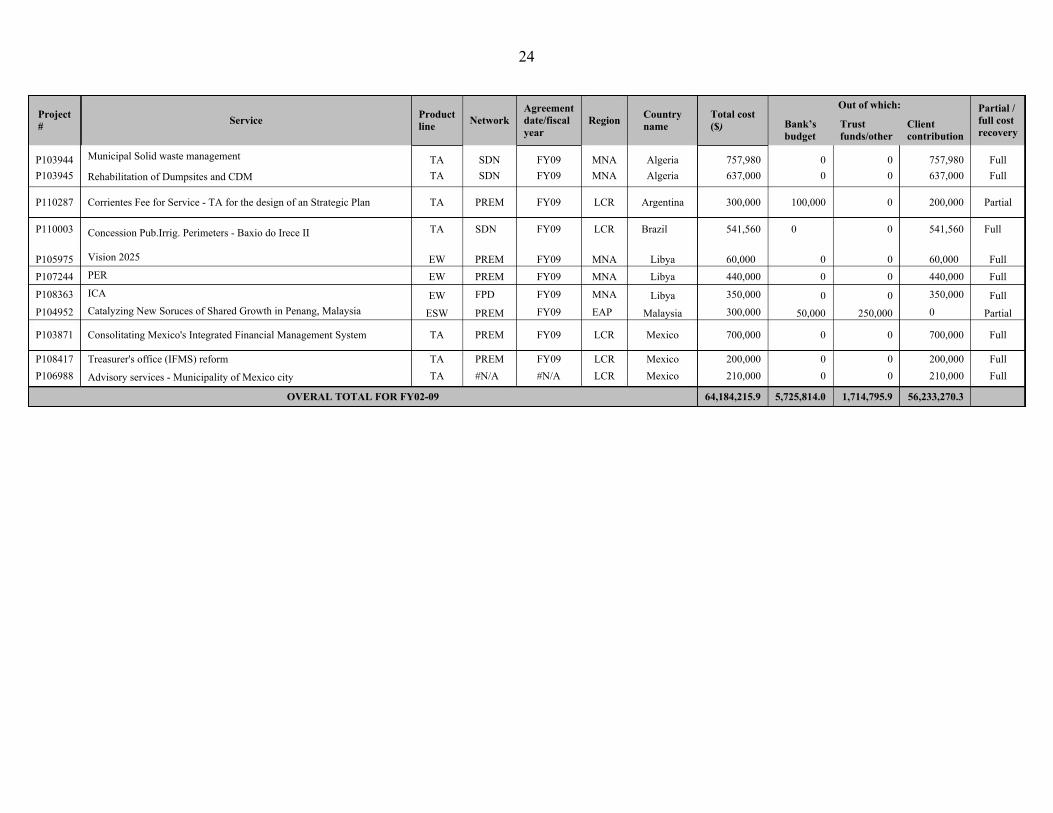
24
Out of which: Agreement date/fiscal year
Partial / full cost recovery
Project #
Product line
Country name
Total cost ($) Service Network Region Bank’s
budget Trust funds/other
Client contribution
Municipal Solid waste management P103944 P103945
TA TA
SDN SDN
FY09 FY09
MNA MNA
Algeria Algeria
757,980 637,000
0 0
0 0
757,980 637,000
Full Full Rehabilitation of Dumpsites and CDM
P110287
P110003
Corrientes Fee for Service - TA for the design of an Strategic Plan TA
TA
PREM
SDN
FY09
FY09
LCR
LCR
Argentina
Brazil
300,000
541,560
100,000
0
0
0
200,000
541,560
Partial
Full Concession Pub.Irrig. Perimeters - Baxio do Irece II
Vision 2025 P105975 P107244
P108363
P104952
EW EW
PREM PREM
FPD
FY09 FY09
FY09
FY09
MNA MNA
MNA
EAP
Libya Libya
60,000 440,000
350,000
300,000
0 0
0 0
60,000 440,000
350,000
0
Full Full PER
ICA EW Libya 0 0 Full Catalyzing New Soruces of Shared Growth in Penang, Malaysia ESW PREM Malaysia 50,000 250,000 Partial
P103871 Consolitating Mexico's Integrated Financial Management System TA PREM FY09 LCR Mexico 700,000 0 0 700,000 Full
P108417 P106988
Treasurer's office (IFMS) reform TA TA
PREM #N/A
FY09 #N/A
LCR LCR
Mexico Mexico
200,000 210,000
0 0
0 0
200,000 210,000
Full Full
Advisory services - Municipality of Mexico city
OVERAL TOTAL FOR FY02-09 64,184,215.9 5,725,814.0 1,714,795.9 56,233,270.3

25
ANNEX BSUMMARY STATISTICS: FEE-BASED SERVICES PROVIDED BY REGIONS
Total cost by FY (US$ Million)
20.0
18.0
16.0
14.0
12.0
10.0
8.0
6.0
4.0
2.00.3
0.0FY00 FY01 FY02 FY03 FY04 FY05 FY06 FY07 FY08-9
Number of agreements by FY
70
60
50
40
30
20
10
0
52
84
FY00 FY01 FY02 FY03 FY04 FY05 FY06 FY07 FY08-9

26
Distribution of costs by region FY00-09

27

28
FBS Country programs by importanceFY00-09
Country Total (US$)
12
Saudi Arabia 16,516,473KazakhstanKuwait
13,670,6036,516,8204,397,6513,339,8022,684,9862,536,8452,177,9001,595,9681,293,6261,281,7381,240,7701,145,2361,112,771813,260800,000472,382323,390313,453310,000300,000286,000240,000178,000162,622151,000140,000106,46556,954
34 Russian Federation
Algeria56 Mexico7 Bahrain8 South Africa
Chile9101112131415161718192021222324252627282930
MalaysiaQatarUnited Arab EmiratesBrazilLibyaOmanGeorgiaThailandBrunei DarussalamMaltaHondurasArgentinaEgyptLatviaCyprusUruguayChinaUkraineMauritiusGulf Coop CouncilBahamas 19,500

29
ANNEX CEXAMPLES OF FEE-BASED SERVICES PROVIDED OR PLANNED
Chile: Pioneering Fee-based Services
In 1996, Chile’s government signed an agreement with the Bank for cost-shared technicaladvice. The rationale was twofold: to enable Chile to continue accessing global advice despitereduced levels of Bank activity, and to promote a coordinated focus by government agencies onspecific issues. The Chileans valued the objectivity of Bank advice, and the Bank benefited fromcontinued intellectual involvement in a country that was tackling frontier development issues.During 1996-98, the Bank was reimbursed about $220,000 for staff time, consultants, and travelfor mostly short-term advice in five areas (airport concessions, toll roads, higher education,regulatory institutions, and hydrocarbons). The government later used fee-based services ineducation and health, and for the evaluation of its contingent liabilities under variousinfrastructure concessions. More recently, the 2002 CAS states that, in addition to formaleconomic and sector work, the Bank and Chile will continue to pursue opportunities for fee-based advice and to collaborate with staff exchanges.1
Czech Republic: Cost-sharing while Graduating
The Bank’s relationship with the Czech Republic during 1998-2005 consisted solely ofknowledge sharing─specifically, collaborative work in developing “more advanced tools ofinternational financial architecture … not only to benefit the Czech Republic but also to assist2other countries.” The Bank’s budgetary costs were modest, thanks partly to cost-sharing withthe government, which, considering the public goods dimension of the work program wasconsidered especially significant. In general, the Bank provided staff and associated costs whilethe government provided document translation and product dissemination. Occasionally, thegovernment paid for Bank staff travel and subsistence. It also shared the costs of internationalconferences─in one case, about two-thirds of the total. Throughout this collaboration, it wasunderstood that the Bank would use primarily its own staff rather than consultants to ensure thatlessons learned and knowledge were internalized and that the potential for knowledge sharingwith other countries was maximized.
Fee Based Services in the Gulf Cooperation Council StatesA Pioneering Program and a New Business Model
The Bank Group’s engagement in the GCC has constituted the first instance in which Fee-Basedservices were used to structure the relation between the Bank and its clients. As such it has beena model since the late 1990s. Today the FBS program in the GCC is –again- the testing groundof a new model for doing business with LICs and HICs and a new development paradigm inwhich this engagement can be leveraged to the benefit of low income and fragile states. The FBS
12
Chile─Country Assistance Strategy, January 23, 2002 (pp. 26, 32-33).Czech Republic─Evaluation of Partnership with World Bank, 1990-2005, February, 2006.

30
program – coordinated by the MNA Department of Strategic Cooperation- has moved away froma series of ad hoc responses to client requests and evolved into a full fledged program of strategicadvisory services. This is manifested not only by the opening of new offices (together with IFC)in the Gulf States or by the adoption of a programmatic approach to delivering advice but also bythe re-alignment of teams, that will be better able to deliver the needed advice, as well as bypartnerships with development funds that finance development projects in the region’s lowincome and fragile states.
Kazakhstan─A New Approach to Partnership
One key driver of the Bank’s current engagement in Kazakhstan is the Joint Economic ResearchProgram (JERP)─an innovative mechanism for planning and cofinancing analytic and advisorywork initiated in FY03─whose main purpose is to enhance the impact of Bank analysis and3policy advice. The JERP is a mutually agreed three-year work program, under which thegovernment’s cofinancing share is programmed to increase from 30 percent to 50 percent. Sincethe government approves and cofinances each task, priority and client ownership are not at issue;this feature strengthens potential impact. The FY05 JERP included a programmatic publicexpenditure and institutional review, technical advice on WTO accession, support for educationand health sector reforms, and work on poverty, water and energy, and the environment. Thegovernment requested that the JERP be extended for three years beyond FY05 and increased insize. In FY06, its total cost was $1.8 million, with Kazakhstan financing $950,000 or 50 percent.
Mauritius: Joint Research
The government of Mauritius has signaled its strong interest in the Bank’s analytic and advisoryservices and policy advice on key strategic issues. The Bank and the European Union (EU)intend to set up a mechanism for joint research through a fund to which the government maycontribute its own resources. This fund will finance analytic and technical assistance workinvolving local research institutions and universities─an approach that will permit greateralignment with government needs and a better transfer of knowledge.
Malaysia: World Bank Partnership on Competitiveness
The Partnership on Competitiveness emerged as a response to the Malaysian government’srequest, in October 2002, for advice on identifying and overcoming the microlevel rigiditiesholding back growth and the country’s relative competitiveness with respect to emerging rivalsin the region. Activities of the partnership evolve around demand-driven, high-quality, analyticand advisory services, knowledge-sharing, and capacity enhancement. Recent deliverables haveincluded studies on firm competitiveness and growth, world-class higher education, andknowledge deepening and industrial change; a programmatic review of the effectiveness of fiscalincentives; and a high-level knowledge-sharing seminar attended by around 20 Ministers ofFinance and Planning from Africa and Asia, in which participants learned from Malaysia’sexperience in such areas as oil revenues management; planning, monitoring, and evaluation;public-private partnership in infrastructure; management of government-linked companies; andincreasing value-added in agriculture. The partnership is financed through a combination of
3 Kazakhstan─Country Partnership Strategy, August 10, 2004 (pp. 8, 17-18).

31
Bank budget resources, which pay for Bank staff time and travel, and “reimbursable TA” (underwhich the Bank directly pays the consultants involved with the studies and is then reimbursed bythe government). Autonomous and semiautonomous agencies have more flexibility to coversome costs, including travel and salaries, for World Bank staff. In FY08, Malaysia contributedmore than 70% of the cost of studies.
Mexico: Fee-based Services to Strengthen Institutions
With a per capita income of about $5,900, Mexico is at an advanced stage of its development.Taking that fact into consideration, the World Bank Group will seek a sustained programmaticanalytical engagement in selected areas where the it can have the greatest impact, such aspoverty, competitiveness, education quality, decentralization of public finances, and sustainablewater management. Mexico also faces new institutional changes for effective development.SHCP contracted with the Bank on a fee-for-service basis to support the modernization ofprocesses within the secretariat.4
Poland: Specialized Work
Although Poland’s recent development could soon lead to its graduation from World Bankborrower status, there is still an agenda of important reforms in areas where the Bank has beenand continues to be the key technical partner. Consequently, there remains an opportunity forcontinued, selective Bank involvement, particularly in the form of technical support, either free-standing or embedded in lending and financial partnerships. The Bank expects to deliveranalytic and advisory services using its own resources, with an increasing emphasis oninternational/regional comparative analysis but with clear country-specific elements andrecommendations. More specialized work or demands that exceed the available budget could beprovided under reimbursable arrangements.5
Russia: Rationale for Future Cooperation
The Bank Group’s relations with Russia are evolving toward new modalities of cooperation. Inline with the Bank’s agenda for strengthening engagement in MICs, future analytic and advisorywork is expected to move increasingly toward reimbursable fee-for-service arrangements. Partlyon the basis of recent experience with two large infrastructure investment-related assignments inSt. Petersburg, the Russia Country Partnership Strategy (CPS) envisions a more streamlinedapproach that now includes framework agreements with central and/or regional governments thatcover fee-based analytic and advisory services and knowledge transfer to help strengthen localcapacity.6 In addition to public investment projects, priorities for fee-based services in theregions reportedly include diagnostics of regional growth and economic competitiveness,investment climate monitoring and benchmarking, reforms in the social sector, and assetmanagement services. In addition, given the Russians’ apparent interest in taking advantage ofBank skills in project design and management, a new instrument is being jointly considered thatwould provide such skills for government-financed programs and projects on a fee-for-service
45
6
Mexico─Country Partnership Strategy, March 18, 2004 (pp. 32-35, 41-42).Poland─Country Partnership Strategy, March 9, 2005 (pp. 13-14).Russia─Country Partnership Strategy FY07-09, November 20, 2006 (pp. 16-20).
32
basis─subject to compliance with the Bank’s fiduciary requirements and avoidance of possiblereputational risks.
Slovak Republic: Acceding to the EU
Providing fee-based benefits not only the country but also the Bank, because of lessons learnedthat may be applicable in less advanced countries. Nevertheless, in the context of an evolvingpartnership, the Bank looks to the Slovak government to take on an increasing share of the costsof analytic and advisory services through cost sharing and borrowing for technical assistance ifthe level of activities grows beyond Bank budget constraints. Costs will also be reduced bygrouping appropriate country-level studies into regional studies, similar to studies in FY05-07 onpublic expenditure/fiscal reforms and labor markets.7
South Africa: Building a Knowledge Partnership
With no major lending program to support, the Bank’s role in South Africa will remainconcentrated on efforts to provide knowledge, build capacity, and leverage limited resources by
8collaborating actively with other donors. The Bank will continue to augment its nonlendingresources through cofinancing from the concessional funds of other donors and throughcontinued cost sharing with the government. This cost sharing can take the form of SouthAfrican support for local costs for activities such as conferences or technical assistance efforts inwhich the Bank covers the cost of its own staff, while South Africa contributes to cover some ofthe costs of non-Bank international expertise. This type of cost-sharing is attractive because itextends Bank resources, enhances ownership, and helps address possible equity concerns aboutSouth Africa’s use of scarce Bank resources.
Thailand: Partnership with the World Bank Group
The relationship between Thailand and the Bank Group has progressed from primarily aborrower-lender relationship toward a knowledge-sharing development partnership in which theBank facilitates knowledge sharing and provides policy advice on medium-term structural issuescritical to the success of the national development agenda. Building on this evolving approach,the Thailand Country Partnership Strategy (CPS) focused on diagnostic and monitoring work anda limited amount of implementation support for selected critical issues in Thailand’s overallnational development agenda. This implementation support is delivered largely through CountryDevelopment Partnerships (CDPs), innovative and primarily knowledge-based programs that areled by the Government, with the Bank and other development partners supporting the design andimplementation of the overall reform program through technical support, capacity building andspecific project interventions. CDPs have covered such sectors and issues as governance/publicsector reform, financial sector reform, poverty analysis and monitoring, social protection,education, health, infrastructure, and the environment. Diagnostic work has included majordeliverables on investment climate and productivity and the knowledge economy. Bank Groupengagement in Thailand’s CDPs offers four important advantages: (a) guaranteed focus ongovernment-determined strategic areas; (b) high impact resulting from clearly defined and
78
Slovak Republic─Country Partnership Strategy, May 6, 2004 (p. 10)South Africa─Country Assistance Strategy, May 1999 (p. 30).

33
targeted support; (c) improved coordination with other donors and stakeholders; and (d) ability torespond quickly if the government decides to borrow. Cost sharing is integral to the BankGroup’s partnership with Thailand. During FY03-05, the government financed an estimated25% of the studies and CDPs, and more recently this percentage has increased significantlyfollowing reductions in the Bank’s administrative budget for Thailand and in the availability oftrust funds. Some of this work is now managed on a “reimbursable TA” basis.

34
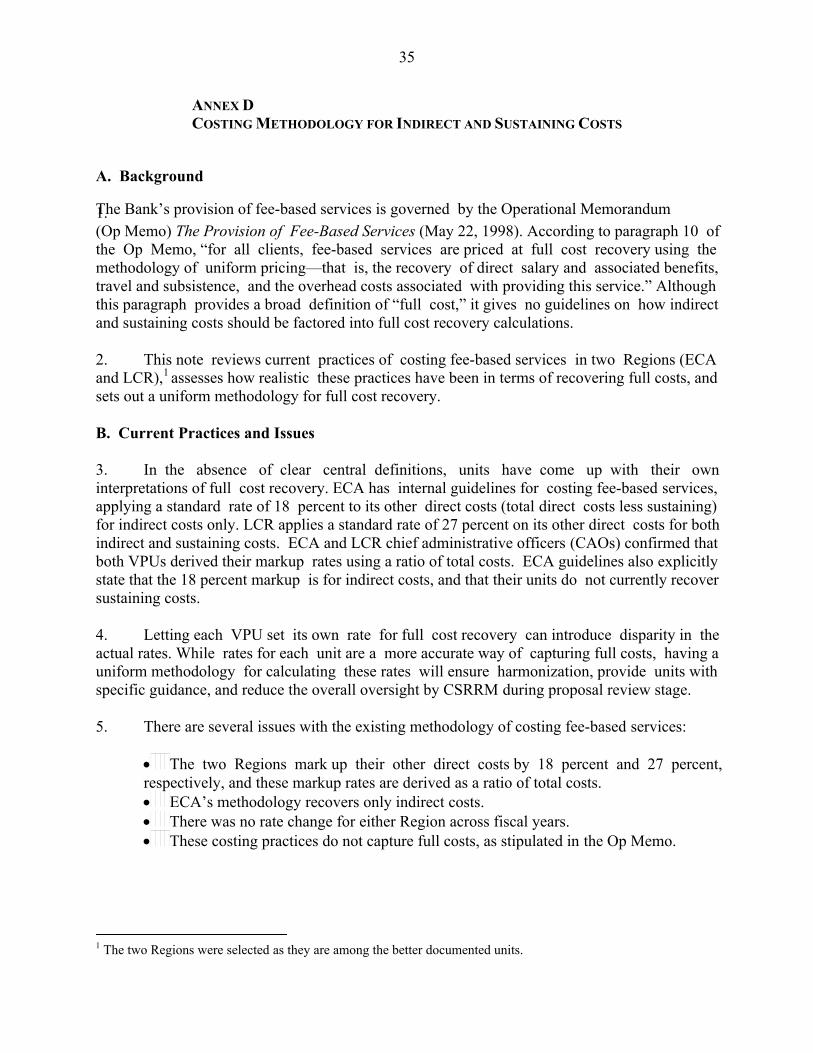
35
ANNEX DCOSTING METHODOLOGY FOR INDIRECT AND SUSTAINING COSTS
A. Background
The Bank’s provision of fee-based services is governed by the Operational Memorandum1.(Op Memo) The Provision of Fee-Based Services (May 22, 1998). According to paragraph 10 ofthe Op Memo, “for all clients, fee-based services are priced at full cost recovery using themethodology of uniform pricing—that is, the recovery of direct salary and associated benefits,travel and subsistence, and the overhead costs associated with providing this service.” Althoughthis paragraph provides a broad definition of “full cost,” it gives no guidelines on how indirectand sustaining costs should be factored into full cost recovery calculations.
2.and LCR), assesses how realistic these practices have been in terms of recovering full costs, andsets out a uniform methodology for full cost recovery.
This note reviews current practices of costing fee-based services in two Regions (ECA1
B. Current Practices and Issues
3. In the absence of clear central definitions, units have come up with their owninterpretations of full cost recovery. ECA has internal guidelines for costing fee-based services,applying a standard rate of 18 percent to its other direct costs (total direct costs less sustaining)for indirect costs only. LCR applies a standard rate of 27 percent on its other direct costs for bothindirect and sustaining costs. ECA and LCR chief administrative officers (CAOs) confirmed thatboth VPUs derived their markup rates using a ratio of total costs. ECA guidelines also explicitlystate that the 18 percent markup is for indirect costs, and that their units do not currently recoversustaining costs.
4. Letting each VPU set its own rate for full cost recovery can introduce disparity in theactual rates. While rates for each unit are a more accurate way of capturing full costs, having auniform methodology for calculating these rates will ensure harmonization, provide units withspecific guidance, and reduce the overall oversight by CSRRM during proposal review stage.
5. There are several issues with the existing methodology of costing fee-based services:
• The two Regions mark up their other direct costs by 18 percent and 27 percent,respectively, and these markup rates are derived as a ratio of total costs.• ECA’s methodology recovers only indirect costs.• There was no rate change for either Region across fiscal years.• These costing practices do not capture full costs, as stipulated in the Op Memo.
1 The two Regions were selected as they are among the better documented units.

36
C. Methodology
Developing a standard methodology for full cost recovery must take into account several6.considerations:
• Should each unit set its own rate or should there be a uniform rate for all units?Both ECA and LCR expressed concern about having one rate applicable to all units.As they explained, different units have different geographical locations, clienteles,business needs, and other factors. For example, travel costs in AFR vary from travelcosts in LCR, thus affecting the total actual costs and the markup ratios derived usingthem.
• Should units consider both indirect and sustaining costs?In accordance with the Op Memo, fee-based services should be costed at full cost.The full cost is defined as direct costs, indirect costs, and sustaining costs. BothRegions differentiated between pricing and costing, and agreed that proposals shouldbe costed on a full-cost basis.
• Should units mark up the total cost or certain line items?Units should apply the markup on direct costs only.
• Should the rate change from year to year?As shown in the Table 2, there is a substantial fluctuation in the markup rates fromyear to year for a given unit. Therefore, the rates should be updated centrally once ayear.
• Should units apply a percentage rate vs. a flat dollar-amount rate?Both Regions’ CAO offices emphasized that the percentage rate approach ispreferable.
7. To introduce a uniform approach to calculating full costs, two methodologies wereconsidered:
8. The first methodology is based on the principles for calculating indirect rates for trustfunds. Under this methodology, (a) indirect and sustaining rates based on staff-weeks (dollars percapita) are set centrally and the same rate is used by all units; (b the full cost recovery factors inboth indirect and sustaining costs; (c) the indirect and sustaining rate markups are applied only tostaff-weeks; and (d) the rates are updated each year. (Box 1 highlights the pros and cons ofusing this methodology.)

37
Box 1. Advantages and disadvantages of using the “staff-week” methodology
Advantages Disadvantages
• This is an existing and tested methodologycurrently applied to trust funds, although unlikethe fee-based services, there is only indirect costrecovery.
•
•
It is under-recovering the costs.
There is a room for gaming the system whencosting the proposals (e.g., overestimating thestaff time at the proposal stage to get higherindirect and sustaining rates, and replacing staffwith consultants during the implementationstage).
•
•
It has a very specific system methodology forcharging indirect costs on a cash basis.
The system has been audited.• It’s a one-rate-fits-all methodology, which does
not take into account the unit’s business needs.
9. The second methodology is based on actual costs for the prior year and uses thepercentage markup on other direct costs. The markup rates on other direct costs are derived asfollows:
Indirect Rate = {(Other Direct Cost + Indirect Cost) / (Other Direct Cost)} - 1
Sustaining Rate = {(Other Direct Cost + Sustaining Cost) / (Other Direct Cost)} - 1
Full Cost Recovery Rate = Indirect Rate + Sustaining Rate
Advantages and disadvantages of the “percentage markup of other direct costs” methodology aresummarized in Box 2.
Box 2. Pros and cons of the percentage markup of other direct costs approach
Advantages Disadvantages
•
•
•
The methodology is straightforward to calculateand is easy to use.
•
•
This methodology is not consistent with the oneused for identifying indirect costs of trust funds.
Each VPU will have its sustaining, indirect, andfull cost rates.
The methodology has not been audited.
This approach can also be used for calculatingindirect and sustaining costs of otherinstruments, e.g., EFOs.
•
•
VPUs tend to prefer a percentage approach:both ECA and LCR agreed with the underlyingprinciples of this approach.
No room to game the system as the rate ismarked up on other direct costs and notindividual line items.
10. Table 1 shows the FY08 indirect, sustaining, and full cost recovery rates, calculated onthe basis of FY07 actual costs using the formulas above.

38
Table 1. FY07 Indirect, sustaining and full cost markup rates on other direct costs Full cost rate
Indirect costs
Sustaining costs
Total costs
Indirect rate
Sust. rate VPU grouping VPU
ADMINISTRATION GSD HRS ISG
$ 21,456,993 $ 16,515,564 $ 17,880,796 $ 55,853,354 $ 3,666,564 $ 1,948,256 $ 2,369,239 $ 6,137,625 $ 1,363,640 $ 1,230,644 $ 1,884,036 $ 6,520,226 $ 1,095,275 $ 110,129
$ 5,252,341 $ 6,155,913 $ 8,671,879 $ 20,080,132 $ 2,226,352 $ 599,842
$ 152,131,010 $ 73,907,393 $ 87,691,421 $ 313,729,824 $ 17,166,656 $ 5,699,517
17.11% 32.23% 29.25% 23.49% 32.52% 61.82% 155.47% 21.80% 23.75% 73.27% 18.45% 25.68% 142.84% 69.81% 29.90% 28.45% 36.01% 25.07% 29.77% 12.13% 24.18% 13.20% 23.84% 19.20% 17.81% 18.75% 17.97% 222.82% 23.54% 145.19% 35.18% 35.10% 29.53% 29.88% 26.37% 29.37% 31.67% 22.80% 28.04% 25.49% 31.70%
4.19% 12.01% 14.18% 8.44%
21.30% 44.25% 43.43% 31.93% 52.27% 80.86% 270.53% 44.71% 67.09% 109.13% 38.09% 44.08% 610.17% 85.20% 57.62% 46.28% 50.03% 42.40% 45.78% 27.09% 46.70% 30.36% 49.45% 40.24% 33.76% 26.03% 32.47% 254.39% 52.89% 175.89% 53.67% 57.52% 49.43% 49.09% 48.44% 47.57% 51.34% 39.61% 51.41% 45.68% 50.02%
Result
CFP CRS EXC EXT IAD
CORPORATE 19.75% 19.03% 115.05% 22.90% 43.34% 35.86% 19.64% 18.40% 467.33% 15.40% 27.71% 17.83% 14.01% 17.33% 16.01% 14.96% 22.52% 17.15% 25.61% 21.04% 15.95% 7.28%
$ 1,753,327
$ 6,446,260 $ 2,488,223 $ 602,249
$ 5,646,471 $ 40,732,265
$ 9,593,488 ICS $ 3,512,496 INT $ 2,005,657
$ 4,670,118 $ 3,583,427 $ 24,291
$ 14,100,827 $ 36,575,706 $ 5,445,484
LEG MDG OES Result CFR CSR TRE Result FPD HDN PRM SDN Result OPC QAG Result SEC IEG
$ 292,187 $ 26,325,634
$ 1,727,024 $ 13,275,767 $ 11,848,145 $ 26,850,937 $ 3,061,648 $ 4,826,247 $ 3,028,286 $ 11,128,810 $ 22,044,991 $ 3,776,605 $ 799,904
$ 24,399,747 $ 1,082,475 $ 5,165,155 $ 8,188,189 $ 14,435,819 $ 3,777,004 $ 4,494,654 $ 3,935,409 $ 11,952,998 $ 24,160,065 $ 3,381,995 $ 310,300
$ 138,765,097 $ 8,879,839 FINANCE
$ 55,303,037 $ 67,296,116 $ 131,478,991 $ 32,083,273 $ 29,278,550 $ 29,904,364 $ 69,763,354 $ 161,029,541 $ 28,363,292 $ 5,375,266
NETWORK COUNC.
OTHER OPS $ 4,576,509
$ 54,754,429 $ 3,691,927 $ 58,446,357 $ 65,303,883 $ 30,654,734 $ 34,808,154 $ 32,553,734 $ 15,049,546 $ 26,018,526 $ 204,388,578 $ 8,495,644 $ 11,066,084 $ 19,561,729 $ 418,048,088
$ 3,692,295 $ 7,757,950 $ 4,603,267 $ 12,361,217 $ 34,316,757 $ 19,581,462 $ 23,448,612 $ 20,925,030 $ 12,599,438 $ 16,119,621 $ 126,990,921 $ 6,263,718 $ 9,224,235 $ 15,487,952 $ 241,608,149
$ 33,738,557 $ 87,086,013 $ 23,977,953 $ 111,063,967 $ 285,225,096 $ 137,575,767 $ 176,119,936 $ 162,428,975 $ 84,727,757 $ 130,721,430 $ 976,798,962 $ 52,022,850 $ 59,756,640 $ 111,779,490 $ 1,978,384,429
14.50% 31.57% 29.35% 30.71% 18.49% 22.42% 19.89% 19.21% 22.07% 18.20% 19.68% 16.81% 23.37% 20.19% 18.32%
OTHER UNITS Result
AFR EAP ECA LCR MNA SAR Result DEC WBI
REGIONS
RES & TRAINING Result
Overall Result Notes:1. ISG’s and GSD’s indirect costs have been adjusted to exclude chargeback commitment items.2. The following funds have been excluded from all costs: BBFAO, BBACR, BBADJ, BBSPL, BBCGR, BBVRO, BBCBF,BBIFD, BBRTA, BBMPT, BBGEF, and Capital.

39
D. Recommendation
Having considered both methodologies, CSRRM recommends that units use the second,11.as it closely aligns with the Op Memo requirement of full cost recovery, and also would bewidely acceptable to the units. (Attachment 1 provides examples, and Attachment 2 providessome historical data on previous year ratios.).
12. CSRRM also recommends that the second methodology be used when costing otherinstruments, such as EFOs, when no financial reporting to the donor/contributor is required.

40
ANNEX D, ATTACHMENT 1
Example of Full Cost Recovery for Fee-Based Services
1. An example can illustrate how the proposed methodology will work. Russia hasrequested the Bank to provide fee-based services to produce a piece of ESW. The assumptionsfor the example are as follows: (a) the level of effort to produce the ESW is estimated at 25 staffweeks of a GG-level HQ-based staff; (b) the staff is expected to make 2 trips to the country, 10days each; (c) the staff will hire 3 STCs who will travel with him and contribute 60 days of theirtime each; (d) as part of the ESW dissemination effort, the team is planning to hold a workshop;and (e) the work will be completed in the current fiscal year.
2. Using the “percentage markup of other direct costs” approach, the full cost of the fee-based service in this ECA example will be $487,577 (see Table A1.1). Under the “staff week”approach, the fee-based services will be priced at $364,029 as detailed in Table A1.2. UsingECA’s current guidance on fee-based services, the full cost in our example would have been$385,049, and using LCR’s approach, the amount would have been $414,418. Clearly, both ECAand LCR are under-recovering by a magnitude of 17 percent to 27 percent compared to oursecond proposed approach.
Table A1.1. Percentage markup of other direct costs approach OTHER DIRECT COST 326,313
SWS Level Market RefPoint
Benefits(50%)
Total Salary Full Cost Total StaffCostsStaff & Benefits + Benefits per SW
[Staff 1] 25 GG 128,730 64,365 193,095 4,389 109,713Total Staff Salaries & Benefits 109,713
DaysSTCs
Matrix Level Gross / Net HQ / CO Daily Fee Total Fees
[STC 1] 606060
AAA
433
GrossNet
HQHQHQ
1,007524
60,42031,44045,660137,520
[STC 2][STC 3] Gross 761Total STCs
From / To Airfare Per Diem Hotel Rate Number of Number of Travel CostTravel Trips Days[Staff 1] HQ / Russia
HQ / RussiaHQ / RussiaHQ / Russia
4,000 124124124124
427427427427
2222
20202020
19,02019,02019,02019,02076,080
[STC 1] 4,0004,0004,000
[STC 2][STC 3]Total Travel
Workshops[Workshop 1]Total Workshops
3,0003,000
SUSTAINING COST (19.89%)
INDIRECT COST (29.53%)
TOTAL COST
64,904
96,360
487,577
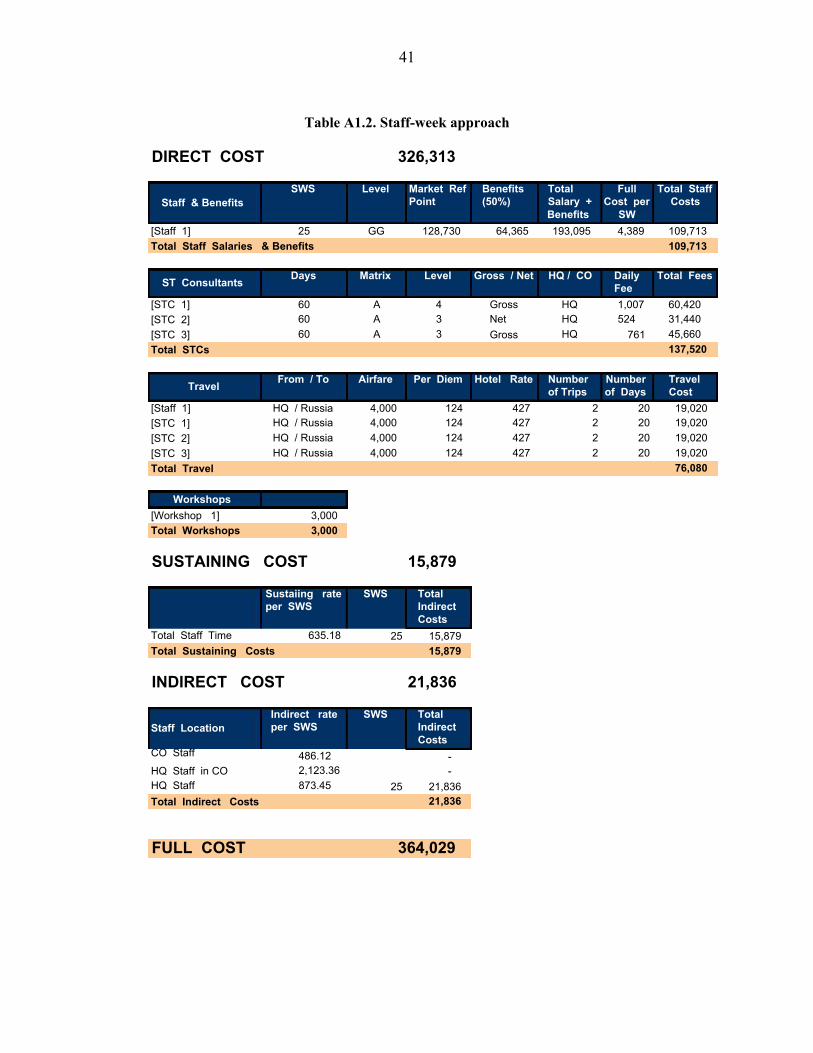
41
Table A1.2. Staff-week approach
DIRECT COST 326,313
SWS Level Market RefPoint
Benefits(50%)
TotalSalary + Cost per Costs
Full Total StaffStaff & Benefits
Benefits SW[Staff 1] 25 GG 128,730 64,365 193,095 4,389 109,713Total Staff Salaries & Benefits 109,713
Days Matrix Level Gross / Net HQ / CO DailyFee
Total FeesST Consultants
[STC 1] 606060
AAA
433
GrossNet
HQHQHQ
1,007524
60,42031,44045,660137,520
[STC 2][STC 3] Gross 761Total STCs
From / To Airfare Per Diem Hotel Rate Numberof Trips of Days
Number TravelCostTravel
[Staff 1] HQ / RussiaHQ / RussiaHQ / RussiaHQ / Russia
4,0004,0004,0004,000
124124124124
427427427427
2222
20202020
19,02019,02019,02019,02076,080
[STC 1][STC 2][STC 3]Total Travel
Workshops[Workshop 1] 3,000Total Workshops 3,000
SUSTAINING COST 15,879
Sustaiing rateper SWS
SWS TotalIndirectCosts
Total Staff Time 635.18 25 15,879Total Sustaining Costs 15,879
INDIRECT COST 21,836
Indirect rateper SWS
SWS TotalIndirectCosts
Staff Location
CO Staff 486.122,123.36873.45
--HQ Staff in CO
HQ Staff 25 21,83621,836Total Indirect Costs
FULL COST 364,029

42
ANNEX D, ATTACHMENT 2
HISTORICAL DATA ON PREVIOUS YEAR RATIOS
1. FY06 indirect, sustaining, and full cost markup rates
Full cost rate
Indirect costs
Sustaining costs
Total costs
Indirect rate
Sust. rate VPU grouping VPU
ADMINISTRATION GSD HRS ISG
$ 17,351,361 $ 17,229,323 $ 20,435,725 $ 55,016,409 $ 3,862,537 $ 2,284,769 $ 2,123,266 $ 5,481,735 $ 1,214,379 $ 1,414,377 $ 1,690,836 $ 5,608,845 $ 704,941
$ 4,970,027 $ 7,336,798 $ 8,269,407 $ 20,576,232 $ 1,917,224 $ 734,263
$ 121,581,093 $ 74,790,922 $ 79,977,009 $ 276,349,024 $ 15,807,586 $ 6,030,946
17.48% 34.30% 39.86% 27.40% 38.52% 75.86% 101.48% 16.95% 20.19% 84.15% 16.81% 22.50% 166.00% 26.92% 22.54% 31.07% 27.63% 28.79% 12.48% 18.26% 15.68% 22.39% 18.11% 15.81% 19.56% 16.36% 231.95% 24.42% 150.47% 33.33% 30.29% 27.26% 26.67% 24.76% 26.02% 28.91% 27.03% 28.12% 27.61% 30.84%
5.01% 14.61% 16.13% 10.25% 19.12% 24.38% 96.26% 20.70% 33.42% 42.83% 15.79% 20.98% 423.49% 25.07% 17.93% 16.56% 18.71% 17.70% 15.86% 21.22% 20.23% 26.50% 21.93% 11.11% 8.39%
22.49% 48.91% 55.99% 37.65% 57.64% 100.24% 197.75% 37.65% 53.62% 126.98% 32.61% 43.47% 589.49% 51.99% 40.47% 47.63% 46.34% 46.49% 28.34% 39.48% 35.91% 48.89% 40.05% 26.92% 27.95% 27.07% 266.22% 52.05% 182.13% 51.66% 52.38% 46.79% 48.11% 44.80% 45.79% 48.86% 43.76% 50.79% 47.51% 49.80%
Result
CFP CRS EXC EXT IAD
CORPORATE $ 2,014,069
$ 6,692,080 $ 2,009,787 $ 719,924
$ 6,229,589 $ 44,507,568
$ 9,237,603 ICS $ 3,815,148 INT $ 1,588,432
$ 5,229,652 $ 1,798,376 $ 22,703,806 $ 1,118,511 $ 6,400,081 $ 7,900,070 $ 15,418,662 $ 4,092,121 $ 4,438,246 $ 4,262,417 $ 12,008,720 $ 24,801,504 $ 2,603,127 $ 339,805
$ 13,336,066 $ 35,770,295 $ 2,927,971
LEG MDG Result CFR CSR TRE Result FPD HDN PRM SDN Result OPC QAG Result SEC IEG
$ 24,385,685
$ 1,405,550 $ 12,005,326 $ 11,665,640 $ 25,076,515 $ 3,218,860 $ 3,817,975 $ 3,302,949 $ 10,144,008 $ 20,483,792 $ 3,703,029 $ 792,107
$ 137,662,771 $ 8,760,824 FINANCE
$ 57,047,334 $ 61,790,879 $ 127,599,038 $ 33,105,112 $ 29,168,783 $ 28,630,787 $ 67,462,694 $ 158,367,376 $ 29,734,007 $ 5,182,373
NETWORK COUNC.
OTHER OPS $ 4,495,136
$ 53,455,533 $ 3,637,644 $ 57,093,177 $ 59,859,950 $ 27,483,264 $ 32,297,435 $ 28,695,692 $ 14,514,879 $ 21,629,117 $ 184,480,337 $ 9,496,254 $ 11,281,898 $ 20,778,152 $ 391,809,203
$ 2,942,931 $ 7,896,404 $ 4,117,173 $ 12,013,578 $ 32,906,479 $ 20,049,536 $ 23,140,923 $ 23,065,901 $ 11,751,017 $ 16,430,339 $ 127,344,195 $ 5,879,202 $ 9,097,591 $ 14,976,793 $ 240,777,701
$ 34,916,379 $ 84,397,653 $ 22,652,726 $ 107,050,378 $ 272,339,622 $ 138,277,082 $ 173,933,308 $ 159,357,623 $ 84,893,108 $ 121,180,985 $ 949,981,728 $ 50,508,962 $ 60,501,892 $ 111,010,854 $ 1,902,937,547
10.71% 34.26% 27.64% 31.66% 18.32% 22.09% 19.53% 21.44% 20.04% 19.77% 19.95% 16.73% 22.67% 19.90% 18.95%
OTHER UNITS Result
AFR EAP ECA LCR MNA SAR Result DEC WBI
REGIONS
RES & TRAINING Result
Overall Result

43
2. FY05 indirect, sustaining and full cost markup rates
Full cost rate
Indirect costs
Sustaining costs
Total costs
Indirect rate
Sust. rate VPU grouping VPU
ADMINISTRATION GSD HRS ISG
$ 10,524,649 $ 16,928,888 $ 24,155,296 $ 51,608,833 $ 3,440,821 $ 2,287,204 $ 2,695,321 $ 6,725,896 $ 1,112,527 $ 1,038,319 $ 1,616,924 $ 5,402,181 $ 1,707,079 $ 26,026,272 $ 1,819,873 $ 14,006,525 $ 12,855,054 $ 28,681,451 $ 3,133,841 $ 3,986,141 $ 4,031,280 $ 10,139,368 $ 21,290,631 $ 3,650,339 $ 900,021
$ 5,130,722 $ 7,286,455 $ 7,046,579 $ 19,463,756 $ 1,858,066 $ 721,722
$ 118,064,351 $ 78,575,746 $ 79,870,206 $ 276,510,303 $ 16,418,440 $ 6,116,213
10.28% 31.14% 49.63% 25.12% 30.94% 73.61% 102.18% 20.85% 18.96% 45.93% 22.59% 23.23% 72.99% 28.92% 19.23% 37.37% 31.79% 32.82% 12.92% 18.23% 20.24% 22.15% 19.04% 13.67% 18.45% 14.41% 256.54% 21.23% 159.71% 29.33% 27.50% 27.28% 28.14% 25.01% 29.61% 28.12% 24.37% 28.98% 26.86% 30.51%
5.01% 13.40% 14.48% 9.47%
15.29% 44.55% 64.11% 34.60% 47.65% 96.83% 146.32% 42.75% 48.19% 57.22% 34.13% 49.51% 139.37% 52.55% 28.98% 54.70% 50.76% 50.09% 30.97% 36.51% 41.98% 47.44% 40.76% 22.87% 25.26% 23.24% 290.67% 50.37% 191.78% 45.89% 50.17% 47.31% 51.71% 45.86% 49.78% 48.21% 40.86% 52.30% 47.04% 49.12%
Result
CFP CRS EXC EXT IAD
CORPORATE 16.71% 23.23% 44.14% 21.90% 29.23% 11.29% 11.54% 26.27% 66.38% 23.63% 9.75%
$ 1,164,312
$ 7,062,314 $ 1,714,665 $ 255,291
$ 6,497,478 $ 46,042,937
$ 8,693,645 ICS $ 3,554,178 INT $ 825,874 $ 9,599,665 LEG
MDG Result CFR CSR TRE Result FPD HDN PRM SDN Result OPC QAG Result SEC IEG
$ 6,108,893 $ 1,552,436 $ 21,263,573 $ 922,269
$ 34,761,554 $ 5,598,247
$ 137,282,357 $ 12,203,472 $ 57,980,869 $ 60,969,203 $ 131,153,544 $ 31,756,156 $ 29,851,585 $ 28,285,674 $ 67,485,677 $ 157,379,092 $ 32,802,190 $ 6,109,326
FINANCE $ 6,494,680
$ 7,673,192 $ 15,090,141 $ 4,375,123 $ 3,997,598 $ 4,332,228 $ 11,575,874 $ 24,280,823 $ 2,454,122 $ 332,062
17.33% 18.97% 17.27% 18.04% 18.28% 21.75% 25.29% 21.72% 9.19%
NETWORK COUNC.
OTHER OPS 6.81% $ 4,550,360
$ 53,655,694 $ 3,105,093 $ 56,760,787 $ 52,630,996 $ 24,378,279 $ 32,673,868 $ 29,088,798 $ 13,738,073 $ 22,067,680 $ 174,577,693 $ 8,530,347 $ 11,946,150 $ 20,476,498 $ 383,972,525
$ 2,786,185 $ 7,136,543 $ 4,261,027 $ 11,397,570 $ 29,726,667 $ 20,093,513 $ 23,992,187 $ 24,368,908 $ 11,459,627 $ 15,039,724 $ 124,680,626 $ 5,772,771 $ 9,609,843 $ 15,382,614 $ 234,345,287
$ 38,911,516 $ 81,707,082 $ 21,990,415 $ 103,697,497 $ 261,825,659 $ 133,117,130 $ 176,436,822 $ 156,832,063 $ 80,137,776 $ 111,646,352 $ 919,995,803 $ 49,309,478 $ 62,773,207 $ 112,082,685 $ 1,877,012,797
8.82% OTHER UNITS 34.12%
29.14% 32.07% 16.56% 22.67% 20.03% 23.57% 20.86% 20.18% 20.09% 16.49% 23.32% 20.18% 18.62%
Result
AFR EAP ECA LCR MNA SAR Result DEC WBI
REGIONS
RES & TRAINING Result
Overall Result

44
3. FY04 indirect, sustaining and full cost markup rates
Full cost rate
Indirect costs
Sustaining costs
Total costs
Indirect rate
Sust. rate VPU grouping VPU
ADMINISTRATION GSD HRS ISG
$ 10,297,211 $ 14,000,612 $ 37,672,564 $ 61,970,387 $ 2,844,574 $ 1,842,404 $ 1,971,366 $ 7,855,645 $ 1,028,644 $ 611,015
$ 3,825,912 $ 6,795,971 $ 6,502,426 $ 17,124,308 $ 1,866,785 $ 790,334
$ 111,526,405 $ 73,831,678 $ 85,465,344 $ 270,823,427 $ 15,758,389 $ 5,474,410
10.57% 26.40% 91.24% 32.32% 25.75% 64.84% 83.46% 25.12% 17.90% 30.71% 9.71%
3.93% 12.81% 15.75% 8.93%
14.50% 39.21% 106.99% 41.25% 42.65% 92.65% 138.30% 46.32% 38.04% 42.48% 20.91% 44.90% 264.26% 51.24% 24.50% 48.23% 47.67% 45.34% 30.68% 35.26% 38.13% 47.62% 39.82% 19.48% 25.11% 20.21% 269.22% 44.96% 177.79% 44.30% 42.52% 45.17% 43.32% 43.14% 48.17% 44.37% 39.94% 44.47% 42.57% 47.22%
Result
CFP CRS EXC EXT IAD
CORPORATE 16.90% 27.81% 54.83% 21.21% 20.15% 11.77% 11.20% 23.20% 141.87% 23.68% 8.83%
$ 1,295,201
$ 6,632,806 $ 1,158,072 $ 234,192
$ 5,628,583 $ 45,764,792
$ 7,934,527 ICS $ 2,834,830 INT $ 773,488 $ 892,540 $ 9,634,429 LEG
MDG Result CFR CSR TRE Result FPD HDN PRM SDN Result OPC QAG Result SEC IEG
$ 4,722,160 $ 2,287,840 $ 23,937,137 $ 1,542,324 $ 12,419,800 $ 12,470,502 $ 26,432,627 $ 2,847,142 $ 4,813,739 $ 3,176,299 $ 10,118,660 $ 20,955,839 $ 3,280,383 $ 768,733
$ 5,049,718 $ 2,652,005 $ 20,571,654 $ 869,741
$ 31,537,899 $ 6,809,171
21.70% 122.39% 27.56% 15.67% 32.62% 30.55% 29.79% 12.47% 21.24% 16.05% 22.82% 19.12% 12.17% 19.17% 13.07% 238.51% 17.20% 148.28% 27.69% 24.08% 27.35% 23.90% 22.10% 27.01% 25.88% 24.97% 24.94% 24.95% 29.88%
$ 131,377,030
$ 12,256,418 $ 56,445,583 $ 60,275,758 $ 128,977,760 $ 29,844,098 $ 30,649,762 $ 27,339,007 $ 65,456,732 $ 153,289,599 $ 32,217,984 $ 5,016,526
FINANCE $ 5,947,112
$ 6,986,495 $ 13,803,349 $ 4,160,121 $ 3,176,822 $ 4,370,281 $ 10,996,348 $ 22,703,572 $ 1,972,206 $ 238,238
15.62% 17.12% 15.55% 18.22% 14.02% 22.08% 24.80% 20.71% 7.31%
NETWORK COUNC
OTHER OPS 5.94% $ 4,049,116
$ 51,010,311 $ 2,532,891 $ 53,543,202 $ 47,595,780 $ 21,805,302 $ 32,787,583 $ 24,989,465 $ 11,561,609 $ 18,339,850 $ 157,079,589 $ 8,402,342 $ 11,622,394 $ 20,024,736 $ 367,992,633
$ 2,210,444 $ 6,568,617 $ 4,085,803 $ 10,654,421 $ 28,543,158 $ 16,700,936 $ 21,351,429 $ 20,298,568 $ 11,002,282 $ 14,372,853 $ 112,269,226 $ 5,038,898 $ 9,102,848 $ 14,141,746 $ 213,478,719
$ 37,234,510 $ 78,966,447 $ 21,340,863 $ 100,307,310 $ 248,021,303 $ 129,061,233 $ 174,002,120 $ 149,831,248 $ 74,871,822 $ 100,618,719 $ 876,406,445 $ 47,096,476 $ 67,332,606 $ 114,429,083 $ 1,812,845,164
7.14% OTHER UNITS 30.71%
27.75% 29.51% 16.61% 18.44% 17.81% 19.42% 21.03% 21.17% 18.49% 14.97% 19.53% 17.62% 17.34%
Result
AFR EAP ECA LCR MNA SAR Result DEC WBI
REGIONS
RES & TRAINING Result
Overall Result

45
ANNEX EANALYSIS OF FULL COST RATES FOR FEE-BASED SERVICESUSING THE RECOMMENDED COSTING METHODOLOGY
1. The data show only modest differences in the pattern of mark-ups between Regions.While the FY07 figures look anomalous—with an exceptionally high mark-up for EAP—even inthat year the spread between highest and lowest implied Regional markups is less than 10percentage points.
Full cost rates, FY04 to FY07
60.00
58.00
56.00
54.00AFR
52.00
50.00
48.00
46.00
44.00
42.00
40.00
EAPECALCRMNASAR
FY04 FY05 FY06 FY07

46

47
ANNEX FREVISED OPERATIONAL MEMORANDUM
Subject: The Provision of Fee-based Services
This memorandum is intended to help Bank units respond appropriately and consistently1.to requests for fee-based services—that is, services provided as a direct response to requestsfrom, and partly or fully paid for by, the recipient of the service, under a legal agreement.1
2.Regions and Sectors.
The principles set out in this memorandum apply to fee-based services provided by2
Purpose
3. In providing fee-based services, the Bank’s purpose is to expand the options and servicesavailable to clients beyond those that it can fully fund through the administrative budget. Aclient’s request for fee-based services does not affect the administrative budget for work in thatcountry.3
General Principles
4. Strategic Objectives. Fee-based services, like any services provided by the Bank, mustfall within the purposes of the Bank as set out in its Articles of Agreement and must contribute toachieving the Bank’s mission of poverty reduction and sustainable economic growth. Fee-basedservices must be consistent with the Bank’s strategic priorities, including—for borrowingcountries—those set out in the Bank’s Country Assistance Strategy (CAS) or CountryPartnership Strategy (CPS).
5. Alignment with Institutional Mandate. The Bank provides only fee-based services thatManagement considers to be fully aligned with the Bank’s development mandate. In providingsuch services, the Bank does not enter into competitive bidding.
6. Types of Services. The fee-based services the Bank may provide are analytic andadvisory activities (AAA) that the client requests and that the Bank cannot fund in full within theexisting administrative budget envelope. This includes economic and sector work, technicalassistance, institutional development, and training. Subject to appropriate safeguards and riskmanagement, the Bank may provide technical assistance directly in support of projectpreparation, implementation, or supervision—except for advice directly related to engineering orfinal design.
1
The Bank will continue to provide existing fee-based programs under the original terms agreed upon with theclient; however, as these programs move toward renewal over time, they must move into alignment with theprinciples outlined in this memorandum as soon as possible.
2
3
The World Bank Institute and Treasury provide other fee-based services, but they have their own pricing andprocessing arrangements.Country budget allocations are determined by such factors as country performance, GDP per capita, population,and lending levels.

48
7. Role of the Bank. Staff ensure that the provision of fee-based services does not involve aconflict of interest for the Bank or associate the Bank with any activity inconsistent with its
4operational policies. The Bank does not provide services to assist one member country inadvancing its interests over those of another member country. Before taking on the provision ofany fee-based service, staff and management explicitly consider the risks, including liability orreputational risks, and judge whether they are acceptable by the Bank, taking into considerationany risk mitigation measures to be put in place.
8. Clients. The Bank may provide fee-based services to the following types of clients, allsubject to legal due diligence and the agreement of the country director concerned:
(a) governments and government institutions of the Bank’s member countries, includingthose that have graduated from the Bank;(b) subnational governments;5(c) nongovernmental organizations and other not-for-profit private sector associations(such as chambers of commerce); and(d) multilateral institutions, including development banks and regional organizations.
6The Bank does not provide fee-based services to commercial entities, except in the context oftraining programs.
9. Quality Control. Fee-based tasks are subject to all applicable Bank operational policiesand to the same quality control practices as AAA handled through the administrative budget.(The applicable safeguards policies and procedures provide guidance to Bank staff involved inproviding fee-based services.) Bank staff ensure that the client’s rules and procedures areconsistent with the Bank’s operational policies, not just for the fee-based service itself, but alsofor the underlying projects on which the client is seeking the Bank’s advice. If the recipient ofBank advice fails to respect important safeguards, the Bank reserves the right to terminate theagreement.
10. Costing. For all clients, the costs of fee-based services are calculated using themethodology of uniform pricing—that is, the recovery of direct and indirect costs (salary andassociated benefits, travel, and subsistence) as well as overhead costs associated with providing
7the service. Indirect and overhead costs are represented by a markup factor derived from data
4
5
In providing fee-based services, the Bank does not accept any responsibility related to implementation of aBank-financed project. “Implementation” is used here in a broad sense to include such activities as detailedengineering, final design, exploratory drilling for petroleum and water resources, aerial photography, andprocurement implementation (e.g., preparation of bidding documents, bid evaluation), regardless of the stage ofthe Bank’s project cycle in which they are carried out.When providing services to entities other than the government or its institutions, Regional staff obtain necessarygovernment approval in accordance with the provisions of GP 14.70, Involving Nongovernmental Organizationsin Bank-Supported Activities.
6
7
The Bank may provide fee-based services to state-owned enterprises so long as the other requirements of the OpMemo, in particular consistency with the Bank’s mandate and strategic objectives, are met.This defines the costing for services under fee-based arrangements, but does not prohibit the Bank fromcontributing to financing such costs (see para. 11).
49
8for previous years and reconsidered every two years; for FY09-FY10, the factor is set at 50percent.
11. Sources of Funds. To meet the cost of fee-based advisory services, clients may use their9own budgetary resources, eligible trust funds, or other third-party resources. Under some
circumstances, the Bank may also contribute, via its own budget, to funding some percentage ofthe cost of the services delivered to the client under the fee-based umbrella.
Processing
12. Staff may obtain supporting documents and forms for processing fee-based services onthe Fee-Based Services page on the OPCS website.
13. Proposal. For each fee-based task, the task manager (TM), in consultation with theassigned lawyer, prepares a brief proposal that sets out (a) the kinds of services to be provided,(b) the proposed area of analysis or advice, (c) the link with the Bank’s mandate and strategicpriorities (including the CAS/CPS, if applicable) and the value-added of providing the services,10(d) risks to be considered and any mitigation measures to be put in place, (e) consistency withthe other requirements of this Op Memo, (f) the names of the staff who will provide the services,(g) the length and value of the contract, and (h) the expected outcome of the task. The relevantcountry director and sector director both approve the proposal.11
14. When the provision of services to subnational entities is proposed, staff seek the12endorsement of the central government, either on a case-by-case basis or via a general
agreement for subnational entities to contract such services. Proposals for the provision of fee-based services to subnational and other nonsovereign entities are subject to legal due diligence.13
15. Contracting. Once the proposal is approved, the TM and the lawyer determine whetherthe lawyer must prepare a tailored agreement or whether, instead, the TM can prepare and submita standard agreement for clearance by the lawyer. The contract negotiated with the client servesas the legal basis for providing the services. The decision authority rests with the country directoronce clearance by the lawyer has been obtained. OPCS can provide guidance on request.
89
CSRRM: “Fee-based services costing methodology for indirect and sustaining costs”For information on the eligibility of trust funds to finance specific fee-based services, staff may consult theTrust Funds and Cofinancing Department.
10
11
If the risks are deemed substantial or the project presents novel features, the lawyer or the country director mayrefer the proposal to LEGOP and OPCOS.In addition, when services are to be provided to a multilateral institution, the proposal is also approved by theRegional vice president or the Network head who manages the Bank’s relationship with the institution. Theregional or sector director may hold a decision meeting if recommended by the TM and the lawyer, or if theyotherwise decide the proposal merits discussion.
1213
This approval may take the form of a simple written no-objection.This legal due diligence includes, among other things, verification of the capacity of the subnational to enterinto and perform the contract and the potential impact of domestic law on the transaction, including any liabilityor other legal risks that may arise in connection with the services.

50
16. Budgeting and Accounting. After negotiating the contract with the client, the TMsubmits to the Region’s chief administrative officer (CAO) a billing information form that givesthe essential details of the contract: the name of the providing unit and the billing address of theclient. The CAO sends a copy of the form to Corporate Resource Management (CSRRM), whichmakes arrangements for payments for the fee-based services to be posted to the budget of theproviding unit. CSRRM also informs the Accounting Department (ACT), which sets upappropriate procedures for billing the client and monitoring payment. At the intervals agreedwith the client in the contract, but at least once each quarter, the providing unit sends the billingamounts for the period to Accounts Payable (ACTAP), which then bills the client for theservices. As part of the normal budget monitoring process, the providing unit requests a budgettransfer, based on fees billed for the services, in its quarterly progress report to CSRRM.
17. Activity Completion. Within two months after the close of the task, the TM prepares anActivity Completion Summary (ACS) including feedback from the client. As part of the ACS,the sector leader assesses the quality of the services, and the lead economist or residentrepresentative evaluates their impact.
Program Monitoring
18. The TM sends a copy of the approved proposal, the contract, and the ACS—as eachdocument is completed—to MDOPS.
Queries
19. General questions about this memorandum may be addressed to the Corporate StrategyGroup, Strategy and Resource Management, or to the Operations Service Department in OPCS;questions that arise during the preparation or provision of fee-based services may be addressed [email protected]; questions about the legal aspects of providing fee-based servicesmay be addressed to the chief counsel concerned or to LEGOP (Frank Fariello, ext.87782);questions about costing and budgeting arrangements may be addressed to CSRRM (MarieBakker, ext. 39285); and questions about billing and accounting may be addressed to ACTRT.