services and infrastructure outlook survey: recent trends*
TRANSCRIPT

ARTICLE
RBI Bulletin December 2020 103
Services and Infrastructure Outlook Survey: Recent Trends
business surveys are, therefore, often relied upon,
where relevant questions are designed for a relatively
homogeneous group of business entities.
The rest of this article is structured as follows.
Section II presents the cross-country experience on
business outlook surveys relating to services sector. An
overview of the quarterly Services and Infrastructure
Outlook Survey conducted by the Reserve Bank is
given in Section III and its findings are summarised
in Section IV. Section V concludes with some key
takeaways.
II. Cross-Country Practices
Business tendency surveys are conducted
regularly in developed economies as well as in many
emerging market economies and have proved to be an
effective means of generating timely information on
short-term economic developments. The European
Commission co-ordinates the harmonised monthly
surveys for different sectors (i.e., industry, services,
retail trade and construction) in the European
economies. In addition to the common questions,
the national authorities often add country-specific
questions in their questionnaires.
A summary of major business surveys, conducted
by major central banks covering services sector firms
is presented in Annex Table 1.
III. RBI’s Services and Infrastructure Outlook Survey
The Reserve Bank’s Internal Working Group
on Surveys (2009) had noted that gauging the
developments in services sector is vital for
understanding the effectiveness of overall policies
as services have the largest share in India’s national
income and have been recording high employment
growth, especially in the retail sector. The Group
suggested that a business outlook survey for services
sector may be conducted with a focus on trading and
other sub-components of services like, IT services,
hospitality services, health care services, etc.
The Reserve Bank’s quarterly Services and Infrastructure Outlook Survey (SIOS), being conducted since Q1:2014-15, provides the perceptions of the services and infrastructure sector companies about their own performance and prospects in the near term. Its response rate is lower than that of other forward looking surveys of the Reserve Bank, but the aggregate responses on major parameters have broad internal consistency. This article presents details of the survey and the movements in major parameters since its inception. After severe contraction in Q1:2020-21 due to the lockdown in the wake of COVID-19 pandemic, business sentiments have moved to recovery path but are yet to reach the pre-pandemic levels.
Introduction
Business tendency surveys seek opinion of
business managers about the prevailing business
conditions and their plans and expectations for
the near future. These surveys, which are also
christened as business outlook/expectation/opinion/
climate surveys, aim to provide lead information on
macroeconomic and sectoral outlook to economic
policymakers, analysts and business planners. The
information set from such surveys are also of value in
anticipating cyclical turning points in the economy.
Surveys of business conditions often go beyond
measurable conventional statistics and, inter alia, collect perceptions on economic conditions (e.g., overall business situation, investment climate,
production constraints). Organised businesses
usually function in several economic sectors (viz., industry, infrastructure, retail trade, services) having
different focus areas and parameters. Sector-specific
* Prepared by Shubhangi Latey and Supriya Majumdar of the Division of Enterprise Surveys, Department of Statistics and Information Management. The views expressed in this article are those of the authors and do not necessarily represent the views of the Reserve Bank of India.
Services and Infrastructure Outlook Survey: Recent Trends*

ARTICLE
RBI Bulletin December 2020104
Services and Infrastructure Outlook Survey: Recent Trends
Accordingly, after some pilot work, the SIOS is
being conducted on quarterly basis since Q1:2014-15,
with some refinement in the survey questionnaire over
the period under the guidance of the Bank’s Technical
Advisory Committee on Surveys (TACS) where external
experts participate. The survey provides insights on
the prevailing business conditions in the services and
infrastructure sector and also the expectations in the
near term.
Target Group and Responses
The survey questionnaire is canvassed among a
panel of services and infrastructure sector companies.
The sample frame is selected so as to get a reasonable
representation of size and industry. The frame is
updated on annual basis and kept fixed for the survey
rounds conducted during a year. The frame has been
expanded gradually from nearly 800 companies
in the initial rounds to around 3,500 companies.
Participation in the survey is voluntary.
It is recognised that the number of services sector
companies is very large, where small firms dominate
in terms of number and their churn rate is high.
Accordingly, the response rate is generally lower than
that of the other business surveys of the Reserve Bank
{e.g., Industrial Outlook Survey (IOS), Order Book,
Inventory and Capacity Utilisation Survey (OBICUS),
Bank Lending Survey (BLS)}. The actual number of
responses for all the survey rounds since inception is
presented in Chart 1.
The Survey Questionnaire
Senior management officials or heads of finance in
services and infrastructure companies are solicited to
provide their perception on select business parameters
along with some basic information on their business
profile in a structured questionnaire.1 It assesses
the business situation for the prevailing quarter
and expectations for the ensuing quarter on overall
business situation, demand indicators, employment
conditions, price situation, financial situation and
profit margin, which provide useful forward looking
inputs for policy analysis and research.
The survey responses are collected on a three-point
scale (viz., increase, decrease and no change). Feedback
about the factors influencing the business favourably
and adversely is collected in an additional block of
the questionnaire. Respondents can also provide their
sentiments on different macroeconomic parameters
(e.g., annual inflation rate, annual growth in overall
economic output, investment in the economy, Rupee-
US dollar exchange rate and business constraints) as
well as any other comments/suggestions on sector-
specific issues in the survey questionnaire.
Methodology: Analysis of Survey Data
Each round of the survey has three shares
of respondents (viz., percentage of respondents
reporting increase, decrease and no change) for
each business parameter for both assessment and
expectation quarters. These are summarised into a
1 SIOS questionnaire is available at the RBI website https://www.rbi.org.in/Scripts/BS_ViewForms.aspx?FCId=40), and is placed under the head ‘Forms’ (see ‘More Links’ at the bottom of the RBI Homepage) and the sub-head ‘Survey’.
Chart 1: No. of Respondents for SIOS

ARTICLE
RBI Bulletin December 2020 105
Services and Infrastructure Outlook Survey: Recent Trends
single comprehensive number for each parameter/period in terms of ‘Net Responses (NR)’ or ‘Diffusion Indices (DI)’.2 NR can range from -100 to +100 with the ‘zero’ value separating optimism/expansion from pessimism/contraction. On the other hand, DI ranges from 0 to 100 with 50 as the mid-point (OECD, 2003). The two summary indices move in tandem over time as the difference is essentially that of scale. In the subsequent sections, NR is used to analyse the SIOS results.
IV. Survey Findings
The movements in the SIOS parameters from the first round (April-June 2014) up to the July-September 2020 round of the survey are set out below.3
Overall Business Situation
The overall sentiment of services and
infrastructure companies remained in optimistic
zone despite gradual moderation during the six year
period ending Q4:2019-20 before the severe impact
of COVID-19 pandemic. The situation recorded
turnaround in the latest quarter for the services sector
though the overall perception of respondents was
that the infrastructure companies would remain in a
contraction zone (Chart 2). As most of the responses
for January-March 2020 survey round were received
by early-March 2020, it did not foretell the collapse of
activities in the subsequent quarter. This is true for all
major parameters of the survey.
2 For computing Net Responses (NR), the percentage of respondents reporting a decrease is subtracted from the percentage reporting an increase; while, Diffusion Index (DI) is defined as the fraction of favourable (Increase) answers plus half of the fraction of no change answers. Let A, B and C be respectively the fraction of increase, no change and decrease replies in the total, then
NR = 100 (A – C), while
DI = 100 (A + B/2). It can be shown algebraically that NR = 2(DI -50) or DI = (100 + NR )/ 2. 3 The survey results represent the respondents’ collective views. Detailed SIOS data for the 27th survey round (October-December 2020) onwards will be released on the RBI website on the lines of other monetary policy surveys {e.g., Industrial Outlook Survey (IOS), Order Book, Inventory and Capacity Utilisation Survey (OBICUS)} after the resolution of the Monetary Policy Committee (MPC) is placed in public domain.
Chart 2: Overall Business Situation
a: Services b: Infrastructure

ARTICLE
RBI Bulletin December 2020106
Services and Infrastructure Outlook Survey: Recent Trends
It is also interesting to note that assessments for all quarters are lower than the expectations expressed in the previous quarter. This is true for most of the other parameters too. A similar phenomenon is observed in the Bank’s quarterly IOS for the manufacturing sector and it indicates optimism bias
in business expectations (RBI, 2020).
Turnover/Sales
This question seeks feedback on the gross
revenue generated by companies through selling
of goods or providing services.4 The sentiments on
turnover show optimism till the end of FY 2019-20
but a dip during Q1:2020-21 as in the case of overall
business situation due to the pandemic (Chart 3).
The sentiments improved in the subsequent quarter,
though the assessment remained in the contraction
zone. The respondents expect further improvement
in the ensuing quarter (i.e., Q3:2020-21).
Full-time Employees
Corporate perspective on full-time employees
(e.g., whether they are going to increase the regular
workforce, cut jobs or retain their strength of full-
time employees) are being collected since the
14th round (i.e., Q2:2017-18) of the survey. While
the sentiments for the services sector were in an
expansion zone before the outbreak of the pandemic,
the infrastructure companies were witnesssing a
decline in full-time employees since Q2:2018-19
(Chart 4). The latest round of the survey shows that
the sentiments are yet to return to the pre-pandemic
level.
Part-time Employees
Due to quicker changes in volume of activities,
firms in services and infrastructure sector often use
part-time/ contract employees more flexibly than
manufacturing companies to cater to the changes in
the demand conditions. On net basis, the respondents
were positive on engagement of part-time employees
4 Gross sales in the case of trading companies and for companies engaged in hotel/restaurant business, is the total income generated from lodging, food & other services, etc.
Chart 3: Turnover
a: Services b: Infrastructure

ARTICLE
RBI Bulletin December 2020 107
Services and Infrastructure Outlook Survey: Recent Trends
till Q2:2019-20, especially in the services sector, but
the sentiments turned adverse since Q3:2019-20
(Chart 5). The latest round of the survey shows some
improvement though the sentiments still remain in a
negative zone.
Inventories
The question on inventories (goods/materials that
a business holds for the ultimate purpose of resale or
use to render services) was introduced in the survey
questionnaire in Q2:2017-18. The sentiments on
Chart 4: Full-time Employees
a: Services b: Infrastructure
Chart 5: Part-time Employees
a: Services b: Infrastructure

ARTICLE
RBI Bulletin December 2020108
Services and Infrastructure Outlook Survey: Recent Trends
inventories for the services sector were in expansion
zone but started moderating since Q4:2018-19 and
collapsed into contraction zone in Q1:2020-21 due
to pandemic situation (Chart 6). The sentiments for
the infrastructure sector, however, continued in the
expansion zone albeit with lower optimism.
Availability of Finance and Cost of Finance
Corporate views on availability and cost of finance
(CoF) for supporting their business operations is an
important input for financial planning.5 Since increase
in CoF is adverse for business (unlike for majority of
business parameters where increase indicates positive
sentiments), NR for CoF represents the proportion
of respondents expecting decline (D) in CoF less the
proportion that expect its increase (I).
NR on CoF declined continuously from
Q3:2017-18 for one year before the perceptions
started to improve in Q4:2018-19, though it remained
in the negative terrain (Chart 7). The availability of
finance (AoF) for services sector companies (from
both internal and external sources) was in optimistic
zone till the outbreak of the pandemic, although
infrastructure companies were reporting pessimistic
sentiments much earlier (since Q3:2017-18).
Salary/Wages
This parameter was included in the survey
questionnaire during Q2:2017-18 round to capture
sentiments on the cost borne by the companies
towards staff salary. Here too, NR is computed as
D-I. Both services and infrastructure companies felt
continued salary pressures till the outbreak of the
pandemic. Subsequently, salary outgo was assessed
to have declined as corporates perceived lower
engagement of employees over one quarter, before
the salary pressure started to increase again (Chart 8).
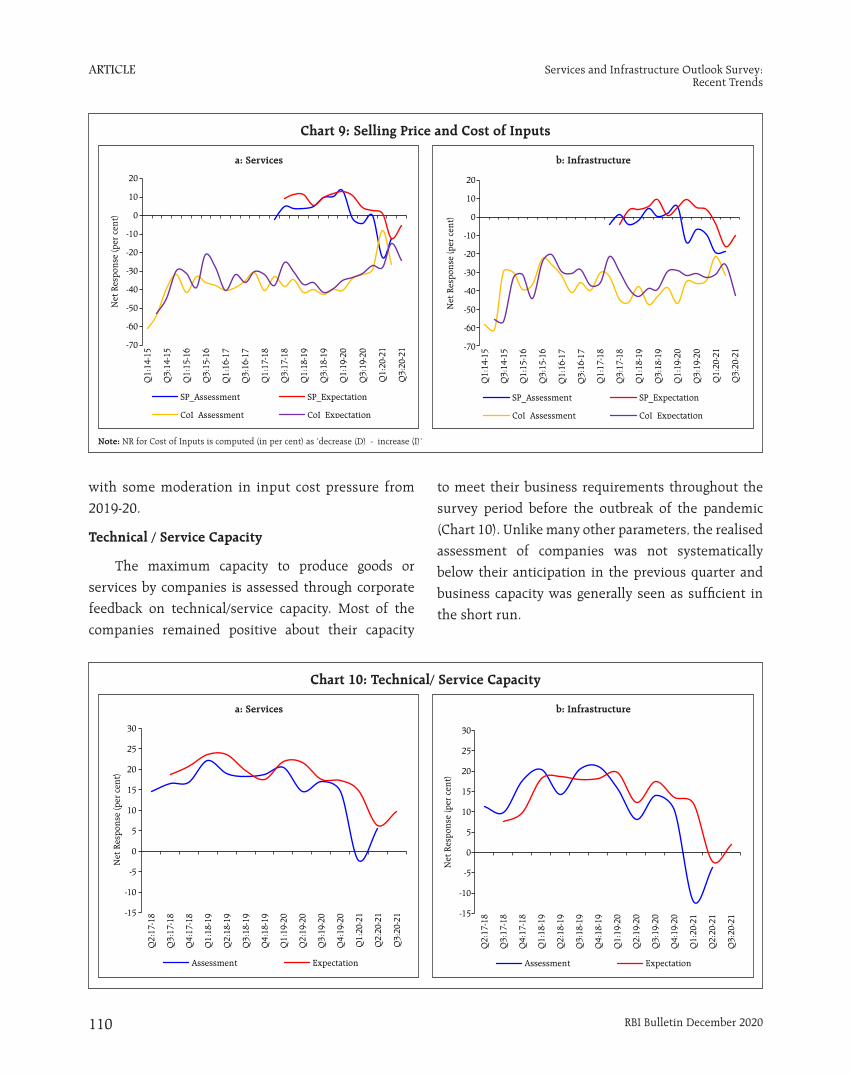
Selling Price and Cost of Inputs
The selling price (SP) parameter, which
was added to the survey questionnaire during
Q2:2017-18, captures the price of the services / goods
Chart 6: Inventories
a: Services b: Infrastructure
5 Cost of finance includes interest paid to banks/financial institutions/business partners, etc., and does not include funds that are ploughed back to business from surplus profit.

ARTICLE
RBI Bulletin December 2020 109
Services and Infrastructure Outlook Survey: Recent Trends
sold. Perception on the cost of inputs (CoI), which is
being collected from the first round of the survey,
covers the prices paid by the company for carrying
out business. Respondents reported large input
cost pressures (with maximum NR scale among all
parameters) and low pricing power till 2019-20,
which reflected the constraints in raising selling
prices over a prolonged period (Chart 9). Sentiments
on SP, which generally share an inverse relationship
with CoI on a net basis, showed a declining trend
Chart 7: Availability of Finance and Cost of Finance
a: Services b: Infrastructure
Chart 8: Salary/ Wages
a: Services b: Infrastructure
Note: NR for Cost of Finance (in per cent) is computed as ‘decrease (D) - increase (I)’.
Note: NR for Salary/ Wages is computed (in per cent) as ‘decrease (D) - increase (I)’
ARTICLE
RBI Bulletin December 2020110
Services and Infrastructure Outlook Survey: Recent Trends
with some moderation in input cost pressure from
2019-20.
Technical / Service Capacity
The maximum capacity to produce goods or
services by companies is assessed through corporate
feedback on technical/service capacity. Most of the
companies remained positive about their capacity
to meet their business requirements throughout the
survey period before the outbreak of the pandemic
(Chart 10). Unlike many other parameters, the realised
assessment of companies was not systematically
below their anticipation in the previous quarter and
business capacity was generally seen as sufficient in
the short run.
Chart 9: Selling Price and Cost of Inputs
a: Services b: Infrastructure
Chart 10: Technical/ Service Capacity
a: Services b: Infrastructure
Note: NR for Cost of Inputs is computed (in per cent) as ‘decrease (D) - increase (I)’

ARTICLE
RBI Bulletin December 2020 111
Services and Infrastructure Outlook Survey: Recent Trends
Physical Investment
Infrastructure sector companies, hotels, hospitals,
education institutes, software firms and other service
sector companies make physical investment in
acquiring building, equipments and other fixed assets.
The sentiments on physical investment were largely
akin to those for technical and service capacity, which
reflected consistent internal planning and confidence
among the respondent firms (Charts 10 and 11).
Profit Margin
Up to 2019-20, on a net basis, service companies
were generally optimistic about profit margins for the
next quarter though the subsequent assessment were
not so positive; infrastructure companies expressed
lesser optimism than service sector companies
with expectations hovering around zero (Chart 12).
During 2020-21, both groups of companies expressed
negative outlook on profit margins, though there was
Chart 11: Physical Investment
a: Services b: Infrastructure
Chart 12: Profit Margin
a: Services b: Infrastructure

ARTICLE
RBI Bulletin December 2020112
Services and Infrastructure Outlook Survey: Recent Trends
decline in pessimistic sentiments during the third
quarter of the year from the sharp drop observed in
first quarter.
V. Conclusion
SIOS provides business sentiments of the services
and infrastructure sectors ahead of corporate results
and official statistics. Its response rate is lower than
that of other forward looking surveys of the Reserve
Bank for the manufacturing sector and banks but the
responses on major parameters have broad internal
consistency. Similar to manufacturing companies, the
outcome assessment of companies in the services and
infrastructure sectors has been lower than their initial
expectations.
Most of the business parameters in the services
and infrastructure sector were severely hit in
Q1:2020-21 due to the lockdown and economic
slowdown related to the pandemic. Business
sentiments have moved to a recovery path in the
subsequent survey rounds but are yet to reach the pre-
pandemic levels across all parameters.
References
Banca di Italia (2017), “Survey on Industrial and
Service Firms – Methods and Sources”https://www.bancaditalia.it/pubblicazioni/metodi-e-fonti-note/metodi-note-2017/en_survey_methodology_invind.pdf
Bank of England (2017), Definitions for the Agents’
scores https://www.bankofengland.co.uk/-/media/boe/files/agents-summary/definitions.pdf?la=en&hash=73F78FCEFBE9B8FA55F11C42F39EBE1306039165
Bank of Japan (2020), TANKAN (Short-Term Economic
Survey of Enterprises in Japan), May https://www.boj.
or.jp/en/statistics/outline/exp/tk/data/extk04a.pdf
Banque de France, http://www.banque-france.fr/en/economics-statistics/business-and-survey/business-surveys.html
Bloom, Nick, Philip Bunn, Paul Mizen, Pawel
Smietanka, Greg Thwaites, Garry Young (2017),
“Tracking the views of British businesses: Evidence
from the Decision Maker Panel”, Bank of England
Quarterly Bulletin 2017 Q2.
Organisation for Economic Co-operation and
Development (OECD) (2003), “Business Tendency
Surveys - A Handbook”.
Reserve Bank of India (2009), “Report of the Working
Group on Surveys”, Reserve Bank of India Bulletin,
September.
Reserve Bank of India (2020), “Sentiments of Indian
Manufacturers in 2018-19”, Reserve Bank of India
Bulletin, February.
European Commission (2020), “The Joint Harmonised
EU Programme of Business and Consumer Surveys
– User Guide”, Directorate-General For Economic
and Financial Affairs (updated in February 2020).
https://ec.europa.eu/info/business-economy-euro/indicators-statistics/economic-databases/business-and-consumer-surveys/methodology-business-and-consumer-surveys_en
Federal Reserve Bank of Dallas, “About the Texas
Service Sector Outlook Survey”. https://www.dallasfed.org/research/surveys/tssos/about.aspx
Waddell, Sonya Ravindranath (2015), “Predicting
Economic Activity through Richmond Fed Surveys”
Econ Focus, Federal Reserve Bank of Richmond.

ARTICLE
RBI Bulletin December 2020 113
Services and Infrastructure Outlook Survey: Recent Trends
Institution Frequency Participating firms
Sample size
Coverage of items
Banque de France
Monthly Manufacturing, services,
construction and retail trade
10000 Assessment of economic conditions in the month preceding the publication, together with a GDP growth forecast for the quarter is collected.
Federal Reserve Bank of Dallas
Monthly Service firms 230 Changes in business conditions for major indicators (e.g., revenue, employment, prices and company outlook) and perception on broader economic conditions (general business activity). Answers cover changes over the previous month and expectations for activity six months into the future.
Federal Reserve Bank of Richmond
Monthly Retailers and service firms
Around 100 Retailers provide information on sales revenues, big-ticket sales, inventories, and shopper traffic, whereas services firms report on their revenues. Both sets of respondents also provide information on employment and wages, prices, and expectations for customer demand during the next six months.
Bank of Japan
Quarterly Firms 10000 Business trends of enterprises, overall corporate activity by combining with a judgment survey, which covers the responding enterprises' views on the current state of and outlook on business conditions and economic developments, and a quantitative survey covering the actual results and forecasts for the responding enterprises' business plans, including figures for sales, profits, and fixed investment.
Bank of Italy Annual Industrial and service firms
5000 Employment, investment (both actual and planned), turnover, capacity utilisation, debt and trade receivables. It also collects information on other economic questions, which are of particular interest for economic research and vary from year to year (e.g., corporate strategies and governance, firm size, physical, human and organisational capital, and electric power).
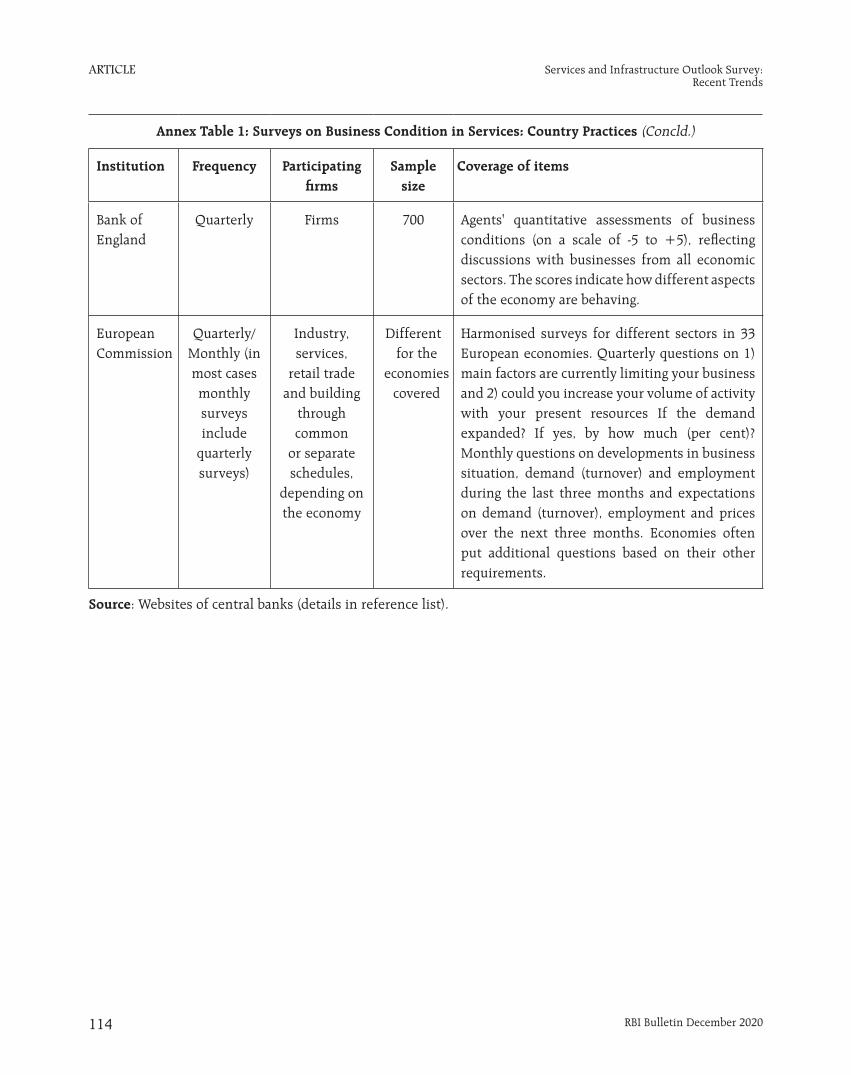
Annex Table 1: Surveys on Business Condition in Services: Country Practices (Contd.)
ARTICLE
RBI Bulletin December 2020114
Services and Infrastructure Outlook Survey: Recent Trends
Institution Frequency Participating firms
Sample size
Coverage of items
Bank of England
Quarterly Firms 700 Agents' quantitative assessments of business conditions (on a scale of -5 to +5), reflecting discussions with businesses from all economic sectors. The scores indicate how different aspects of the economy are behaving.
European Commission
Quarterly/ Monthly (in most cases monthly surveys include
quarterly surveys)
Industry, services,
retail trade and building
through common
or separate schedules,
depending on the economy
Different for the
economies covered
Harmonised surveys for different sectors in 33 European economies. Quarterly questions on 1) main factors are currently limiting your business and 2) could you increase your volume of activity with your present resources If the demand expanded? If yes, by how much (per cent)? Monthly questions on developments in business situation, demand (turnover) and employment during the last three months and expectations on demand (turnover), employment and prices over the next three months. Economies often put additional questions based on their other requirements.
Source: Websites of central banks (details in reference list).
Annex Table 1: Surveys on Business Condition in Services: Country Practices (Concld.)