service standards and performance measures 2014
TRANSCRIPT

SERVICE STANDARDS AND
PERFORMANCE MEASURES
2014 EDITION
April 2014

Sound Transit Service Standards and Performance Measures 2014 Edition 2

Sound Transit Service Standards and Performance Measures 2014 Edition 3
Table of Contents
INTRODUCTION...................................................................................................................................... 5 PURPOSE ................................................................................................................................................................... 5 BACKGROUND ........................................................................................................................................................... 5
Changes and additions to Service Standards and Performance Guidelines since the 2010 Edition ......................... 5
ST EXPRESS BUS SERVICE STANDARDS ......................................................................................... 6 A. ST EXPRESS SERVICE CONCEPT ............................................................................................................................. 6 B. ST EXPRESS SERVICE DESIGN GUIDELINES ............................................................................................................ 7
1. Routing on Streets and Highways .................................................................................................................... 7 2. Key Transfer Points .......................................................................................................................................... 7 3. Service Span ..................................................................................................................................................... 8 4. Route Headways .............................................................................................................................................. 8 5. Directness of Travel .......................................................................................................................................... 9 6. Deviations......................................................................................................................................................... 9 7. Short Turns ....................................................................................................................................................... 9 8. Duplication of Service ...................................................................................................................................... 9 9. Route Anchors .................................................................................................................................................. 9 10. Route Terminals and Layover Areas ............................................................................................................. 10 11. Schedule Efficiency ....................................................................................................................................... 10 12. Rail-Bus Integration ...................................................................................................................................... 10 13. Bus Stop Spacing .......................................................................................................................................... 10 14. Minimum Passenger Amenities ................................................................................................................... 11
C. ST EXPRESS SERVICE EVALUATION AND ADJUSTMENT PROCESS ....................................................................... 12 1. Service Changes.............................................................................................................................................. 12 2. Title VI Evaluation .......................................................................................................................................... 12 3. Service Implementation Plan ......................................................................................................................... 13 4. Comprehensive Operational Analysis ............................................................................................................ 13 5. Ongoing Analysis and Evolution ..................................................................................................................... 13 6. Evaluation of Service Requests ...................................................................................................................... 13 7. Comparative Evaluation ................................................................................................................................. 13 8. Trial Period for New Routes ........................................................................................................................... 14 9. Service Quality Guidelines .............................................................................................................................. 14 10. Passenger Load Guidelines ........................................................................................................................... 14 11. On-Time Performance Review ..................................................................................................................... 15 12. System Productivity and Effectiveness ........................................................................................................ 15 13. Route-Level Productivity Ratings ................................................................................................................. 16 14. Other Productivity Considerations ............................................................................................................... 17 15. Special Bus Service ....................................................................................................................................... 18
SOUNDER COMMUTER RAIL SERVICE STANDARDS ................................................................. 19 A. SOUNDER SERVICE CONCEPT.............................................................................................................................. 19 B. SOUNDER SERVICE DESIGN ................................................................................................................................. 20 C. SOUNDER SERVICE EVALUATION AND ADJUSTMENT PROCESS ......................................................................... 21
1. Service Changes.............................................................................................................................................. 21 2. Title VI Evaluation .......................................................................................................................................... 21 3. Service Quality Guidelines .............................................................................................................................. 21 4. Passenger Load Guidelines ............................................................................................................................. 22 5. Productivity and Peer Agency Comparisons .................................................................................................. 22 6. Special Train Service ....................................................................................................................................... 22

Sound Transit Service Standards and Performance Measures 2014 Edition 4
TACOMA LINK LIGHT RAIL SERVICE STANDARDS ................................................................... 24 A. TACOMA LINK SERVICE CONCEPT ....................................................................................................................... 24 B. TACOMA LINK SERVICE DESIGN .......................................................................................................................... 25 C. TACOMA LINK SERVICE EVALUATION AND ADJUSTMENT PROCESS................................................................... 26
1. Service Changes.............................................................................................................................................. 26 2. Title VI Evaluation .......................................................................................................................................... 26 3. Service Quality Guidelines .............................................................................................................................. 26 4. Passenger Load Guidelines ............................................................................................................................. 27 5. System Ridership and Productivity................................................................................................................. 27 6. Span of Service and Productivity by Time Period ........................................................................................... 27 7. Special Service ................................................................................................................................................ 29
CENTRAL LINK LIGHT RAIL SERVICE STANDARDS .................................................................. 31 A. CENTRAL LINK SERVICE CONCEPT ....................................................................................................................... 31 B. CENTRAL LINK SERVICE DESIGN .......................................................................................................................... 32 C. CENTRAL LINK SERVICE EVALUATION AND ADJUSTMENT PROCESS................................................................... 33
1. Service Changes.............................................................................................................................................. 33 2. Title VI Evaluation .......................................................................................................................................... 34 3. System Performance Metrics ......................................................................................................................... 34 4. Productivity and Peer Agency Comparisons .................................................................................................. 37 5. Passenger Load Guidelines ............................................................................................................................. 37 6. Extra and Special Service ................................................................................................................................ 38

Sound Transit Service Standards and Performance Measures 2014 Edition 5
SERVICE STANDARDS AND PERFORMANCE MEASURES 2014 EDITION
INTRODUCTION
PURPOSE
Service standards are a set of guidelines that are used to design, evaluate and modify transit
service. Because funding available for Sound Transit service is limited, there is a need to obtain
optimum efficiency and effectiveness out of each component of the system while maintaining or
improving the quality of service. In addition, the planning and day-to-day management of transit
service should be based on criteria that is explicit and yet flexible in interpretation and
application. These Service Standards are intended not as rigid planning rules but as a tool to
assist Sound Transit staff and Board members in making decisions about service.
BACKGROUND
Since 1998, Sound Transit has used the Service Standards and Performance Measures to help
plan and manage Sound Transit service. The standards provide guidelines for the service
evaluation and service change process. The ST Express section also includes detailed guidelines
for service design to ensure that Sound Transit bus routes reflect the characteristics of a high
speed, limited-stop regional system. The original 1998 standards were amended by the Sound
Transit Board in 2006 to include sections on Sounder commuter rail and Tacoma Link light rail.
The 2010 edition included a new section on service standards and performance measures for
Central Link light rail, together with updates of the ST Express bus standards.
Changes and additions to Service Standards and Performance Guidelines since the 2010 Edition
The major changes for the 2014 Service Standards and Performance Guidelines include revised
productivity measures for all modes that replace the “Purchased Transportation Cost Per
Boarding” measure with a “Subsidy Per Boarding” measure. This change also applies to Tacoma
Link, replacing the current “Operating Cost Per Boarding” measure with a “Subsidy Per
Boarding” measure as well. “Subsidy Per Boarding” is a standard industry productivity measure
that is tracked by the National Transit Database, or NTD, and it takes into account all operational
costs including facilities, administration, and purchased transportation or direct operating costs.
An new productivity measure has also been added, “Passenger Miles Per Platform Mile,” that
tracks how far people travel as well as how often people travel.
The 2014 Standards introduce peer agency comparisons that will provide industry benchmarks
for Sounder and Central Link productivity. Changes to the ST Express section provide a new
quartile ranking system for bus productivity, and new action thresholds are established for
passenger overloads on ST Express, Sounder and Central Link. A minor adjustment to ST
Express bus stop spacing has been made to include alightings as well as boardings in bus stop
placement considerations. Some minor changes in document organization, section subtitles, and
terminology have been made to provide for more document consistency, and the historical
narrative has been updated as needed for the modes.

Sound Transit Service Standards and Performance Measures 2014 Edition 6
ST EXPRESS BUS SERVICE STANDARDS
A. ST EXPRESS SERVICE CONCEPT
Sound Move, Sound Transit’s Phase I master plan, includes this description of the Regional
Express bus system (now called by the brand name “ST Express”):
Regional express bus services are high-speed routes that operate in both directions
throughout the day. These routes would operate primarily on existing, heavily traveled
state and federal Interstate corridors using HOV lanes and major arterials with necessary
improvements to maintain travel speeds and reliability consistent with Sound Move.
These corridors would provide substantially higher passenger capacity, speed and
service frequency than existing service. The routes would be provided in corridors
without rail service or in corridors where rail is planned (to help build a strong transit
market before the rail line is in place). When the rail system is extended along corridors
served by regional bus, the bus route may be eliminated to avoid duplicating service.
—Sound Move, Appendix D, Page D-4.
Sound Move also listed these specific characteristics of ST Express routes:
Serves a major travel corridor directly
Operates all day, every day
Runs frequently, generally with 15 minute two-way service
Operates at reasonably high speeds, generally averaging 18 to 20 m.p.h. with stops, using
HOV lanes and other systems giving priority to transit such as signal preemption when
available
Connects two or more of the designated urban centers in the Puget Sound Regional
Council Vision 2020 plan
Crosses city or county boundaries and carries a significant portion of passengers traveling
between jurisdictions
Provides connections to commuter rail, light rail, ferries, other express buses and local
service networks.

Sound Transit Service Standards and Performance Measures 2014 Edition 7
B. ST EXPRESS SERVICE DESIGN GUIDELINES
The direction provided by Sound Move has resulted in a unique type of transit service in the
Central Puget Sound region. ST Express routes are designed to provide fast, point-to-point public
transportation using direct paths between major activity centers. The activity centers served by
ST Express function both as trip destinations and as connection points to other bus and rail lines.
ST Express routes respond to a dispersed regional development pattern that requires faster, more
competitive travel times and convenient connections to access the region’s multiple activity
centers.
Transit bus service can take many forms. These service design guidelines were developed so that
Sound Transit express bus service reflects the operating parameters and service characteristics
described in Sound Move. They also provide service design continuity so that the system is more
easily understood and communicated to the public. The guidelines are indications of general
policy and are not intended to be a set of rigid design standards. They should be applied on a
case-by-case basis with consideration of the many factors that determine the optimum service
design.
1. Routing on Streets and Highways
ST Express routes should use High Occupancy Vehicle (HOV) lanes wherever possible in order
to minimize travel times and improve on-time performance. Other improvements such as special
HOV ramps connecting limited access highways with transit centers and park-and-ride lots
should also be utilized where available. When operating in mixed traffic, ST Express routes
should use designated state route limited access highways and major regional arterials. Operation
on secondary arterials and collector/distributor streets should be avoided except when needed to
access transit/HOV facilities, significant travel destinations, or turnaround loops.
2. Key Transfer Points
Vital to the success of the ST Express is the ability for passengers to access these routes from the
other transit systems in the Sound Transit service area. At key transit centers, connections
between ST Express routes and local routes will be coordinated to the maximum extent feasible.
Dwell time standards will be used for mid-route transfer points (see Section 11, Schedule
Efficiency). Schedules for ST Express routes should be designed to minimize connection times at
the key transfer points where significant numbers of transferring passengers access ST Express
service. Where more than one such location exists on an ST Express route, it may not be possible
to provide direct timed transfers at all locations. A number of techniques should be explored to
minimize waiting times in these situations, including:
Prioritizing each location based on actual or projected number of boardings and
alightings.
Offsetting the ST Express route schedule to equalize the transfer waiting times at
multiple transfer locations.
Providing more frequent service, such as 15-minute headways or better, at key times
when transfer volumes are greatest.
Other types of schedule coordination.
If these or other scheduling techniques are not feasible, then as a last resort the possibility of
modifying the transit center pulse times should be explored with the local operator. This would
Sound Transit Service Standards and Performance Measures 2014 Edition 8
normally be a consideration when all, or nearly all, of the schedules serving the transit center in
question are based solely on the transit center pulse times.
3. Service Span
The service span, or the hours of operation of an individual route, should be based on demand
and relate to the operating times of the activity centers being served and the service span of the
connecting local transit system. Some routes may operate only during weekday peak periods
while others may operate all day, seven days a week. Other routes may operate all day on
weekdays but provide no weekend service. As a general guide, three levels of service are defined
for different operating time periods:
Peak service is generally between the hours of 6:00 a.m. and 9:00 a.m., and between 3:00
p.m. and 6:00 p.m.
Base service is provided in the early morning from 5:00 a.m. and 6:00 a.m., in the mid-
day period between 9:00 a.m. and 3:00 p.m., and in the early evening period between
6:00 p.m. and 8:00 p.m. on weekdays, and between 6:00 a.m. and 6:00 p.m. on Saturdays.
Reduced service is between 8:00 p.m. and midnight on weekdays, from 6:00 p.m. to
midnight on Saturdays and from 6:00 a.m. to midnight on Sundays. Reduced service is
also operated on some holidays.
Service may be provided outside of these hours if there is a reasonable probability that expected
ridership will maintain or increase overall route productivity, using the performance indicators
described in the “Service Evaluation and Adjustment Process.”
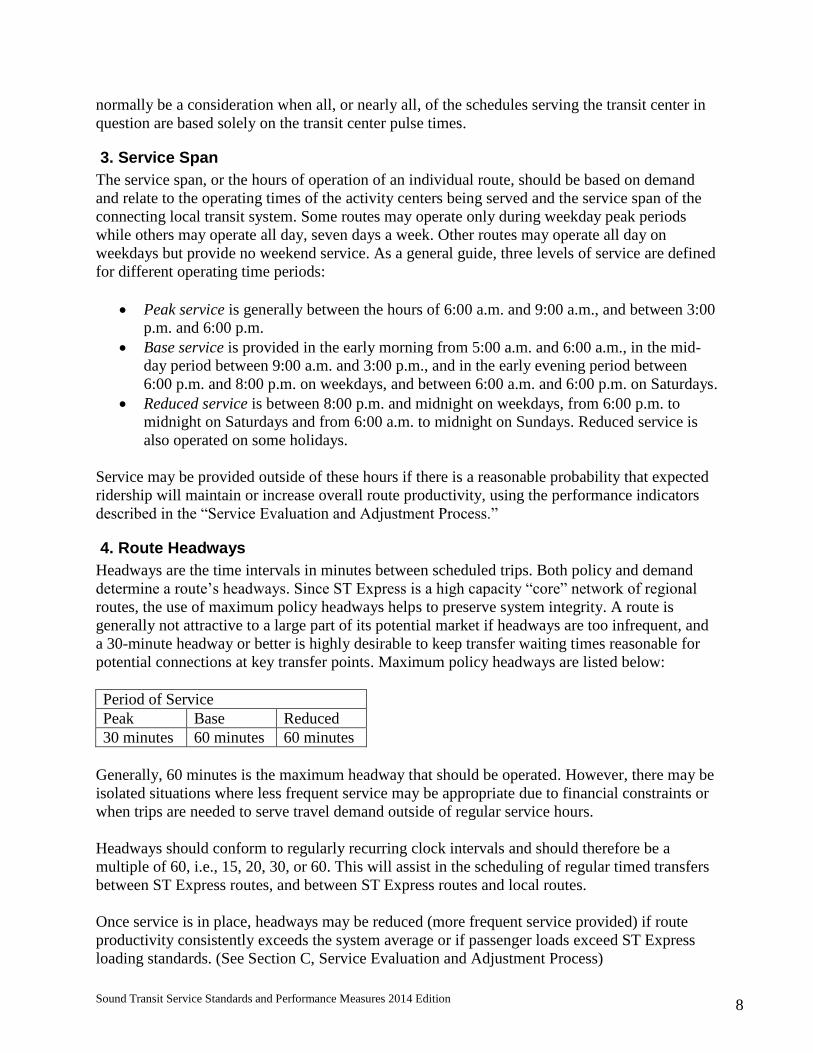
4. Route Headways
Headways are the time intervals in minutes between scheduled trips. Both policy and demand
determine a route’s headways. Since ST Express is a high capacity “core” network of regional
routes, the use of maximum policy headways helps to preserve system integrity. A route is
generally not attractive to a large part of its potential market if headways are too infrequent, and
a 30-minute headway or better is highly desirable to keep transfer waiting times reasonable for
potential connections at key transfer points. Maximum policy headways are listed below:
Period of Service
Peak Base Reduced
30 minutes 60 minutes 60 minutes
Generally, 60 minutes is the maximum headway that should be operated. However, there may be
isolated situations where less frequent service may be appropriate due to financial constraints or
when trips are needed to serve travel demand outside of regular service hours.
Headways should conform to regularly recurring clock intervals and should therefore be a
multiple of 60, i.e., 15, 20, 30, or 60. This will assist in the scheduling of regular timed transfers
between ST Express routes, and between ST Express routes and local routes.
Once service is in place, headways may be reduced (more frequent service provided) if route
productivity consistently exceeds the system average or if passenger loads exceed ST Express
loading standards. (See Section C, Service Evaluation and Adjustment Process)

Sound Transit Service Standards and Performance Measures 2014 Edition 9
5. Directness of Travel
One of the unique aspects of ST Express is that it provides relatively fast service between major
origins and destinations throughout the three-county service area. At certain times and in some
locations where HOV lanes are provided, travel times between consecutive stops are less than
that of a single-occupant automobile. However, most ST Express routes will have stops between
major generators that will tend to increase end-to-end travel times. Therefore, it cannot be
expected that all routes provide non-stop direct service between major generators with travel
times equal to or better than an automobile. In order to increase average transit speeds, the
Washington State Department of Transportation and local jurisdictions are encouraged to
provide priority treatments for high occupancy vehicles whenever possible.
The “Coefficient of Directness” is computed by dividing the travel time by transit between two
major generators by the travel time by automobile between the same two locations. This should
not exceed 1.33 for ST Express routes.
6. Deviations
Mid-route deviations that cause a route to backtrack, or significantly deviate from the most direct
route between major travel generators, should be avoided. In some instances, a deviation is
warranted because of potential ridership gains. In evaluating a proposed deviation it should be
determined that the total additional travel time for all through passengers should not exceed 10
minutes for each boarding and alighting along the deviation. This is expressed in the following
formula:
(Pt * T)/Pd ≤ 10 minutes
Pt = Number of through passengers
T = Addition vehicle travel time
Pd = Number of boardings and alightings on the deviation
7. Short Turns
Routes that experience a significant drop in demand at a certain point should be considered for
short turns. Short turns are selected trips scheduled to turn around before reaching the end of the
route, thus providing more capacity on the segment of the route with the greatest demand. Since
the objective for employing a short turn on a route is a more efficient utilization of resources, it
should not result in excessive layover.
8. Duplication of Service
Outside of major activity centers, operation of more than one route on the same street or a
closely parallel street should be avoided except where there is a high level of demand or HOV
lane or special transit priority treatment. Schedules of routes operating on the same street should
be coordinated to optimize service headways where feasible.
9. Route Anchors
Major trip generators located at the end of a route have a positive effect on ridership and can
“anchor” the route’s terminal at a logical location. Routes should be scheduled to serve peak
passenger demand at these locations.

Sound Transit Service Standards and Performance Measures 2014 Edition 10
10. Route Terminals and Layover Areas
Identifying a satisfactory bus layover location at a route terminal can be the most challenging
aspect of designing a new ST Express route or modifying an existing one. Capacity for layover
should always be evaluated when considering service changes that affect route terminals.
Existing off-street layover facilities should be identified and used to the greatest extent possible,
and bus layover needs should be addressed during the design process for new transit capital
projects such as transit centers, rail stations and park-and-ride lots.
11. Schedule Efficiency
When developing schedules, the amount of time allocated for layover should be a minimum of
15 percent of the total cycle time. A reasonable amount of additional layover time may be
provided as necessary to achieve clock headways. If it results in a lower vehicle requirement and
does not compromise schedule adherence, layover time can be reduced to between 10 and 15
percent of total cycle time. Layover should be avoided at locations where through passengers are
expected.
Dwell time at intermediate stops should be kept to the minimum time needed for passengers to
board and alight. Scheduled waiting should occur only for major pulse times at major transit
centers if five minutes or less. Local operators should be encouraged to schedule routes to
minimize dwell times at mid-route transfer locations. The predominant directional orientation of
passengers should be considered in efforts to minimize mid-route dwell time.
12. Rail-Bus Integration
ST Express routes should connect with commuter rail and light rail lines when there is a benefit
to passengers in terms of travel time, reliability and/or improved multi-destinational transfer
connections.
While Sound Transit is not responsible for planning local bus service, it strongly urges partner
transit agencies to develop bus route networks that optimize connections with Sounder commuter
rail and Link light rail, especially when such changes improve system productivity and provide a
net benefit to passengers in terms of travel time, frequency of service, transfer connections and
reliability.
13. Bus Stop Spacing
By definition, express routes make limited stops compared with local transit routes. Passenger
stops for ST Express routes should be limited to transit centers, major transfer points and park-
and-ride lots. Other stop locations may be considered on a case-by-case basis, but at a minimum,
each stop with all-day ST Express service should achieve at least 25 daily boardings or
alightings. ST Express stops with limited service span (less than 12 hours of service per day)
should achieve at least 15 daily boardings or alightings. In downtown Seattle and similar activity
centers with very high demand, there can be several closely-spaced stops to avoid sidewalk
overcrowding and provide increased geographic coverage.
The selection of ST Express stops should also take into consideration the availability of local
transit service on the corridor, the presence of major trip generators along the express route, the
location of transfer points with local routes, and the availability of transit-only or HOV lanes, or
other facilities that have the potential to increase operating speeds. Since a relatively small

Sound Transit Service Standards and Performance Measures 2014 Edition 11
portion of the bus stops that exist in the Sound Transit service area will be used for ST Express
routes, these stops should be clearly marked as locations where passengers may access this
system.
14. Minimum Passenger Amenities
Since ST Express routes provide connections with local bus systems, it is expected that many
passengers will be transferring. Also, the relatively high passenger volumes at ST Express stops
make them strong candidates for passenger amenities. At a minimum, all stops in the peak
boarding direction should have bus shelters or other means of weather protection for passengers
where feasible. Schedule information for ST Express routes should be displayed at all stops in
the peak boarding direction.
Sound Transit Service Standards and Performance Measures 2014 Edition 12
C. ST EXPRESS SERVICE EVALUATION AND ADJUSTMENT PROCESS
1. Service Changes
Changes to ST Express service generally occur in one of two ways:
Service Implementation Plan: The annual Service Implementation Plan (SIP), contains staff
recommendations for major service changes to be implemented during the upcoming calendar
year. Changes at the SIP level may have significant customer and budget impacts, and the SIP is
developed on a set schedule in lockstep with the agency budget. SIP recommendations are based
on the completion of new transit facilities, major changes in passenger demand patterns, and the
performance of individual routes as defined in the Service Standards. Feedback from board
members, local jurisdictions, other transit agencies or stakeholder groups may be incorporated
into the final SIP recommendations. The SIP requires Sound Transit Board approval for
implementation.
Administrative Service Changes: Minor service changes may be approved and implemented at
the staff administrative level. Changes that can be made administratively include:
Any single change, or cumulative changes, in a service schedule that affects the
established weekly service hours for a route by 25 percent or less.
Any change in route location that does not move the location of a stop by more than a
half mile.
In the presence of an emergency that requires change to established routes or schedules or
classes of service not meeting the above criteria, the Chief Executive Officer may
implement such change for the necessary period of time or until the Sound Transit Board
can establish a timeframe.
Other services, such as tripper service, limited, special and other types of transit routes,
may be established by the Chief Executive Officer, consistent with annual budget
appropriations and Section 15, Special Bus Service.
Typically, administrative service changes are implemented to address a near-term operational
issue, such as passenger overloads, on-time performance, transfer connections or traffic revisions
that affect routing. Feedback from customers, local jurisdictions, other transit agencies or
stakeholder groups may result in service changes that are implemented administratively.
Administrative changes are generally implemented at a regular tri-annual service change date
when drivers change assignments, and timetables are reprinted; however, they may be
implemented at other times depending on individual circumstances.
2. Title VI Evaluation
Pursuant to Title VI of the Civil Rights Act of 1964 and applicable state and local laws, no
person shall be subjected to discrimination on the basis of race, color or national origin in any
program or activity performed by or provided for Sound Transit. As part of its annual Draft SIP,
Sound Transit will assess the impacts of proposed major service changes on minority, low
income and limited English-speaking transit users and communities using methodology approved
by the Federal Transit Administration.

Sound Transit Service Standards and Performance Measures 2014 Edition 13
3. Service Implementation Plan
The annual SIP is the cornerstone of the ST Express system’s on-going service adjustment
process. It identifies recommended service modifications for the upcoming year based on
changes in travel patterns, route performance and the application of the Service Standards. It
includes a route-by-route report on the status of the system, an evaluation of the services
provided, recommended changes to the current routes, and performance objectives in the
upcoming year, including ridership and productivity targets. The types of changes proposed will
range from minor alignment or schedule adjustments to new or restructured routes. The initial
version of each year’s SIP will be issued as a draft. Changes may be incorporated during the
Sound Transit Board review process. Sound Transit Board approval is required for
implementation of the service changes included in the SIP.
4. Comprehensive Operational Analysis
At least every five years, Sound Transit will conduct a Comprehensive Operational Analysis
(COA) of the ST Express system. This will involve a detailed analysis of ridership patterns and
system operations. It will include on/off passenger counts of every trip on each route separately
for weekdays, Saturdays, and Sundays. A running time analysis and schedule adherence check
will also be performed. Five-year ridership trends will be reviewed on a systemwide and
individual route basis. The COA may include other market research activities as appropriate such
as on-board passenger surveys, telephone household surveys, and demographic analysis.
5. Ongoing Analysis and Evolution
In addition to the COA process, an ongoing analysis of schedule efficiency and ridership will be
conducted. This evaluation may result in minor adjustments to schedules, elimination or addition
of individual trips based on demand, schedule interlining changes, and other minor changes
identified by drivers, schedulers and other operations personnel. In general, changes at this scale
can be implemented administratively without Sound Transit Board action
(see Section 1, Service Changes).
6. Evaluation of Service Requests
Requests for new service and service changes will be evaluated in a systematic way to ensure
compliance with the Service Standards. If it appears that a proposal is consistent with the Service
Standards, it will move to the Comparative Evaluation phase (see Section 7, Comparative
Evaluation).
7. Comparative Evaluation
In conjunction with the annual SIP, a comparative evaluation of proposed new routes, service
additions or deletions, and proposed route changes will be conducted to determine the optimum
use of available resources. In this phase of the service evaluation process, it is determined
whether the resources used for poorly performing routes would be better utilized to improve
service on routes exceeding passenger load standards, those with high ridership levels, or others
that are not achieving the on-time performance standard. Proposed new routes, service requests
and other service modifications will also be considered in the comparative evaluation phase of
the process. Proposals that score well in this process will be candidates for inclusion in the Draft
SIP.

Sound Transit Service Standards and Performance Measures 2014 Edition 14
8. Trial Period for New Routes
The trial period for new routes is 24 months in duration. At 24 months, a new route should reach
100 percent of the ridership levels projected at the beginning of the trial. New routes will then be
evaluated using the same performance measures as established routes. In conducting this
evaluation for new routes that fall in the poor performing categories for two or more measures,
ridership trends will also be considered.
9. Service Quality Guidelines
The Operations Department of Sound Transit publishes the Service Delivery Quarterly
Performance Report, which tracks agency progress in meeting the three key ST Express service
quality performance indicators described below. The report is published quarterly and available
online at www.soundtransit.org
Percentage of Scheduled Trips Operated Target
Systemwide, an average of 99.8 percent of all scheduled bus trips should be operated as listed in
the published timetable during each quarter and calendar year.
On-Time Performance Target
Systemwide, an average of 85.0 percent of all scheduled trips should arrive at route terminals
within seven minutes of the time shown in the published timetable, as recorded during each
quarter and calendar year.
Customer Complaints Per 100,000 BoardingsTarget
Systemwide, the number of customer complaints should not exceed 15.0 per 100,000 boardings,
as recorded during each quarter and calendar year.
10. Passenger Load Guidelines
During peak demand times, ST Express passenger loads often exceed bus seating capacity on
individual trips. Standing loads are a normal occurrence and is not by itself cause for immediate
action. Two indicators are used to measure the impact of passenger crowding, the load factor
(ratio between seated and standing passengers) and the number of minutes passengers have to
stand. The purpose of these guidelines is to assign priority for action at the trip level when
conditions exceed the thresholds for either of these two indicators.
Load Factor
Corrective action should be evaluated whenever the following load factors are exceeded on
individual bus trips on a regular basis (at least three days a week for weekday service, two times
a month for Saturday or Sunday service):
Bus Type Number of Seats Max. Passenger Load Load Factor
40’ High Floor 42 63 1.5
40’ Low Floor 37 55 1.5
45’ High Floor 57 70 1.23
60’ Low Floor 56 81 1.45
42’ Double Deck 77 95 1.23

Sound Transit Service Standards and Performance Measures 2014 Edition 15
Standing Time
Corrective action should be evaluated whenever standing time exceeds the following thresholds
on a regular basis (at least three days a week for weekday trips, two times a month for Saturday
or Sunday trips).
Minutes of Passenger Standing Time Action Priority
More than 45 minutes High priority; mitigating action should be
implemented as soon as possible; meets criteria
for use of budget contingency if available
30 to 44 minutes Medium priority; mitigating action should be
implemented at next regular service change
date if budget available
Less than 30 minutes No immediate mitigating action required, but
may be candidate for future service
improvement
These guidelines may be relaxed during temporary surges in demand or for special event service.
11. On-Time Performance Review
A key success factor for ST Express is providing convenient and reliable transfers together with
schedules the public can depend on. In order to identify routes with serious on-time performance
issues, Sound Transit will conduct an annual comprehensive assessment of on-time performance
using automatic passenger count data samples together with spot on-street monitoring. The
assessment will be based on data collected over at least one service change period. The results of
the assessment will allow Sound Transit to rate each route for on-time performance and prioritize
where schedule maintenance hours and other actions that improve on-time performance should
be focused. Guidelines for on-time performance are listed below. The routes with performance
below the levels shown will be candidates for corrective action.
On-Time Performance Guidelines:
90 percent of bus trips on each route should depart the route terminus not more than three
minutes late and never early.
85 percent of bus trips on each route should depart each mid-route scheduled time point
not more than five minutes late and never early, except for estimated time points, where
buses are allowed to depart early.
90 percent of bus trips on each route should arrive at the route terminus not more than
seven minutes late.
Note: These guidelines may be different from the standards included in the current service
agreements with the partner transit agencies. They are intended to assist Sound Transit in
prioritizing schedule maintenance efforts. They do not change the on-time performance reporting
requirements called for in the agreements.
12. System Productivity and Effectiveness
As part of the annual SIP and Sound Transit budget process, goals are established for ST Express
ridership, productivity and effectiveness each calendar year. The Operations Department’s

Sound Transit Service Standards and Performance Measures 2014 Edition 16
Service Delivery Quarterly Performance Report, available at www.soundtransit.org, provides a
regular “snapshot” of Sound Transit’s progress in meeting these goals.
13. Route-Level Productivity Ratings
The route-level productivity and effectiveness review is intended as a planning tool to rate
individual ST Express routes. Routes are rated by comparing their performance in four key areas
with the performance of the ST Express system as a whole. The objective is a quantitative, first
level screening process to flag service that may be reducing system productivity and that may
require remedial actions. Routes consistently performing well below average could be subject to
a number of actions, including frequency reduction, service span revision, realignment,
rescheduling, route consolidation or other restructuring, extensive marketing efforts, or deletion.
Conversely, routes with a consistent above-average performance may be candidates for
additional trips or other actions that increase service levels and capacity.
It should be emphasized that the route effectiveness ratings are only one of several tools used in
the service evaluation process. Other factors, such as system integration, the length of time
service has been operating and service to transit-dependent populations may be considered by
Sound Transit staff and board members in making decisions about service.
a. Performance Indicators
For purposes of the SIP route rating process, productivity and cost effectiveness will be assessed
using these three performance indicators:
Boardings per revenue hour
Boardings per trip
Subsidy per boarding
Passenger miles per platform vehicle mile
Boardings per revenue hour is the number of passengers boarding a vehicle during one hour of
scheduled revenue service, not including vehicle deadhead or layover time.
Boardings per trip are the number of passengers boarding each scheduled one-way trip.
Subsidy per boarding is calculated by dividing the net cost of the service (cost minus fare
revenue) by the number of passenger boardings for a full year.
Passenger miles per platform vehicle mile is calculated by dividing passenger miles by the
number of vehicle platform miles travelled for a full year.
b. Frequency of Route-Level Review
All ST Express routes will be rated for productivity and effectiveness at least once a year, and
the results will be included in the annual SIP. Data from at least one full quarter but not more
than one full year will be used to calculate system performance and the performance of
individual routes. Routes will be rated more frequently if ridership trends are consistently
negative, special requests for service are received, or other special circumstances are noted.

Sound Transit Service Standards and Performance Measures 2014 Edition 17
c. Ratings by Time Period
Ratings will be calculated for each of the following time periods:
All periods of route operation combined
Weekday only
Saturday only
Sunday/Holiday only
d. Productivity Rankings
ST Express routes are sorted and ranked by their performance in each of the four indicators:
boardings per revenue hour, boardings per trip, subsidy per boarding, and passenger miles per
platform vehicle mile. The 26 routes receive a ranking of 1-26 for each indicator, and a route’s
combined performance in the four indicators becomes its overall ranking.
A route’s overall ranking determines where it falls in the four quartiles:
First Quartile – top 25%
Second Quartile – within normal operational parameters
Third Quartile – within normal operational parameters
Fourth Quartile – bottom 25%
Routes in the First Quartile, or top 25 percent, are typically high performers and the most
crowded. Routes in the Fourth Quartile, or bottom 25 percent, are typically the poorest
performers and have the lowest ridership. Routes falling in the Second or Third Quartile, or 50
percent of the routes, are typically considered to be operating within normal parameters.
Routes that rank in the Fourth Quartile may be candidates for actions to improve productivity
and cost effectiveness. Types of actions that could be considered include marketing/promotion
programs, selective deletion of unproductive route segments or trips, complete restructuring or
complete discontinuance of the route.
Routes that rank in the First Quartile may be candidates for service enhancements if resources
are available, particularly if performance has shown a consistent upward trend.
While ranking a route’s performance is an important tool in managing service, it is in no way the
only tool. Service Planners also may look into a route’s performance at the trip level based on
customer feedback and/or field observation and make small adjustments as practical.
14. Other Productivity Considerations
In some instances, it may be in the public interest to maintain a poorly performing route or route
segment in order to meet a special objective for the system. For example, an ST Express route
may provide the only transit access to a vital social service facility. Also, new development or
transit facilities that are likely to generate ridership can also be considered. This could include
new shopping centers, offices or other employment sites, park-and-ride lots, and HOV lanes or
ramps.
Sound Transit Service Standards and Performance Measures 2014 Edition 18
15. Special Bus Service
A key Sound Transit objective is improving regional mobility for a variety of trip purposes
(Sound Move, The Ten-Year Regional Transit System Plan, page 10). If special service helps to
achieve a significant transit mode share at a major event, the service provides a public benefit by
relieving pressure on major highways and parking facilities near the event venue (Sound Move,
Appendix C, page C-12).
“Special service” is distinct from “extra service,” which is bus service added to regular routes to
prevent overloads due to major surges in ridership. Extra service is needed when ridership is
expected to temporarily exceed the capacity of regularly scheduled service due to major events,
service disruptions or other temporary circumstances. Sound Transit’s transit agency partners
work with ST Express staff to decide whether extra service should be operated based on traffic
conditions, the scale of the event or service disruption and previous operational experience. The
cost of the extra service is included in the agency budget for ST Express.
“Special service” is an infrequent service not using regular ST Express routing and stops. Charter
service, defined as demand-response passenger bus service provided at the request of an outside
party at a negotiated price, is one kind of special service. As an agency policy, Sound Transit
does not provide charter service. However, other kinds of special bus service operation are
needed from time to time in the course of regular transit agency business including:
Field trips to survey routes and schedules of existing or planned ST Express routes or to
survey route safety assessments and accident investigations.
Road tests in the course of everyday vehicle maintenance activities.
Transportation of Sound Transit employees, other transit agency employees, transit
management officials, transit contractors and bidders, government officials and their
official guests to or from facilities or projects within the Sound Transit service area for
the purpose of conducting oversight functions such as inspection, evaluation, or review,
or for the purpose of emergency preparedness planning and training. Service of this
nature is limited to 80 vehicle hours per calendar year.
“Bus bridge” service necessary during rail service disruptions.
Bus transportation required during emergencies.

Sound Transit Service Standards and Performance Measures 2014 Edition 19
SOUNDER COMMUTER RAIL SERVICE STANDARDS
A. SOUNDER SERVICE CONCEPT
In September 2000, Sound Transit introduced commuter rail as a new mode of public
transportation in the Central Puget Sound region. Commuter rail utilizes existing railroad lines to
provide high-capacity rail passenger service during peak travel demand times. Quoting from
Sound Move, “Commuter rail builds on a railroad network already in place, increasing the
transportation system’s people-moving capacity and, by making necessary track and signal
improvements, improving the capacity of those lines for other passenger and freight trains as
well.” Commuter rail provides dependable, on-time service since the tracks it uses have a high
degree of grade separation and fully protected at-grade road crossings with signals and crossing
gates. In many cases, commuter rail provides a faster, more direct route between communities
than parallel highway corridors.
Commuter rail trains have the ability to move large volumes of people. One car has seats for at
least 145 passengers, and a seven-car train can carry over 1,000 passengers. Thus, each new train
trip adds significant capacity to the system.
Using the brand name “Sounder,” Sound Transit commuter rail service is provided on two lines:
The North Line between Seattle and Everett, with intermediate stations at Edmonds and
Mukilteo, and the South Line between Seattle and Lakewood, with intermediate stations at
Tukwila, Kent, Auburn, Sumner, Puyallup, Tacoma and South Tacoma. Sounder currently
operates on railroad tracks owned by BNSF Railway, except for the segment between Tacoma
and Lakewood which is owned by Sound Transit.
The focal point of the two Sounder lines is the King Street Station at the south end of downtown
Seattle. The only Sounder station in Seattle, King Street Station has very frequent connecting bus
service to other parts of the downtown area and express bus connections to points throughout the
region. Connections are also made at King Street with numerous employer shuttles and Amtrak
intercity trains. Sounder passengers can also connect with Central Link light rail trains one block
away at the International District Station.
At outlying stations, commuter rail depends heavily on park-and-ride lots to provide customer
access to the service. Park-and-ride facilities are provided at all Sounder stations except King
Street. All stations are also served by connecting bus routes and have bus loading and layover
facilities.

Sound Transit Service Standards and Performance Measures 2014 Edition 20
B. SOUNDER SERVICE DESIGN
The service design for Sounder commuter rail was largely defined in Sound Move, Sound Transit
2 and operating agreements with the host railroad, BNSF. Relatively little flexibility exists to
restructure the Sounder route network. The large investment in infrastructure and rolling stock,
together with the operating agreements with BNSF, largely define the routes, stops and the level
of service that can be provided.
Under an agreement with BNSF approved in 2010, Sound Transit is phasing in four new round
trips on the South Line. The first new round trip was implemented in September 2013, and the
second and third round trips are planned for late 2016 start-up. The fourth and final round trip is
planned for late 2017. When implementation is complete, there will be 26 weekday round trips
scheduled on the South Line. No changes in service levels are planned for the North Line at this
time.

Sound Transit Service Standards and Performance Measures 2014 Edition 21
C. SOUNDER SERVICE EVALUATION AND ADJUSTMENT PROCESS
1. Service Changes
Changes to Sounder service generally occur in one of two ways:
Service Implementation Plan: The annual Service Implementation Plan (SIP), contains staff
recommendations for major service changes to be implemented during the upcoming calendar
year. Examples of changes at the SIP level are the addition or deletion of individual Sounder
train trips or stations. SIP changes generally have a financial impact, and the SIP is developed on
a set schedule in lockstep with the agency budget. SIP recommendations related to Sounder
service are generally driven by the completion of new stations, progress on track and signal
improvements, or the implementation of new round trips on the South Line as programmed in
Sound Transit 2. Feedback from board members, local jurisdictions, other transit agencies or
stakeholder groups may be incorporated into the final SIP recommendations. The SIP requires
Sound Transit Board approval for implementation.
Administrative Service Changes: Minor schedule adjustments and changes to train consists
(lengths) may be implemented at the staff administrative level. Decisions on special event trains
may also be made administratively, subject to budget constraints (see Section 6. Special Train
Service).
2. Title VI Evaluation
Pursuant to Title VI of the Civil Rights Act of 1964 and applicable state and local laws, no
person shall be subjected to discrimination on the basis of race, color or national origin in any
program or activity performed by or provided for Sound Transit. As part of its annual Draft SIP,
Sound Transit will assess the impacts of proposed major service changes on minority, low
income and limited English-speaking transit users and communities using methodology approved
by the Federal Transit Administration.
3. Service Quality Guidelines
The Operations Department of Sound Transit publishes the Service Delivery Quarterly
Performance Report, which tracks progress in meeting three key Sounder service quality
performance indicators described below. The report is published quarterly and available at
www.soundtransit.org
Percentage of Scheduled Trips Operated Target
Systemwide, an average of 99.5 percent of all scheduled train trips should be operated as listed in
the published timetable during each quarter and calendar year.
On-Time Performance Target
Systemwide, an average of 95.0 percent of all scheduled trips should arrive at route terminals
within seven minutes of the time shown in the published timetable, as recorded during each
quarter and calendar year.
Customer Complaints Per 100,000 Boardings Target
Systemwide, the number of customer complaints should not exceed 15.0 per 100,000 boardings,
as recorded during each quarter and calendar year.

Sound Transit Service Standards and Performance Measures 2014 Edition 22
4. Passenger Load Guidelines
Increasing ridership may result in standing load conditions on Sounder trains during certain time
periods. The purpose of Sounder load guidelines is to ensure that most passengers will have a
seat for at least a majority of their trip. When standing load conditions occur three days a week
or more on scheduled commuter train trips, the target guideline is to limit standing time to 30
minutes or less. Limits to standing time do not apply to event trains, since each event is unique
and ridership cannot accurately be predicted in advance. Actions that could reduce standing time
include minor schedule adjustments to balance loads, adding cars to trains to increase capacity
and making passengers aware of other trains that may have available seats. New train trips
planned for the South Line in 2016-2017 will also provide added capacity.
The annual Service Implementation Plan (SIP) will document where the target load guidelines
have not been met during the previous calendar year.
5. Productivity and Peer Agency Comparisons
Sounder productivity is measured using the following four performance indicators:
Boardings per revenue train hour
Boardings per trip
Subsidy per boarding
Passenger miles per train platform mile
Operating results using these performance indicators will be reported each year in the Sound
Transit Service Implementation Plan (SIP). Results will be reported both for each line separately
(North and South) and the system as a whole.
In order to provide a basis of comparison with other commuter rail operations, the SIP will also
include comparisons with five peer agencies, using the same productivity indicators. The peer
agencies are:
Virginia Railway Express (Washington, D.C.)
Tri-Rail (Miami, FL)
Coaster (San Diego, CA)
North Star (Minneapolis, MN)
Altamont Commuter Express (Stockton-San Jose, CA)
Annual productivity data is available for these agencies through the NTD (National Transit
Database). The peer comparisons will be published in the SIP and will be based on the latest
available NTD data for the peer agencies. Peer performance will be compared with the Sounder
service as a whole and with the North and South lines individually. Over time, historical
information will also be shown illustrating performance trends at Sounder compared with the
peer agencies.
6. Special Train Service
A key Sound Transit objective is improving regional mobility for a variety of trip purposes
(Sound Move, The Ten-Year Regional Transit System Plan, page 10). If special service helps to
achieve a significant transit mode share at a major event, the service provides a public benefit by

Sound Transit Service Standards and Performance Measures 2014 Edition 23
relieving pressure on major highways and parking facilities near the event venue (Sound Move,
Appendix C, page C-12).
Special train service is a one-time or infrequent service designed to transport a large number of
passengers directly to an event venue and operates only during the specific time periods when
the event is generating demand. Provisions in Sound Transit’s agreements with the operating
railroads allow special trains to be operated on a limited basis, subject to crew availability and
freight traffic constraints.
Special event trains, while having the ability to move large numbers of people efficiently, are
expensive to operate and require a large operating, maintenance and security staff. To be
considered for special train service, events must meet the essential criteria listed below. Any
consideration of special train service is subject to the availability of budgetary resources;
meeting all the criteria does not guarantee that Sound Transit will provide special service.
The event must be open to the general public.
The event venue must be located adjacent to a Sounder station or other sites accessible
via high-capacity transit connections in downtown Seattle. .
The event service must carry at least 400 passengers per train trip.
The event service must be authorized by the operating railroads.
The event service must have adequate operating, maintenance and security staffing.
In addition to the essential criteria above, events with the following characteristics will be given
preference for consideration:
The event has definite start/finish times when the majority of attendees arrive and depart
the venue.
The event service covers a significant portion of its direct cost through fares, subsidies
from outside parties, in-kind services, promotional trades or a combination of these
sources.
The event service mitigates congestion on regional highways and reduces parking
requirements in the vicinity of the event venue.
The event service reduces passenger overloads on regular Sound Transit train and bus
service.
The event service attracts new customers, promotes Sound Transit, generates positive
media coverage and community goodwill.

Sound Transit Service Standards and Performance Measures 2014 Edition 24
TACOMA LINK LIGHT RAIL SERVICE STANDARDS
A. TACOMA LINK SERVICE CONCEPT
In the Regional Transit Long-Range Plan, Tacoma Link is envisioned as the downtown Tacoma
connection of a future Seattle-Tacoma light rail corridor. The current 1.6-mile stand-alone light
rail line provides many present-day benefits for downtown Tacoma—connecting five downtown
neighborhoods with each other and with regional transportation services at the Tacoma Dome
Station including Sounder commuter rail, ST Express buses and intercity buses. Tacoma Link
also connects public parking throughout downtown including 2,400 spaces at the Tacoma Dome
Station parking garage.
Tacoma Link operations are characterized by fast, efficient service, excellent on-time
performance and frequent headways. Low-floor light rail cars allow level platform boarding,
reducing dwell time at stations and facilitating access for passengers using wheelchairs. Cars
have a large total capacity (56 passengers), but have only 30 seats due to the short trip length.
Signal preemption and partial separation from other traffic makes it possible for Tacoma Link
cars to complete the trip from one end to the other in only seven to eight minutes. Since the line
is short, about half of its length (between Union Station/S.19th and Tacoma Dome Station) is
single track to reduce construction costs and right-of-way impact. Signal systems prevent two
trains from occupying the single track section simultaneously.

Sound Transit Service Standards and Performance Measures 2014 Edition 25
B. TACOMA LINK SERVICE DESIGN
The service design for Tacoma Link was largely defined during the systems design process.
There are six stations: Theater District/S. 9th; Commerce Street/S. 11th
; Convention Center/ S.
15th; Union Station/S. 19th; S. 25th Street; and Tacoma Dome Station. Compared with ST
Express bus, there are few options for adjusting service levels or capacity. Stations require street
right-of-way and are difficult and costly to add or relocate. Cars are single units that cannot be
coupled together with other cars to form trains, and the single track section effectively limits the
system to no more than two cars in operation at any one time. A 12-minute headway can be
operated with two cars, while one car can provide a 24-minute headway during periods of lower
demand. Thus, there are two options to change service levels: 1) adjust headways, and 2) adjust
span of service (the time period that service operates).

Sound Transit Service Standards and Performance Measures 2014 Edition 26
C. TACOMA LINK SERVICE EVALUATION AND ADJUSTMENT PROCESS
1. Service Changes
Changes to Tacoma Link service generally occur in one of two ways:
Service Implementation Plan: The annual Service Implementation Plan (SIP), contains staff
recommendations for major service changes to be implemented during the upcoming calendar
year. Changes at the SIP level may have significant customer and budget impacts, and the SIP is
developed on a set schedule in lockstep with the agency budget. Examples of potential Tacoma
Link SIP changes include any single change or cumulative change in schedules that affect more
than 25 percent of weekly service hours and any permanent or long-term closure of a station or
line segment. Feedback from board members, local jurisdictions, other transit agencies or
stakeholder groups may be incorporated into the final SIP recommendations. The SIP requires
Sound Transit Board approval for implementation.
Administrative Service Changes: Minor service changes may be approved and implemented at
the staff administrative level. Changes that can be made administratively include:
Any single change or cumulative change in schedules that affects the established weekly
service hours by 25 percent or less. This would include minor changes in trip times and
partnerships with outside parties to extend the span of service for special events.
Temporary closure of stations or line segments made necessary by construction, parades,
emergencies or other situations expected to be short-term. Buses may substitute for light
rail service during the closure.
2. Title VI Evaluation
Pursuant to Title VI of the Civil Rights Act of 1964 and applicable state and local laws, no
person shall be subjected to discrimination on the basis of race, color or national origin in any
program or activity performed by or provided for Sound Transit. As part of its annual Draft SIP,
Sound Transit will assess the impacts of proposed major service changes on minority, low
income and limited English-speaking transit users and communities using methodology approved
by the Federal Transit Administration.
3. Service Quality Guidelines
The Operations Department of Sound Transit publishes the quarterly Service Delivery Quarterly
Performance Report, which tracks progress in meeting the three key Tacoma Link service
quality performance indicators described below. The report is published quarterly and available
on-line at www.soundtransit.org.
Percentage of Scheduled Trips Operated Target
An average of 98.5% percent of all scheduled trips should be operated as shown in the published
timetable during each quarter and calendar year.
On-Time Performance Target
An average of of 98.5% of all scheduled trips should operate on schedule as shown in the
publiched timetable during each quarter and calendar year. A trip is late if it either departs a

Sound Transit Service Standards and Performance Measures 2014 Edition 27
terminal station more than three minutes late or arrives at a terminal station three or more
minutes late.
Customer Compliants Per 100,000 Boardings Target
The number of customer complaints should not exceed 15.0 per 100,000 boardings, as recorded
during each quarter and calendar year.
4. Passenger Load Guidelines
Since one-way trip time is only seven to eight minutes, standees are permitted, up to the
maximum car capacity of 56 passengers (30 seated plus 26 standee passengers, or a 2.0 load
factor). If standees regularly occur on five or more consecutive trips when 24-minute headways
are scheduled, this will trigger a review of the existing schedule and available budgetary
resources to determine if adjustments are necessary.
5. System Ridership and Productivity
The Service Delivery Quarterly Performance Report, described in Section 3, includes the
Tacoma Link ridership and productivity goals established in the Sound Transit budget for the
upcoming calendar year.
6. Span of Service and Productivity by Time Period
As a planning tool to evaluate ridership and productivity, Tacoma Link service is segmented into
time periods by time of day and day of the week. The productivity of the different time periods is
compared against the system average and then rated according to specific performance criteria.
The objective is a quantitative, first level screening process to flag service that may be reducing
system productivity and that may require remedial actions. Time periods that consistently
perform well below the system average could be subject to a number of actions including
increased marketing, small schedule adjustments to improve customer convenience or service
reductions (reduced span of service and/or 24-minute headways). Actions could also include a
review of alternative services available to passengers during the time period and comparisons
with bus service in the vicinity, reflecting both existing and potential new schedules. Conversely,
time periods with high average productivity and/or overcrowding may be candidates for a longer
span of service and/or 12-minute headways. The service span, or hours of operation, should be
based on demand and relate to the operating times of the activity centers being served and the
service span of the connecting transit systems.
a. Time Periods
For purposes of the SIP rating process, the following operating time periods are used:
Weekday Peak: From 6:00 a.m. to 9:00 a.m. and from 3:00 p.m. to 6:00 p.m.
Weekday Midday: From 9:00 a.m. to 3:00 p.m.
Saturday/Sunday: From start of service to 6:00 p.m.
Early Morning/Evening: Before 6 a.m. weekdays and after 6:00 p.m. any day
Holiday: From 10:00 a.m. to 6:00 p.m.

Sound Transit Service Standards and Performance Measures 2014 Edition 28
b. Productivity Indicators
For purposes of the SIP rating process, productivity and cost effectiveness will be assessed using
these four performance indicators:
Boardings per revenue hour
Boardings per trip
Subsidy per boarding
Passenger miles per train platform mile
c. Productivity Ratings
There are four productivity and effectiveness ratings for Tacoma Link time periods. The rating
categories and performance ranges for the first three criteria boardings per revenue hour,
boardings per trip and passenger miles per platform mile are shown in this table:
Rating Wkdy Peak
(% of system
av.)
Wkdy Mid
(% of system
av.)
Sat/Sun
(% of system
av.)
Early AM &
Evening (%
of system
av.)
Holiday
Above +150% 125-150% 100-125% 75-100% 75-100%
At+ 125-150% 100-125% 75-100% 50-75% 50-75%
At- 100-125% 75-100% 50-75% 25-50% 25-50%
Below <100% <75% <50% <25% <25%
This table shows the rating categories and performance ranges for the subsidy per boarding
criteria:
Rating Wkdy Peak
(% of system
av.)
Wkdy Mid
(% of system
av.)
Sat/Sun (%
of system
av.)
Early AM &
Evening (%
of system
av.)
Holiday
Above 50-75% 75-100% 100-125% 125-150% 125-150%
At+ 75-100% 100-125% 125-150% 150-175% 150-175%
At- 100-125% 125-150% 150-175% 175-200% 175-200%
Below >125% >150% >175% >200% >200%
d. Frequency of Review
Tacoma Link will be rated for productivity by time period at least once per year, and the results
will be included in the annual SIP. At a minimum, data from at least one full quarter but not
more than one full year will be used to calculate time period performance.
e. Methodology for Calculating Overall Ratings
Each performance rating is assigned a number:
1 for Above
2 for At+
3 for At-
4 for Below

Sound Transit Service Standards and Performance Measures 2014 Edition 29
These numbers are used to calculate the performance score in a process similar to that used for
calculating academic grade point averages. Here is a hypothetical example: During the most
recent quarter, the weekday midday time period achieved an Above rating in boardings per
revenue hour (score 1), an Above rating in boardings per trip (score 1), an At- rating in subsidy
per boarding (score 3) and an At- rating in O&M cost per boarding (score 3). The scores are
added together for a total of 8. This number is divided by 4 (the number of performance
indicators) to produce a final numerical score of 2.0, an overall At+ rating. The lower the number
the better the overall performance as shown in the following table:
Performance Rating Numerical Score
Above 1.0-1.5
At+ 1.5-2.5
At- 2.5-3.5
Below 3.5 or above
7. Special Service
A key Sound Transit objective is improving regional mobility for a variety of trip purposes
(Sound Move, The Ten-Year Regional Transit System Plan, page 10). If special service helps to
achieve a significant transit mode share at a major event, the service provides a public benefit by
relieving pressure on major highways and parking facilities near the event venue (Sound Move,
Appendix C, page C-12).
“Special service” is distinct from “extra service,” which is service added during regular hours of
operation to prevent overloads. Extra service is needed when an event is expected to generate so
much demand that more trips are needed to supplement regular service. For example, a second
Tacoma Link car may be placed in service when normally only one car is scheduled improving
headways from every 20 minutes to every 10 minutes. Sound Transit is generally aware of the
time periods when extra service is likely to be needed and budgets for it accordingly.
“Special service” in the context used here is a one-time or irregular service designed to transport
passengers to and from an event venue outside of regular Tacoma Link service hours. For
example, a large convention may be taking place jointly at the Tacoma Convention Center and
the Tacoma Dome with activities scheduled for both venues until 11:00 p.m. Special Tacoma
Link trips may be added after the regular service ends at 8:00 p.m. extending service until 11:00
p.m. or later.
Service outside of regular hours, while having the ability to move large numbers of people, is
expensive to operate and requires longer hours for operating, maintenance and security staff,
often working at overtime rates. To be considered for special service outside regular hours,
events must meet the following essential criteria. Any consideration of special service is subject
to the availability of budgetary resources; meeting all the criteria does not guarantee that Sound
Transit will provide the service.
The event service must be open to the general public.
The event venue(s) must be located close to a Tacoma Link station.
Productivity of the event service is expected to be equal to or better than the system
average.

Sound Transit Service Standards and Performance Measures 2014 Edition 30
The event service must have adequate operating, maintenance and security staffing.
In addition to these essential criteria, events with the following characteristics will be given
preference for special service:
A significant portion of the extended service cost is covered by direct payments from
outside parties, promotional trades or a combination of these resources.
The event service mitigates congestion on regional highways and reduces parking
requirements in the vicinity of the event venue.
The event service reduces passenger overloads on regular Sound Transit train and bus
service.
The event service attracts new customers, promotes Sound Transit, generates positive
media coverage and community goodwill.

Sound Transit Service Standards and Performance Measures 2014 Edition 31
CENTRAL LINK LIGHT RAIL SERVICE STANDARDS
A. CENTRAL LINK SERVICE CONCEPT
Central Link added a new form of high-capacity transit to the Central Puget Sound region when
it opened in July 2009. Using a mix of underground tunnels, elevated structures and separated
surface right-of-way, electric-powered Central Link trains serve the region’s highest ridership
transit corridors with frequent seven-day-a-week service. The initial Westlake Station–Tukwila
International Boulevard segment opened with 12 stations. In December 2009, service was
extended 1.7 miles from Tukwila to SeaTac/Airport Station, bringing the alignment to 15.6 miles
and 13 stations. Sea-Tac Airport is one of the top five activity centers in the region with over
15,000 employees. An additional 3.15 mile underground extension from Westlake to the
University of Washington is under construction and scheduled to open in 2016. When
completed, the U Link extension will serve the second largest activity center in the region (the
University District), and the neighborhood with the highest residential density in the state
(Capitol Hill). With voter approval of the “ST2” program in 2008, planning and design work is
underway on Link extensions north to Lynnwood, south to Redondo Beach/Star Lake, and east to
Bellevue and Overlake.
Central Link is clearly a high-capacity transit mode, with 95-foot long light rail cars capable of
accommodating 148 passengers (roughly 50/50 seated and standing). Individual cars can be
coupled together to form two-car, three-car or four-car trains with a capacity of almost 600
passengers. Car floors are level with station platforms, permitting efficient, unhindered loading
and unloading and unparalleled accessibility for people with disabilities. Travel time and
efficiency is also enhanced through the use of a proof-of-payment fare system, requiring that all
passengers purchase their ticket or pass before riding. Link trains can accelerate rapidly and
reach speeds of over 55 MPH.
Complementing the ease of boarding and deboarding is a light rail right-of-way designed to
provide fast, dependable service. Segments of the alignment running through tunnels and on
elevated structures are completely separated from other traffic (except in the downtown Seattle
tunnel, where buses share the right-of-way with trains). Trains operating on the three-mile
arterial median segment in Rainier Valley have partial signal priority at intersections. Curves and
grades along the alignment are designed for relatively high average speeds.
Central Link represents the largest single transit project in the region’s history. The Service
Standards provide guidelines and analytical tools to help manage Central Link service and make
the most effective use of this major public investment.

Sound Transit Service Standards and Performance Measures 2014 Edition 32
B. CENTRAL LINK SERVICE DESIGN
Central Link service design is focused on four key objectives: 1) Fast, frequent and dependable
service; 2) Adequate capacity to meet forecast demand; 3) Efficient, cost-effective operation; and
4) Allowance for future system growth.
Fast, frequent and dependable service is more likely to be achieved in a system that has its own
right-of-way. Most of the planned Link extensions will be in private right-of-way completely
separated from other traffic. Ultimately, the Downtown Seattle Transit Tunnel will become rail-
only, eliminating the delays and disruptions associated with joint rail-bus operations. Link signal
systems are designed to keep safe spacing between trains while allowing for service intervals as
close as every 3 minutes. With the high ridership demand expected as the Link network grows,
precision operation with trains running at consistent intervals will be critical to avoid
overcrowding.
Link service levels are based on the forecast ridership at the maximum load point during the peak
hour of travel. The time intervals between trains and the number of cars on each train are planned
based on the capacity needed to meet the future ridership demand at this point. The ridership
forecasts are developed using Sound Transit’s travel demand model, which uses a number of
variables to predict future ridership including travel time, population and employment. The
frequency of train service and the train lengths needed to meet the demand are the main
parameters that determine the light rail fleet size, base capacity, the number of employees
required and the total cost of operation.
Examples of efficient train operating practices include basing service levels on demand,
deploying trains where they are needed quickly with a minimum of deadhead time, and adjusting
train lengths up or down depending on passenger loads. In some cases, it may improve efficiency
to turn trains around before they reach their final terminus if demand on the outer end of the line
is relatively light; these “turnback” trains use special crossover tracks to reverse direction. The
infrastructure necessary to make the system efficient must be incorporated into plans during the
system design process.
Sound Transit’s Long-Range Plan (LRP) provides guidance on the future direction of light rail
extensions beyond the current funded program. The LRP provides the source material for
developing the next set of capital improvements to expand the Link network. For example, as
Link service is extended to Lynnwood, Overlake and Kent-Des Moines, provision is being made
in the system design to construct further extensions north, east and south, respectively.

Sound Transit Service Standards and Performance Measures 2014 Edition 33
C. CENTRAL LINK SERVICE EVALUATION AND ADJUSTMENT PROCESS
Central Link is designed to provide dependable, high-frequency transit service along the region’s
heaviest transit corridor. Development of the current alignment required many years of analysis,
community outreach and cooperation between multiple jurisdictions. While the alignment and
stations are fixed, the capacity and operating cost of Central Link service can be adjusted and
managed through changes in headway (frequency of service), train consists (one-, two-, three- or
four-car trains), and changes in the span of service.
Two documents have guided the operations planning for Central Link: The Central Link Rail
Fleet Management Plan and the Central Link Operations Plan—Initial Segment and Airport
Link. These documents are updated as new extensions are developed and as experience is gained
with existing operations.
Peak Period Service Levels
Peak period passenger flows are the key driver in planning system capacity and service levels.
System capacity parameters for the University-to-Angle Lake segment of Central Link, including
train lengths, fleet size and peak headways, were developed based on 2030 peak period ridership
projections. During the initial phase of operations planning, two-car trains operating a six-minute
peak headway were assumed for the Westlake-to-Airport segment, but experience with Link pre-
testing in 2009 showed that a seven- to eight-minute peak headway was optimum based on the
need for more familiarity with joint bus-rail operations in the downtown Seattle transit tunnel.
With the opening of the University Link extension in 2016, peak headways will be improved to
every six minutes to meet the anticipated passenger demand.
The Central Link Rail Fleet Management Plan set the desired upper limit of passenger load
standards during peak periods. It defined the maximum scheduled peak period load as 148
passengers per car (roughly 50/50 seated and standing). This is the equivalent to 4.4 square feet
per standing passenger and is considered to be a “comfortable standing load” in the Transit
Capacity and Quality of Service Manual (2nd
edition) published by the Transportation Research
Board. This load standard is used as a planning and evaluation tool for Central Link.
Off-Peak Service Levels
In contrast with the detailed strategies for planning peak period capacity, plans for off-peak
service levels on Central Link were driven more by policy and the regional goal of serving many
different kinds of travel needs. By local standards, Link trains operate frequently during all hours
of operation, running from early in the morning until late at night to attract new riders who
otherwise would not use public transportation. Except for surges in ridership caused by major
events, off-peak service levels on Central Link should be more than ample to meet demand.
1. Service Changes
Changes to Central Link service can occur in one of two ways:
Service Implementation Plan: The annual Service Implementation Plan (SIP) may include
major service changes recommended to the Sound Transit Board for implementation during the
upcoming calendar year. If circumstances require more immediate implementation of a major
service change, a separate motion may be presented to the board outside of the annual SIP
process. Major service changes may have significant customer and budget impacts. SIP service

Sound Transit Service Standards and Performance Measures 2014 Edition 34
change recommendations are based on the completion of new Central Link extensions and
stations, changes in passenger demand patterns and the productivity of the service as defined in
the Service Standards. Input from board members, local jurisdictions, transit agencies and other
stakeholder groups may be incorporated into the final SIP recommendations. The SIP requires
Sound Transit Board approval for implementation.
Administrative Service Changes: Minor service changes may be approved and implemented at
the staff administrative level as long as they are affordable within annual budget appropriations.
Changes intended to be permanent are implemented at regular service change dates that occur
three times per year (fall, spring and summer). Changes that are intended to be temporary may be
implemented at any time.
Permanent changes that can be implemented administratively at regular service change dates:
Scheduled headway adjustments of up to three minutes during specified times of the day .
Scheduled span of service time adjustments of up to 10 minutes (first train/last train
times).
The addition of up to six daily one-way trips to address overcrowding.
The deletion of up to six daily one-way trips to address low ridership/productivity.
Temporary changes that can be implemented administratively at any time:
Changes in train consists (the number of cars in each train).
Implementation of extra service needed for special events or service disruptions requiring
additional capacity for temporary periods.
Temporary headway adjustments and/or bus service substitutions required for
construction, maintenance, repairs, accidents or emergencies.
2. Title VI Evaluation
Pursuant to Title VI of the Civil Rights Act of 1964 and applicable state and local laws, no
person shall be subjected to discrimination on the basis of race, color or national origin in any
program or activity performed by or provided by Sound Transit. As part of its annual Draft SIP,
Sound Transit will assess the impacts of major service changes on minority, low income and
limited English-speaking transit users and communities using methodology approved by the
Federal Transit Administration.
3. System Performance Metrics
Sound Transit’s budget document sets specific service performance targets for each transit mode,
and performance results are reported in Sound Transit’s annual Service Implementation Plan
(SIP). For consistency with other transit systems, performance metrics follow standard National
Transit Database (NTD) terminology and definitions. The annual targets for Central Link service
cover the following performance areas:
Ridership
Total annual boardings
Average weekday boardings

Sound Transit Service Standards and Performance Measures 2014 Edition 35
Service Availability
Percentage of scheduled trips operated
Service Reliability
On-time performance and headway performance
Customer Service
Customer complaints
Safety
Preventable accidents
Ridership
Ridership is one of the most important indicators of transit effectiveness and is measured by
counting the total number of passenger boardings (sometimes called “unlinked passenger trips”)
for a given time period. A boarding is counted towards the ridership total each time a passenger
steps aboard a light rail vehicle. Ridership data is needed to calculate other important
performance metrics, such as cost per boarding. For Central Link, Total Boardings are reported
for each month, quarter and year, as are Average Weekday Boardings, an important indicator of
commuting trends. The annual budget will set a performance target for each of these ridership
indicators.
Service Availability
Central Link service availability is measured by tracking the percentage of trips actually operated
during a given time period compared with the number of scheduled (intended) trips. Rather than
set annually as part of the budget process, this metric has on ongoing performance target—98.5
percent of all scheduled trips should be operated during each quarter and calendar year.
Service Reliability
Several factors pose challenges in achieving dependable on-time performance on Central Link.
Unique among light rail systems worldwide, Central Link trains share a common right-of-way
with large volumes of buses in the Downtown Seattle Transit Tunnel (DSTT)—up to 60 buses
per hour, per direction during peak times. When bus service is disrupted in the DSTT, rail
service is generally disrupted as well. Buses and trains are separated by signal blocks in the
DSTT, a very important safety feature, but this necessarily delays service recovery when
disruptions occur. On any part of the system, sections of track may be shut down periodically for
planned construction, maintenance or repairs, forcing trains to use a single track for both
directions of travel. Opposing trains then have to use the single track one at a time until the next
crossover track is reached and signals are cleared. These factors and others, taken together with
the “learning curve” associated with any major light rail system start-up, suggest that a different
approach is needed to measure on-time performance—an approach that looks at both the
traditional schedule adherence measure and the ability to maintain advertised headways (time
intervals between trips).

Sound Transit Service Standards and Performance Measures 2014 Edition 36
Schedule Adherence
A Central Link train is considered late if it a.) Departs a terminal station more than one minute
late, or b.) Arrives at a terminal station three or more minutes late and is unable to make its
scheduled departure time for the next trip. The number of late trips will be tracked. The target
performance level, developed as part of the annual budget, will be expressed as the percentage of
trips operated on-time compared with the total number of trips operated.
Headway Adherence
Headways are the time intervals between train trips. During most hours of the day, Central Link
provides frequent scheduled headways of every 10 minutes or less. For most customers,
maintaining regular headways is more important than schedule adherence as relatively few
people are trying to catch a particular train in the schedule. Headway adherence is also important
during peak periods when very frequent service is provided and even spacing of trips is needed
to balance loads and avoid signal delays.
Headway adherence is defined as the percentage of time that the scheduled headway is
maintained or a more frequent headway than scheduled is maintained (up to three minutes). It is
not the same as schedule adherence as individual trains may be off schedule, but service may be
running at regular intervals that are as frequent as or better than the intended headway. A target
performance level for headway adherence will be developed during future annual budget
processes as more operating experience is gained.
Customer Service
Customer service issues and the effectiveness of transit agencies in addressing them is an
important performance area. Central Link performance is expressed as the number of complaints
received per 100,000 passenger boardings, with the target level set in the annual budget.
Safety
A commonly used metric for tracking safety performance is the number of preventable accidents
for a given number of miles operated. A “preventable” accident is one where the operating
employee(s) failed to do everything reasonable to prevent an accident. The standard for Central
Link is defined as the number of preventable accidents per 100,000 miles.
Progress in achieving these performance targets is tracked in the following regular system
reports:
The Service Delivery Quarterly Performance Report tracks progress on all of the service
performance targets in the annual budget. Comparisons are made with the same quarter a
year earlier and with the year-to-date budget targets. The 4th
Quarter report summarizes
the year-to-date performance compared with the previous year.
The annual Sound Transit Service Implementation Plan (SIP) includes a detailed
ridership and productivity analysis of Central Link. The SIP also includes updated
ridership forecasts for the coming year that are used to develop the agency budget.
These reports are available on-line at www.soundtransit.org.

Sound Transit Service Standards and Performance Measures 2014 Edition 37
4. Productivity and Peer Agency Comparisons
Productivity measures show how efficiently transit services are being used. Central Link
productivity is measured using the following four indicators:
Boardings per trip
Boardings per revenue train hour
Subsidy per boarding
Passenger miles per platform train mile
The annual agency budget will set a performance target for each of these indicators, and the
operating results will be reported each year in the Sound Transit Service Implementation Plan
(SIP). In order to provide benchmarks with other light rail operations, the SIP will also include
comparisons with five peer agencies, using the same productivity indicators. The peer agencies
are:
Hiawatha Line (Minneapolis, MN)
MetroLink (St. Louis, MO)
Santa Clara VTA (Santa Clara, CA)
MAX (Portland, OR)
Denver RTD (Denver, CO)
5. Passenger Load Guidelines
The characteristics of light rail make it possible to comfortably and efficiently accommodate
standing passengers. Compared with buses, light rail has relatively fewer stops, wider doors and
aisles, and a smoother, steadier ride. The average light rail trip distance is relatively short, so
when passengers have to stand it generally is for brief periods of time. Accordingly, Central Link
trains can routinely accommodate standees while still providing quality service. The general
guidelines below are intended to help in making short-term decisions on the passenger capacity
needed during different times of the day and week:
Standees are permitted, up to a maximum of 200 percent of seated capacity per train (a
2.0 load factor). This is the equivalent to 4.4 square feet per standing passenger and is
considered to be a “comfortable standing load” in the Transit Capacity and Quality of
Service Manual (2nd
Edition) published by the Transportation Research Board.
Passengers should not have to stand for more than 30 minutes under typical day-to-day
circumstances.
Corrective action should be evaluated whenever the 2.0 load factor or 30 minute standing
time is exceeded on a regular basis (at least three days a week for weekday service, and
twice a month for Saturday or Sunday service.)
During off-peak periods, schedules and consists should be designed to provide enough
seats for all passengers except when major events are scheduled, when construction or
maintenance work results in longer headways, or when service is disrupted due to
circumstances beyond Sound Transit’s control.
Load conditions will be monitored on a regular basis using a combination of automatic passenger
counter (APC) data, customer reports, and observations by Central Link operating personnel and

Sound Transit Service Standards and Performance Measures 2014 Edition 38
Sound Transit staff. Trip-level APC data will be evaluated for overload conditions during each
tri-annual service change period.
6. Extra and Special Service
A key Sound Transit objective is improving regional mobility for a variety of trip purposes
(Sound Move, The Ten-Year Regional Transit System Plan, page 10). Major events, such as
major league football games, generate large volumes of traffic and parking demand. If Central
Link service helps to achieve a significant transit mode share at a major event, it provides a
public benefit by relieving pressure on major highways and parking facilities (Sound Move,
Appendix C, page C-12).
“Extra Service vs. Special Service”: “Extra service” is trains added to supplement regular
service. Extra service is needed when an event or activity generates so much demand that more
trains are needed to prevent overloads. Sound Transit is generally aware of when extra service is
likely to be needed and plans and budgets for it accordingly.
“Special service” in the context here is an overlay of service on top of regular Central Link
schedules that is sponsored by an outside party. It may operate outside of regular Central Link
service hours (for example, between 1:00 a.m. and 5:00 a.m.). To be considered, special service
must meet the following essential criteria:
The service must have adequate operating, maintenance and security staffing available.
The cost of the special service is fully covered by direct payments from outside parties,
promotional trades, or a combination of these resources.
In addition to these essential criteria, special service with the following characteristics will be
given preference:
The service mitigates congestion on regional highways and reduces parking requirements
in the vicinity of the event.
The service reduces passenger overloads on other transit service.
The service attracts new customers, promotes Sound Transit, and generates positive
media coverage and community goodwill.