service quality in higher education: students...
TRANSCRIPT
Rev. Integr. Bus. Econ. Res. Vol 1(1) 275
Copyright 2012 Society of Interdisciplinary Business Research (www.sibresearch.org)
Service Quality in Higher Education: Students’ Perceptions in Australia and Malaysia Wee Ming Ong* School of Management, RMIT, Melbourne School of Management, Curtin University, Perth [email protected] [email protected] Alan Nankervis School of Management, RMIT University, Melbourne [email protected]
ABSTRACT Analyzing the discrepancy/gap between students’ expectations and perceptions of service quality provided by university student advisors at customer service centres may improve student advisory services, assist in building a long-term relationship between the university and its customers, and improve its reputation over time. This study used a modified SERVQUAL instrument to assess service quality, which was further developed by Parasuraman, Zeithaml and Berry in 1988 with 5 dimensions. Samples included first and third year undergraduate business degree program students from Australian and Malaysian Universities to participate in this study. The modified SERVQUAL instrument showed reliability of 0.92 and validity of 0.75 to 0.98. The findings showed that there is a significant difference between first and third year students’ expectations of service quality in Malaysia. However, there was no significant difference found in students’ perception and discrepancy/gap of service quality between first and third year students in Australia and Malaysia. Keywords: Service quality, SERVQUAL, Perception and educational environment, Service quality and higher education. JEL codes: M16 and L84 1. Introduction To achieving high service quality and buyer satisfaction has always been an important goal for organisations, which does including not-for-profit and educational institutions (Ham 2003). In higher education, the treatment of students (who are customers) during the service process and the actual outcomes experienced by the students do affect their judgment of service quality and selection for enrolment in higher education. Furthermore, students’ perceptions of the higher education experience have become more important, this is due to colleges and universities have attempting to become more student-oriented (Robert 1996).
Therefore, in order to compete effectively in the marketplace, higher education institutions need to differentiate themselves from its competitors by providing a higher quality services (Joseph 1998). Consequently, this study focused on the discrepancy/gap between expected and perceived services of the conceptual model of service quality, which used a modified

Rev. Integr. Bus. Econ. Res. Vol 1(1) 276
Copyright 2012 Society of Interdisciplinary Business Research (www.sibresearch.org)
SERVQUAL instrument to examine students’ perceptions of service quality in higher education environment across Australia and Malaysia.
2. Significance of the study A lack of knowledge about students’ perceptions might lead management to misallocate resources while attempting to improve the perceived quality of their university. Such misdirected efforts could result in students’ dissatisfaction with the university, for example potential students going to other education providers or passing negative remarks about the university through word-of-mouth. Therefore, by analyzing the discrepancy/gap between expectations and perceptions of service quality, the research findings identify deficiencies and areas of dissatisfaction which provide opportunities for university managers to improve overall student services. In addition, it serves as the foundation on which to improve student advisory services in order to build a long-term relationship between the university and its customers, and to improve its reputation over time. 3. Literature Review 3.1. Definitions and Characteristics of Services According to Kothari (1988), service represents any activity, offered to a customer, which is simultaneously consumed and produced. Gronroos (1990) defined service as an activity or series of activities of a more or less intangible nature that normally, but not necessarily, takes place in interaction between the customer and service employees/and or physical resources or goods and/or systems of the service provider, which are provided as solutions to customer problems. Whereas, Kotler (1991, p.455) defined service as “any act or performance that one party can offer to another that is essentially intangible and does not result in the ownership of anything. Its production may or may not be tied to a physical product”. Thus, the definitions of services are related to three characteristics of services – intangibility, heterogeneity and inseparability – which do have important implications for the delivery of service quality (Hill 1995); and tend to differentiate services from goods (Parasuraman, Zeithmal and Berry 1985; 1988).
The characteristics of services are (1) Intangible - because they are performances rather than objects (Parasuraman et al. 1985). Most services cannot be counted, measure, inventoried, tested or verified in advance of sale to assure quality; (2) Heterogeneous - services performance often varies from producer to producer, from customer to customer and from day to day. Consistency of behaviour from service personnel is difficult to assure (Booms & Bitner 1981) because what the firm intends to deliver may be entirely different from what the consumer receives; (3) Inseparable - quality in services is not engineered at the manufacturing plant, and then delivered intact to the consumer. In fact, quality occurs during service delivery, usually as an interaction between the client and the contact person for the service firm (Lehtinen & Lehtinen 1982).
Within services marketing theory, higher education is frequently cited as a key example of a service with limited tangible outputs (Zeithaml, Bitner & Gremler 2006; Fisk, Gountas, Hume, Gountas, Grove & John 2007; Stodnick & Rogers 2008). Higher education is classified as a service product with its primary outputs being the mental development, knowledge, skills and graduate outcomes rather than the ownership of an object such as the degree certificate that represents tangible evidence of the education service encounter (Dann 2008).

Rev. Integr. Bus. Econ. Res. Vol 1(1) 277
Copyright 2012 Society of Interdisciplinary Business Research (www.sibresearch.org)
3.2. Students in Higher Education One distinctive aspect of services is that customers are often part of the production and delivery processes (Beilharz & Chapman 1994). The customers are people who have an interest, either directly or indirectly, in the service delivered by a higher education provider, which includes students because they are the primary customers in higher education (Downey, Fraser & Peters 1994; Pitman 2000; Lawrence & Sharma 2002; Nealon 2005; Eagle & Brennan 2007; Stodnick & Rogers 2008); parents, alumni, employers, professors and administrators (Pariseau & McDaniel 1997; Srikanthan & Dalrymple 2003); faculty, research users and society as a whole (Willis & Taylor 1999).
Students are described as customers of higher education because they are the one group affected by service quality in higher education each and every day, and also, how customers are treated during the service interaction and the actual end result experienced by the students do affect their judgment of service quality (Pariseau & McDaniel 1997). Therefore, understanding value from the customer’s perspective can provide useful information to management in allocating resources and designing programs that will better satisfy students (Seymour 1992); and also helping higher education institutions to gaining or maintaining in a competitive edge (Schmidt 2002; Watson 2003). 3.3. Perceived Service Quality Perceived quality is defined as the consumer’s judgment about an entity’s overall excellence or superiority (Zeithaml 1987). It is a form of attitude and results from a comparison of expectations with perceptions of performance (Parasuraman et al. 1988). Gronroos (1982) developed a model in which he contended that, in evaluating service quality, consumers compare the service they expect with perceptions of the service they receive. The model illustrates that the qualities of a service as perceived by customers have two dimensions (1) Technical dimension refers to the result of the service and relates to the question: what has been provided? ; and (2) Functional dimension refers to the way the service has been delivered and relates to the question: how has the service been provided?. However, according to Gronroos (1988; 1990), the technical aspects of a service are easily copied and competitive positioning may be lost easily. The functional dimension, in contrast, can be used to create a competitive edge by focusing on the more personal aspects of the service encounter. Although Gronroos’ dimensions of service quality have an important value for conceptual understanding of services, this theory may not be sufficient as it is important to study quality in each specific situation (Lagrosen 2001). 3.4. Service Quality Expanding on the research and development initiated by Gronroos (1988; 1990), Parasuraman et al. (1985) has refined and further developed the concept of service quality into the SERVQUAL instrument. As the literature on service quality was not yet rich enough to provide a sound conceptual foundation for investigating service quality, an exploratory qualitative study was undertaken to investigate the concept of service quality which consisted of focus group interviews with consumers, and in-depth interviews with executives. There were four service categories chosen for investigation: retail banking, credit card, securities brokerage, and product repair and maintenance; which represent a cross-section of industries and vary along a key dimension used to categorize services (Lovelock 1980; 1983).
The study has shown consistent patterns, which emerged from the four sets of executive interviews. The most important insight obtained from analysing the executive responses was “a

Rev. Integr. Bus. Econ. Res. Vol 1(1) 278
Copyright 2012 Society of Interdisciplinary Business Research (www.sibresearch.org)
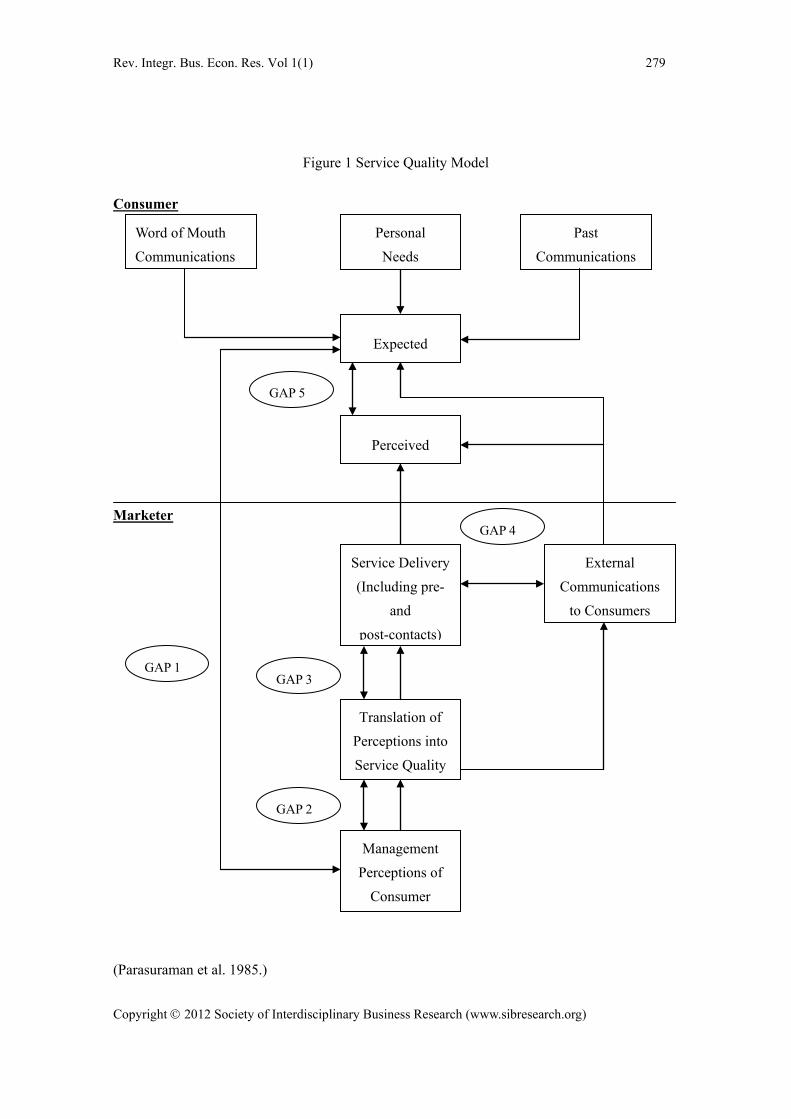
set of key discrepancies or gaps exists regarding executive perceptions of service quality and the tasks associated with service delivery to consumers. These gaps can be major hurdles in attempting to deliver a service which consumers would perceive as being of high quality” (Parasuraman et al. 1985, p. 44). As a result of their preliminary research, Parasuraman et al. (1985) identified 5 potential discrepancies/gaps associated with the delivery of a service, as shown in Figure 1 Service Quality Model: Gap 1 - the gap between consumer expectations and management perceptions of those
(consumer) expectations. Gap 2 - the gap between management perceptions of consumer expectations and the firm’s
service quality specifications. Gap 3 - the gap between service quality specifications and actual service delivery. Gap 4 - the gap between actual service delivery and external communications about the service. Gap 5 - the gap between expected service and perceived service. Therefore, to know whether the company performs well, gap analysis may assist in this case. Parasuraman et al. (1988) stated that if the consumer’s expectations are met, service quality is perceived to be satisfied and may affect the consumer to behave in positive ways. On the other hand, if the consumer’s expectations are not met, quality is perceived to be unsatisfactory and may affect the consumer to behave in negative ways to the cost of the company. If the consumer’s expectations are exceeded, it is perceived to be more than satisfactory, and delighting to the customer (Hill 1995).
The Parasuraman et al. (1985) exploratory study revealed that the key to ensuring good service quality is meeting or exceeding what consumers expect from the service, which is illustrated in Gap 5 - the discrepancy/gap between expected service and perceived service. In order to compete effectively in the marketplace, higher education institutions need to differentiate themselves from its competitors by providing a higher quality services (Joseph 1998). As a result, this study focused on Gap 5 – the discrepancy/gap between expected and perceived services of the conceptual model of service quality, and uses a modified SERVQUAL instrument to capture student perceptions of service quality.
4. Research Design 4.1. Hypotheses development Parasuraman et al. (1985) conducted exploratory research to understand the construct of service quality and its determinants, and defined service quality as the degree of discrepancy or gap between customers’ normative expectations for the service and their perceptions of service performance. Service quality levels are higher when the discrepancy/gap between perceptions of performance and desired expectation is non-existent or small; the levels of satisfaction exist when perceived performance exceeds predicted expectations (Parasuraman et al. 1988). Many studies have been undertaken to verify the use of the SERVQUAL instrument to measure service quality. Most of the research areas focus on, for example, retail, banking, credit card, securities brokerage and product repair and maintenance (Parasuraman et al. 1985; 1988); CPA firm, dental clinic, business school placement centre (Brown, Churchill & Peter 1993); ambulatory health care and health clinic (Quiram 1995); restaurants (Liljander & Strandfik 1993; Oh 2000); hospital (Lim & Tang 2000); international airlines (Robledo 2001); academic records, admissions, career services, financial aid, support staff, dining facilities in higher education
Rev. Integr. Bus. Econ. Res. Vol 1(1) 279
Copyright 2012 Society of Interdisciplinary Business Research (www.sibresearch.org)
Figure 1 Service Quality Model
Consumer
Marketer
(Parasuraman et al. 1985.)
Word of Mouth Communications
Personal Needs
Past Communications
Expected
Perceived
Service Delivery (Including pre-
and post-contacts)
Translation of Perceptions into Service Quality
Management Perceptions of
Consumer
External Communications
to Consumers
GAP 1
GAP 2
GAP 3
GAP 4
GAP 5

Rev. Integr. Bus. Econ. Res. Vol 1(1) 280
Copyright 2012 Society of Interdisciplinary Business Research (www.sibresearch.org)
setting (Ruby 1996; Schwantz 1996; DiDomenico & Joseph 1996); private education institution (Comm & Mathaisel 2000; Sahney, Banwet & Karunes 2003), doctoral students at Tennessee University (Lampley 2001); and faculty of tourism and hospitality management in Croatia (Markovic & Gospodarstvo 2006). As a result, there is a need to extend study to the higher education environment.
The above evidences shows that there has been minimal research into the area of service quality in university business schools, especially “Students Customer Service Centres”, which is one of the first points of contact for existing and future students. The quality of any service encounters experienced by customers do forms part of their overall impression of the whole service provided (Dale 2003); and their impression of the organization itself as well (Douglas, Douglas & Barnes 2006). Customers do form their opinions based on the people who served them, they are either satisfied, dissatisfied or somewhere along the two continuums. A satisfied customer engages in positive word-of-mouth communication that could affect positively on a business’s reputation and financial status. For example, satisfied students may retain, re-enrol, and even recommend to their friends or relatives of the satisfied university experience they have had. On the other hand, dissatisfied customers would pass on negative comments of the service provider, which could affect a business’s operation and even cause damage to its reputation For example, dissatisfied students may withdraw and re-enrol with other universities, pass negative comments to their friends or relatives that may affect the university’s enrolment and retention of students. Consequently, the quality of services provided by student advisors at Customer Service Centre needs to be examined as higher education attempting to improve students’ satisfaction. The following diagram shows the conceptual framework for this study, and associated research question and hypotheses. 4.2. Research Question and Hypotheses Based on the above discussion, the conceptual framework as shown in Diagram 1 and research question for this study was developed.
Diagram 1 – Conceptual Framework
H1 H2 H3 The research question for this study is: What are the discrepancies/gaps in students’ expectations and perceptions in regard to the service quality of university student advisors in Australia and Malaysia? Hypotheses for this study are: Hypothesis 1 There is significant difference in students’ expectations of service quality between first and third year students in Australia and Malaysia.
Student Year 1 3
SERVQUAL Expectations Perceptions
Discrepancy/Gap

Rev. Integr. Bus. Econ. Res. Vol 1(1) 281
Copyright 2012 Society of Interdisciplinary Business Research (www.sibresearch.org)
Ho11: There is significant difference in students’ expectations of service quality between first and third year students in Australia. Ho12: There is significant difference in students’ expectations of service quality between first and third year students in Malaysia. Hypothesis 2 There is significant difference in students’ perceptions of service quality between first and third year students in Australia and Malaysia. Ho21: There is significant difference in students’ perceptions of service quality between first and third year students in Australia. Ho22: There is significant difference in students’ perceptions of service quality between first and third year students in Malaysia. Hypothesis 3 There is significant difference in students’ discrepancy/gap of service quality between first and third year students in Australia and Malaysia. Ho31: There is significant difference in students’ discrepancy/gap of service quality between first and third year students in Australia. Ho32: There is significant difference in students’ discrepancy/gap of service quality between first and third year students in Malaysia. 4.3. Research Methodology 4.3.1. SERVQUAL instrument The modified SERVQUAL instrument was used to assess service quality in this study. It was developed by Parasuraman, Zeithaml and Berry in 1985 with an original 10 dimensions; however, in 1988, it was reduced to 5 dimensions (namely tangibles, reliability, responsiveness, assurance and empathy) because of overlapping among dimensions. The modified SERVQUAL is a two-part instrument, with 22-items measuring expectations of customers and similarly worded 22-items measuring perceptions of experiences of customers to measure the quality of the service quality. A seven-point scale ranging from Strongly Agree (7) to Strongly Disagree (1) accompanied each statement. Responses to the expectation and perception statements are compared. If the expectation response is higher than the perception response, the score will be negative. On the other hand, if the perception response is higher than the expectation response, the score will be positive. A positive score indicates an area of strength and can represent a competitive advantage for the service provider (Parasuraman et al. 1988). 4.3.2. Pilot study Pilot testing was undertaken among two groups of volunteer focus group participants from first and third year undergraduate business degree students from one Australia University. The volunteer focus group consisted of ten student volunteers from first year and ten student volunteers from third year undergraduate business degree. The focus group was asked to examine the questionnaire for this study. The aim of pre-testing the questionnaires is useful because it can ensure that there are no problems with the wordings or the measurements rectify any inadequacies in time and ultimately reduce biases (Sekaran 2000). These volunteer students did not participate in the survey carried out as they had already participated in the pilot study. 4.3.3. Samples The research samples for this study consisted of first and third year undergraduate business degree students of two universities in Australia and one university in Malaysia. A random number

Rev. Integr. Bus. Econ. Res. Vol 1(1) 282
Copyright 2012 Society of Interdisciplinary Business Research (www.sibresearch.org)
of 250 to 300 students was selected from first year. Similarly, the selection also applied to third year students for each university. This resulted in a total of 500 to 600 students in each university. The researcher had the support of lecturers/tutors to deliver and administer the survey during class time and returned to the researcher via mailing. Therefore, the number of usable surveys consisted of 750 for Australian universities and 264 for the Malaysian university, with a total of 1014 usable samples for this study. 4.3.4. Questionnaire Administration Questionnaire distribution was carried out between September 2007 and April 2008 for Australian universities, and between October 2007 to September 2008 for the Malaysian university. This was because of the different semester commencement times. The questionnaire contained a cover letter and included 4 parts. The cover letter stating self-introduction, purposes and areas of the research, and brief descriptions of each part of the questionnaire. Participants were asked to circle the number that best matched their opinion. All responses collected were kept confidential and participants kept anonymous. Part 1 consisted of 16 demographic questions, and Part 2 consisted of two sets of 22 statements that dealt with students’ expectations and Part 3 students’ experiences of the services provided by Business School Students Customer Service Centres. These statements correspond to the 22 expectations statements. A seven-point interval scale was used for both Part 2 and Part 3, ranging from 1 (strongly disagree), 2 (disagree), 3 (somewhat disagree), 4 (neither agree nor disagree), 5 (somewhat agree), 6 (agree), to 7 (strongly agree). The seven-point interval scale was deployed to avoid the central-tendency bunching that commonly characterizes Asian responses to a questionnaire (Ellis & Williams 2001). Part 4 consisted of 2 open-ended questions inviting general comments. 4.3.5. Reliability and Validity of instrument SERVQUAL has been proven to be a reliable instrument for measuring expectations and perceptions of service quality (Zeithaml, Parasuraman & Berry 1990, Parasuraman, Berry & Zeithaml 1993). Parasuraman et al. (1988) reported that reliability coefficients for the five dimensions of service quality have a total reliability score of 0.92. Brown, Churchill and Peter’s (1993) study also showed very strong reliabilities for the two components of SERVQUAL with 0.94 for expectations and 0.96 for perceptions. In addition, Hadikoemore’s (2001) findings has showed reliability higher than 0.70 and a high validity (were significant at the 0.01 level, indicating correlations exist) for the five dimensions of service quality; and further indicates strong support for the use of the modified SERVQUAL instrument. Furthermore, in Markovic and Gospodarstvo’s (2006) study, the findings indicated that the SERVQUAL instrument is reliable and applicable with relatively high alpha values of 0.7783 for the expectations scale; the validity ranged from 0.75 to 0.98 which has reported acceptable validity. 4.3.6. Data Analysis The SPSS version 17.0 was used to analyze the data obtained from the questionnaires for this study. To enable ease of data entry, questions were pre-coded beforehand. It was user-friendly and could easily convert data from Excel format to the SPSS version and is commonly used by researchers. 5. Findings and Discussions Data screening and cleaning were carried out to establishing the accuracy of the input data as well as handling of missing observations. Reversed coding has been performed on expectations,
Rev. Integr. Bus. Econ. Res. Vol 1(1) 283
Copyright 2012 Society of Interdisciplinary Business Research (www.sibresearch.org)
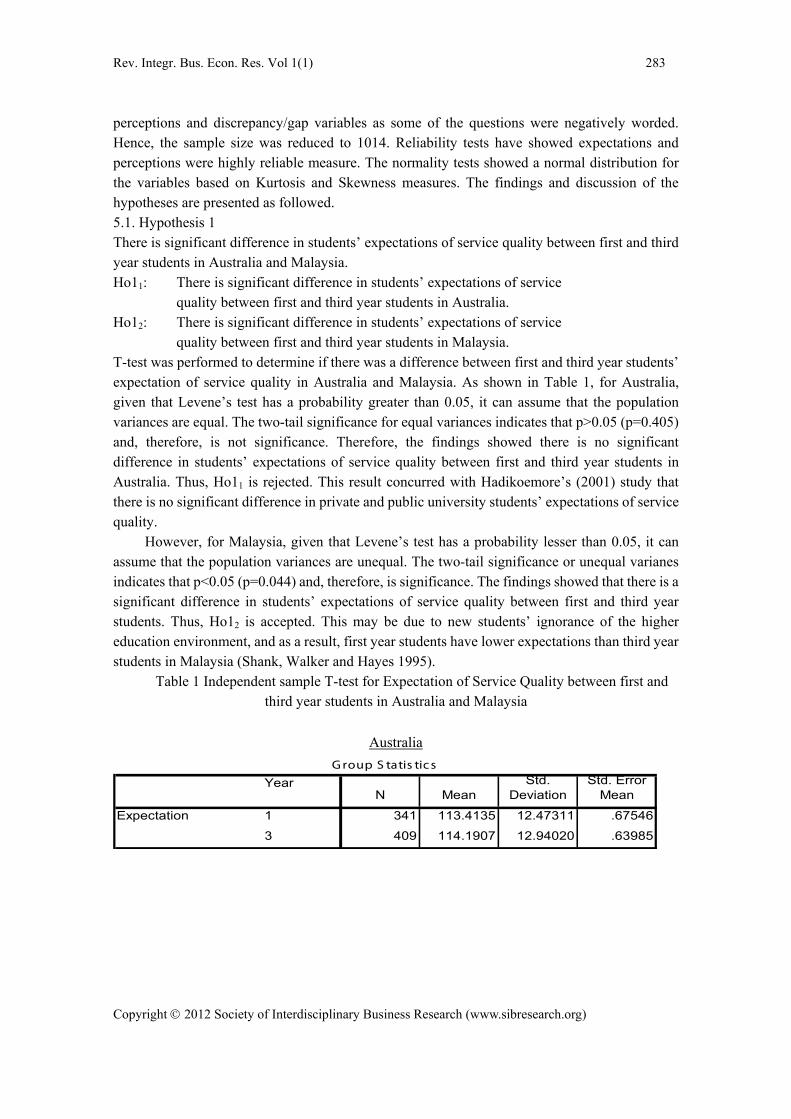
perceptions and discrepancy/gap variables as some of the questions were negatively worded. Hence, the sample size was reduced to 1014. Reliability tests have showed expectations and perceptions were highly reliable measure. The normality tests showed a normal distribution for the variables based on Kurtosis and Skewness measures. The findings and discussion of the hypotheses are presented as followed. 5.1. Hypothesis 1 There is significant difference in students’ expectations of service quality between first and third year students in Australia and Malaysia. Ho11: There is significant difference in students’ expectations of service quality between first and third year students in Australia. Ho12: There is significant difference in students’ expectations of service quality between first and third year students in Malaysia. T-test was performed to determine if there was a difference between first and third year students’ expectation of service quality in Australia and Malaysia. As shown in Table 1, for Australia, given that Levene’s test has a probability greater than 0.05, it can assume that the population variances are equal. The two-tail significance for equal variances indicates that p>0.05 (p=0.405) and, therefore, is not significance. Therefore, the findings showed there is no significant difference in students’ expectations of service quality between first and third year students in Australia. Thus, Ho11 is rejected. This result concurred with Hadikoemore’s (2001) study that there is no significant difference in private and public university students’ expectations of service quality.
However, for Malaysia, given that Levene’s test has a probability lesser than 0.05, it can assume that the population variances are unequal. The two-tail significance or unequal varianes indicates that p<0.05 (p=0.044) and, therefore, is significance. The findings showed that there is a significant difference in students’ expectations of service quality between first and third year students. Thus, Ho12 is accepted. This may be due to new students’ ignorance of the higher education environment, and as a result, first year students have lower expectations than third year students in Malaysia (Shank, Walker and Hayes 1995).
Table 1 Independent sample T-test for Expectation of Service Quality between first and third year students in Australia and Malaysia
YearN Mean
Std. Deviation
Std. Error Mean
1 341 113.4135 12.47311 .67546
3 409 114.1907 12.94020 .63985
G roup S tatis tic s
Expectation
Australia

Rev. Integr. Bus. Econ. Res. Vol 1(1) 284
Copyright 2012 Society of Interdisciplinary Business Research (www.sibresearch.org)
Lower Upper
Equal variances assumed
.091 .763 -.833 748 .405 -.77722 .93351 -2.60984 1.05540
Equal variances not assumed
-.835 732.470 .404 -.77722 .93040 -2.60380 1.04936
Independent S amples T es t
Equality of Variances t-test for Equality of Means
F Sig. t dfSig. (2-tailed)
Mean Difference
Std. Error Difference
of the Difference
Expectation
YearN Mean
Std. Deviation
Std. Error Mean
1 133 110.5188 12.03001 1.04313
3 131 113.1679 9.07842 .79319
G roup S tatis tic s
Expectation
Malaysia
Lower Upper
Equal variances assumed
10.847 .001 -2.017 262 .045 -2.64914 1.31318 -5.23488 -.06340
Equal variances not assumed
-2.022 245.452 .044 -2.64914 1.31045 -5.23030 -.06799
Expectation
Independent S amples T es t
Equality of Variances t-test for Equality of Means
F Sig. t dfSig. (2-tailed)
Mean Difference
Std. Error Difference
of the Difference
5.2. Hypothesis 2 There is significant difference in students’ perceptions of service quality between first and third year students in Australia and Malaysia. Ho21: There is significant difference in students’ perceptions of service quality between first and third year students in Australia. Ho22: There is significant difference in students’ perceptions of service quality between first and third year students in Malaysia. T-test was performed to determine if there was a difference between first and third year students’ perception of service quality in Australia and Malaysia. As shown in Table 2, for Australia, given that Levene’s test has a probability greater than 0.05, it can assume that the population variances are equal. The two-tail significance for equal variances indicates that p>0.05 (p=0.687) and, therefore, is not significance. Therefore, reject Ho21. For Malaysia, given that Levene’s test has a probability greater than 0.05, it can assume that the population variances are equal. The two-tail significance for equal variances indicates that p>0.05 (p=0.178) and, therefore, is not significance. Therefore, reject Ho22. Thus, both findings showed that there is no significant difference in students’ perception of service quality between first and third year students in Australia and Malaysia. However, the findings do not support Jalali, Islam and Ariffins’ (2011) study that student status has an important influence on the perception of service quality, and they argued that ‘because student expectation increases as they have more contact with the university’ (p.182).

Rev. Integr. Bus. Econ. Res. Vol 1(1) 285
Copyright 2012 Society of Interdisciplinary Business Research (www.sibresearch.org)
Table 2 Independent sample T-test for Perception of Service Quality between first and third year students in Australia and Malaysia
YearN Mean
Std. Deviation
Std. Error Mean
1 341 99.8915 12.53970 .67906
3 409 99.5232 12.35465 .61090
G roup S tatis tic s
Perception
Australia
Lower Upper
Equal variances assumed
1.066 .302 .404 748 .687 .36827 .91218 -1.42247 2.15901
Equal variances not assumed
.403 720.024 .687 .36827 .91341 -1.42500 2.16154
Perception
Independent S amples T es t
Equality of Variances t-test for Equality of Means
F Sig. t dfSig. (2-tailed)
Mean Difference
Std. Error Difference
of the Difference
YearN Mean
Std. Deviation
Std. Error Mean
1 133 94.4586 14.58648 1.26481
3 131 96.7710 13.21396 1.15451
G roup S tatis tic s
Perception
Malaysia
Lower Upper
Equal variances assumed
1.296 .256 -1.349 262 .178 -2.31235 1.71378 -5.68687 1.06218
Equal variances not assumed
-1.350 260.192 .178 -2.31235 1.71249 -5.68445 1.05976
Independent S amples T es t
Equality of Variances t-test for Equality of Means
F Sig. t dfSig. (2-tailed)
Mean Difference
Std. Error Difference
of the Difference
Perception
5.3. Hypothesis 3 There is significant difference in students’ discrepancy/gap of service quality between first and third year students in Australia and Malaysia. Ho31: There is significant difference in students’ discrepancy/gap of service quality between first and third year students in Australia. Ho32: There is significant difference in students’ discrepancy/gap of service quality between first and third year students in Malaysia.
T-test was performed to determine if there was a difference between first and third year students’ discrepancy/gap of service quality in Australia and Malaysia. As shown in Table 3, for Australia, given that Levene’s test has a probability greater than 0.05, it can assume that the
Rev. Integr. Bus. Econ. Res. Vol 1(1) 286
Copyright 2012 Society of Interdisciplinary Business Research (www.sibresearch.org)
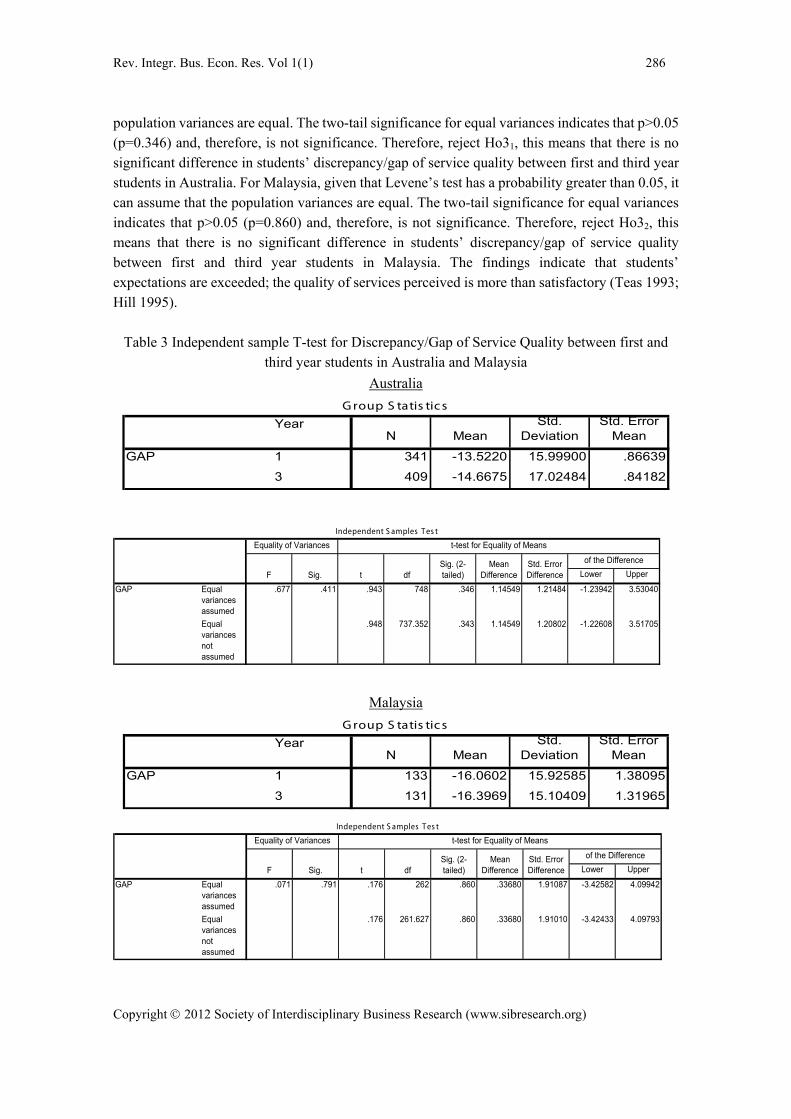
population variances are equal. The two-tail significance for equal variances indicates that p>0.05 (p=0.346) and, therefore, is not significance. Therefore, reject Ho31, this means that there is no significant difference in students’ discrepancy/gap of service quality between first and third year students in Australia. For Malaysia, given that Levene’s test has a probability greater than 0.05, it can assume that the population variances are equal. The two-tail significance for equal variances indicates that p>0.05 (p=0.860) and, therefore, is not significance. Therefore, reject Ho32, this means that there is no significant difference in students’ discrepancy/gap of service quality between first and third year students in Malaysia. The findings indicate that students’ expectations are exceeded; the quality of services perceived is more than satisfactory (Teas 1993; Hill 1995).
Table 3 Independent sample T-test for Discrepancy/Gap of Service Quality between first and third year students in Australia and Malaysia
Australia
YearN Mean
Std. Deviation
Std. Error Mean
1 341 -13.5220 15.99900 .86639
3 409 -14.6675 17.02484 .84182
G roup S tatis tic s
GAP
Lower Upper
Equal variances assumed
.677 .411 .943 748 .346 1.14549 1.21484 -1.23942 3.53040
Equal variances not assumed
.948 737.352 .343 1.14549 1.20802 -1.22608 3.51705
Independent S amples T es t
Equality of Variances t-test for Equality of Means
F Sig. t dfSig. (2-tailed)
Mean Difference
Std. Error Difference
of the Difference
GAP
Malaysia
YearN Mean
Std. Deviation
Std. Error Mean
1 133 -16.0602 15.92585 1.38095
3 131 -16.3969 15.10409 1.31965
G roup S tatis tic s
GAP
Lower Upper
Equal variances assumed
.071 .791 .176 262 .860 .33680 1.91087 -3.42582 4.09942
Equal variances not assumed
.176 261.627 .860 .33680 1.91010 -3.42433 4.09793
GAP
Independent S amples T es t
Equality of Variances t-test for Equality of Means
F Sig. t dfSig. (2-tailed)
Mean Difference
Std. Error Difference
of the Difference

Rev. Integr. Bus. Econ. Res. Vol 1(1) 287
Copyright 2012 Society of Interdisciplinary Business Research (www.sibresearch.org)
6. Implications The findings of this study provide management with clues on where to make improvements in services offered to existing students and potential students; and on the other hand, information that reveals students’ satisfaction with services provided at customer service centres. To improve on students’ satisfaction, the customer service centre may encourage students to express their opinions personally to service providers, through providing suggestion box near to customer service centre, or setting up online evaluation system. Even during orientation sessions to explain services provided by the student advisors to the students. Hence, this may increase students’ perceptions of service quality. 7. Limitations Research should include the following so that the conclusions drawn will be application to wider areas: first, private institutions – this allow a comparison between public and private institutions’ service quality; second, involve other faculties within higher education environment such as engineering, medical, health science, humanities; third, sample size needs to increase in Malaysia by getting more universities and students to participate. 8. Future Research Research (Donthu & Yoo 1998; Espinoaz 1999; Furrer, Liu & Sudharshan 2000, 2001; Imrie, Cadogan & McNaughton 2002; Kueh & Voon 2007; Tsoukatos & Rand 2007) has shown that culture has an impact on students’ perceptions of service quality. Thus, higher education institutions may need to understand and be sensitive to students’ needs. Future research should include examining culture and service quality in higher education environments across different countries, so as to better understand students who have different cultural background and to provide satisfactory or higher service quality to the students. 9. Conclusion In order to compete effectively in the marketplace, higher education institutions need to differentiate themselves from its competitors by providing a higher quality services (Joseph 1998). Within higher education environment, students’ perceptions of the higher education experience have become more important because colleges and universities have attempting to become more student-oriented (Robert 1996). Thus, by examine on students’ perceived service quality does provide management with clues on where to make improvements in services offered to existing students and potential students; and services that students are satisfy with.
This study has based on Gap 5, i.e. the discrepancy/gap between expected and perceived services of service quality model developed by Parasuraman, Zeithaml and Berry in 1985 and 1988, and used a modified SERVQUAL instrument to examine students’ perceptions of service quality within higher education environment across Australia and Malaysia. The findings in this study showed that first and third year students’ expectations of service quality are met in both Australia and Malaysia. There is no significant difference in students’ discrepancy/gap of service quality between first and third year students in Australia and Malaysia. Students’ expectations are exceeded; the quality of services perceived is more than satisfactory (Teas 1993; Hill 1995).

Rev. Integr. Bus. Econ. Res. Vol 1(1) 288
Copyright 2012 Society of Interdisciplinary Business Research (www.sibresearch.org)
However, future study should examine culture and service quality within higher education environment because several researches have suggested that culture may play a fundamental role in determining service quality.
Acknowledgements An earlier version of this paper was presented at the 2012 SIBR Conference on Interdisciplinary Business and Economics Research, 7th-9th June 2012, Bangkok and included in the conference proceedings.
REFERENCES [1] Beilharz, G., Chapman, R. (1994), Quality management in service organizations,
Longman, Melbourne. [2] Booms, B.H. and Bitner, M.J. (1981), “Marketing strategies and organization structures
for services firms”, in J. Donnelly and W. George (eds.), Marketing of Services, American Marketing, Chicago, 47-51.
[3] Brown, T.J., Churchill, Jr. G.A., Peter, J.P. (1993), “Improving the measurement of service quality”, Journal of Retailing, 69, 1, 127-140.
[4] Comm, C.L., Mathaisel, D.F.X. (2000), “Assessing employee satisfaction in service firms: an example in higher education”, The Journal of Business and Economic Studies, 6, 1, 43-53.
[5] Dale, B.G. (2003), Managing Quality, 4th ed., Blackwell Publishing, Oxford. [6] Dann, S. (2008), “Applying Services Marketing Principles to Postgraduate Supervision”,
Quality Assurance in Education, 16, 4, 333-346. [7] Downey, C.J., Frase, L.E., Peters, J.J. (1994), The quality education challenge, Thousand
Oaks, Calif, Corwin Press. [8] DiDomenico, E., Joseph, B. (1996), “Assessing service quality within the educational
environment”, Education, 116, 3, 353-357. [9] Donthu, N., Yoo, B. (1998), “Cultural influences on service quality expectations”, Journal
of Service Research, 1, 2, 178-186. [10] Douglas, J., Douglas, A., Barnes, B. (2006), “Measuring student satisfaction at a UK
university”, Quality Assurance in Education, 14, 3, 251-267. [11] Eagle, L., Brennan, R. (2007), “Are students customers? TQM and marketing
perspectives”, Quality Assurance in Education, 15, 1, 44. [12] Ellis, J.H.M., Williams, D.R. (2001), “Managing Japan-Europe industrial buyer-supplier
relationships: a conceptual and empirical study of Japanese market for high technology marine equipment”, Journal of Asia Pacific Economy, 6, 2, 232-243.
[13] Espinoza, M.M. (1999), “Assessing the cross-cultural applicability of a service quality measure: a comparative study between Quebec and Peru”, International Journal of Service Industry Management, 10, 5, 449-468.
[14] Fisk, R., Gountas, J., Hume, J., Gove, S., John, J. (2007), Services marketing: First Asia Pacific edition, John Wiley & Sons, Australia.
[15] Furrer, O., Liu, B.S.C., Sudharshan, D. (2000), “The relationships between culture and service quality perceptions: basis for cross-cultural market segmentation and resource allocation”, Journal of Service Research, 2, 4, 355-371.

Rev. Integr. Bus. Econ. Res. Vol 1(1) 289
Copyright 2012 Society of Interdisciplinary Business Research (www.sibresearch.org)
[16] Furrer, O., Liu, B.S.C., Sudharshan, D. (2001), “The relationships between culture and service quality perceptions”, Journal of Service Research, 2, 4, 118-130.
[17] Gronroos, C. (1982), “A service quality model and its marketing implications”, European Journal of Marketing, 18, 4, 36-44.
[18] Gronroos, C. (1988), “Service Quality: The Six Criteria of Good Service Quality”, in C. Gronroos (ed.), Service management and marketing: managing the moments of truth in service competition, Lexington, Mass, 41.
[19] Gronroos, C. (1990), “Relationship approach to marketing in service context: The marketing and organizational behavior interface”, Journal of Business Research, 20, 3, 11.
[20] Hadikoemoro, S. (2001), “A comparison of public and private university students’ expectations and perceptions of service quality in Jakarta, Indonesia”, PhD Thesis, Nova Southeastern University.
[21] Ham, C.L. (2003), “Analyzing the value of service quality management: Gaining competitive advantage”, International Journal of Value-based Management, 16, 2, 131-152.
[22] Hill, F.M. (1995), “Managing service quality in higher education: the role of the student as primary consumer”, Quality Assurance in Education, 3, 3, 10.
[23] Imrie, B.C., Cadogan, J.W., McNaughton, R. (2002), “The service quality construct on a global stage”, Managing Service Quality, 12, 1, 10-18.
[24] Jalali, A., Islam, M.A., Ariffin, K.H. (2011), “Service satisfaction: The case of a higher learning institution in Malaysia”, International Education Studies, 4, 1, 182-192.
[25] Joseph, M. (1998), “Determinants of service quality in education: A New Zealand perspective”, Journal of Professional Services Marketing, 16, 1, 43-71.
[26] Kothari, V. (1988), “Strategic dimensions of global marketing of services”, Journal of Professional Services Marketing, 3, 4, 209-229.
[27] Kotler, P., Fox, K. (1995), Strategic marketing for educational institutions, 2nd ed., Prentice-Hall, New Jersey.
[28] Kueh, K., Voon, B.H. (2007), “Culture and service quality expectations: Evidence from generation Y consumers in Malaysia”, Managing Service Quality, 17, 6, 656-680.
[29] Lagrosen, S. (2001), “Strengthening the weakest link of TQM – from customer focus to customer understanding”, The TQM Magazine, 13, 5, 348-354.
[30] Lampley, J.H. (2001), “Service quality in higher education: expectations versus experiences of doctoral students”, College and University, 77, 2, 9-15.
[31] Lawrence, S., Sharma, U. (2002), “Commodification of education and academic labour: using the balanced scorecard in university setting”, Critical Perspectives on Accounting, 13, 661-677.
[32] Lehtinen, U., Lehtineu, J.R. (1982), Service quality: A study of quality dimensions, unpublished working paper, Helsinki: Service Management Institute, Finland.
[33] Liljander, V., Strandviks, T. (1993), “Estimating zones of tolerance in perceived service quality and perceived service value”, International Journal of Service Industry Management, 4, 2, 6-28.
[34] Lim, P.C., Tang, N.K.H. (2000), “A study of patients’ expectations and satisfaction in

Rev. Integr. Bus. Econ. Res. Vol 1(1) 290
Copyright 2012 Society of Interdisciplinary Business Research (www.sibresearch.org)
Singapore hospitals”, International Journal of Health Care Quality Assurance, 13, 7, 290.
[35] Lovelock, C.H. (1980), “Towards a classification of services”, in L. L. Berry, G. L. Shostack and G. Upah (eds.), Emerging Perspectives on Services Marketing, American Marketing Association, Chicago, 72-76.
[36] Lovelock, C.H. (1983), “Classifying services to gain strategic marketing insights”, Journal of Marketing, 47, summer, 9-20.
[37] Markovic, S., Gospodarstvo, N. (2006), “Expected service quality measurement in tourism higher education”, NG, 52, 1/2, 86-95.
[38] Nealon, J.L. (2005), “College and university responsiveness to students-as-customers: the reorganization of service delivery in the enrollment service arena”, Dissertation Abstracts International, University of Pennsylvania.
[39] Oh, H. (2000), “Diners’ perceptions of quality, value, and satisfaction”, Cornell Hotel and Restaurant Administration Quarterly, 41, 3, 58-66.
[40] Robert, E.W. (1996), “Quality factors in higher education: the student viewpoint”, College Student Journal, 30, 2.
[41] Robledo, M.A. (2001), “Measuring and managing service quality: integrating customer expectations”, Managing Service Quality, 11, 1, 22-31.
[42] Ruby, C.A. (1996), “Assessment of student satisfaction with selected student support services using the SERVQUAL model of a customer satisfaction”, Dissertation Abstracts International, Ohio University.
[43] Parasuraman, A., Berry, L.L., Zeithaml, V.A. (1993), “More on improving service quality measurement”, Journal of Retailing, 69, 1, 140-148.
[44] Parasuraman, A., Zeithaml, V.A., Berry, L.L. (1985), “A conceptual model of service quality and its implications for future research”, Journal of Marketing, 49, Fall, 41-50.
[45] Parasuraman, A., Zeithaml, V.A., Berry, L.L. (1988), “SERVQUAL: A multiple-item scale for measuring consumer perceptions of service quality”, Journal of Retailing, 64, 1, 12-40.
[46] Pariseau, S.E., McDaniel, J.R. (1997), “Assessing service quality in schools of business”, The International Journal of Quality and Reliability Management, 14, 3, 204.
[47] Pitman, T. (2000), “Perceptions of academics and students as customers: a survey of administrative staff in higher education”, Journal of Higher Education Policy and Management, 22, 2, 165-175.
[48] Quiram, B.J. (1995), Use of the SERVQUAL scale to measure expectations and perceptions of service quality in an ambulatory health care setting, Taxa A&M University, 1-79.
[49] Sahney, S., Banwet, D.K., Karunes, S. (2003), “Enchancing quality in education: application of quality function deployment – an industry perspective”, Work Study, 52, 6, 297-309.
[50] Sekaran, U. (2000). Research methods for business: a skill-building approach, New York, John Wiley & Sons, 110.
[51] Seymour, D.T. (1992), On Q: Causing quality in higher education, New York, MacMillan Press.
[52] Schmidt, R. (2002), “A student’s initial perception of value when selecting a college: An

Rev. Integr. Bus. Econ. Res. Vol 1(1) 291
Copyright 2012 Society of Interdisciplinary Business Research (www.sibresearch.org)
application of value added”, Quality Assurance in Education, 10, 1, 37-40. [53] Schwantz, G.D. (1996), “Service quality in higher education: Expectations and
perceptions of traditional and non-traditional students”, Dissertation Abstracts International, Texas Tech University.
[54] Shank, M.D., Walker, M., Hayes, T. (1995), “Understanding professional service expectations: Do we know what our students expect in a quality education?”, Journal of Professional Services Marketing, 13, 1, 71-190.
[55] Srikanthan, G., Dalrymple, J.( 2003), “Developing alternative perspectives for quality in higher education”, The International Journal of Educational Management, 17, 3, 126-136.
[56] Stodnick, M., Rogers, P. (2008), “Using SERVQUAL to measure the quality of the classroom experience”, Decision Sciences Journal of Innovation Education, 6, 1, 115-133.
[57] Teas, R.K. (1993), “Expectation, performance evaluation, and consumers’ perceptions of quality”, Journal of Marketing, 57, 3, 18-34.
[58] Tsoukatos, E., Rand, G.K. (2007), “Cultural influences on service quality and customer satisfaction: Evidence from Greek insurance”, Managing Service Quality, 17, 4, 467-485.
[59] Watson, S. (2003), “Closing the feedback loop: Ensuring effective action from student feedback”, Tertiary Education and Management, 9, 2, 145-157.
[60] Willis, T.H., Taylor, A.J. (1999), “Total quality management and higher education: The employers’ perspective”, Total Quality Management, 10, 7, 997-1007.
[61] Zeithaml, V.A. (1987), Defining and relating price, perceived quality, and perceived value, Report No. 87-101, Marketing Science Institute, Cambridge, MA.
[62] Zeithaml, V.A., Bitner, M.J., Gremler, D.D. (2006), Services marketing: Integrating customer focus across the firm, McGraw-Hill Irwin, NY.
[63] Zeithaml, V.A., Parasuraman, A., Berry, L.L. (1990), Delivering service quality: Balancing customer perceptions and expectations, Free Press, New York.