service operations management - walk-through-audit (wta) of lillian’s restaurant final project
DESCRIPTION
ProjectTRANSCRIPT

Walk-through-Audit (WtA) of Lillian’s Restaurant
By
Yannick Harvey 0704853Keisha Hitchman 0604681Cleardo Murray 0807121
Zonecia Simpson 0801434Robert Smith 0805497
Ralston Taylor 0804922
Submitted in Partial Fulfilment for the CourseService Operations Management (MAN3030)
College of Business ManagementThe University of Technology, Jamaica
April 2012

Table of ContentsOverview of the Walk-through-Audit for Lillian’s Restaurant......................................................................3
Methodology...........................................................................................................................................3
Relevance of Walk-through –Audit..........................................................................................................4
Analysis of Perception Gaps between Customers and Managers................................................................4
Dimensions of the Audit gaps- Tangibles.................................................................................................6
Dimensions of the Audit gaps- Tangibles.................................................................................................9
Dimensions of the Audit gaps- Responsiveness.....................................................................................10
Dimensions of the Audit gaps- Empathy................................................................................................14
Dimensions of the Audit gaps- Satisfaction...........................................................................................15
Recommendations.....................................................................................................................................17
APPENDIX..................................................................................................................................................19
References.................................................................................................................................................24

Overview of the Walk-through-Audit for Lillian’s Restaurant
This Walk-through-Audit (WtA) was done in order to establish the service quality of the
Lillian’s Restaurant by the means of employing an audit questionnaire to evaluate the service of
the business from the standpoint of management, employees and clients. The results presented is
in the form of charts and graphs that represent the analysis of data obtained from the
questionnaire as well as the assessment of gaps present between varying perception of clients and
management with regards to various aspects of the services provided by the business.
Recommendations however were made highlighting likely ways of losing these gaps.
The building housing the restaurant has been in existence since 1912 and was formerly
the Staff Common Room of the former College of Arts Science and Technology. The bungalow-
style building is now a National Monument. Lillian's underwent extensive renovations in the
wake of Hurricane Gilbert in 1988 and was officially opened by the School of Hospitality and
Tourism Management (formerly the Hospitality and Food Science Department) in November
1992.
Situated on the campus of the University of Technology, this restaurant is run by the
University. It's a delight to dine on the balcony for views of the Sculpture Park with its
magnificent works by some of the Caribbean's best. The decor consists of lots of wood and
plants to give an outdoors feel.
Methodology
Primary data was collected by the distribution of questionnaires while conducting the
walk through audit, this was done in order to identify the perception gaps present between
management and clients. The survey carried out included twenty individuals fifteen of which

were clients who were randomly selected; three employees and the remaining two were from the
management team at Lillian’s restaurant. The questionnaires that were distributed to persons for
questioning were collected immediately after they were answered. The questions consisted
statements from five categories of variables, which include: tangibles, reliability, responsiveness,
empathy and satisfaction. The answers were guided by a scale ranging from one to five where
respondents to indicate if they: strongly agree rated as 5, disagree, undecided, agree and strongly
disagree rated as. A copy of the questionnaire can be seen in the appendix.
Relevance of Walk-through –Audit
According to Fitzsimmons and Fitzsimmons 2008 ‘The walk-through audit can be a
useful diagnostic instrument for management to evaluate the gaps in perception between
customers and managers of the service delivery system.’ The customer visits the site less
frequently than the staff and management of the restaurant therefore they are more sensitive to
the subtle changes in the restaurant. In this research, we taught it would have been good to
review opinions of not only the customer and management but also the staff members. They are
the first line of contact for any customer and their views of the surrounding are also important.
To get an understanding of the sequence of the service, we have added a chart, which depicts the
view of the customers and well as the view of the activities that takes place behind the scenes.
This can be viewed in the appendix.
Analysis of Perception Gaps between Customers and Managers
In order for an organization to fix a problem, they first have to identify that there is a
problem. Many times managers are not aware of these problems as they are not as sensitive as
the customers, therefore the best way to find out what the problems or service gaps are, is to ask

the customers. According to Koljonen and Reid,2000 ‘Since current and future organizational
health is dependent on having highly satisfied, or better yet, delighted customers, it is important
for firms to continuously monitor and improve their performance as perceived by their clients…’
The service offered to the customer is more than the meal they eat. The service package
is described by Fitzsimmons and Fitzsimmons 2008 as ‘a bundle of goods and services with
information that is provided in some environment.’ The features of the service are: supporting
facility, supporting goods, information, explicit services, and implicit services.
The responses for each item on the audit were averaged for the three groups and are
shown in the figure 1 below.

Dimensions of the Audit gaps- Tangibles
To analyze the service, we will be reviewing each segment of the audit individually. The
tangible aspects of a service organization represent its physical facilities, equipment and
appearance of personnel, these are elements that relate to elements that relates to the supporting
facility. The gap caused by the tangibility of the business results from management’s failure to
provide physical evidences to meet perceptions of the clients’ expectations.
The expectations of the clients at Lillian’s restaurant is based on a high level of quality
and being a restaurant of its nature the physical appearance of the restaurant plays a great deal of
importance. However as it relates to the tangible aspects of the business there are some concerns
that must be addressed by management as there are some short falls that were highlighted from
the audit that was conducted. Based on the responses of the average clients and management, the
overall service of the restaurant was good but there are still some gaps which need to be tackled

to order to provide great satisfaction to their customers. Some factors that’s should be taken into
consideration includes the lighting of the facility and the opening and closing hours of the
business. This was evident by the responses gathered from the questionnaires answered by the
clients as oppose to those answered by the management team.
Results of audit questionnaire
The chart above depicts the ratings from clients, employees and the management of Lillian’s
restaurant with regards to the tangible aspects of the facility. The following statements were
made: restaurant is conveniently located, opening and closing hours are convenient, staff always
greets customers, lighting is adequate and appropriate and finally the condition of the physical
facility is appealing. From these statements each individual who was surveyed indicated their
response whether they strongly agree, agree, disagree or strongly disagree to these statements
while some individuals were undecided. After the analysis of data it was obtained that the
average rating was 4 as it relates to the location of the restaurant where both the employees and

clients shared the same view however the management rating was 3. The rating for the statement
with regards to the greeting of customers by employees reflected the same results as the location
of the restaurant with the exception of the management rating being 3.7. Therefore this goes to
show that customers’ expectations were met and did not exceed management requirements. The
responses for opening and closing hours however varied as clients’ ratings were 3.3, employees’
ratings were 3.7 and management ratings was 3.5. It can be stated then that the clients’
expectations exceeded the management requirements therefore creating a service tangibility gap.
Similar results could be seen with the responses for the appropriate and adequate lighting of the
facility where client’s ratings were 3.9, employees’ ratings were 2.7 and management rating was
4. Again management fell short in meeting clients’ expectations. The final statement which
revealed the ratings of the physical appearance of the facility being appeal are as follows: clients
3.6, employees 2.3 and management which was 3. Therefore two out of the five area of
tangibility that were investigated showed a gap that management needs to address in better
serving its clients hence giving them a great level of satisfaction.
From the empirical data collected from our target demographic via the
SERVQUAL model it can be seen that service quality is inversely related to the tangible
proportion of the service. Expectations of the clients are high, though not unrealistic and are not
matched by a minimum service. Even if some quality gaps are dramatically affected by the
particular characteristics of the restaurant, patterns between service quality and tangibility can be
identified. Indeed, although there are situations where the customer is satisfied and the gap is
positive, the general trend of the patterns identified is that of an increase of expectations and
gaps when moving between the perceptions of clients and management along the intangibility
scale.

Managers should seek the help of the clients in obtaining ways in which they could better
satisfy them in making the tangible aspects of the facility more appealing. Immediate
commitments should be facilitated in creating better lighting as well as more flexible opening
and closing hours in order to meet or exceed the expectations of their clients.
Dimensions of the Audit gaps- Tangibles
After the analyzing the information we observed that the perception gaps between the
management and the staff varied and in some cases were rather wide. Management strongly
agrees that the dishes always meet expectation while on the other hand the employees disagree.
This shows that there is an obvious perception gap. Management should therefore pay more
attention to the details of the meals to see if they are to a standard of quality. The employees pay
a more hands on role in the preparation of the dishes so there perception of what is quality is
somewhat more reliable. The clients however gave the dishes a fair rating.

Management and the employees both agree on the same level that the services provided
are always consistent and error free. They also have to bear in mind that in the service industry
there is always room for improvement; a fair evaluation is not necessarily the best one. It is now
up to the management team and the employees to improve the consistency level of their services
and maintain an error free process. There is no much of a perception gap existing between the
management and employees. However the clients rate this higher than both management and
employees, this shows that they are somewhat satisfied with the services provided but
nonetheless this does not rule out the need for improvement.
All agree that staff members are competent in performing their services. However as it
relates to whether or not waiting times are reasonable, there is a huge perception gap between the
clients are employees ratings. The employees strongly agree that the response time is reasonable
while the clients strongly disagree. Therefore it is clear that clients are waiting in line for a long
time and this time should be reduced. This could be due to the fact that managers know on
average the preparation time for a meal and based on this knwoledge believe they are doing well,
however the vast increase in fast food resturants today may be a cause for the decrese in the
williness of customers to wait a certain time period for food and this evidently has led to the
service gap.
Dimensions of the Audit gaps- Responsiveness
Responsiveness is the willingness to help customers and provide prompt service. The
service organization must be able to respond quickly, promptly, rapidly, immediately, instantly.
This is a very important dimension, because every customer feels more valued if they get the
best possible quality in the service. This area of the service package is quite important as it here

that the restaurant is capable of achieving customers’ delight, as this area caters to the explicit
and implicit services.
The statement ‘Guests are attended to as soon as they are seated’ shows an obvious gap in
perceptions between customers, employees and management. Customers were highly undecided,
employees agreed and management was undecided. Nobody likes waiting, yet customers often
have to wait for service. This shows an area where improvements need to be made, starting with
management ensuring that each table is assigned a waiter as soon as a customer is seated, to
increase their perceived value. Also, employees need to be fully committed and embrace their
role to ensure that the required level of response is met in time. Menu boards should be updated
in time to decrease the need to look on a menu when seated, so when a waiter comes, the
customer is ready to order. Automated menu boards are also an efficient solution display menu
items, because it can be changed from a computer instead of having someone physically do it.

The statement ‘Servers return within a minute after the entrée is served’ showed obvious
gaps also, as customers were undecided, employees were highly undecided and management
disagreed. Systems must be put in place to measure the time between when the entrée is served
and when the employee returns to the table. Customers like follow-up services, even though this
cannot be determined, it is the intrinsic value that the customers will gain, when they get the
attention they receive. It will also shows commitment by employees and management to high-
quality service.
The statement ‘Bill is given as soon as meal is finished’ did not show much of a gap
between because responses were roughly similar where employees, customers and management
were all undecided. Management needs to ensure that customers get the bill without delay,
because they are on a tight schedule.
The statement ‘Tables are cleared promptly’ also shows a similarity with less gaps as all
candidates answered undecided with a little variation. Tables should be cleared promptly to
before a customer comes to eat and after, to properly facilitate the flow of demand. Empty tables
equal opportunity for more business. So as soon as the customer’s table is cleared, they should
then receive the bill to make way for other customers who might be waiting in the system. This
eliminates lengthy waiting times and balking. The object is to attract business, not turn it away..
The statement ‘Recovery time for service failure is short’ also yielded the same result
with a slight variation as most candidates were undecided. If a mistake is made by employees,
management must ensure that a system is in place to recover for lost time. If an order is wrong or
does not meet the required expectation then other options like a complimentary dish or desert

should be given to alleviate disappointment. Two of the same dishes could also be prepared to
eliminate the mistakes.
Keeping the customer happy by responding to his or her needs is the key to long-term
success, and these vital tools will help to improve customer responsiveness.
1. Customers Self-Service Options
The restaurant should offer a buffet-style option. As a customer enters they can pick up a
plate and start serving their own meal.
2. Customer Data
Using a system like this will enable management to understand customer tastes and likes.
They can understand what dishes to prepare for the customer and how personalized it will
be. Waiters will have this knowledge and allow for a more personalized experience and
the customer will feel a part of the culture, giving a sense of belonging.
3. Customer Loyalty
Having a loyalty points system in place enables the customer to stay loyal to the brand
and help to build brand awareness. These points will make them eligible for different
types of meals, bonuses and even a possible free meal. This system shows appreciation
and will hook the customer towards the offering of the organization.

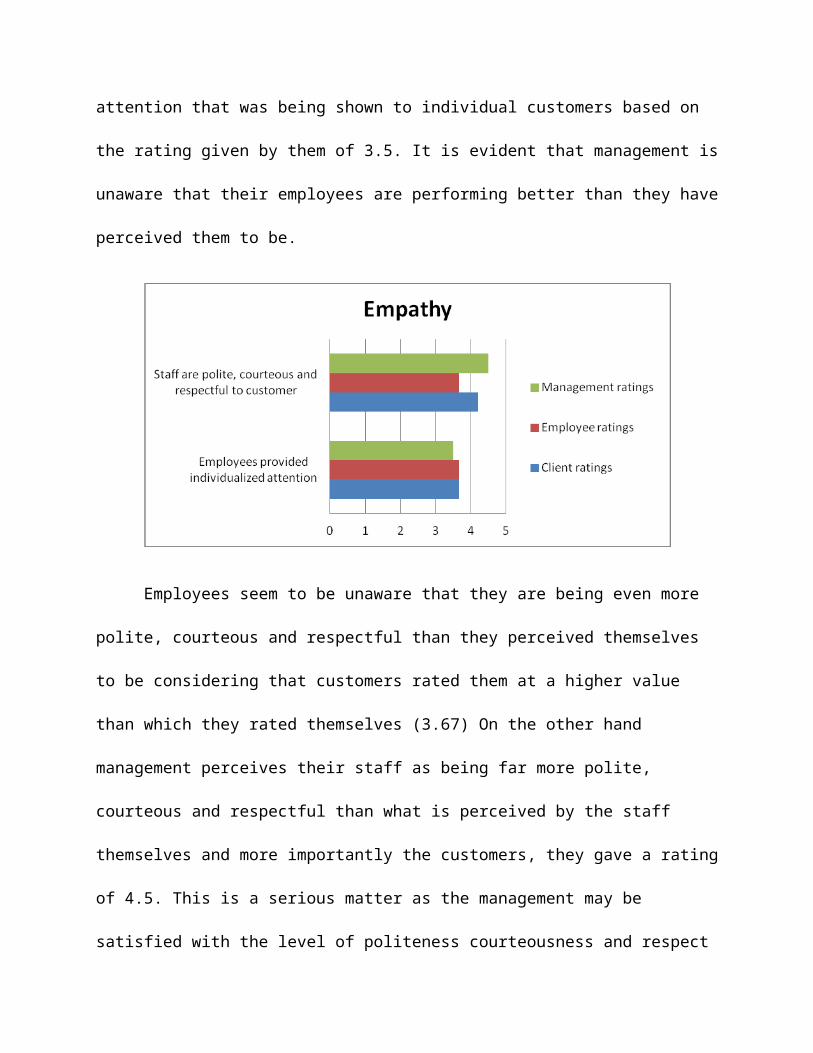
Dimensions of the Audit gaps- Empathy
There was no difference in client and employee rating as it relates to the perception of
employees providing individualized attention to customers, they both present a rating of 3.67.
However, the management seems to have thought less of the attention that was being shown to
individual customers based on the rating given by them of 3.5. It is evident that management is
unaware that their employees are performing better than they have perceived them to be.

Employees seem to be unaware that they are being even more polite, courteous and
respectful than they perceived themselves to be considering that customers rated them at a higher
value than which they rated themselves (3.67) On the other hand management perceives their
staff as being far more polite, courteous and respectful than what is perceived by the staff
themselves and more importantly the customers, they gave a rating of 4.5. This is a serious
matter as the management may be satisfied with the level of politeness courteousness and respect
they perceive is being extended to customers failing to realize it is actually below this level
which could eventually lead to service failures, which was represented by the clients rating of
4.2.
Results proved relatively well as their perception of their performance was mostly below
that which was perceived by the clients. These are positive results. Management could adopt the
“mystery shopper” technique where they have someone come in as a customer and observe the
way employees conduct themselves, so they will be aware of the way customers are dealt with.
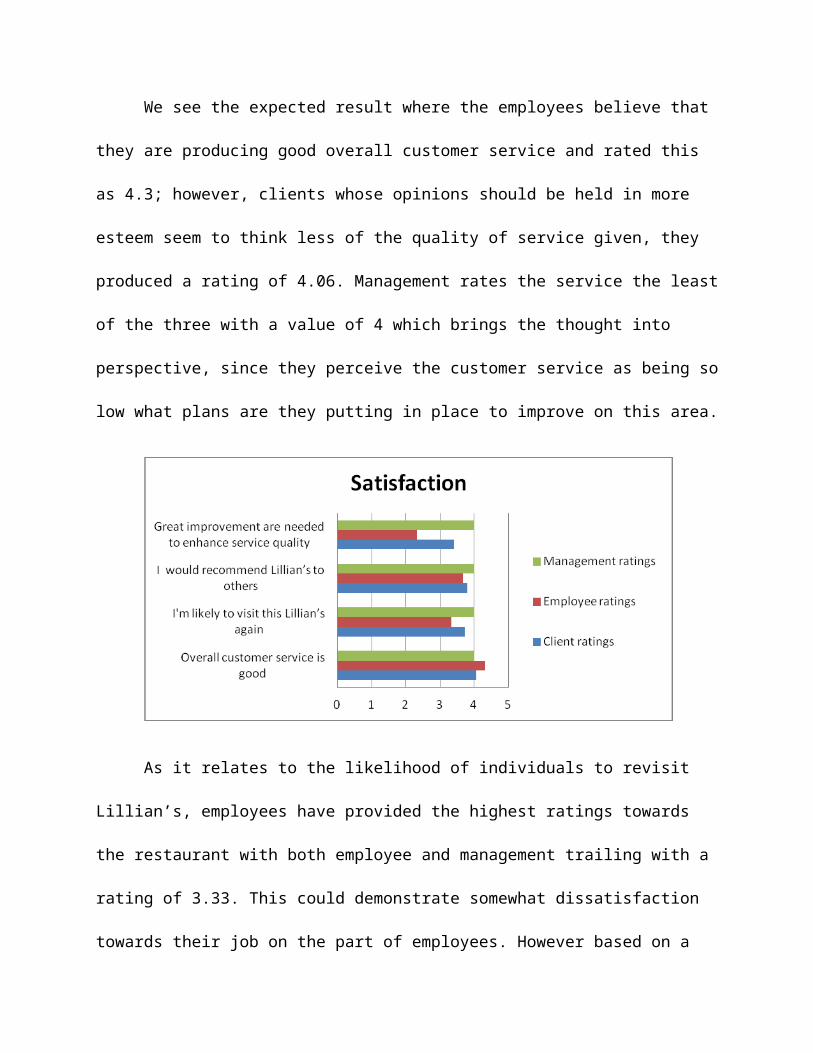
Dimensions of the Audit gaps- Satisfaction

We see the expected result where the employees believe that they are producing good
overall customer service and rated this as 4.3; however, clients whose opinions should be held in
more esteem seem to think less of the quality of service given, they produced a rating of 4.06.
Management rates the service the least of the three with a value of 4 which brings the thought
into perspective, since they perceive the customer service as being so low what plans are they
putting in place to improve on this area.
As it relates to the likelihood of individuals to revisit Lillian’s, employees have provided
the highest ratings towards the restaurant with both employee and management trailing with a
rating of 3.33. This could demonstrate somewhat dissatisfaction towards their job on the part of
employees. However based on a higher rating by clients (3.73) it could mean that whichever
factors are impacting on employees are not the same towards clients so these problems could be
internally based. Management rated this area as 4.
Employees seem to be very dissatisfied with their jobs after considering their ratings
(3.67) which were less than that of customers. Management as is expected displays the highest
ratings(4) towards recommending Lillian’s to others seeing they are in-charge of making

decisions within the organization however since employees are just given less power it would be
expected for them to give lower ratings as a result of them being in disagreement with some rules
set by management. The perception of clients which is the most important group rated this area
as 3.8.
Employees have displayed the lowest rating (2.33) towards enhancing service quality
since they know that whichever changes will be made will not necessarily involve or consider
their point of views. Management which had the highest ratings (4) displays its desire to
implement which ever changes will be necessary as long as it works out to the businesses
benefit. Clients tend to have an average rating (3.4) towards improvement of quality considering
the fact that they may be satisfied will the current service offering.
It is evident that there is not much consistence in the satisfaction of the clients,
Management along with their staff seem to be unaware of the level of satisfaction customers
require to rate their services as exceptional that is exceeding their perception. Lillian’s should
carry out a survey to find out the customers preferences and what they have been doing
wrongfully.
Recommendations
At the 7th annual POM Seminar that was held at the Jamaica Conference center on March
29, the presenter Mark Chisolm, executive VP from Sagicor, stated that the boss of the company
are their customers. It is imperative that the management and staff of Lillian’s recognize this
truth and make adjustments to close the service gaps identified. The clients perception of the
service offered at Lillian’s are, according to Koljonen and Reid as, ‘..often highly dependent on
the process that is used by a service organization to create and deliver them.’

It is our recommendation that the management embark on a continuous improvement
initiative to improve the service areas highlighted by the customers as they are highlighted in the
reviews. There should be periodic WtAs, to ensure that the implementations made match the
desires of the customers.

APPENDIX
April 10, 2012
Ms. SmickleLillian's Restaurant237 Old Hope Road Kingston 6
Dear Ms.Smickle
The purpose of this letter is to request consent to conduct an investigation at the Lillian’s Restaurant. We are a group of final year students enrolled in the Bachelor of Business Administration programme, majoring in Production and Operations Management. In the completion of this degree we are required to conduct a Walk-through Audit of a service organization or a service function in an organization, in partial fulfillment of the Service Operations Management course.
Due to the nature of this organization, we have considered Lillian’s Restaurant suitable to conduct the audit. This study is aims to categorize and identify the customer’s perceptions of the service experience and compare this with the perceptions of the manager and employees. This information will be pursued through the use of questionnaires, comprising of at least 25 questions.
Individual results of this study will stay confidential and anonymous. The observations, conclusions and recommendations identified and proposed from this study will be provided to your restaurant, at request, to aid in developing efficiency in all operations.
Regards
__________________________________Keisha HitchmanFinal Year Production and Operations Student

Appendix 2
Good day, we are final year students from the University of Technology conducting a walk through audit to facilitate our studies in the course Service Operations Management. The following set of statements relate to your perception of Lillian's Restaurant. For each statement, please show the extent to which you believe Lillian's Restaurant has the feature described by the statement by selecting responses ranging from “strongly disagree” to “strongly agree”. There are no right or wrong answers all we are interested in is a rating that best shows your insight about Lillian's Restaurant.
1. You are a:
☐ Student ☐ Lecturer ☐ Staff Member ☐ Visitor
2. Did you arrive alone or with others?
☐ Alone ☐ Others Number in Party: _______
3. Where did you hear about the restaurant?
☐ Newspaper ☐ Internet ☐ Magazine ☐ Friends ☐ Passing by
☐ Other (Specify) ____________________________________________________________
4. Do you dine-in or take-out?☐ Dine-in ☐ Take-out
5. How much time do you normally spend here? ______________________________________________________________________
Statements/CategoriesStrongly Disagree Disagree Undecided Agree
Strongly Agree
Tangibles 1 2 3 4 5
6. Restaurant is conveniently located
7. Opening and closing hours are convenient
8. Staff always greets customers
9. Lighting is adequate and appropriate
10. The condition of the physical facility is appealing
Reliability 1 2 3 4 5
11. Dishes always meet expectations
12. Service provided is always consistent and error free 13. Staff members are competent in performing the services
14. Waiting times are reasonable
Responsiveness 1 2 3 4 5
15. Guests are attended to as soon as they are seated.
15. Servers return within a minute after the entrée is served
16. Bill is given as soon as meal is finished
17. Tables are cleared promptly
18. Recovery time for service failure is short
Empathy 1 2 3 4 5
19. Employees provided individualized attention
20. Staff are polite, courteous and respectful to customer
Satisfaction 1 2 3 4 5
21. Overall customer service is good
22. I'm likely to visit this Lillian’s again
23. I would recommend Lillian’s to others 24. Great improvement are needed to enhance service quality

References
Barney, J. (2010). Strategic Management and Competitive Advantage: Concept and Cases. New
Jersey: Prentice Hall.
Fitzsimmons, J., Fitzsimmons M., (2008). Service Management: Operations,
Strategy, Information Technology 6th Edition. New York:
McGraw-Hill Irwin.
Johnston, R., Clark, G., (2001). Service Operations Management. Harlow, UK:
Prentice-Hall.
Koljonen, E., Reid, R., (2000). Walk-through audit provides focus for service improvements for
Hong Kong law firm. Emerald Library.
Kotler, P., & Armstrong, G. (2010). Principles of Marketing (13th Edition ed.). Upper Saddle
River, New Jersey: Pretence Hall.
Lovelock, C (1996). Services Marketing. New Jersey; Prentice Hall.