service life testing of railroad bearings 040814 - utrgv · service life testing of railroad...
TRANSCRIPT

SERVICE LIFE TESTING OF RAILROAD BEARINGS WITH KNOWN SUBSURFACE INCLUSIONS DETECTED WITH ADVANCED ULTRASONIC TECHNOLOGY
C.M. Tarawneh1, J.A. Turner2, L. Koester2, B.M. Wilson3
1Mechanical Engineering Department, University of Texas-Pan American, Edinburg, Texas2Mechanical and Materials Engineering Department, University of Nebraska, Lincoln, Nebraska3Research and Development, Amsted Rail, Granite City, Illinois
Railways 2014The Second International Conference on Railway Technology:
Research, Development and MaintenanceAjaccio, Corsica, France, 8-11 April 2014

Outline• Introduction and background
• Bearing component selection for service life testing
• Experimental setup and instrumentation
• Experimental procedure
• Experimental results• First teardown inspection• Second teardown
inspection• Third teardown
inspection• Fourth teardown
inspection• Fifth and final teardown
inspection• Conclusions and recommendations

Introduction and background
Roller bearings sustain the heavy loads often seen by railcars in the heavy haul rail industry.

Introduction and backgroundMain tapered-roller bearing
components
• One outer ring (cup)• Two inner rings (cones)• Rollers
Functionality of tapered-roller bearing components during
service• Cup:
• Supported on one side by pedestal of side frame
• Rotate incrementally during service
• Cone:• Rotates in unison with wheels
and axle• Undergoes cyclic loading as
regions enter and exit loaded zone
• Rollers:• Transfer load between outer
and inner ring
RollerRoller
CupCup
ConeCone
Figure 1: Tapered-roller bearing [1]

Introduction and background• Reduction in bearing life can be caused by improper:
• Assembly• Maintenance• Microstructure control
• Of particular importance is the presence of non-metallic inclusions in the steel.
• ‘Near surface’ inclusions are those that occur in the rolling contact fatigue (RCF) zones.
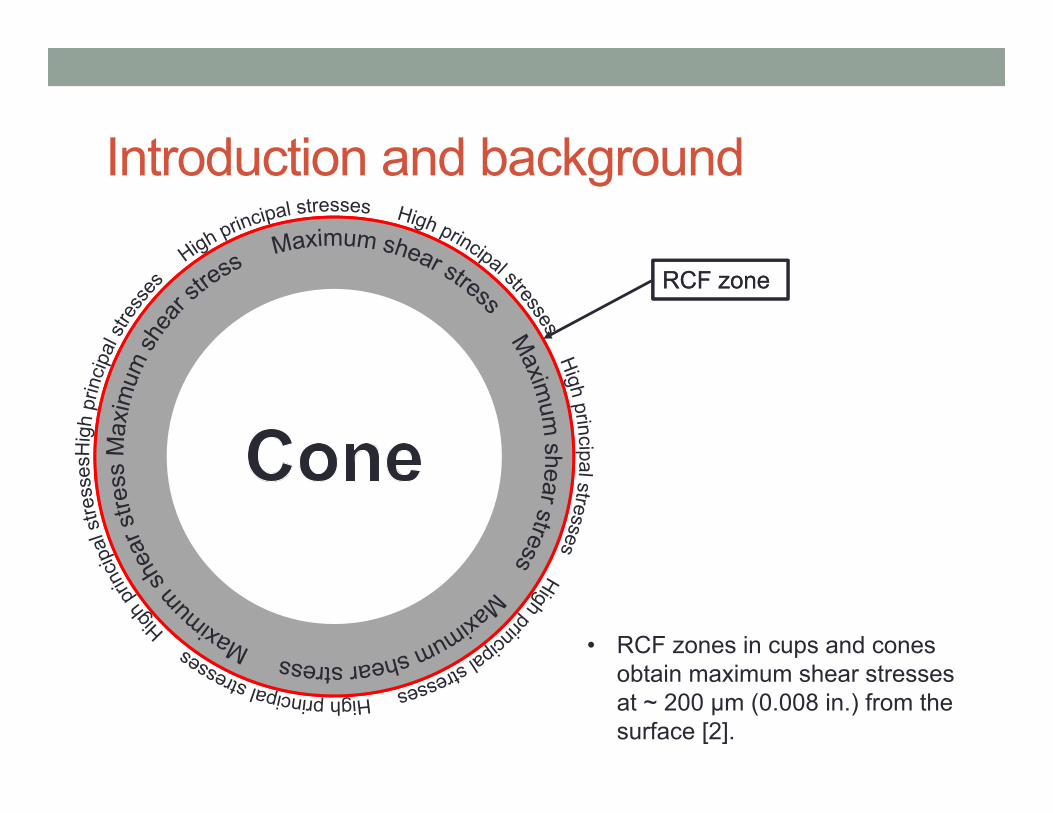
Introduction and background
RCF zoneRCF zone
• RCF zones in cups and cones obtain maximum shear stresses at ~ 200 μm (0.008 in.) from the surface [2].

Introduction and background• Inclusions act as stress risers.• Local stresses are elevated beyond endurance limit of
steel surrounding the impurity.
ImpurityImpurity

Introduction and background• Micro-cracking occurs as a result of the high local
stresses present in the steel surrounding the impurity.
Micro-crackingMicro-cracking

Introduction and background• Micro-cracking eventually reaches the surface and causes
“spalling” of the raceway.
‘Spalling’‘Spalling’

Introduction and background• Ultrasonic and optical methods are used to determine
inclusion content [3-7].• ASTM standard E45 [4] or ISO 4967 [7] are used to
identify and rate inclusions.
Sample section of material in
questionExamine area
microscopically
Examined area is
representative of bulk material

Introduction and background
Figure 2:C-scans of two bearings steels which have both been certified and rated as ‘Bearing Quality’ based on microscopic rating methods

Introduction and background• Even with quality measures based on optical and
ultrasonic methods, the possibility of inclusions near RCF zones still remains.
• This concern has led to advancements in steel production and bearing quality in rail industry [8, 9].
• Advancing these techniques even further would include identifying inclusions in the RCF zone of bearing.

Introduction and background• Ultrasonic surface waves
• Surface acoustic waves propagate along free surfaces through the depth of one acoustic wavelength
• Bearing cups and cones to be discussed are scanned using this method.
• Bearings with known near-surface defects are identified and subjected to service life testing.
• Spall locations and ultrasonic surface wave scanning results are compared.

Bearing component selection for service life testing
• Selection of bearing components to undergo service life testing was carried out by Amsted Rail’s bearing division, Brenco.
• Brenco used their ultrasonic inspection system.• Total number of ultrasonically scanned bearing
components:• Cups: 50• Cones: 40
• Components identified for possible service life testing:• Cups: 3• Cones: 12

Bearing component selection for service life testing• Components were retested at the University of Nebraska-
Lincoln (UNL) to verify results.
• Surface wave scanning specifications at UNL:• Scan resolutions• Minimize beam overlap by selected pulser setting• Maximize reflection from a laser machined hole of 60 μm
• Inspection volume limited to within ~ 200 μm of raceway surface (equivalent to one wavelength at 15 MHz testing frequency).

Bearing component selection for service life testing
• Results from the ultrasonic surface wave scanning performed at UNL are summarized in the succeeding tables.
• These tables list the locations of the near-surface inclusions of the selected cups and cones chosen for service life testing.

Test Cup Outboard (OB)/ Inboard (IB) θ [deg] z [mm]
AOB - -
IB 244.1 26.2
BOB 135.7 31.2
IB - -
C
OB 264.3 32.7
OB 66.5 4.4
IB 99.4 35.0
IB 294.8 6.4
Table 1: Circumferential (θ) and vertical (z) positions of the subsurface inclusions found in three bearing cups (outer rings) selected for service life testing

Cone No. θ [deg] z [mm] Cone No. θ [deg] z [mm]
2 151.0 29.0 14 257.0 10.5
10225.5 4.5
1636.5 34
337.5 26.5 292.0 4.0
24
215.5 23.5
5
72.0 30.5
237.5 5.0 129.0 37.0
314.0 36.5 151.0 8.0
240.5 23.5
32
103.0 23.0
31
79.5 21.5
104.5 17.5 195.5 28.0
117.0 35.5 257.5 40.5
248.5 28.5 265.0 32.0
117.0 35.5 273.0 9.5
Table 2: Circumferential (θ) and vertical (z) positions of the subsurface inclusions found in eight bearing cones (inner rings) selected for service life testing

Figure 3:Photographs of the cup (outer ring) showing the reference points for the circumferential (θ) and vertical (z) coordinates for the inboard (IB) and outboard (OB) raceways

Figure 4:A scan image of the inspection performed on Test Cup C which indicates the presence of four distinct sub-surface inclusions on the inboard (top) and outboard (bottom) raceways

Bearing component selection for service life testing• For the service life testing of the cones with subsurface
inclusions, defect-free cups were used.
• Defect-free cones were used for the service life testing of cups with known subsurface inclusions.
• Rollers and other bearing components were not inspected for subsurface inclusions.
• Total number of cups and cones used for service life testing• 3 cups• 8 cones

Experimental setup and instrumentation
• Service life tests were performed using the dynamic bearing tester at the University of Texas Pan-American (UTPA).
• Dynamic test rig:• 4 Class K (150 × 250 mm)
tapered-roller bearingsFigure 5:Photograph of the dynamic
bearing tester used to conduct the service life test for this study

Experimental setup and instrumentation
Dynamic test rig• Rotates at 4 different angular
velocities:• 498 r/min [85.3 km/h (53 mph)]• 562 r/min [96.6 km/h (60 mph)]• 618 r/min [106.2 km/h (66 mph)]• 794 r/min [136.8 km/h (85 mph)]
• 3 fans provided cooling:• Avg. speed of 5 m/s (11.2 mph)
• Equipped with a hydraulic cylinder:• Applies loads ranging from 0
to 175% of full load• 100% load ~ 159,000 N
(35,750 lb) per bearing

Experimental setup and instrumentation
• In an effort to accelerate service life test, testing conditions were:• Speed: 136.8 km/h (85 mph)• Load: 125%
• For cold starts when the bearing grease is more viscous, a 17% load setting was applied to the bearings.• Avoids motor overloading

Experimental setup and instrumentationInstrumentation
specification• K-type bayonet
thermocouples• 500 g high-frequency
accelerometers• National Instruments (NI)
data acquisition system (DAQ)• NI PXIe-1062Q• NI TB-2627 – thermocouples• NI PXI-4472B – 8-channel
Figure 6: Schematic showing the top and rear view of the dynamic bearing tester, including sensor locations

Experimental setup and instrumentation
• A 10-32 coaxial jack and BNC connection was used to connect accelerometers to NI PXI-4472B
• Odometer affixed to end-cap of Bearing 4 to track mileage
Instrumentation
Software
• DAQ programmed using LabVIEW™• Analysis of acquired data was performed using
MATLAB™

Experimental procedure
Control (Defect-Free)
CupB C A
Test cup [setup before first teardown]

Experimental procedure
Control (Defect-Free)
CupC B A
Test Cup [Setup After First Teardown]

Experimental procedure
• Bearings 2 and 4, near-surface inclusion sites placed:• Region of maximum load (12 o’clock)• Loaded zone of outer ring (cup)
• Bearing 3, near-surface inclusion sites placed:• OB ~ 264° and IB ~ 99° in loaded zone (around 12 o’clock)• Other two inclusions in unloaded region of cup (bottom
hemisphere)
Test cup setup

Experimental procedure
• Thermocouples and accelerometers were instrumented before testing
• 17% load applied for break-in at 136.8 km/h (85 mph)• Following break-in period, load increased to 125% of full
load (100% ~ 35,750 lbf for AAR Class K bearing)• Axle speed maintained at 136.8 km/h• 125% load and 136.8 km/h were the test settings
maintained throughout service life test
Testing conditions

Experimental procedure
• Service life test was to run uninterrupted.• Monitor temperature and vibration signatures of the 4 bearings
• Test stopped if either temperature history or vibration signal indicated abnormal bearing operation.• bearings disassembled and visually inspected
• After thorough inspection:• Bearings rebuilt
• Test resumed
• Total distance traveled recorded
Test plan

Experimental procedure
• Test plan repeated until bearings have cycled for an equivalent of at least 402,336 km (250,000 mi)• Represents typical benchmark for simulated service life testing
• Typical service life test takes between 6 to 9 months to complete• Varies with number of teardowns and inspections

EXPERIMENTAL RESULTS·First teardown inspection·Second teardown inspection·Third teardown inspection·Fourth teardown inspection·Fifth and final teardown inspection·

Experimental results
• Temperature profiles and vibration signatures were closely monitored throughout testing.
• First signs of abnormal behavior observed in Bearing 3.• Increase in temperature over last 5 hours of test• Corresponding increase in vibration energy (indicative of defect
initiation)

600 610 620 630 640 650 660 670 68020
30
40
50
60
70
80
90
100
110
120
Time [h]
Bea
ring
Cup
Tem
pera
ture
[o C]
Average Bayonet Temperature Profile
Bearing 1Bearing 2Bearing 3Bearing 4Ambient
Figure 7: Average temperature profiles of all four bearings prior to the first teardown

Experimental results
• Temperature is the primary identifier for degrading bearings in railroad industry.
• Tracking of bearing vibration energy has shown to be more effective in certain cases [10].
• Vibration events usually precede temperature fluctuations.• In this case, increase of vibration energy for Bearing 3
was observed after 114,294 km (71,019 mi).• Bearing tester was stopped after running 115,799 km
(71,954 mi) for teardown and visual inspection of all 4 bearings.

First teardown inspection
• Spall found Bearing 3 (Test Cup C) • Cup outboard (OB) raceway• θ = 264° (matched θ from Table 1)• Top of raceway (z < 20 mm)• 16.05 mm long and 9.80 mm wide (0.632 × 0.386 in.)
• Subsurface inclusion detected at z = 32.7 mm (Table 1)
• Spall formed after 115,799 km (71,954 mi) at 85 mph and 125% load.

Figure 8: Photographs of the first cup spall that developed on Bearing 3 (Test Cup C) – Teardown 1
Spall Area = 157.3 mm2
Location of the subsurface inclusion as detected by the ultrasonic scans
First teardown inspection

First teardown inspection• After bearing inspection, all bearings were reassembled and testing resumed.
Bearing Position of subsurface inclusions
2 (Test Cup C)Spalled region in unloaded zone of cup; other subsurface inclusions in maximum loaded zone
3 (Test Cup B) Subsurface inclusion placed in region of maximum load
4 (Test Cup A) Subsurface inclusion placed in region of maximum load
Table 3: Bearing location with corresponding description of subsurface inclusion position
• Bearings 2 and 3 exchanged to verify independency of vibration energy with respect to location on test axle assembly.

Figure 9: Average temperature profiles of all four bearings after the first teardown and prior to the second teardown
0 50 100 150 200 250 300 350 40010
20
30
40
50
60
70
80
90
100
110
Time [h]
Bea
ring
Cup
Tem
pera
ture
[o C]
Average Bayonet Temperature Profile
Bearing 1Bearing 2Bearing 3Bearing 4Ambient

Second teardown inspection
• Deterioration of existing spall on Bearing 2 (Test Cup C)• θ = 264°• Size increased to a maximum length of 36.42 mm and a maximum
width of 9.39 mm• Area increased from 157.3 mm2 (first teardown) to 237.87 mm2
(second teardown)
• New spall length coincides with subsurface inclusion location (z = 32.7 mm, Table 1)

Second teardown inspection
Figure 10: Photograph of the cup spall on Bearing 2 (Test Cup C) after deterioration –Teardown 2
Spall Area = 237.87 mm2

Second teardown inspection
• Visual inspection of the other three bearings revealed no defects or spalls.
• Bearings were rebuilt, and assembled in the exact configuration prior to second teardown.
• Service life testing resumed.

0 20 40 60 80 100 120 140 160 18020
30
40
50
60
70
80
90
100
110
120
Time [h]
Bea
ring
Cup
Tem
pera
ture
[o C]
Average Bayonet Temperature Profile
Bearing 1Bearing 2Bearing 3Bearing 4Ambient
Figure 11: Average temperature profiles of all four bearings after the second teardown and prior to the third teardown

Third teardown inspection
• Further deterioration of the existing spall on Bearing 2
(Test Cup C) was discovered.
• Maximum length and width remained the same as in the second
teardown.
• Wider region of spall increased in length.
• Total area changed from 237.87 mm2 to 261.42 mm2

Third teardown inspection
Location of the subsurface inclusion as detected by the ultrasonic scans
Figure 12: Photographs of the cup spall on Bearing 2 (Test Cup C) after second sign of deterioration – Teardown 3

Third teardown inspection
• Bearings were rebuilt, assembled onto axle in same configuration prior to teardown, and testing resumed.
• Noticeable increase in temperature and vibration data• Bearing 2 (Test Cup C)• 288,074 km (179,001 mi)
• Tester stopped, and visual inspection of all bearings was performed.

Fourth teardown inspection
• New spall discovered on Bearing 2 (Test Cup C)• Inboard (IB) cup raceway• θ = 295° (matched θ from Table 1)• Approx. 20.85 mm long and 5.26 mm wide (0.821 × 0.207 in)• z = 6.4 mm (coincident to z from Table 1)

Fourth teardown inspection
Location of the subsurface inclusion as detected by the ultrasonic wave scans
Figure 13: Photographs of the second cup spall that developed on Bearing 2 (Test Cup C) – Teardown 4

Fourth teardown inspection• Initial stages of spall formation on Bearing 3 (Test Cup B)
• Location of near-surface inclusion matching location from ultrasonic wave scans (Table 1)
• Spall location placed directly under maximum load region.
Figure 14: Photograph of the initial stage of cup spall formation on Bearing 3 (Test Cup B) –Teardown 4

Fourth teardown inspection
• Bearing assembly on axle identical to the setup prior to fourth teardown.
• Testing resumed with close monitoring of Bearings 2 and 3.
• Milestone reached following fourth teardown• 402,336 km (250,000 mi)• Total mileage reached: 420,729 km (261,429 mi)

0 50 100 150 200 250 300 350 400 450 5000
20
40
60
80
100
120
Time [h]
Bea
ring
Cup
Tem
pera
ture
[o C]
Average Bayonet Temperature Profile
Bearing 1Bearing 2Bearing 3Bearing 4Ambient
Figure 15: Average temperature profiles of all four bearings after the fourth teardown and prior to the fifth and final teardown

Fourth teardown inspection
• Increase in vibration energy of Bearing 4 (Test Cup A)• 415,394 km (258,114 mi) of operation
• Similar increase in energy of Bearing 3 (Test Cup B)
• Abnormal behavior in vibration energy prompted fifth and final teardown of service life test.

FIFTH AND FINAL TEARDOWN INSPECTIONBearing 1 (Defect-Free Cup)·Bearing 2 (Test Cup C)·Bearing 3 (Test Cup B) ·Bearing 4 (Test Cup A)

Bearing 1 (Defect-Free Cup)
• Ultrasonically scanned prior to the start of the service life test• No subsurface inclusions detected• Determined to be defect-free (healthy) bearing
• Operating temperature lower than other three bearings throughout service life test.
• Lowest vibration energy levels compared to other three bearings.
• After inspection of this bearing• Exhibited no signs of defects or abnormalities• Ran a total of 420,729 km (261,429 mi)

Bearing 2 (Test Cup C)
Figure 16: Photographs of Spall 1 (left) and Spall 2 (right) on Bearing 2 (Test Cup C) – Teardown 5
Spall 1 Spall 2
Spall Area = 933.83 mm2

Bearing 2 (Test Cup C)
Figure 17: Photographs of the condition of the associated rollers with Spall 1 (left) and Spall 2 (right) of Bearing 2 (Test Cup C) upon final inspection – Teardown 5
Pitted rollers associated with Spall 1 Spalled roller associated with Spall 2

Bearing 2 (Test Cup C)
• Significant increase in area of second cup spall (Spall 2).• Length of 48.26 mm and a width of 19.35 mm (1.9 × 0.762 in)• Area increased from 109.67 mm2 to 933.83 mm2
• Spall 2 grew 8.5 times its original area• 117,285 km (72,878 mi)
• Corresponding roller to Spall 2 found to have two spalls (Figure 17).
• Rollers on both cone assemblies exhibited pitting.• No noticeable increase in size of Spall 1.
• Positioned in unloaded zone, unlike Spall 2

Bearing 3 (Test Cup B)
Figure 18: Photographs showing the irregular wear patterns on the inboard and outboard raceways of Bearing 3 (Test Cup B) – Teardown 5
Inboard Raceway Outboard Raceway

Bearing 3 (Test Cup B)
Figure 19: Photograph of a comparison of a roller from Bearing 1 (Healthy) and two rollers Bearing 3 to demonstrate the “heat tint” discoloration – Teardown 5

Bearing 3 (Test Cup B)
• No change in initial stage of spall formation (Figure 14) from previous teardown.
• High vibration energy compared to Bearing 1 (defect-free bearing).
• One of the highest operating temperatures.• Abnormal discoloration of rollers similar to a distinct heat
tint (Figure 19). • Irregular wear patterns visible on both cup raceways
(Figure 18).

Bearing 4 (Test Cup A)
Figure 20: Pictures of the cup spall that developed on Bearing 4 (Test Cup A) –Teardown 5

Bearing 4 (Test Cup A)
Figure 21: Photograph of the associated cage damage due to the cup spall on Bearing 4 (Test Cup A) – Teardown 5

Bearing 4 (Test Cup A)
• Inspection of Bearing 4 revealed a large cup spall• Inboard (IB) cup raceway• θ = 310° ≠ 244.1° (Table 1)• Approx. 36.00 mm long and 25.35 mm wide (1.417 × 0.998 in.)• Reached an area of 912.6 mm2 (1.414 in2) within 5,335 km (3,315
mi) of operation
• Polyamide cage corresponding to spalled raceway formed a large crack (Figure 21).

Teardown Number Event Description Test
Cup
Defect Size
[mm2]
Distance When Energy Increased (Distance since
Rebuilding)[km]
Total Distance to Teardown
[km]
1First spall initiated (Spall 1) [OB, θ ≈ 264°, z < 20 mm] C 157 114,294 115,799
2 Area of Spall 1 increased (Figure 9) C 238 234,695(118,897) 238,260
3 Area of Spall 1 increased (Figure 15) C 261 258,760(118,897) 262,604
4
Second spall formed (Spall 2) [IB, θ ≈ 295°, z = 6.4 mm] C 110 288,074
(25,470) 303,444
Initial stages of spall formation [OB, θ ≈ 136°, z = 31.2 mm] B ~4 288,074
(25,470) 303,444
5
• Area of Spall 2 increasedsignificantly
• Roller spalls formed (Figure 16)C 934 N/A 420,729
• Distinct ‘heat tint’ discoloration observed on rollers
• Irregular wear patterns visible on both cup raceways (Figure 17)
B N/A N/A 420,729
• First spall formed (Spall 3) [IB, θ ≈ 310°, z > 25 mm]
• Polyamide cage developed a significant crack on the smaller diameter rim (Figure 20)
A 913 415,394(111,950) 420,729
Table 4: Summary of all teardowns for the ultrasonically scanned bearing cup service life test (performed in 2012)

Teardown Number Event Description
Test Con
e
Defect Size
[mm2]
Distance When Energy
Increased (Distance since
Rebuilding)[km]
Total Distance to Teardown
[km]
1 General teardown and inspection of all test bearings N/A None N/A 196,262
2 First spall initiated on Test Cone 5[θ = 72°, z = 30.5 mm] 5 70 303,259 319,765
3Spall on Test Cone 5 deteriorated significantly and spread across the length of the raceway
5 844 354,056(34,291) 380,002
4
First spall initiated on Test Cone 32[θ = 104.5°, z = 17.5 mm]
32 152 373,094(53,329) 406,394
First spall initiated on Test Cone 16 16 94 395,072
(15,070) 406,394
5
Area of the spall on Test Cone 32 increased significantly and spread across the length of the raceway
32 405 410,056(3,662) 420,937
Rollers associated with Test Cone 32 exhibited signs of pitting 32 N/A N/A 420,937
Table 5: Summary of all teardowns for the ultrasonically scanned bearing cone service life test (performed in 2011)

Conclusions and recommendations
• Near-surface inclusion on the outer-ring (cup) raceways initiate early stage spalling at low mileage.• First spall formation after 114,294 km (71,019 mi) of operation.
• Quick deterioration of a spall can occur without exhibiting any signs in temperature history.• Once spall is large enough, increase in temperature can occur.
• Bearing 4 (Test Cup A) spall size of 912.6 mm2 within 5,335 km (3,315mi) of operation.
• Bearing 2 (Test Cup C) spall grew ~8.5 times its size in approximately 117,285 km (72,878 mi) of operation.

Conclusions and recommendations
• Service life test of ultrasonically scanned bearing cones (inner rings) also demonstrated the effect of near-surface inclusions.• Spall initiation of three cones (Test Cones 5, 32, and 16)
summarized in Table 5.
• Spalls developed on Test Cones 5 and 32 matched the near-surface inclusion locations detected in the ultrasonic wave scan.
• Test Cone 16 matched z-location but was off ~15° in the θ-location.
Conclusions and recommendations• Spalls could potentially cause catastrophic bearing failure
over short periods of operation.• e.g. Test Cone 5 spall grew 12 times in size within 60,237 km
(37,430 mi) of operation, and spall on Test Cone 32 nearly tripled in size after 14,543 km (9,037 mi) of operation.
• Comparing the two service life tests, cups developed spalls much faster than cones.• e.g. Test Cup C developed its first spall in 114,294 km (71,019 mi),
whereas, first spall initiation on Test Cone 5 took 303,259 km (188,436 mi) of operation

Conclusions and recommendations
• Adjust depth of ultrasonic wave scans to capture relevant inclusions that might be a little deeper beyond the expected maximum Hertzian contact stress region.
• Service life tests highlight importance of steel cleanliness for tapered-roller bearing production.
• Low overall inclusion rates does not guarantee that inclusions will not end up in rolling contact fatigue (RCF) zone.
• The results accentuate the need to use surface wave scanning as a quality control tool.

Acknowledgments
• Special thanks to Amsted Rail’s bearing division, Brenco, for providing the opportunity to work on this project, and Amsted Rail for funding the research.

References[1] Amsted Rail Company, Inc., "Amsted Rail," 6 April 2014. [Online].
Available: http://www.amstedrail.com/amstedrail/content/bearings.[2] M.G. Dick, B.M. Wilson, “Roller Loads and Hertzian Contact Stress
Modeling in Railcar Bearings Using Finite Element Analysis”, Proceedings of the ASME RTD/TTCI Roller and Journal Bearing Symposium, Chicago, Illinois, September 11-12, 2007.
[3] ASTM A388/A388M-11, “Standard Practice for Ultrasonic Examination of Steel Forgings”, Annual Book of ASTM Standards, Vol. 01.05, ASTM International, West Conshohocken, PA, 2011.
[4] ASTM Standard E 45-11, “Standard Test Method for Determining the Inclusion Content of Steel”, Annual Book of ASTM Standards, Vol. 03.01, ASTM International, West Conshohocken, PA, 2011.
[5] ASTM Standard E1245-03, “Standard Practice for Determining the Inclusion or Second-Phase Constituent Content of Metals by Automatic Image Analysis”, Annual Book of ASTM Standards, Vol. 03.01, ASTM International, West Conshohocken, PA, 2008.

References[6] ASTM Standard E2283-08, “Standard Practice for Extreme Value
Analysis of Nonmetallic Inclusions in Steel and Other Microstructural Features”, Annual Book of ASTM Standards, Vol. 03.01, ASTM International, West Conshohocken, PA, pp. 1341-1351, 2009.
[7] ISO 4967, “Determination of Content of Nonmetallic Inclusions –Micrograph Method Using Standard Diagrams”, Methods of Testing, TC 17, American National Standards Institute, 1998.
[8] H.K.D.H. Bhadesha, “Steels for Bearings”, Progress in Materials Science, Vol. 57, pp. 268-435, 2012.
[9] U. Zerbst, K. Madler, H. Hintze, “Fracture Mechanics in Railway Applications - An Overview”, Engineering Fracture Mechanics, Vol. 72, pp. 163-194, 2005.
[10] C. Tarawneh, J.A. Kypuros, A.A. Fuentes, B.M. Wilson, B.A. Gonzalez, G. Rodriguez, R.K. Maldonado, “Vibration Signatures of Temperature Trended Bearings in Field and Laboratory Testing”, Proceedings of the ASME RTD Fall Technical Conference, RTDF2009-18038, Ft. Worth, Texas, October 20-21, 2009.

References[11] U. Zerbst, K. Madler, H. Hintze, “Fracture Mechanics in Railway
Applications - An Overview”, Engineering Fracture Mechanics, Vol. 72, pp. 163-194, 2005.
[12] L. Koester, C. Zuhlke, D. R. Alexander, A. J. Fuller, B. M. Wilson, and J. A. Turner, “Near-race ultrasonic detection of subsurface defects in bearing rings,” J. ASTM Int. STP1548, West Conshohocken, PA, pp. 84-101, 2012.
[13] C. Tarawneh, L. Koester, A. J. Fuller, B. M. Wilson, J. A. Turner, “Service Life Testing of Components with Defects in the Rolling Contact Fatigue Zone”, ASTM International, STP 1548, West Conshohocken, PA, pp. 67-83, 2012.
[14] C. Tarawneh, J.A. Kypuros, A.A. Fuentes, B.M. Wilson, B.A. Gonzalez, G. Rodriguez, R.K. Maldonado, “Vibration Signatures of Temperature Trended Bearings in Field and Laboratory Testing”, Proceedings of the ASME RTD Fall Technical Conference, RTDF2009-18038, Ft. Worth, Texas, October 20-21, 2009.
[15] C. Tarawneh, A. A. Fuentes, J. A. Kypuros, L. A. Navarro, A. G. Vaipan, B. M. Wilson, “Thermal modeling of a railroad tapered roller bearing using finite element method”, Journal of Thermal Science and Engineering Applications, Vol. 4, No. 3, pp. 9-19, 2012.