serology in general paresis
TRANSCRIPT

SEROLOGY IN GENERAL PARESIS*
BY J O S E P H R. BLALOCK, M. D., AND LELAND E. HINSIE, M. D. NEW YORK~ N. Y.
A. GENERAL CONSIDERATIONS
The data presented herein cover all available serological infor- mation on patients treated at the New York State Psychiatric In- stitute and Hospital from 1923 to 1935 inclusive. The total time included in the survey is somewhat over twelve years. During this period there were over 300 patients under treatment. Our reports sometimes refer to different numbers of patients, the differences being due to the number of patients accessible at any given time to the different laboratory tests employed.
The report refers only to patients with adult acquired general paresis and does not include any of the juvenile forms. Moreover the patients were carefully selected on the basis of suitability for the treatment planned for them. Patients who were to have the heat form of treatment had to meet the requirements that are com- monly laid down for heat therapy. Likewise, patients entering the hospital for the purpose of getting chemotherapy were carefully selected. There was no selection made on the basis of duration of psychosis before treatment was instituted. Furthermore, there was no selection with regard to the clinical condition of the patient unless there were clinical signs and symptoms that would contra- indicate the employment of a given method of therapy. I t is per- haps unnecessary to state that no selection was made on the grounds of severity of the serological reports. Each patient re- ported upon exhibited serological data (in addition to clinical find- ings) that placed the patient in the general paretic diagnostic grouping.
From the standpoint of therapeutic response there is no unan- imity of opinion among investigators that sex plays a decisive r6]e. I t will be noted that among our patients the ratio of males to females was approximately two to one.
Chart I and Tables 1 to 5 summarize serological data with ref- erence to all the patients available for study, irrespective of the
*From the clinical department o5 the New Tork State l~sychiat~ic Institut~ ~nd Hospital, New York~ N. Y.

JOSEPH R. BLALOCK, l~I. D., AND LELAND E. HINSIE~ M.D. 85
type of therapy employed. I t was thought desirable first to gain a general appreciation of the results of modern methods of thera- peutic approach to general paresis. The methods used by us in- cluded fever therapy( malaria and electropyrexia) and chemother- apy (tryparsamide and mercury). In subsequent charts and tables serological data referable to specific methods of approach are pre- sented.
1. Blood Wassermann (Chart I and Table 1) When we reviewed the blood Wassermann reactions of all pa-
tients, irrespective of the kind of treatment they received, it was observed that 8.1 per cent had a negative blood Wassermann reac- tion prior to therapy. Within a few months after treatment was completed, approximately 17 per cent of the patients had a negative blood Wassermann reaction. At the end of five years, when we examined 96 of the original 322 patients, almost 43 per cent of the patients had a negative blood Wassermann reaction. At the end of 10 years, with observations covering 28 patients, 75 per cent of them had a negative blood Wassermann reaction. We are im- pressed with the general observation that serological improvement appears to become more pronounced during the third and fourth years following therapy. With regard to the blood Wassermann reaction from the standpoint of sex, it appears from our own sta- tistics that negative responses are higher during the first three years in men than in women, almost twice as many men as women showing negative reactions. During the fourth year the percent- age of negative responses is approximately equal in both sexes. During the fifth, sixth and seventh years negative blood Wasser- mann reactions in women are appreciably higher than those in men. At the end of 10 years, when we examined 28 patients of the original group, negative blood Wassermann reactions were ap- proximately the same for both sexes (76.5 per cent for males and 72.7 per cent for females).
I t is interesting to note that at the end of 10 years there were no women and only 5.9 per cent of men who showed a strongly positive blood Wassermann reaction. Almost all of the patients studied by us showe4 a progressive decline in the intensity of
86 SEROLOGY IN GENERAL PARESIS
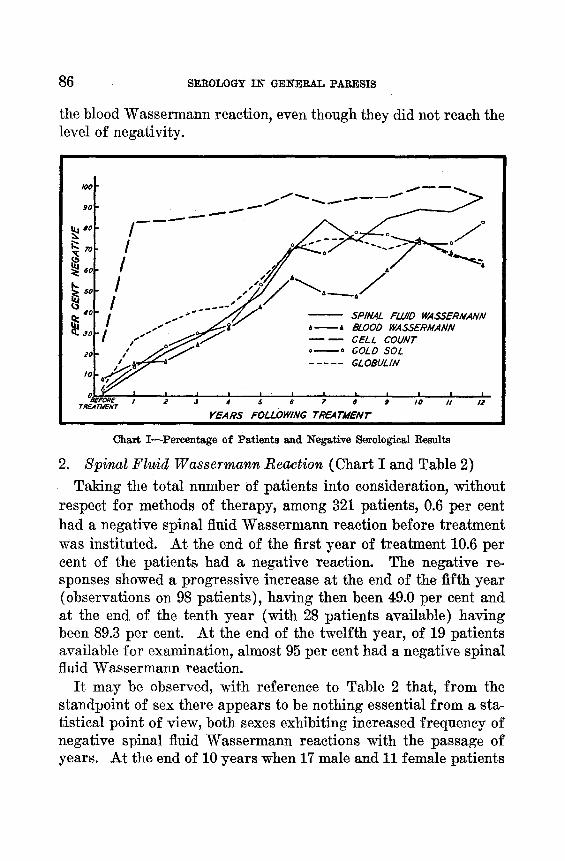
the blood Wassermann reaction, even though they did not reach the level of negativity.
/00 - - - -
~ - - o
I .Z
~ I . . - "---~/" - - S l e l N A L F L U I D W A S S E R M A N N
" ...-" ~ " A a BLOOD WASSERMANN "~ I / . . . . . . . . . . .
. , / . ~ ' l " - �9 , o ~OLD s o l 2# i . I
I0
~ ' ~ / ~ " J a J i I " I I I I I I I ~EFORE I ~ 3 4 $ 6 T 8 9 I 0 I I I ~
TR~A ;~4ENT YEARS FOLLOWING TREATMENT
i i i
Chart I--Percentage of Patients and Negative Serological Results
2. Spinal Fluid Wassermann Reaction (Chart I and Table 2)
Taking the total number of patients into consideration, without respect for methods of therapy, among 321 patients, 0.6 per cent had a negative spinal fluid Wassermann reaction before treatment was instituted. At the end of the first year of treatment 10.6 per cent of the patients had a negative reaction. The negative re- sponses showed a progressive increase at the end of the fifth year (observations on 98 patients), having then been 49.0 per cent and at the end of the tenth year (with 28 patients available) having been 89.3 per cent. At the end of the twelfth year, of 19 patients available for examination, almost 95 per cent had a negative spinal fluid Wassermann reaction.
I t may be observed, with reference to Table 2 that, from the standpoint of sex there appears to be nothing essential from a sta- tistical point of view, both sexes exhibiting increased frequency of negative spinal fluid Wassermann reactions with the passage of years. At the end of 10 years when 17 male and 11 female patients

J O S E P H R. BLALOCK~ M. D. 3 AND LEI~I~D E. HI1VSIE~ M . D . 87
were available for examination, negative spinal fluid Wassermann reactions were approximately equal in both sexes.
Before treatment 89.4 per cent of all the patients showed a strongly positive spinal fluid Wassermann reaction, whereas at the end of five sears only 14.3 per cent of 98 patients had a strong re- action. Of 28 patients examined at the end of 10 years, 3.6 per cent were strongly positive.
3. Cell Count (Chart I and Table 3) I t may be seen that the different serological responses, while tak-
ing the same general course, vary as to the time when they become negative. As has been pointed out by numerous investigators, changes in the cell count constitute one of the earliest phenomena, a return to normal or nea~ normal occurring as a rule shortly after the cessation of treatment. This trend towards negativity of spinal fluid cell count is maintained for years. Although there is a difference of opinion as to what constitutes the normal number of cells in the spinal fluid, we believethat any number above eight cells per cubic milimeter may be above normal.
With regard to cell count, from the standpoint of sex, it was our experience that the cell count in women responded more promptly than that in men.
4. Globuli~ Content (Chart I and Table 4). Likewise, in conformity with the observations of others, the
globulin content of the spinal fluid becomes modified during the early months and years following treatment. However, it lags ap- preciably behind the improvement noticed in the cell count and, taking a large series of patients together, it does not become nega- tive as frequently as the cell count does. According to our findings there is a general increase in globulin content beginning approxi- mately ten years after treatment has been ended. Whether this tendency to increased globulin content has any special bearing we are unprepared to say.
Attention is called to the fact that during the later years of our observations the number of patients that we were able to reexamine was decidedly less than the number with which we originally be- gan. Therefore, all serological data that we had at our disposal

88 SEROLOGY IN GENERAL PARESIS
during the last quarter of the twelve-year survey are not as con- vincing as those of the first three quarters, because the total num- ber of patients available for study was~ appreciably less. As a rule, long-continued observations are possible among the patients who remain unimproved and among those who have relapses. They remain with us because they have symptoms, for which they desire treatment. On the contrary, a certain number of patients who have no symptoms fail to return for further examination.
Regarding globulin content, there was a steady rise in the num- ber of patients who showed a negative globulin response, the rise progressing steadily during the first five years; there was a rela- tively sharp rise from the sixth to the tenth year after treatment and a decline during the last two years of our observations, that is, during the eleventh and twelfth years.
When the negative globulin responses are studied from the standpoint of sex, it appears that while negative results in globulin content appear later in women than in men, as the years go by, more women than men show a negative response. For example, at the end of 10 years, 64.3 per cent of male patients and 90.0 per cent of female patients exhibited negative globulin reaction. The number from which to make such a computation is obviously small, comprising 14 male and 10 female patients. At the end of the five- year period, however, with 97 patients (63 males and 34 females) under observation, the percentage of negative globulin reactions was approximately the same (for the males 54 per cent; for the fe- males 58 per cent) for both sexes.
When the globulin responses, recorded as one plus, are combined with those recorded as negative, the total runs relatively high.
5. Gold Sol (Chart I and Table 5) O f the total number of patients, namely 315, three per cent
showed negative gold sol curves before any treatment was given. At the end of one year, 14.0 per cent of the patients had a negative gold sol curve. At the end of the fifth year the percentage of nega- tives was 53.2; at the end of the tenth year, with 28 patients avail- able for examination, the negative responses amounted to 73.1 per cent. The highest percentage of negatives occurred at the end of

JOSEPH R. BLALOCK 3 M. D.~ AND LELAND E, HII~SIE 3 M, I). 89
the twelfth year, when in 18 patients, the percentage of negative responses was 83.3.
No fundamental differences were observed in the gold sol curves on the basis of sex. Certain inequalities of negative responses be- tween men and women may be seen, but it is not felt that they rep- resent anything essential.
B. I~ELATIONSHI,P OF SEROLOGY TO CLINICAL CONDITION
1. Serology, Combined Statistics for All Patients. This section comprises comments on Charts II and I I I and
Tables 6-10 inclusive. The clinical condition of the patient is com- pared separately with each of the serological tests referred to in this communication. For example, the clinical condition is pie- tured with reference to the blood Wassermann reaction, the spinal fluid Wassermann reaction, the cell count, etc. Observations on the clinical and laboratory status of each patient were made simultan- eously.
The Tables 6 to 10 inclusive have no reference tol individuM methods of therapy, but give a general survey of clinical and lab- oratory results under the three modern forms of treatment of pa- tients with general paresis. In the next chapter there will be a com- parison of clinical and laboratory results from the standpoint of the three individual methods.
We believe it to be unnecessary here to define the terms "remis- sion," " improved" and "unimproved," because we use the terms in the same sense that they were described in our monograph, "Eleetropyrexia in General Paralysis."
As a rule, tests were performed on those who died, shortly be- fore their death. In a smM1 percentage of patients examinations were made not more than three months prior to death.
Cli~ical condition and blood Wassermann reaction. (Chart II and Table 6.) Among the patients who gained a remission, there was a steady increase in the percentage of negative blood Wasser- mann reactions. It is to be noted that in the remission group, 12.2 per cent of the patients had a negative reaction before treatment was started. This number (12.2 per cent) may have some bearing

90 SEROLOGY IN GENERAL PARESIS
when compared with the percentage, 6.4, of negatives before treat- ment in the improved group ; with the percentage, 3.2, of negatives before treatment in the unimproved group; and with 11.9 negatives before treatment in those patients who later died.
i
"'[ '~176 7 A ~ BLOOD W~SERMANN eo SPINAL FL UID o
WASSERMANN o /
'7 '~
,~ , . ' r . o . , , , ae, ORE I ," tl 4 , �9 T *EFORE , a a �9 ~; ~ ~" . ~ TREATMENT TREATMENT
GLOBULIN . . . . GOLD 50L o / ' ~ o
/ ~ o 60 I
#~ f _~./. ..-. , . 40
0 ~ i ~ t ' I | - , , I I I 0 .EFORE / 2 J 4 5 6 7 BEFORE / 2 3 4 $ f~ T
TREATMENT TREATMENT
YEARS FOAL OWING TREATMENT
o REMISSION UNIMPROVED
IMPROVED ~ DEAD
Chart I I - -Cl inical Condition and Serological Results
Among those patients who gained a remission, the percentage of negative reactions at the end of the first year was 21.2. The com- parative figure in the improved group was 12.8; in the unimproved group 14.4; and in the dead group 12.8. I t seems therefore that in those patients who gain a remission there is a more rapid reduction of the blood Wassermann reaction than there is in the remaining three groups. This trend of reduction is seen not only after the first year but continues for the next few years. At about the fifth year the percentage of negative reactions is approximately equal in the three riving groups.

J O S E P H R. BLKLOCK 3 M , D. 3 AND LELAND E. H I N S I E 3 1VI, D. 91
Because the patients who remain unimproved usually have con- tinuous hospital residence, it is possible to have continuous records over a period of many years. It was obvious from our own experi- ences that many patients who left the hospital were eventually Iost to us. By reference to the chart and table, one notices a progres- sive increase in negative responses as the years go by, the highest percentage of negatives in this unimproved group being 78.6 per cent at the end of 10 years. It is true that we followed the course of a small number of patients in the remission and improved group for the full 12-year period, but we did not figure out any percent- ages when there were less than ten patients available. In each in- stance we recorded the number of patients available for study at yearly intervals, but we felt that a statement of percentage in such small groups might not be convincing. We had to select some ar- bitrary minimum number from which to compute percentages. That number was 10.
II I i I
SPINAL FLUID CELL COUNT
IOC
90
8 0
TO
60
30
40
JO
20
I 0
o / O . . . . o ~ , ~ o . . . ___ . o . ~ . _ ~ - j ~ s ~ o
o ~ o REMISS~OH
'_ . . . . /t4PROuNIMP~oEvDED y . A . . . . . e D E A D
e e J o - ~ R E I I I f I f f I ~ J 4 5 6 T
TREA T/fEN r
YEA RS FOL L OWING T R E A T M E N T
Chart III--Clinical Condition and Spinal l~luid Cell Count

92 SEROLOGY IN GENERAL PARESIS
Clinical condition and spinal fluid Wassermann reaction. (Chart I I and Table 7.) The frequency of negative Wassermann reac- tions in the spinal fluid, prior to treatment, is appreciably less than the percentage of negative blood Wassermann reactions prior to treatment.
In each of the three groups (remission, improved, unimproved), there is a progressive increase in the frequency of negative spinal fluid Wassermann reactions with the passage of time. In the group of patients who gained a remission, the increase was from 1.3 per cent before treatment was started to 12.8 per cent at the end of the first year and to 84.2 per cent at the end of the sixth year. I t is perhaps noteworthy to call attention to the fact that at the end of the sixth year the blood Wassermann reaction was negative in 57.8 per cent of the patients.
The percentage of negative reactions in those patients who im- proved was 5.4 per cent at the end of the first year; it was 17.1 per cent in the unimproved group and 2.6 per cent in the group that died. I t seems therefore that comparative figures in the first year apparently carry no special significance. Comparative percentages of negative reactions at the end of the fourth year apparently show sufficient divergence to compel our attention. At the end of the fourth year the percentage of negative reactions in the remission group was 54.6, while in the improved group it was 27.8. I t would appear, therefore, that among our own patients negative reactions at the end of a four-year period were twice as frequent in the re- mission than in the improved group. I t is to be emphasized, how- ever, that in the unimproved group, at the end of four years, the percentage of patients showing a negative response was 42.6. When the figures for the negative and the reduced spinal fluid Wasser- mann reactions are combined, the percentages at the end of the sixth year are very close to one another (See Chart II) .
Attention is invited to the 100.0 per cent negative reactions in the unimproved group, comprising 10 patients, at the end of nine years.
The incidence of negative spinal fluid Wassermann reactions was consistently very low in the group that died. I t would therefore appear from our figures that the prognosis is one o f relatively

JOSEPH R. BLALOCK, 1~. D., AND LELAI~D E. HIlgSIE~ lYs D. 93
early fatali ty when the reactions are not favorably influenced. The spinal fluid Wassermann reaction appears to be a better prognostic guide than the blood Wassermann reaction.
Clinical condition and spinal fluid cell cou~t. (Chart I I I and Table 8.) Among the patients who gained a remission the cell count of the spinal fluid progressed steadily and decisively to com- plete normality at the end of two years. In the remaining three groups the percentage of patients with normal cell counts at the end of two years was appreciably lower. With respect to cell count there is a very obvious diffrence in the four clinical groups. This is noteworthy, for example, at the end of four years. The percent- age of patients with normal cell counts was 100.0 in the remission group, 91.2 in the improved group, 84.9 in the unimproved group, and 64.3 in the group that died.
Patients who remain unimproved exhibited a progressive decline in the cell count of the spinal fluid. Eventually all of the patients examined by us in this group had normal cell counts.
It appears that here too there may be a helpful prognostic guide. Many of the patients who maintained an abnormal cell count dur- ing the early years following therapy had a fatal outcome.
Clinical conditio~ and spinal fluid globulin reaction. (Chart I I and Table 9.) I t was observed that during the early years follow- ing treatment, the percentage of patients showing a negative globu- lin reaction in the spinal fluid was consistently higher in the group of patients showing a remission than in the remaining three clini- cal groups. At the end of one year the percentages in the four groups were 39.2, 29.2, 21.9 and 9.7. The percentages occupied the same relative positions at the end of the fourth year. Beyond the fourth year, among those patients living, the percentage of patients showing a negative globulin reaction more nearly approximated one another.
In each of the four clinical groups it was obvious that the globu- lin reaction failed to become negative as frequently as the cell count did. The highest percentage of negative globulin reactions, among the group of patients examined by us, occurred in the unim- proved group, in which it reached 81.0 per cent at the end of the

94 SEROLOGY IN GENERAL PARESIS
seventh year. The percentage of patients with a negative globulin reaction was relatively low in the group that died.
Clinical condition and gold sol reaction. (Chart I I and Table 10.) Among the 3.15 patients examined by us a relatively low per- centage had a negative gold sol reaction prior to the introduction of treatment. In the group that gained a remission the percentage of negatives was 2.6; in the improved group it was 1.2; in the unim- proved, 2.2 ; and in those who died the percentage was 1.5.
At the end of the first year of treatment, the percentage of nega- tive reactions, for each of the four clinical groups was 18.4 (remis- sion), 15.5 (improved), 14.3 (unimproved) and zero (dead). Anal- agous figures at the end of three years were 31.3, 42.6, 19.7, and 28.6.
In each of the clinical groups there was a decided increase in the frequency of negative gold sol reactions with the passage of time. Among those patients who achieved a remission there was a rise in negative responses from 2.6 per cent to 89.4 per cent (at the end of the sixth year). The incidence of negativity in the unimproved group was not as high, though it progressed from 1.2 per cent to 45.4 per cent (at the end of the sixth year). These figures indicate that the percentage of gold sol reactions was approximately twice as high in the remission group as they were in the improved group (at the end of the sixth year). In Chart VI we have combined the percentages of low and negative gold sol curves. With this com- bination of percentages the figures for the three living groups more nearly approximate one another.
I t is perhaps interesting to note that among the 12 unimproved patients the percentage of negative gold sold reactions is high, namely 75.0, at the end of 10 years.
2. Serology in Individual Forms of Treatment. Under this heading we have arranged Tables 11, 12 and 13 to in-
dicate the serological changes at stated intervals under individual methods of treatment. The first method to which we refer is ma- laria, and in this group we include only those who had received no treatment other than malaria. Because the malarial treated pa- tients were the first to be treated by us, a much longer interval has

J O S E P H R. B L A L O C K 3 1~I. D.~ AND L E L A N D E. H I N S I E 2 NI. D. 95
elapsed since treatment. The study comprised 117 patients who had received the malarial form of treatment.
The second method, the statistical results of which appear in Table 12, are those referable to patients who had had tryparsamide and mercury. They were not given any other form of treatment. For this study an original list of 68 patients was available.
The third method (Table 13) refers to patients who received fever therapy induced by an electrical apparatus. Many of these patients received tryparsamide and bismuth in addition to fever therapy. For present purposes we have considered all of these pa- tients together. The results of fever treatment with and without chemotherapy are given elsewhere in this report.
Malaria (Table 11). For this study 117 patients were available. In the table they are divided into two large groups, those who showed clinical improvement and those who did not. Of the 68 patients who showed clinical improvement there was a much higher rate of improvement, from the standpoint of serological results, than there was among the 49 patients who showed no improvement under malarial treatment. At the end of two years following ther- apy, of 19 patients studied, the blood Wassermann reaction was negative in 10.5 per cent of the patients who showed clinical im- provement, whereas there were no negative blood Wassermann reactions in those patients who did not show clinical improvement. Again, of the 15 patients who were regarded as clinically improved, and whose serology was known 12 years after the completion of malarial therapy, the blood Wassermann reaction was negative in 80.0 per cent of the patients, whereas among the 10 patients who did not show any clinical improvement the blood Wassermann re- action was negative in 40.0 per cent of the patients. Although there are some exceptions, the same general trend of improvement was observed with regard to the spinal fluid Wassermann reaction. In reference to cell count, globulin, and gold sol curve, the same gen- eral trend again held true, although the differences are not so marked.
Tryparsamide (Table 12). Of the 55 patients, receiving trypar- samide and examined at the end of one year following treatment,

96 SEROLOGY IN GENERAL PARESIS
28 of the patients were clinically improved, while 27 were unim- proved. Considering these two groups it may be seen that, at the end of the year, the blood Wassermann reaction was negative in 32.2 per cent of the patients who improved and 29.6 per cent in those patients who failed to improve. At the end of a five-year period 11 patients were examined who were clinically improved and there were 15 patients who were unimproved. The percentages of negative blood Wassermann reaction in these two groups were 90.0 and 20.0 respectively. This means that there was a notably decided difference in the blood Wassermann reaction, at the end of a five-year period, in favor of the patients who improved. Essen- tially the same trend of differences was observed in the two groups from the standpoint of the spinal fluid Wassermann reaction and the gold sol curve.
I t appears from a comparison of the data in Tables 11 and 12, that at a given period negative serological results are more fre- quently observed in patients treated by tryparsamide than in those treated by malaria. I t has been our impression that patients treated with tryparsamide ordinarily do not show a progressive serological improvement as the years go by. The improvement is progressive during the first year or two of treatment; then there is a partial relapse from the standpoint of serology, which may last as long as three years, but which is again followed by progressive improvement.
Electropyrexia. This group includes patients who were given fever therapy by an ultrahigh frequency apparatus. Some of the patients were treated by fever alone, while others had tryparsa- mide in addition.
Of 73 patients, observed at the end of one year, the blood Was- sermann reaction, among the clinically improved patients, was neg- ative in 17.8 per cent of the patients, while it was negative in 14.0 per cent of the 43 patients who had not shown any clinical improve- ment. At the end of four years, the percentages were 59.1 of the improved group and 18.2 of the unimproved. Likewise, of the two clinical groups, from the standpoint of the spinal fluid Wassermann reaction and the gold sol curve, the percentages of negative re- sponses were distinctly superior in the clinically improved group of patients. (Table 13.)

JOSEPH R. BLALOCKt 1~I. D.~ AND LELAND E. ttINSIE~ M:. D. ~ 97
Serological results, observed under electropyrexial treatment, are superior to those seen in patients treated by malaria and by tryparsamide. We have comparable figures in each of the three treatment groups at the end of four years of observation. The percentages, referable to patients who gained clinical improvement are as follows : Type of Number of Negative blood Negative spinal fluid Negative
treatment patients Wassermann Wassermann gold sol
Malaria 14 28.6 57.2 57.2
Tryparsamide 11 36.4 41.7 45.5
Electropyrexia 2z 59.1 63.6 77.3
C. COIVIPARATIVE SEROLOGY IN DIFFERENT FORMS OF TREATMENT
Charts IV and V and Tables 14 to 18 inclusive are made up of statistics showing serological results by years in the several forms of therapy.
Blood Wassermann Reaction. By reference to Chart IV and Table 14, it may be seen that the blood Wassermann reaction tended towards negativity under each of the forms of therapy to which attention is called in this communication. During the early months of tryparsamide therapy the blood Wassermann reaction became negative in a far greater proportion of patients than it did in those patients treated by other measures. For example, at the end of three months, 40 per cent of the patients treated by trypar- samide had a negative blood Wassermann reaction whereas the percentage was 16.1 with malaria, 9.4 with electropyrexia and chemotherapy and 6.4 with electropyrexia only. At the end of six months tryparsamide held the same superior position. For the next few years however there was a steady decline in the percent- age of negative blood Wassermann reactions under tryparsamide therapy. There then followed a more or less progressive rise.
At the end of three years the percentage of negative blood Was- sermann reactions in the group treated by electropyrexia and try- parsamide was 40.0, a figure that stood in strong contrast with 29.5 under malarial therapy, with 18.7 under electropyrexia alone, and with 16.2 under tryparsamide alone.
98 SEROLOGY IN GENERAL PARESIS
At the end of seven years the percentage of negative blood Was- sermann reactions under malarial therapy was 68.4, while it was 58.3 in those patients who received tryparsamide only.
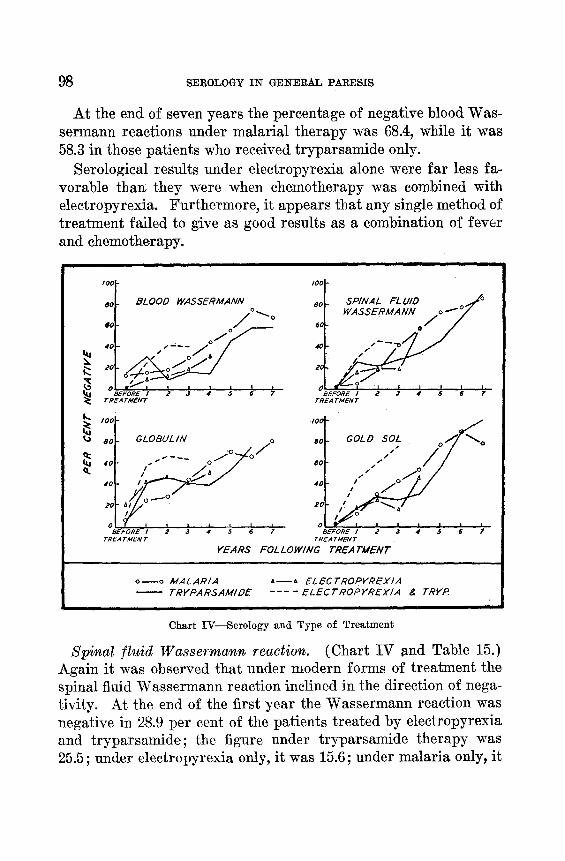
Serological results under electropyrexia alone were far less fa- vorable thar~ they were when chemotherapy was combined with electropyrexia. Furthermore, it appears that any single method of treatment failed to give as good results as a combination of fever and chemotherapy.
mif BLOOD WASSERMANN o ~ 0 /
, ,
BEFORE I 2 J 4 5 6 �9 TREATMENT
GLOBULIN as o
, o . . . . . o/Rio / 4 0
[ , I I 1 1 , _ i , OBEFORE I 2 3 4 5 6 7
TREA TMEN T
I 04
a6 SPINAL FLUID .~o 6( WASSERMANN �9 / o
21
i i BEFORE I 4? $ 4 5 6 �9
TREATMENT
' ~
GOLD S
�9 o , / o / / / / / 401
~0
0 1 I I
BEFORE I 2 3 4 5 6 TREAITMENT
YEARS FOLLOWING TREATMENT
o--o MALARIA A--A ELECTROpYREYlA - - TRYPARSAMIDE . . . . ELECTROPYI~EXIA & TRYP.
II l 1
Chart IV--Serology and Type of Treatment
Spinal florid Wassermann reaction. (Chart IV and Table 15.) Again it was observed that under modern forms of treatment the spinal fluid Wassermann reaction inclined in the direction of nega- tivity. At the end of the first year the Wassermann reaction was negative in 28.9 per cent of the patients treated by electropyrexia and tryparsamide; the figure under tryparsamide therapy was 25.5 ; under electropyrexia only, it was 15.6; under malaria only, it

JOSEPH R, BLALOCK~ M. D., AND LELAND E. HINSIE~ IVs D. 99
was 5.2. At the end of three years the percentages were 42.1, 27.8, 18.7, and 40.5 respectively.
I t is interesting to note that after a period of seven years the percentage of negative spinal fluid Wassermann reaction was es- sentially the same, namely 85.7 and 90.0, under malarial treatment alone and tryparsamide treatment alone.
In most forms of therapy the spinal fluid Wassermann reaction was more favorably influenced than the blood Wassermann re- action.
I I I I I I I
SPINAL FLUID CELL COUNT"
I00
9 0
$0
70
60
5 0
40
JO
20
10
0 I BEFORE
TR EA TMEN T
. . . . AND TRFPARSAM/L~E
' I I I , I I I , I 2 3 4" $ 6 u
YEA RS FOL L OWING TREATMENT
i
Chart V--Spinal Fluid Cell Count and Type o~ Therapy
Cell Count. (Chart V and Table 16.) Under each form of ther- apy reported herein, except that by electropyrexia alone, there was a rapid reduction of the cellular elements of the spinal fluid and the reduction was sustained throughout the period of observation. With electropyrexia alone there was a comparatively far smaller percentage of patients with normal ceil counts in the spinal fluid.
Globulin Reaction. (Chart IV and Table 17). Under each

100 SEROLOGY IN GENERAL PARESIS
method of therapy, the globulin reaction of the spinal fluid tended toward negativity. At the end of one year, the percentage of nega- tive globulin reactions was highest (56.5) among those patients treated by electropyrexia and tryparsamide; it was second high- est (42.0) in those treated by electropyrexia only; third highest in patients treated by tryparsamide only; and fourth (24.4) in those treated by malaria only. At the end of three years electro- pyrexia and tryparsamide combined still had the superior percent- age (63.1), while the remaining three forms of treatment had ap- proximately the same percentage of negative globulin reaction, namely about 41.0 per cent.
Gold Sol Curve. (Chart IV and Table 18.) It is evident that among our patients, the gold sol curve was favorably influenced in all the forms of treatment employed. Again the best results were observed when electropyrexia and tryparsamide combined were used. At the end of one year the percentage of negative gold sol reactions was highest (42.5) in patients treated with electropyrexia and tryparsamide; it was next highest (16.5) in those treated by electropyrexia only; it was third highest (15.7) among those treated by tryparsamide only; and fourth (11.2) among those treated by malaria only. The comparable figures at the end of three years were 75.0, 15.4, 24.3, and 42.1, respectively.
S UlV~I~ARY
It is a finding, common to almost all investigators, that there is a decisive improvement in the serological reactions of the great majority of patients, apart from the particular method of therapy employed. The earliest serological changes occur in the cell count of the spinal fluid. Many feel that the reduction of the cell count is a reflection of a reduction of the intensity of the pathological neurological process. The globulin content of the spinal fluid also undergoes diminution, which, however, is slowly accomplished and ordinarily is not as frequently negative as the cell count is. Blood and spinal fluid Wassermann reactions likewise tend to become negative; the majority of reactions, however, do not gain a nega- tive state under four or five years following treatment. In general, the Wassermann reaction of the spinal fluid becomes negative be-

JOSEPH R. BLALOCK~ M. D.j AND LELAND E. HIlgSIE, M.D. 101
fore that of the blood. The gold sol curve is usually the last sero- logical reaction to be favorably influenced and very often there is a reduction in the height of the curve rather than a return to nega- ative.
Common also to many investigators, is the finding that serologi- cal improvement is in general independent of the clinical condition of the patient, In the early years after therapy, studies on serol- ogy do not lend themselves very accurately to prognostic considera- tions. However, a persistently positive serological ensemble is usually associated with an unfavorable clinical condition.
I t appears that the clinical and serological outcomes are approxi- mately the same in patients treated by febrifacient agents or by chemotherapy. The arsenical preparation of choice is undoubtedly that belonging to the pentavalent series. I t seems, also, that the preferable therapeutic method includes pyretotherapy and chemo- therapy.
From the study of our own patients, we are in general agreement with the prevailing opinions of others. Our own observations cover a range of 12 years and lead to the following summary:
1. Ten years after treatment, 75.0 per cent of 28 patients had a negative blood Wassermann reaction; 89.3 per cent of 28 patients had a negative spinal fluid Wassermann reaction; 100.0 per cent of 26 patients had a normal cell count in the spinal fluid; 75.0 per cent of 24 patients had a negative globulin reaction; and 73.1 per cent of 26 patients had negative gold sol curves.
2. Those patients who gained a clinical remission showed a higher percentage of negative serological reactions than the pa- tients in other clinical categories. We do not believe that serologi- cal information may be unqualifiedly used in the prognosis of in- dividual patients; it is valuable principally for comparing results in groups of patients. In our own experience, perhaps the safest time, if there is any, to estimate the future course of the patient 's condition, from the standpoint of serology, is three or four years after treatment has been started.
3. With our group of 326 patients, the most favorable clinical and serological results were observed in those patients who re- ceived fever therapy, followed by chemotherapy.
~. - -1938- -G

102 SEROLOGY IN GENERAL PARESIS
TABLE I. BLOOD WASSERMANN REACTION
Time Percentage of patients relation Males Females All patients
to Strongly Weakly Nega- Strongly Weakly Nega- Strongly Weakly Nega- therapy positive positive tire positive positive tire positive positive tire
Before 75.8
Af te r 63.9
year 58.3
�89 year 57.4
1 year 54.1
2 years 48.4
3 years 40.6
4 years 38.1
5 years 30.7
6 years 18.2
7 years 14.8
8 years 7.6
9 years 14.3
10 years 5.9
11 years 10.5
12 years 8.3
14.8 9.4 85.3 9.1 5.0 78.9 13.0 8.1
13.5 17.0 73.7 11.1 15.2 70.8 12.7 16.5
25.0 16.7 73.1 6.5 20.4 63.0 19.2 17.8
24.7 17.9 68.1 16.5 15.4 60.8 22.1 17.1
29.5 16.4 61.8 23.6 14.6 56.6 27.6 15.8
3L4 20.2 66.2 23.5 10.3 53.8 29.0 17.2
30.5 28.9 60.0 24.0 16.0 46.1 28.7 25.3
25.8 36.1 44.2 30.2 25.6 40.0 27.1 32.9
29.0 40.3 23.5 29.4 47.1 28.1 29.2 42.7
31.8 50,0 4.8 23.8 71.4 13.9 29.2 56.9
44.4 40,8 7.1 28.6 64.3 12.2 39.0 48.8
46.2 46.2 . . . . . . . . . . . . 9.5 42.9 47.6
28.6 57.1 . . . . . . . . . . . . 15.0 25.0 60.0
17.6 76.5 0.0 27.3 72.7 3.6 21.4 75.0
31.6 57.9 . . . . . . . . . . . . 8.0 24.0 68.0
41.7 50.0 . . . . . . . . . . . . 5.3 31.6 63.1
Number of Pat ients
Before
Af te r
�90 year
year
1 year
2 years
3 years
4 years
5 years
6 years
7 years
8 years
9 years
10 years
11 years
12 years
223 99 322
223 99 322
204 93 297
190 91 281
183 89 272
153 68 221
128 5 0 178
97 43 140
62 34 96
44 21 65
27 14 41
13 8 21
14 6 20
17 II 28
19 6 25
12 7 19

JOSEPH R. BI~LOCK~ M. D., AND LELA~TD E. HI~SIE~ 1~. D.
TABLE 2. SPI~TAL FLUID WASSF~RMAN~ REACTION
103
Time Percentage o2 patients relation Males Females All patientS
to Strongly Weakly Neg~- Strongly Weakly Nega- Strongly Weakly therapy positive positive tire positive positive five positive positive
Nega- tive
Before 89.1 9.9 1.0 90.0 10.0 0.0 89.4 10.0 0.6
Af t e r 73.3 23.5 3.2 72.0 22.0 6.0 72.9 23.1 4.0
year 59.5 36.1 4.4 60.0 27.4 12.6 59.7 33.3 7.0
�89 year 51.1 41,1 7.8 53.3 36.7 10.0 51.8 39.6 8.6
1 year 42.9 45.7 11.4 49.4 41.6 9.0 45.1 44.3 10.6
2 years 32.4 44.4 23.2 41.8 43.3 14.9 35.3 34.0 20.7
3 years 28.4 41.7 29.9 43.7 42.9 22.4 30.1 42.1 27.8
4 years 20.8 38.6 40.6 23.8 42.9 33.3 21.7 39.9 38.4
5 years 14.5 38.7 46.8 13.9 33.3 52.8 14.3 36.7 49.0
6 years 6.8 25.0 68.2 0.0 27.3 72.7 4.5 25.8 69.7
7 years �9 4.0 12.0 84.0 7.7 7.7 84.6 5.3 10.5 84.2
8 years 15.4 7.7 76.9 . . . . . . . . . . . . 15.8 10.5 73.7
9 years 0.0 14.3 85.7 . . . . . . . . . . . . 5.0 10.0 85.0
10 years 0.0 11.8 88.2 9.1 0.0 90.9 3.6 7.1 89.3
11 years 5,3 10.5 84.2 . . . . . . . . . . . . 4.0 8.0 88.0
12 years 8.3 0 . 0 91.7 . . . . . . . . . . . . 5.3 0.O 94.7
Number of Pat ients
Before
A~.ter
year
�89 year
1 year
2 years
3 years
4 years
5 years
6 years
7 years
8 years
9 years
10 years
11 years
12 years
221 100 321
221 100 321
205 95 3O0
190 90 280
184 89 273
151 6~ 218
127 49 176
9 6 42 138
62 36 98
44 22 66
25 13 38
13 6 19
14 6 2O
17 11 28
19 6 25
1 2 7 19

104 SEROLOGY I N G EN ERA L PARESIS
TABLE 3, SPINAL FLUID CELL COUNT
Tiros Percentage of patients relation Males Females All patients
to Increased Normal Increased Normal Increased Normal therapy cell count cell count cell count cell count cell count cell count
Befo re . . . . . . . . . . . . . . . . . . . . . . 74.4 25.6 73.0 27.0 74.0 26.0
A f t e r . . . . . . . . . . . . . . . . . . . . . . . 28.7 71.3 19.0 81.0 25.7 74.3
y e a r . . . . . . . . . . . . . . . . . . . . . 18.0 82.0 9.7 90.3 15.4 84.6
�89 y e a r . . . . . . . . . . . . . . . . . . . . . 18.7 81.3 11.2 88.8 16.4 83.6
1 yea r . . . . . . . . . . . . . . . . . . . . . 21.0 79.0 8.4 91.6 17.1 82.9
2 yea r s . . . . . . . . . . . . . . . . . . . . . 17.8 82:2 10.6 89.4 15.6 84.4
3 yea r s . . . . . . . . . . . . . . . . . . . . . 15.6 84.4 10.9 89.1 14.4 85.6
4 yea r s . . . . . . . . . . . . . . . . . . . . . 12.8 87.2 9.8 90.2 11.9 88.1
5 yea r s . . . . . . . . . . . . . . . . . . . . . 6.3 93.7 14.3 85.7 9.2 90.8
6 yea r s . . . . . . . . . . . . . . . . . . . . . 4.8 95.2 0.0 100.0 3.1 96.9
7 yea r s . . . . . . . . . . . . . . . . . . . . . 12.0 �9 88.0 0.0 100.0 8.1 91.9
8 yea r s . . . . . . . . . . . . . . . . . . . . . 7.1 92.9 . . . . . . . . 5.3 94.7
9 yea r s . . . . . . . . . . . . . . . . . . . . . 7.1 92.9 . . . . . . . . 5.3 94.7
10 yea r s . . . . . . . . . . . . . . . . . . . . . 0.0 100.0 0.0 100.0 0.0 100.0
11 yea r s . . . . . . . . . . . . . . . . . . . . . 0.0 100.0 . . . . . . . . 0.0 100.0
12 yea r s . . . . . . . . . . . . . . . . . . . . . 8.3 91.7 . . . . . . . . 5.3 94.7
N u m b e r of P a t i e n t s
Be fo re . . . . . . . . . . . . . . . . . . . . . . . 223
A f t e r . . . . . . . . . . . . . . . . . . . . . . . . 223
�90 y e a r . . . . . . . . . . . . . . . . . . . . . . 205
y e a r . . . . . . . . . . . . . . . . . . . . . . 192
1 y e a r . . . . . . . . . . . . . . . ; . . . . . 186
2 yea r s . . . . . . . . . . . . . . . . . . . . . 152
3 yea r s . . . . . . . . . . . . . . . . . . . . . 135
4 yea r s . . . . . . . . . . . . . . . . . . . . . 94
5 yea r s . . . . . . . . . . . . . . . . . . . . . 63
6 yea r s . . . . . . . . . . . . . . . . . . . . . 42
7 yea r s . . . . . . . . . . . . . . . . . . . . . 25
8 yea r s . . . . . . . . . . . . . . . . . . . . . 14
9 yea r s . . . . . . . . . . . . . . . . . . . . . 14
10 yea r s . . . . . . . . . . . . . . . . . . . . . 16
11 yea r s . . . . . . . . . . . . . . . . . . . . . 17
12 yea r s . . . . . . . . . . . . . . . . . . . . . 12
100 323
100 323
93 298
89 281
83 269
66 218
46 181
41 135
35 98
22 64
12 37
5 19
19
10 26
6 23
7 19

JOSEPH R. BLALOCK 3 1~. D., AND LELAND E. HIlqSIE 3 1~. D.
TABLE 4. SPI~AL FLUID GLOBULI17 REACT~01~
105
Time relation
to therapy
Percentage of patients Males Females All patients
Over Nega- Over Nega- Over 1 plus 1 plus tive 1 plus 1 plus tire 1 plus 1 plus
Nega- tive
Before 68.1 28.8 3.1 68.7 24,2 7.1 68.3 27.4 4.3
_after 46,5 42.0 11.5 43.5 35.3 21.2 45.6 40.0 14.4
year 31.4 53.9 14.7 39.8 31,2 29.0 34.0 46.8 19,2
�89 year 29.8 48.4 21.8 31.8 44.4 23.9 30.4 47.1 22.5
1 year 27.8 49.2 23.0 26.4 37.9 35.7 27.4 45.6 27.0
2 years 27.0 36.5 36.5 28.1 42.2 29.7 27.3 38.2 34.5
3 years 20.8 37.6 41.6 29.6 31.8 38.6 23.1 36.1 40.8
4 years 11.6 47.4 41.0 26.2 26.2 47.6 16.1 40.9 43.0
5 years 17.4 28.6 54,0 23.5 17.7 58.8 19.5 24.8 55.7
6 years 5.0 2,5.0 70.0 5.0 25.0 70.0 5.0 25.0 70.0
7 years 0.0 25.9 74.1 0.0 23.1 76.9 6.0 25.0 75.0
8 years 0.0 30.0 70.0 0.0 16.7 83.3 0.0 25.0 75.0
9 years 15,4 ~3.1 61.5 0.0 14.3 85.7 10.0 20.0 70.0
10 years 21.4 14.3 64.3 0.0 10.0 90.0 12.5 12.5 75.0
11 years 16.6 27.8 55,6 0.0 14.3 85.7 12.5 20.8 66,7
12 years 7.7 38.5 53.8 0.0 . . . . . . . . 5.0 30.0 65..0
l~umber of Patients
Before 226 99 325
Af te r 226 99 325
year 204 93 297
year 188 88 276
1 year 187 87 274
2 years 156 64 220
3 years 125 44 169
4 years 95 42 137
5 years 63 34 97
6 years 40 20 60
7 years 27 13 40
8 years 10 6 16
9 years 13 7 20
10 years 14 10 24
11 years 18 6 24
12 years 13 7 20

106 SEROLOGY IN GEI~ERAL PARESIS
TABLE 5. GOLV SOL CURVES
Time relation
to therapy
High and medium
Percentage of patients Males Females
High and High and Low Negative medium Low Negative medium
All patients
Low Negative
Before 89.2 9.0 1.8 93.5 4.3 2.2 90.5 6.5 3.0
After 81,5 14.4 4.1 89.2 6.5 4.3 83.8 12.1 4.1
year 74.0 19.1 6.9 86.9 9.5 3.6 77.8 16.3 5.9
year 69.3 23.3 7.4 79.5 14.5 6.0 72.4 20.6 7.0
1 year 62.1 23.1 14.8 67.5 20.5 12.0 63.7 22.2 14.0
2 years 48.3 24.2 27.5 66.1 17.8 16.1 53.6 22.3 24.1
3 years 43.9 21.0 35.1 57.1 26.2 16.7 47.3 22.4 30.3
4 years 42.2 22.2 35.6 55.2 15.8 29.0 46.1 20.3 33.6
5 years 27.1 15.3 57.6 36.4 18.2 45.4 30.5 16,3 53.2
6 years 12.2 14.6 73.2 11.8 17.6 70.6 12.1 15.5 72.4
7 years 19.2 15.4 65.4 18.2 9.1 72.7 18.9 13.5 67.6
8 years 15.4 7.7 76.9 20.0 O.O 80.0 16.7 5.6 77.7
9 years 30.8 0.0 69.2 . . . . . . . . . . . . 23.5 0.0 76.5
10 years 17.7 11.8 70.5 . . . . . . . . . . . . 11.5 15.4 73.1
11 years 10.6 15.8 73.6 . . . . . . . . . . . . 7.6 19.3 73.1
12 years 0.O 16.7 83.3 . . . . . . . . . . . . 0.0 16.7 83.3
Number of Pat ients
Before
Af te r
yea~
year
1 year
2 years
3 years
4 years
5 years
6 years
7 years
8 years
9 years
10 years
11 years
12 years
222
222
204
189
182
149
123
90
59
41
26
13
13
17
19
12
93
93
84
83
83
62
42
38
33
17
11
5
4
9
7
6
315
315
288
272
265
211
165
128
92
58
37
18
17
26
26
18

J O S E P H R. BLALOCK 3 M. D. 3 AND L E L A N D E. H I N S I E 3 1~I. D.
TABLE 6. CLINICAL CONDITION AND BLOOD WASSERI~ANN REACTION
107
Time relation
to theral~
Percentage of negative reactions Remission Improved Unimproved Dead
Reduced Negative Reduced Negative Reduced Negative Reduced Negative
Before . . . . . . . . . . . 12.2 . . . . 6.4 . . . . 3.2
A f t e r . . . . . . . . 18.3 20.7 12.8 10.3 11.6 13.7
y e a r . . . . . 24.4 26.9 20.3 1 ~ 8 17.2 10.4
y e a r . . . . . 27.8 24.1 22.5 12.7 20.2 14.3
1 y e a r . . . . . . 31.3 21.2 34.3 12.8 20.5 14.4
2 y e a r s . . , . . 28.3 21.7 46.8 16.1 21.3 16.0
3 yea r s . . . . . 26.0 30.0 34.7 36.7 25.8 15.1
4 y e a r s . . . . . 26.4 34.2 3 ~ 2 39.5 25.9 25.9
5 yea r s . . . . . 32.3 41.9 22.7 50.0 30.6 38.8
6 yea r s . . . . . 21.1 57.8 20.0 53.3 42.8 53.6
7 y e a r s . . . . . 25.0 50.0 . . . . . . . . 45.5 5 0 . 0
8 yea r s . . . . . . . . . . . . . . . . . . . . . 41.7 50.0
9 yea r s . . . . . . . . . . . . . . . . . . . . . 20.0 70.0
10 yea r s . . . . . . . . . . . . . . . . . . . . . 21.4 78.6
11 yea r s . . . . . . . . . . . . . . . . . . . . . 33.3 58.4
12 y e a r s . . . . . . . . . . . . . . . . . . . . . 27.3 63.6
. . . . 11,9
7.5 22.4
13.8 20.7
1 ~ 9 17.0
23.1 12.8
8.3 12.5
30.8 15.4
I0.0 30.0
. . . , o . , I
. . . . . . . .
. . . . , ~
. o . t . . ~
. . . . . . ,
. . , . . . .
. . . ~
N u m b e r of P a t i e n t s
Before .......
A f t e r . . . . . . . .
y e a r . . . . .
y e a r . . . . .
1 y e a r . . . . .
2 y e a r s . . . .
3 yea r s . . . .
4 yea r s . . . .
6 yea r s . . . .
6 y e a r s . . . .
7 yea r s . . . .
8 y e a r s . . . . .
9 y e a r s . . . . .
1 0 yea r s . . . . .
11 yea r s . . . . .
12 yea r s . . . . .
* ~ . * o . o ~
82 78 95 67
78 74 87 58
79 71 84 47
80 70 83 39
60 62 75 24
50 49 66 13
38 38 54 10
31 2~ 36 7
19 15 28 3
12 7 22 0
6 3 12 0
6 4 10 0
8 6 14 0
7 6 12 0
5 3 11 0

108 SEROLOGY IN GENERAL PARESIS
TABLE 7. CLINICAL CONDITI01~" AND SPINAL FLUID WASSERMANN REACTI01~
Time relation Percentage of negative reactions
to Remission Improved Unimproved Dead therapy Reduced Negative Reduced Negative Reduced Negative Reduced Negative
B e f o r e . . . . . . .
A f t e r . . . . . . .
�90 y e a r . . . . . .
�89 y e a r . . . . . .
! y e a r . . . . . .
2 y e a r s . . . . .
3 y e a r s . . .
4 y e a r s . . . .
5 y e a r s . . . .
6 y e a r s . . . .
7 y e a r s . . . .
8 y e a r s . . . .
9 y e a r s . . . .
10 y e a r s . . . .
11 y e a r s . . . .
12 y e a r s . . . .
. . . . 1 .3 . . . .
26 .2 7 .5 28 .8
35 .4 10 .1 44 .8
44 .9 12.8 50 .0
51 .3 12 .8 56 .8
52 .5 29 .5 54 .2
50 .0 34 .6 44 .7
37 .8 54 .6 52 .8
26 .7 70 .0 47 .6
5 .3 84 .2 35 .3
8 .3 83 .4 . . . .
. , ~ 1 7 6 � 9 1 4 9 . ~ 1 7 6
�9 , � 9 . t . . . . . ~
�9 ~ 1 4 9 o � 9 1 7 6 1 4 9 I , . ,
, ~ 1 4 9 . . � 9 1 7 6 , , . ~
�9 . , . ~ ~
0.0 . . . . 1 .1 . . . . 0 .0
0 .0 20 .8 6.3 15 .4 1.5
2 .6 26 .7 11 .1 25 .5 1 .8
2 .7 31 .7 13 .4 28 .3 2 .1
5 .4 34.1 17 .1 28 .2 2 .6
18 .7 4 4 . 6 16 .9 20 .0 8 . 0
34 .0 40 .0 23 .3 17.6 5 .9
27 .8 35 .2 42 .6 27 .3 0 .0
28 .6 40 .0 50 .0 . . . . . . . .
58 .8 30 .8 69 .2 . . . . . . . .
. . . 10 .0 85 .0 . . . . . . . .
. . . 10 .0 90 .0 . . . . . . . .
. . . 0 .0 1 0 0 . 0 . . . . . . . .
. . . . 7 .1 92 .9 . . . . . . . .
�9 . . 8 .3 8 3 . 4 . . . . . . . .
. . . 9 . 1 9 0 . 9 . . . . . . . .
N u m b e r o f P a t i e n t s
B e f o r e . . . . . . .
A f t e r . . . . . . . .
y e a r . . . . . .
�89 y e a r . . . . . .
1 y e a r . . . . . .
2 y e a r s . . . . .
3 y e a r s . . . . .
4 y e a r s . . . . .
5 y e a r s . . . .
6 y e a r s . . . .
7 y e a r s . . . .
8 y e a r s . . . .
9 y e a r s . . . .
1 0 y e a r s . . . .
11 y e a r s . . . .
12 y e a r s . . . .
80
80
79
7 8
78
61
52
3 7
30
19
1 2
4
5
7
7
4
8 0
80
76
74
7 4
59
4 7
3 6
2 1
1 7
6
4
5
7
6
4
9 6
96
9 0
82
8 2
83
6 0
5 4
4 0
2 6
2 0
1 0
1 0
1 4
1 2
11
6 5
6 5
55
4 6
3 9
2 5
1 7
11
7
4
0
1
0
0
0
0

J O S E P H R. BLALOCK: 1Vs D , A ~ D L E L A ~ D E. HII~SIE 3 !K. D.
T ~ r . v . 8. C L I N I O ~ C o ~ m ~ I O ~ ANY SPINAL FLUIV CF5~ C O U ~
109
Time relation Percentage of patients with normal cell count to therapy Remission Improved Unimproved Dead
B e f o r e . . . . . . . . . . . . . . . . . . . . . . . 30 .5 19 .2 22 .9 32 .8
A f t e r . . . . . . . . . . . . . . . . . . . . . . . . 90 .2 70 .5 70 .8 64 .2
y e a r . . . . . . . . . . . . . . . . . . . . . 97 .5 85 .3 83 .3 67.2
�89 y e a r . . . . . . . . . . . . . . . . . . . . . 98 .7 79 .7 84 .0 64 .6
1 y e a r . . . . . . . . . . . . . . . . . . . . . 92 .3 87 .3 80 .0 62 .5
2 y e a r s . . . . . . . . . . . . . . . . . . . . . 1 0 0 . 0 8 3 . 3 7 6 . 4 73 .1
3 y e a r s . . . . . . . . . . . . . . . . . . . . . 1 0 0 . 0 87 .7 77.1 70.6
4 y e a r s . . . . . . . . . . . . . . . . . . . . . 1 0 0 . 0 91 .2 84 .9 64 .3
5 y e a r s . . . . . . . . . . . . . . . . . . . . . 96 .8 1 0 0 . 0 84 .2 . . . .
6 y e a r s . . . . . . . . . . . . . . . . . . . . . 95 .0 1 0 0 . 0 95 .8 . . . .
7 y e a r s . . . . . . . . . . . . . . . . . . . . . 91 .7 . . . . 94 .7 . . . .
8 y e a r s . . . . . . . . . . . . . . . . . . . . . . . . . . . . . 90 .9 . . . .
9 y e a r s . . . . . . . . . . . . . . . . . . . . . . . . . . . . . . . . . . . . .
10 y e a r s . . . . . . . . . . . . . . . . . . . . . . . . . . . . . 1 0 0 . 0 . . . .
11 y e a r s . . . . . . . . . . . . . . . . . . . . . . . . . . . . . 1 0 0 . 0 . . . .
1 2 y e a r s . . . . . . . . . . . . . . . . . . . . . . . . . . . . . 1 0 0 . 0 . . . .
N u m b e r o f P a t i e n t s
B e f o r e . . . . . . . . . . . . . . . . . . . . . . . 82
A f t e r . . . . . . . . . . . . . . . . . . . . . . . . 8 2
y e a r . . . . . . . . . . . . . . . . . . . . . . 8 1
y e a r . . . . . . . . . . . . . . . . . . . . . . 7 8
1 y e a r . . . . . . . . . . . . . . . . . . . . . . . 7 8
2 y e a r s . . . . . . . . . . . . . . . . . . � 9 6 0
3 y e a r s . . . . . . . . . . . . . . . . . . . . . 4 6
4 y e a r s . . . . . . . . . . . . . . . . . . . . . 3 4
5 y e a r s . . . . . . . . . . . . . . . . . . . . . 31
6 y e a r s . . . . . . . . . . . . . . . . . . . . . 2 0
7 years . . . . . . . . . . . . . . . . . . . . . 12
8 y e a r s . . . . . . . . . . . . . . . . . . . . . 5
9 y e a r s . . . . . . . . . . . . . . . . . . . . . 6
10 y e a r s . . . . . . . . . . . . . . . . . . . . . 8
11 y e a r s . . . . . . . . . . . . . . . . . . . . . 8
12 y e a r s . . . . . . . . . . . . . . . . . . . . . 5
78 9 6 6 7
78 9 6 6 7
75 8 4 5 8
7 4 8 1 4 8
71 8 0 4 0
6 0 72 2 0
5 7 61 1 7
3 4 5 3 1 4
2 0 3 8 9
1 5 2 4 5
6 19 0
2 11 1
4 9 0
5 13 0
5 10 0
4 10 0

110 S E R O L O G Y I N G E N E R A L P A R E S I S
TABLE 9. CLINICAL CONDITION AND SPINAL FLUID GLOBULIN REACTI01~
Time relation Pe rcen t age of patients wi th negative globulin reaction to therapy Remission Improved Unimproved Dead
B e f o r e . . . . . . . . . . . . . . . . . . . . . . . . 6 .2 2 .5
A f t e r . . . . . . . . . . . . . . . . . . . . . . . 18 .5 11 .0
y e a r . . . . . . . . . . . . . . . . . . . . . . . 27 .8 17 .3
y e a r . . . . . . . . . . . . . . . . . . . . . . 35 .5 20 .6
1 y e a r . . . . . . . . . . . . . . . . . . . . . . 39 .2 29~2
2 y e a r s . . . . . . . . . . . . . . . . . . . . . . 54 .0 36 .7
3 y e a r s . . . . . . . . . . . . . . . . . . . . . 6 8 . 1 36 .2
4 y e a r s . . . . . . . . . . . . . . . . . . . . . 61 .1 46 .0
5 y e a r s . . . . . . . . . . . . . . . . . . . . . 77 .5 4 5 . 0
6 y e a r s . . . . . . . . . . . . . . . . . . . . . . . 61 .1 66.T
7 y e a r s . . . . . . . . . . . . . . . . . . . . . 69 .2 . . . .
8 y e a r s . , . . . . . . . . . . . . . . . . . . . . . . . . . . . .
9 y e a r s . . . . . . . . . . . . . . . . . . . . . . . . . . . . .
1 0 y e a r s . . . . . . . . . . . . . . . . . . . . . . . . . . . . .
11 y e a r s . . . . . . . . . . . . . . . . . . . . . . . . . . . . .
12 y e a r s . . . . . . . . . . . . . . . . . . . . . . . . . . . . .
5 .3 2 .9
15 .9 11 .7
17 .7 12 .1
21 .0 6 .5
21 ,9 9 .7
22 .5 15 .4
26 .2 28 .6
32 .1 27 .2
5 0 . 0 . . . .
80 .0 . . . .
81 .0 . . . .
80 .0 . . . .
72 .7 . . . .
76 .9 . . . .
70 .0 . . . .
75 .0 . . . .
N u m b e r o f P a t i e n t s
]3e fo re . . . . . , . . . . . . . . . . . . . . . . ,
A f t e r . . . . . . . . . . . . . . . . . . . . . . . .
y e a r . . . . . . . . . . . . . . . . . . . . . .
y e a r . . . . . . . . . . . . . . . . . . . . . . .
1 y e a r . . . . . . . . . . . . . . . . . . . . . .
2 y e a r s . . . . . - . . . . . . . . . . . . . , . .
3 y e a r s . . . . . . . . . . . . . . . . . . . . .
4 y e a r s . . . . . . . . . . . . . . . . . . . . .
5 y e a r s . . . . . . . . . . . . . . . . . . . ; ,
6 y e a r s . . . . . . . . . . . . . . . . . . . . . . .
7 y e a r s . . . . . . . . . . . . . . . . . . . . .
8 y e a r s . . . . . . . . . . . . . . . . . . . . .
9 y e a r s . . . . . . . . . . . . . . . . . . . . . .
1 0 y e a r s . . . . . . . . . . . . . . . . . . . . .
11 y e a r s . . . . . . . . . . . . . . . . . . . . .
12 y e a r s . . . . . . . . . . . . . . . . . . . . .
8 1 8 2
81 8 2
7 9 7 5
76 73
79 7 2
6 3 6 0
4 7 4 7
3 6 37
8 1 2 1
1 8 1 5
13 6
4 4
5 4
7 4
7 7
4 4
9 4 6 8
9 4 6 8
8 5 5 8
81 4 6
8 2 4 1
7 1 2 6
6 1 1 4
5 3 1 1
~8 8
2 5 2
21 0
1 0 0
11 0
13 O
10 0
12 0

J O S E P H R. BLALOCKj M. D.~ AND L E L A N D E. HI I~SIE~ M . D . 111
TABLE 1O. CLINICAL CONDI~ION AND LOW OR NEGATIVE GOLD SOL REACTION
Time relation
t O
therapy
Percentage of patients Remission Improved Unimproved Dead
Low Negative Low Negative Low Negative Low Negative
Befo re . . . . . .
A f t e r . . . . . . . .
i~ y e a r . . . . . .
y e a r . . . . . .
1 y e a r . . . . . .
2 yea r s . . . .
3 yea r s . . . .
4 yea r s . . . .
5 yea r s . . . .
6 yea r s . . . .
7 yea r s . . . .
8 yea r s . . . .
9 yea r s . . . . .
10 yea r s . . . . .
11 yea r s . . . . .
12 y e a r s . . . . .
11.5 2.6 9.0 1.2 8.5 2.2 0.0 1.5
14.1 7.7 9.0 5.1 10.6 3.2 15.4 0.0
20.8 6.5 12.3 6.9 15.7 2.4 16.4 9.1
21.1 10.5 25.3 9.9 19.8 4.9 13.6 0.0
21.0 18.4 25.4 15.5 22.6 14.3 17.6 0.0
25.8 30.6 25.0 30.4 21.4 17.1 8.7 13.0
33.3 31.3 17.0 42.6 23.2 19.7 0.0 28.6
20.6 52.5 53.3 36.4 15.7 21.6 . . . . . . .
13.8 75.9 26.3 31.6 15.8 47.4 . . . . . . .
5.3 89.4 36.4 45.4 16.0 72.0 . . . . . . .
7.7 76.9 . . . . . . . . 15.8 63.2 . . . . . . .
. . . . . . . . . . . . . . . . 0.0 80.0 . . . . . . .
~ 1 7 6 1 7 6 ~ 1 7 6 J . J ~ . f ~ , . . J . . I , . , o , . ~
. . . . . . . . . . . . . . . . 8.3 75.0 . . . . . . .
. . . . . . . . . . . . . . . . 7 .7 84.6 . . . . . . .
. . . . . . . . . . . . . . . . 20.0 80.0 . . . . . . .
1Vumber of P a t i e n t s
Befo re . . . . . . .
A f t e r . . . . . . .
y e a r . . . . .
�89 y e a r . . . . .
1 y e a r . . . . .
2 yea r s . . . .
3 yea r s . . . .
4 yea r s . . . . .
5 yea r s . . . .
6 yea r s . . . .
7 yea r s . . . .
8 yea r s . . . .
9 yea r s . . . .
lO yea r s . . . .
11 yea r s . . . .
12 yea r s . . . .
78 78 94 65
78 78 94 65
77 73 83 55
76 71 81 44
76 71 84 34
62 56 70 23
48 47 56 14
34 33 51 9
29 19 38 4
19 11 25 3
13 5 19 0
55 2 10 1
5 4 8 0
8 6 12 O
7 6 13 0
4 4 10 0

112
TABLE 11.
SEROLOGY IN GENERAL PARESIS
PERCENTAGE OF PATIENTS WITH NEGATIVE SEROLOGY BY ~rEARS
A. MALARIAL TREATMENT
Clinically Improved Patients
Years since Number of Blood Spinal fluid malaria patients Wassermann Wassermann Cells Globulin Gold sol
1-2 19 10.5 5.3 100,0 42.1 15.8
2-4 14 28.6 57,2 100.0 42.9 57.2
4-7 20 55.0 95.0 95.0 75.0 75.0
7-12 15 80.0 100.0 86.7 73.3 73.3
Clinically Unimproved Patients
1-2 12 0.0 8.3 66.7 8.3 8.3
2-4 13 23.1 23.1 69.2 38.4 30.8
4-7 14 35.7 57.2 85.7 42.8 50.0
7-12 10 40.,0 70.0 100,0 70.0 90.0
TABLE 12. PERCENTAGE OF PATIENTS WI~H NEGATIVE SF~ROLO6Y Br YEARS Be TRYPARSAMIDE
Clinieally Improved Patients
Years since Number Blood Spinal fluid tryparsamlde of patients Wassermann Wassermann Gold sol
1 28 32.2 28.6 21.4
2 20 10.0 26.3 33.3
3 12 25.0 33.3 36.4
4 11 36.4 4L7 45.5
5 11 90.9 81.8 90.0
Clinically Unimproved Patients
1 27 29.6 18.5 10.7
2 23 4.4 13.0 37.5
3 20 20.0 15.0 30.0
4 17 11.8 18.8 16.7
5 15 20.0 33.3 40.0

J O S E P H R. BLALOCK~ IVs D.~ AND L E L A N D E. H I N S I E 1 1VL D.
TABLE 13. PERCENTAGE OF PATENTS WITH ~EGATIVE SEROLOGY BY YEARS
C. ELECTROPYREXLA ALONE _AND WITH CHE]NIOTHF.a%APY
113
Clin ica l ly I m p r o v e d P a t i e n t s Years since Number Blood Spinal fluid treatment of patients Wassermann Wassermann Gold sol
1 73 17.8 19.2 34.2
2 48 31.3 41.6 54.0
3 38 47.4 47.4 63.2
4 22 59.1 63.6 77.3
Cl in ica l ly Un improved P a t i e n t s
1 43 14.0 11.6 11.6
2 37 8.1 18.9 24.3
3 33 18.2 30.3 33.3
4 22 18.2 40.9 40.9
TABLE 14. BLOOD WASSERMANN REACTION IN RELATION TO TYPE OF THERAPY
Time Percentage of patients relation Malaria Tryparsamide Electropyrexia Electropyrexia and
to only only only tryparsamide therapy Reduced Negative Reduced Negative Reduced Negative Reduced Negative
Befo re . . . . . . . . . . 12.7 . . . . 14.5 . . . . 0.0 . . . . 0.0
A f t e r . . . . . . . 9.3 14.0 12.9 41.9 4.7 4.6 1.8 8.9
�90 y e a r . . . . . . 13.6 16.1 11.7 40.0 0.0 6.4 5.7 9.4
1~ yea r . . . . . . 16.8 15.9 12.5 41.1 1.5 4.5 2.0 14.3
1 y e a r . . . . . . 16.9 15.7 21.1 30.8 0.0 9.1 2.3 25.0
2 yea r s . . . . . 22.6 17.7 40.9 9.1 4.0 12.0 5.9 41.2
3 yea r s . . . . . 29.5 29.5 43.2 16.2 6.3 18.7 0.0 40.0
4 yea r s . . . . . 16.7 44.4 50.0 15.4 7.7 30.8 . . . . . . . .
5 yea r s . . . . . 17.2 55.2 36.4 45.4 . . . . . . . . . . . . . . . .
6 yea r s . . . . . . 12.5 75.0 36.8 57.9 . . . . . . . . . . . . . . . .
7 yea r s . . . . . 21.1 68.4 33.3 58.3 . . . . . . . . . . . . . . . .
N u m b e r of P a t i e n t s
Be fo re . . . . . . . 150 62 86 56
A f t e r . . . . . . . . 150 62 86 56
y e a r . . . . . . 118 60 78 53
�89 y e a r . . . . . . 107 56 66 49
1 y e a r . . . . . . 89 52 44 44
2 yea r s . . . . . 62 44 25 34
3 yea r s . . . . . 44 37 16 15 4 yea r s . . . . . 36 26 13 . .
5 yea r s . . . . . 29 22 . . . .
6 yea r s . . . . . 24 19 . . . .
7 yea r s . . . . . 19 12 . . . .

114 S E R O L O G Y IN G E N E R A L P A R E S I S
TABLE 15. SPINAL FLUID WASSERMANN RF~ACTION IN RELATION TO TYPE OF THERAPY
Time relation
to therapy
Percentage of pat ients M~laria Tryparsamide Eleetropyrexia Eleetropyrexia and
only only only t ryparsamlde Reduced lqegative Reduced Negative Reduced Negative Reduced Negative
B e f o r e . . . . . . . . . . . 1 .6 . . . . 0.O . . . . 0 .0 . . . . 0 .0
A f t e r . . . . . . . 19 .0 1 .6 30 .6 11.3 3 .5 3 .5 10 .7 3 .6
y e a r . . . . . . 26 .5 3.3 27 .9 21 .3 1.3 10 .2 7.6 7.5
�89 y e a r . . . . . . 30 .6 4 .6 38 .3 20 .0 4 .6 12 .3 8 .2 10.2
1 y e a r . . . . . . 47 .4 5 .2 39 .2 25 .5 0 .0 15 .6 2.2 28 .9
2 y e a r s . . . . . 4 4 . 4 17 .5 35 .6 22 .2 4 .0 20 .0 6 .9 44 .8
3 y e a r s . . . . . 35 .7 40 .5 38 .9 27 .8 6 . 3 18 .7 5 .3 42 .1
4 y e a r s . . . . . 32 .4 56 .8 34 .4 34 .4 16 .7 58 .3 . . . . . . . .
5 y e a r s . . . . . 13 .5 73 .0 34 .6 46 .2 . . . . . . . . . . . . . . . .
6 y e a r s . . . . . 20 .0 76.7 22.7 68 .2 . . . . . . . . . . . . . . . .
7 y e a r s . . . . . 9 .5 85 .7 0.0 90 .0 . . . . . . . . . . . . . . . .
N u m b e r o f P a t i e n t s
B e f o r e . . . . . . . 153 62 86 5 6
A f t e r . . . . . . . 153 6 2 86 56
l ~ y e a r . . . . . 1 2 1 6 1 78 53
y e a r . . . . . . 1 0 8 60 65 4 9
1 y e a r . . . . . . 9 7 5 1 4 5 4 5
2 y e a r s . . . . . 63 4 5 2 5 29
3 y e a r s . . . . . 4 2 3 6 16 19
4 y e a r s . . . . . 37 32 12 . .
5 y e a r s . . . . . 37 2 6 . . . .
6 y e a r s . . . . . 3 0 2 2 . . . .
7 y e a r s . . . . . 2 1 10 . . . .
TABLE 16. NORMAL SPINAL FLUID CELL COUNT IN RELATION TO TYPE OF THERAPY
Times Percentsge of normal cell counts relation Eloetropyrexia
to Mala, ria Tryparsamide Electropyrexia and ther&py only only only tryparsamide
B e f o r e . . . . . . . . . . . . . . . . . . . . . 37 .3 29 .0 22 .1 21 .6
A f t e r . . . . . . . . . . . . . . . . . . . . . . 76 .7 . . . . 64 .0 84.3
y e a r . . . . . . . . . . . . . . . . . . . . 93 .2 8 5 . 5 60 .7 87 .7
y e a r . . . . . . . . . . . . . . . . . . . . 92 .2 89 .7 58 .3 95 .5
1 y e a r . . . . . . . . . . . . . . . . . . . . 92 .3 83 .7 58 .3 88 .4
2 y e a r s . . . . . . . . . . . . . . . . . . . 91 .8 95 .1 52 .0 92 .9
3 y e a r s . . . . . . . . . . . . . . . . . . . 92 .5 93 .9 58 .8 88 .9
4 yei~rs . . . . . . . . . . . . . . . . . . . 97 .2 93.1 77 .8 . . . .
5 y e a r s . . . . . . . . . . . . . . . . . . . 1 0 0 . 0 100 .0 77.8 . . . .
6 y e a r s . . . . . . . . . . . . . . . . . . . 100 .0 95 .5 . . . . . . . .
7 y e a r s . . . . . . . . . . . . . . . . . . . 94 .1 100 .0 . . . . . . . .

J O S E P H R . B L A L O C K ~ M , D . , A N D L E L A l q D E , H ! N S I E 3 M . D . 1 ~ 5
N u m b e r o f P a t i e n t s
B e f o r e . . . . . . . . . . . . . . . . . . . . . 1 5 0
A f t e r . . . . . . . . . . . . . . . . . . . . . . 1 5 0
y e a r . . . . . . . . . . . . . . . . . . . . 118
y e a r . . . . . . . . . . . . . . . . . . . . 1 0 2
1 y e a r . . . . . . . . . . . . . . . . . . . . . 91
2 y e a r s . . . . . . . . . . . . . . . . . . . 6 1
3 y e a r s . . . . . . . . . . . . ~ . . . . . . . 4 0
4 y e a r s . . . . . . . . . . . . . . . . . . . . 36
5 y e a r s . . . . . . . . . . . . . . . . . . . 2 9
6 y e a r s . . . . . . . . . . . . . . . . . . . 2 8
7 y e a r s . . . . . . . . . . . . . . . . . . . . . 17
62 8 6 51
. . 86 51
6 2 6 6 4 9
58 6 0 4 4
4 9 4 8 43
4 1 2 5 28
33 ] 7 1 8
2 9 9 . .
2 5 9 . .
22 . . . .
11 . . . . .
TABLE 17. S P I ~ FLU~ GLOBULIN RFAC~IOI~ Ii~ R ~ A ~ O N ~0 TYPE OF THERAPY
Time Percen tage of pat ients relat ion X a l a r i a T rypa r samids Elect ropyrexia Elect ropyrexla
to only only only a n d t rypa r samide the rapy 1 plus Negative 1 plus Negat ive 1 plus Negative 1 plus ~ega t ive
B e f o r e . . . . . . .
A f t e r . . . . . .
y e a r . . . . .
�89 y e a r . . . . .
1 y e a r . . . .
2 y e a r s . . . .
3 y e a r s . . . .
4 y e a r s . . . .
5 y e a r s . . . .
6 y e a r s . . . .
7 y e a r s . . . .
17 .6 5 .9 22.2 1.6 43.7" 19 .5 35 .1 9 ,3
19 .6 10 .5 . . . . . . . . 64 .3 25 .3 62 .9 2 0 . 4
25 .0 20 .8 32 .8 32 .8 54 .6 26 .7 49 .0 43 .1
35 .0 19 .6 47 .1 30 .2 46 .8 30 .6 43 .7 54 .2
33 .3 24 .4 43 .3 39 .6 42 .0 42 .0 41 .3 56 .5
41 .2 27.4 3 4 . 1 45 .5 34 .8 4 7 . 4 3 1 . 0 65 :5
27.5 42 .5 22 .9 4 0 . 0 41 .2 41 .2 3 1 . 6 63 .1
21 .6 59 .5 27 .6 37 .9 50 .0 50 .0 . . . . . . . .
13 .3 70 .0 17.4 52.2 . . . . . . . . . . . . . . . .
26 .1 65 .2 21 ,7 73 .9 . . . . . . . . . . . . . . . .
20 .0 80 .0 . . . . . . . . . . . . . . . . . . . . . . . .
N u m b e r o f P a t i e n t s
B e f o r e . . . . , . .
A f t e r . . . . . . .
y e a r . . . . .
�89 y e a r . . . . .
1 y e a r . . . . .
2 y e a r s . . . .
3 y e a r s . . . .
4 y e a r s . . . .
5 y e a r s . . . . .
6 y e a r s . . . . .
7 y e a r s . . . . .
153 63 8 7 5 4
1 5 3 . . . . 5 4
1 2 0 6 1 75 51
9 7 5 3 6 2 4 8
9 0 5 3 5 0 4 6
5 1 4 4 2 3 2 9
4 0 3 5 1 7 19
3 7 2 9 12 . .
3 0 2 3 . . . .
2 3 23 . . . .
1 5 10 . . . .

1 1 6 SEROLOGY I N G EN ERA L PARESIS
TABLE 18. GOLD SOL REACTION IN RELATION TO TYPE OF THERAPY
Time relation
to therapy
Malaria only
Low Negative
Percentage of patients Tryparsamide Eleetropyrexla Electropyrexia
only only and tryparsamide Low Negative Low Negative Low Negative
Be fo re . . . . . .
A f t e r . . . . . . .
% y e a r . . . . .
�89 y e a r . . . . .
1 y e a r . . . . .
2 yea r s . . . .
3 yea r s . . . .
4 yea r s . . . .
5 yea r s . . . .
6 yea r s . . . .
7 yea r s . . . .
2.9 0.0 3.3 0.0 32.5 2.5 21.8 3.6
9.4 1.5 . . . . . . . . 30.1 10.9 32.8 9,1
9.8 5.9 11.9 1.7 35.4 12.9 48.0 12.0
11.4 9.1 9.3 7.4 39.5 15.1 46.7 8.9
13.8 11.2 9.8 15.7 28.5 16.5 35.0 42.5
8.6 29.3 24.4 26.8 14.3 23.8 22.2 59.3
15.8 42.1 21.2 24.3 15.4 15.4 ~).0 75.0
19.4 52.8 17.9 28.6 9.1 45.5 . . . . . . . .
9.7 77.4 10.0 55.0 . . . . . . . . . . . . . . . .
3.6 89.3 5.9 88.2 . . . . . . . . . . . . . . . .
5.6 77.8 0.0 100.0 . . . . . . . . . . . . . . . .
N u m b e r of P a t i e n t s
Be fo re . . . . . . . 138 60 83 55
A f t e r . . . . . . . . 138 . . 83 55
y e a r . . . . . . 102 59 79 50
�89 y e a r . . . . . . 88 54 66 45
1 y e a r . . . . . . 80 51 49 40
2 yea r s . . . . . 58 41 21 27
3 yea r s . , . . , 38 33 13 20
4 y e a r s . . . . . 36 28 11 . .
5 y e a r s . . . . . 31 20 . . . .
6 yea r s . . . . . 28 17 . . . .
7 yea r s . . . . . 18 10 . . . .