sergio mariotti [email protected] göteborg, jun 19 th 2006 institute of radioastronomy, -...
TRANSCRIPT

Sergio Mariotti [email protected] Göteborg, jun 19th 2006
INSTITUTE OF RADIOASTRONOMY, - ITALYINSTITUTE OF RADIOASTRONOMY, - ITALY UNIVERSITY “TOR VERGATA” - ROMEUNIVERSITY “TOR VERGATA” - ROME
1 INAF – Institute of Radioastronomy- Bologna – Italy2 Elettronica s.p.a. – V. Tiburtina Valeria, Rome – Italy3 University “Tor Vergata” – Electronic Eng. Dept. – Rome - Italy
Reduction of the UncertaintyReduction of the Uncertainty on Noise Figure Measurements on Noise Figure Measurements
A. Cremonini 1, M. De Dominicis 2, S. Mariotti 1 , E. Limiti 3, A.Serino 3
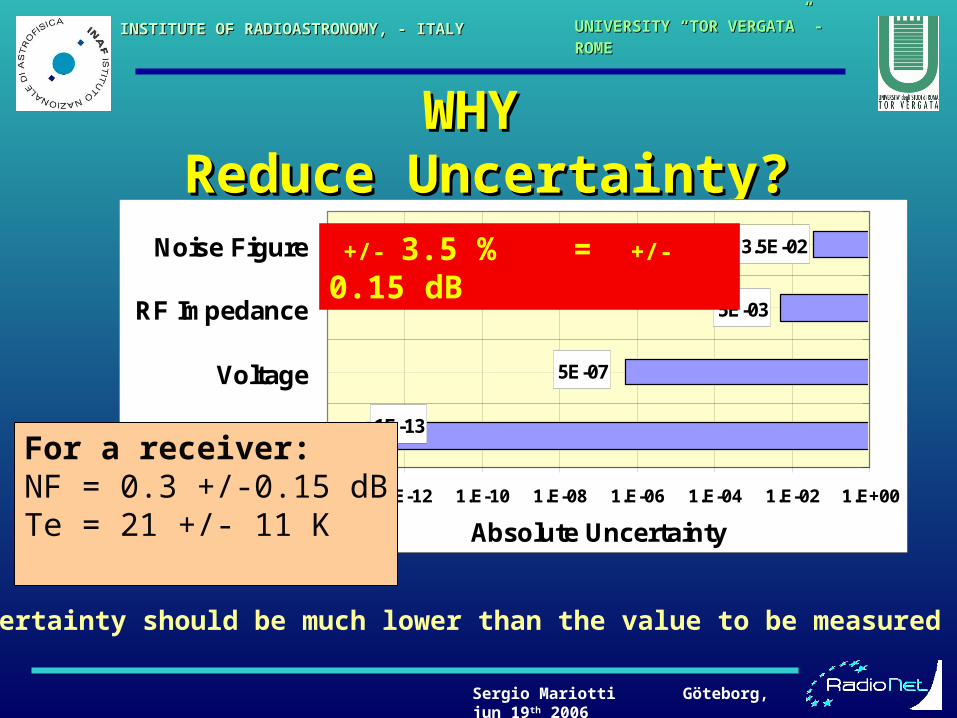
WHYWHY Reduce Uncertainty? Reduce Uncertainty?
Sergio Mariotti Göteborg, jun 19th 2006
INSTITUTE OF RADIOASTRONOMY, - ITALYINSTITUTE OF RADIOASTRONOMY, - ITALY UNIVERSITY “TOR VERGATA” - ROMEUNIVERSITY “TOR VERGATA” - ROME
Uncertainty should be much lower than the value to be measured
3.5E-02
1E-13
5E-07
5E-03
1.E-14 1.E-12 1.E-10 1.E-08 1.E-06 1.E-04 1.E-02 1.E+00
Time
Voltage
RF Impedance
Noise Figure
Absolute Uncertainty
+/- 3.5 % = +/- 0.15 dB
For a receiver:NF = 0.3 +/-0.15 dBTe = 21 +/- 11 K
Sergio Mariotti Göteborg, jun 19th 2006
INSTITUTE OF RADIOASTRONOMY, - ITALYINSTITUTE OF RADIOASTRONOMY, - ITALY UNIVERSITY “TOR VERGATA” - ROMEUNIVERSITY “TOR VERGATA” - ROME
• Looking for and Find Sources of Uncertainty (U)
HowHowReduce Uncertainty? Reduce Uncertainty?
• Analyze and propagate uncertainty
• Minimize the sources wherever it is possible
• Since U(ENR) is dominant, let do calibration of NoiseSource with a Secondary Standard (liq. N2)
• Let Practical operations accurate as possible

Sergio Mariotti Göteborg, jun 19th 2006
INSTITUTE OF RADIOASTRONOMY, - ITALYINSTITUTE OF RADIOASTRONOMY, - ITALY UNIVERSITY “TOR VERGATA” - ROMEUNIVERSITY “TOR VERGATA” - ROME
Involved EnvironmentsInvolved Environments
Room TemperatureRoom Temperature Cryogenic /on DewarCryogenic /on Dewar
- easier- faster- accurate
- less jitter- more realistic- accurate
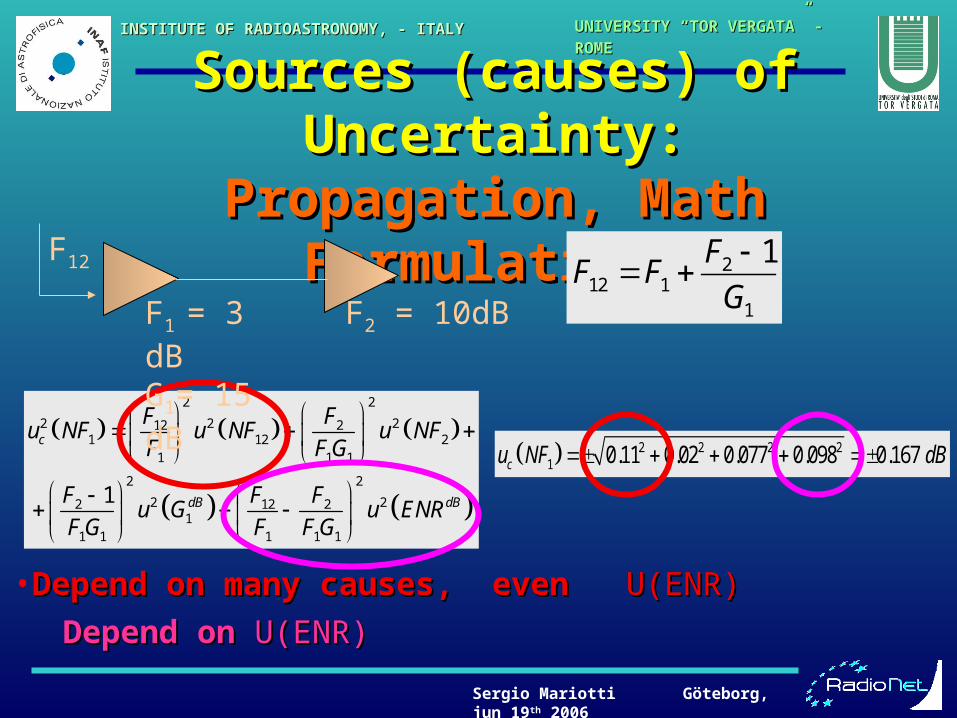
2 2 2 21 0.11 0.02 0.077 0.098 0.167 cu NF dB
Sergio Mariotti Göteborg, jun 19th 2006
INSTITUTE OF RADIOASTRONOMY, - ITALYINSTITUTE OF RADIOASTRONOMY, - ITALY UNIVERSITY “TOR VERGATA” - ROMEUNIVERSITY “TOR VERGATA” - ROME
Sources (causes) of Uncertainty:Sources (causes) of Uncertainty:Propagation, Math Formulation Propagation, Math Formulation
212 1
1
1FF F
G
2 2
2 2 212 21 12 2
1 1 1
2 2
2 22 12 21
1 1 1 1 1
1
c
dB dB
F Fu NF u NF u NF
F FG
F F Fu G u ENR
FG F FG
F12
F2 = 10dBF1 = 3 dBG1= 15 dB
•Depend on many causes, even Depend on many causes, even U(ENR)U(ENR)
Depend on Depend on U(ENR)U(ENR)
Sergio Mariotti Göteborg, jun 19th 2006
INSTITUTE OF RADIOASTRONOMY, - ITALYINSTITUTE OF RADIOASTRONOMY, - ITALY UNIVERSITY “TOR VERGATA” - ROMEUNIVERSITY “TOR VERGATA” - ROME
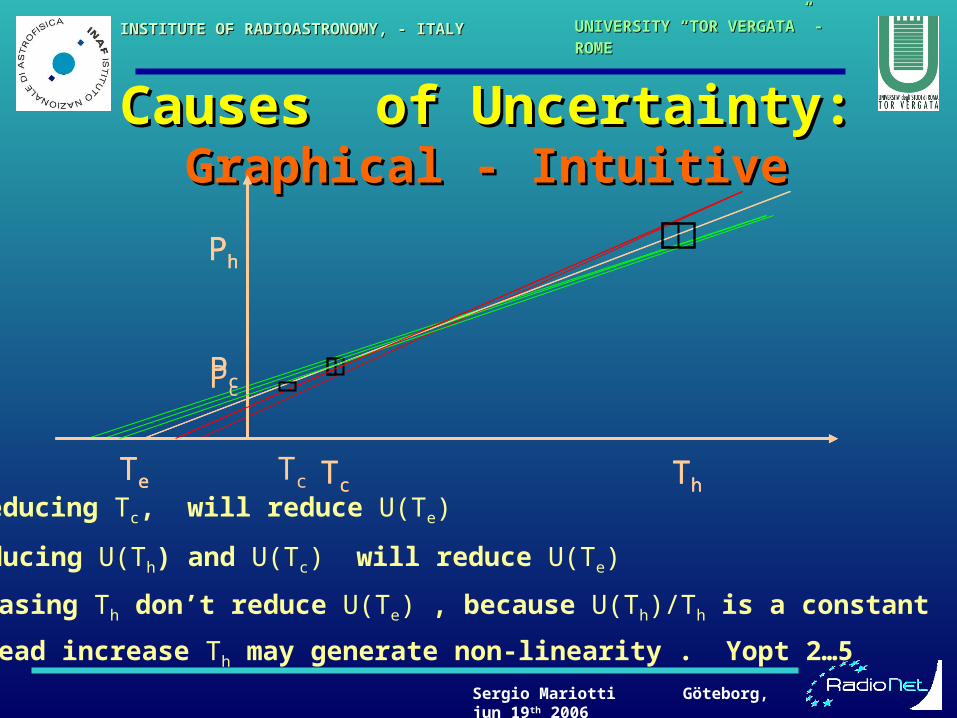
Causes of Uncertainty:Causes of Uncertainty:Graphical - IntuitiveGraphical - Intuitive
Te Tc Th
Pc
Ph
Te Tc Th
Pc
Ph
Reducing Tc, will reduce U(Te) Te Tc Th
Pc
Ph
Reducing U(Th) and U(Tc) will reduce U(Te)
Increasing Th don’t reduce U(Te) , because U(Th)/Th is a constant
Instead increase Th may generate non-linearity . Yopt 2…5
Sergio Mariotti Göteborg, jun 19th 2006
INSTITUTE OF RADIOASTRONOMY, - ITALYINSTITUTE OF RADIOASTRONOMY, - ITALY UNIVERSITY “TOR VERGATA” - ROMEUNIVERSITY “TOR VERGATA” - ROME
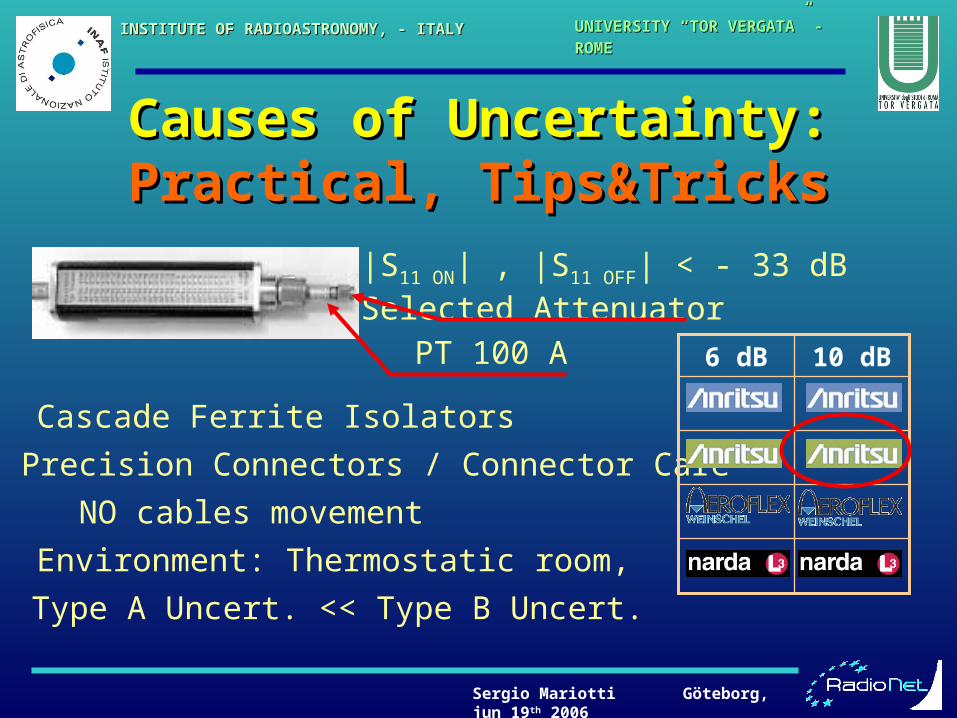
Causes of Uncertainty:Causes of Uncertainty:Practical, Tips&TricksPractical, Tips&Tricks
|S11 ON| , |S11 OFF| < - 33 dBSelected AttenuatorPT 100 A
Cascade Ferrite Isolators
Environment: Thermostatic room,
NO cables movement
Precision Connectors / Connector Care
Type A Uncert. << Type B Uncert.
10 dB6 dB
Sergio Mariotti Göteborg, jun 19th 2006
INSTITUTE OF RADIOASTRONOMY, - ITALYINSTITUTE OF RADIOASTRONOMY, - ITALY UNIVERSITY “TOR VERGATA” - ROMEUNIVERSITY “TOR VERGATA” - ROME
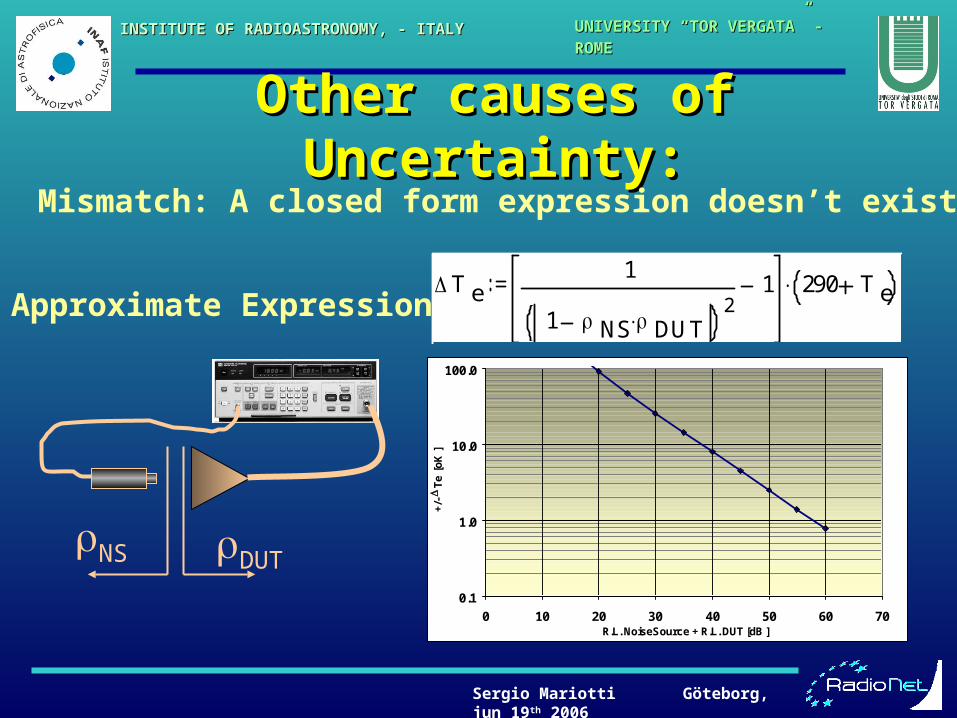
Other causes of Uncertainty:Other causes of Uncertainty:
Approximate Expression T e
1
1 NS DUT 2
1 290 T e
0.1
1.0
10.0
100.0
0 10 20 30 40 50 60 70 R.L. NoiseSource + R.L. DUT [dB ]
+/-
T
e [
oK
]
NS DUT
Mismatch: A closed form expression doesn’t exist
Liq. N2
77 K POWER METER
800 W Liq. N2
77 K POWER METER
3200 W Liq. N2
77 K POWER METER
9400 W Liq. N2
77 K POWER METER
800 W Liq. N2
77 K POWER METER
3200 W Liq. N2
77 K POWER METER
9400 W
Sergio Mariotti Göteborg, jun 19th 2006
INSTITUTE OF RADIOASTRONOMY, - ITALYINSTITUTE OF RADIOASTRONOMY, - ITALY UNIVERSITY “TOR VERGATA” - ROMEUNIVERSITY “TOR VERGATA” - ROME
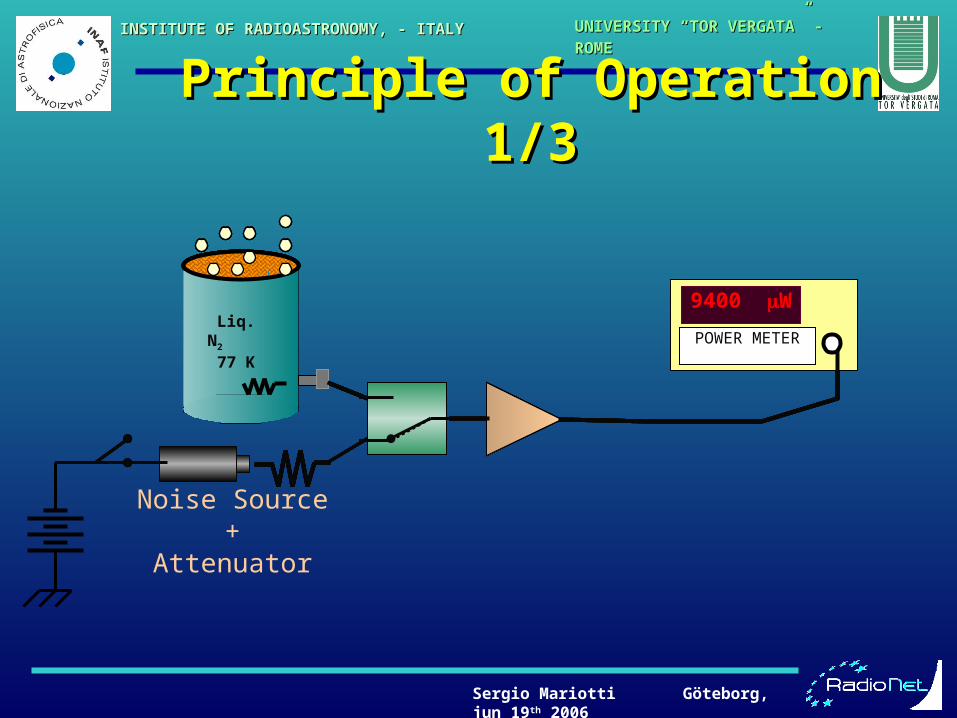
Principle of Operation 1/3Principle of Operation 1/3
Noise Source+
Attenuator
Sergio Mariotti Göteborg, jun 19th 2006
INSTITUTE OF RADIOASTRONOMY, - ITALYINSTITUTE OF RADIOASTRONOMY, - ITALY UNIVERSITY “TOR VERGATA” - ROMEUNIVERSITY “TOR VERGATA” - ROME
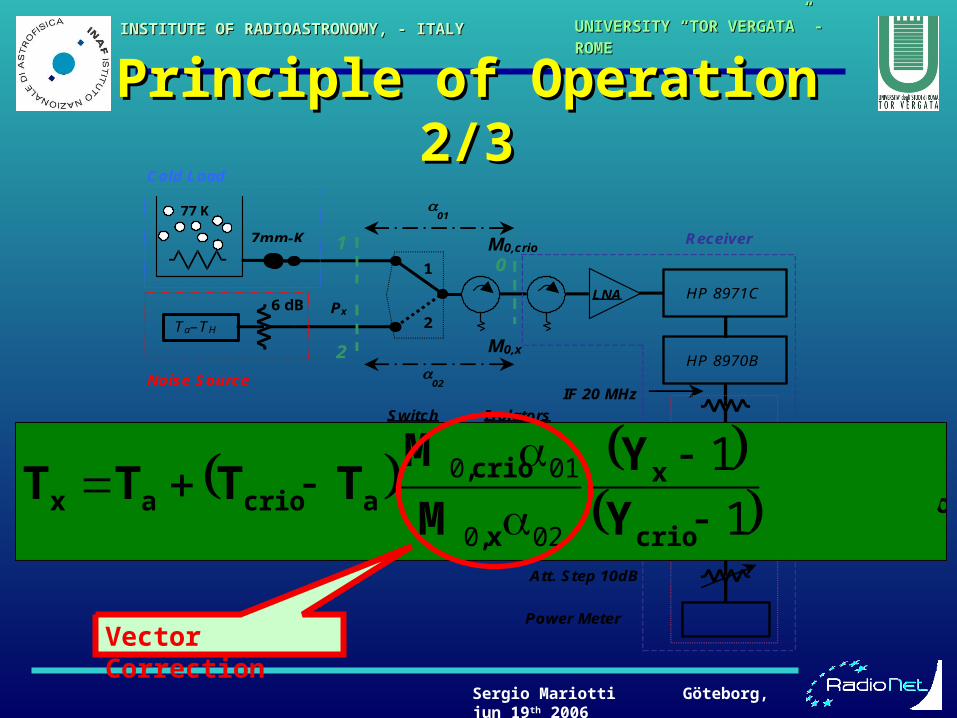
Principle of Operation 2/3Principle of Operation 2/3
1
Switch Isolators
2
LNA
Receiver
0 1
2
Px
02
01
M0,crio
Noise Source
Ta–TH
77 K
7mm-K
M0,x
HP 8971C
HP 8970B
Pad 3dB
Att. Step 1dB
Att. Step 10dB
Cold Load
IF 20 MHz
Power Meter
PA
PA
IF
6 dB
isoe
crio
x
x,
crio,acrioax T
Y
Y
M
MTTTT
1
1
020
010
Vector Correction

Sergio Mariotti Göteborg, jun 19th 2006
INSTITUTE OF RADIOASTRONOMY, - ITALYINSTITUTE OF RADIOASTRONOMY, - ITALY UNIVERSITY “TOR VERGATA” - ROMEUNIVERSITY “TOR VERGATA” - ROME
PicturesPictures•Coaxial1-18 GHz
•WR 2826.5-40 GHz
•WR 2233-50 GHz
Sergio Mariotti Göteborg, jun 19th 2006
INSTITUTE OF RADIOASTRONOMY, - ITALYINSTITUTE OF RADIOASTRONOMY, - ITALY UNIVERSITY “TOR VERGATA” - ROMEUNIVERSITY “TOR VERGATA” - ROME
Data AnalysisData Analysis
MatLabMatLab®® codes has been used to:codes has been used to:
Process spar of non insertable Adapter
Compute Mismatch and Available Gain
Instruments control and automatic data collection
Calculate ENR and associated Uncertainty

Sergio Mariotti Göteborg, jun 19th 2006
INSTITUTE OF RADIOASTRONOMY, - ITALYINSTITUTE OF RADIOASTRONOMY, - ITALY UNIVERSITY “TOR VERGATA” - ROMEUNIVERSITY “TOR VERGATA” - ROME
Uncertainty of the ResultUncertainty of the Result
'21
2 2 2
2 2 20.0045 1.72 0.74 1.87 K
transa
crio crio crio crioT S Tu T u T u T u T
2 2 22
2 2 2 218.0 1.83 8.68 23.5 30.9 K
hot hot hot hot hots a Y Su T u T u T u T u T
Uncertainty of VNA is dominant ( 0.045 dB - hp 8510C )
S par UncertaintyDepend on U(Tcryo)
S par Uncertainty
Sergio Mariotti Göteborg, jun 19th 2006
INSTITUTE OF RADIOASTRONOMY, - ITALYINSTITUTE OF RADIOASTRONOMY, - ITALY UNIVERSITY “TOR VERGATA” - ROMEUNIVERSITY “TOR VERGATA” - ROME
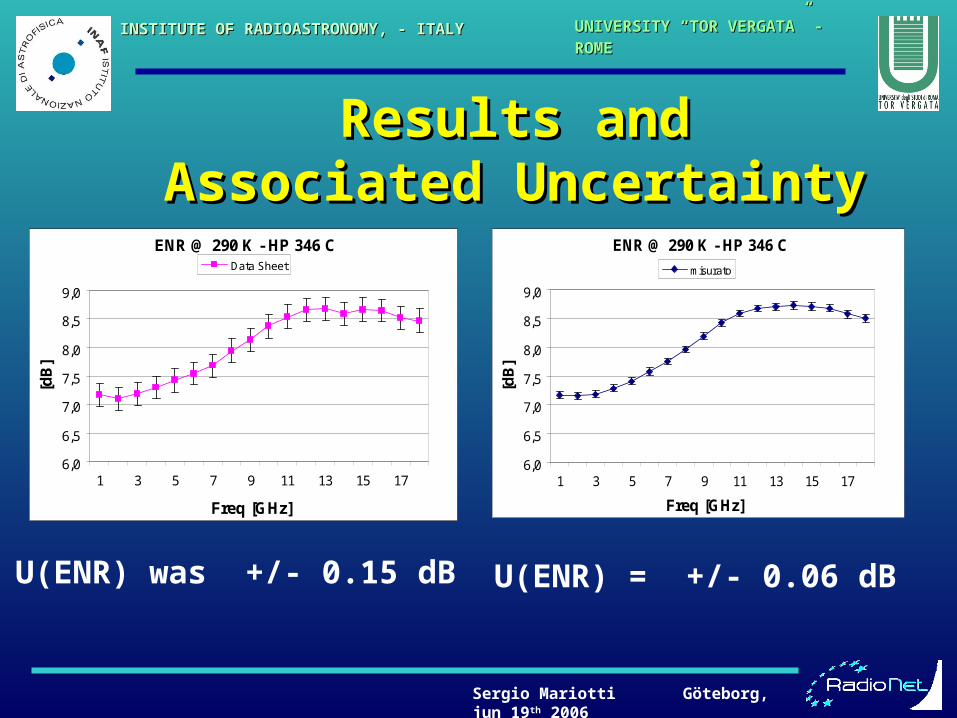
Results andResults andAssociated UncertaintyAssociated Uncertainty
ENR @ 290 K - HP 346 C
6,0
6,5
7,0
7,5
8,0
8,5
9,0
1 3 5 7 9 11 13 15 17
Freq [GHz]
[dB
]
Data Sheet
ENR @ 290 K - HP 346 C
6,0
6,5
7,0
7,5
8,0
8,5
9,0
1 3 5 7 9 11 13 15 17
Freq [GHz][d
B]
misurato
U(ENR) was +/- 0.15 dB U(ENR) = +/- 0.06 dB

Sergio Mariotti Göteborg, jun 19th 2006
INSTITUTE OF RADIOASTRONOMY, - ITALYINSTITUTE OF RADIOASTRONOMY, - ITALY UNIVERSITY “TOR VERGATA” - ROMEUNIVERSITY “TOR VERGATA” - ROME
Spin-off for the LNAs Spin-off for the LNAs
80
100
120
140
18 20 22 24 26Frequency [ GHz ]
No
ise
Tem
per
atu
re [
K ] Simulation
80
100
120
140
18 20 22 24 26Frequency [ GHz ]
No
ise
Tem
per
atu
re [
K ] Simulation
Common U(ENR)
80
100
120
140
18 20 22 24 26Frequency [ GHz ]
No
ise
Tem
per
atu
re [
K ]
Simulation
Common U(ENR)
Low U(ENR)
Sergio Mariotti Göteborg, jun 19th 2006
INSTITUTE OF RADIOASTRONOMY, - ITALYINSTITUTE OF RADIOASTRONOMY, - ITALY UNIVERSITY “TOR VERGATA” - ROMEUNIVERSITY “TOR VERGATA” - ROME
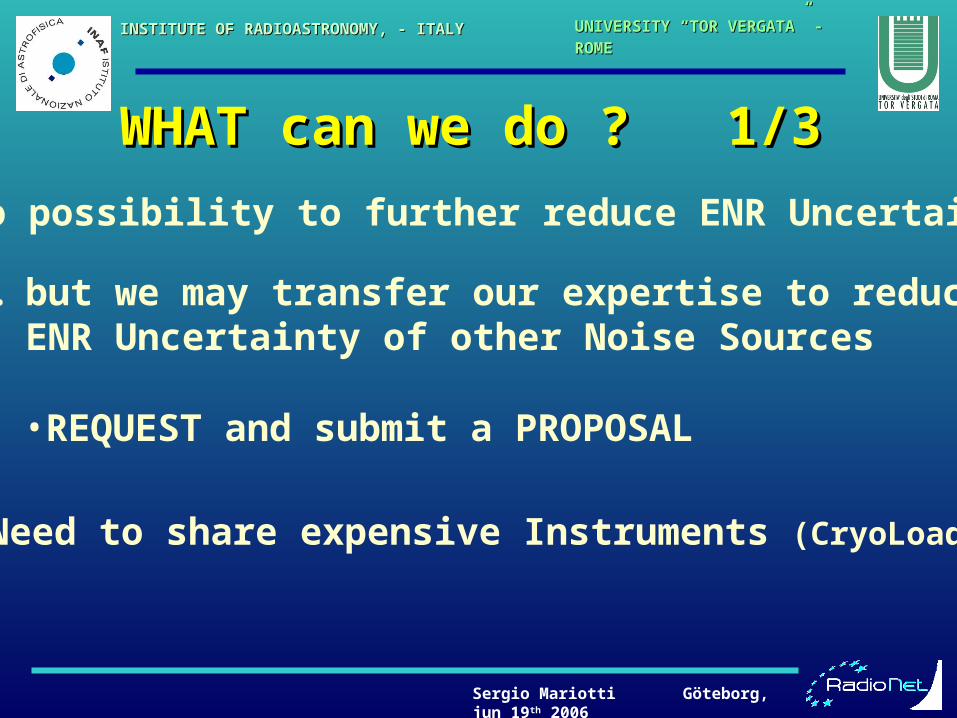
WHAT can we do ? 1/3WHAT can we do ? 1/3
• No possibility to further reduce ENR Uncertainty
• … but we may transfer our expertise to reduce ENR Uncertainty of other Noise Sources
•REQUEST and submit a PROPOSAL
• Need to share expensive Instruments (CryoLoad)
Sergio Mariotti Göteborg, jun 19th 2006
INSTITUTE OF RADIOASTRONOMY, - ITALYINSTITUTE OF RADIOASTRONOMY, - ITALY UNIVERSITY “TOR VERGATA” - ROMEUNIVERSITY “TOR VERGATA” - ROME
WHAT can we do ? 2/3WHAT can we do ? 2/3• PROPOSAL: Comparition of Noise Figure Measurementover community (better if even larger)
• As the IEEE “Round Robin”, an LNA will be sentto European Laboratories to be measured.Each laboratory will perform measurement asusual and according to its own methodology
•Measured data will be compared and published
Sergio Mariotti Göteborg, jun 19th 2006
INSTITUTE OF RADIOASTRONOMY, - ITALYINSTITUTE OF RADIOASTRONOMY, - ITALY UNIVERSITY “TOR VERGATA” - ROMEUNIVERSITY “TOR VERGATA” - ROME
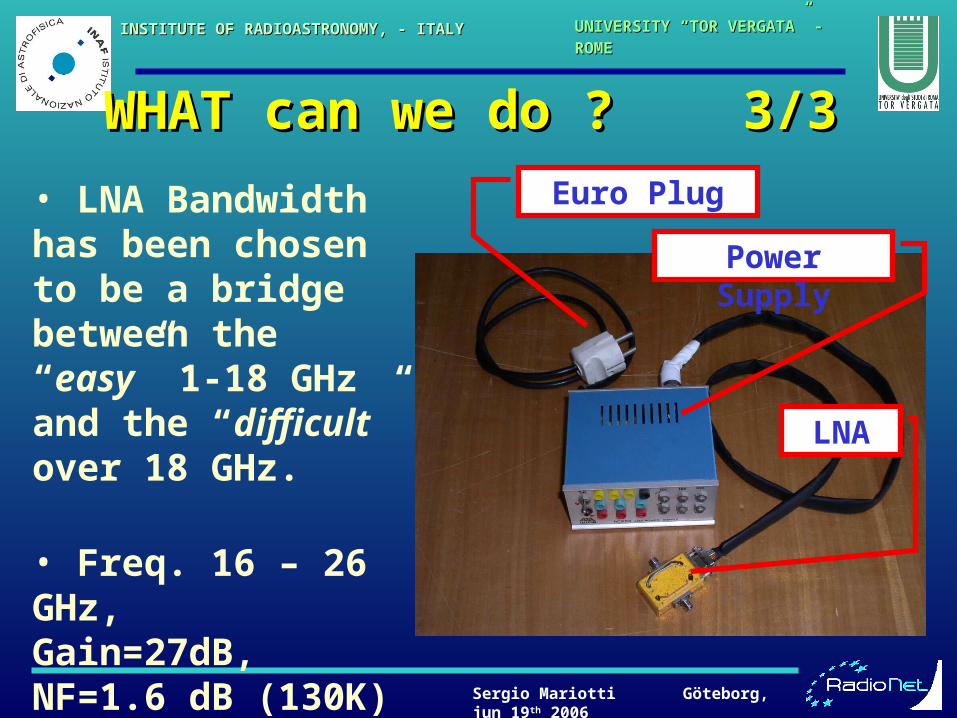
WHAT can we do ? 3/3WHAT can we do ? 3/3
• LNA Bandwidth has been chosen to be a bridge between the “easy” 1-18 GHz and the “difficult”over 18 GHz.
• Freq. 16 – 26 GHz,Gain=27dB,NF=1.6 dB (130K)
LNA
Power Supply
Euro Plug
Sergio Mariotti Göteborg, jun 19th 2006
INSTITUTE OF RADIOASTRONOMY, - ITALYINSTITUTE OF RADIOASTRONOMY, - ITALY UNIVERSITY “TOR VERGATA” - ROMEUNIVERSITY “TOR VERGATA” - ROME
Essential BibliographyEssential Bibliography• [1] J. Randa, “Noise Temperature Measurements on wafer ” NIST Tech. Note 1390 03/1997
• [2] Agilent Technologies, “Noise Figure measurement accuracy – The Y-Factor method”, Application Note 57-2, 2001.
•[3] W.C. Daywitt, “Radiometer equation and analysis of systematic errors for the NIST automated radiometers”, National Institute of Standards and Technology, Technical Note 1327, 03/1989.
•[4] C.T. Stelzried, “Temperature calibration of microwave thermal noise sources”, IEEE Transactions on Microwave Theory and Techniques (Correspondence), Vol. MTT-13, No. 1, 01/1965, pp. 128-130.
•[5] R.F. Bauer, P. Penfield, “De-Embedding and Unterminating”, IEEE Transactions on Microwave Theory and Techniques, Vol. 22, No. 3, 03/1974, pp. 282-288.
• [6] J.D. Gallego, “Accuracy of Noise Temperature Measurement of Cryogenic Amplifiers”, - NRAO Int. Rep. No 285 jan. 1990.
Sergio Mariotti Göteborg, jun 19th 2006
INSTITUTE OF RADIOASTRONOMY, - ITALYINSTITUTE OF RADIOASTRONOMY, - ITALY UNIVERSITY “TOR VERGATA” - ROMEUNIVERSITY “TOR VERGATA” - ROME
ConclusionsConclusions• The ENR of some Noise Sources has been calibrated.
• The Uncertainty related to ENR has been reduced from +/-0.15 dB typ to
+/- 0.06 dB typ
•The calibration routine and the instrumental set-up may be repeated once again.
•Waveguide, millimeter cryoloads are needed to improve reliability

Sergio Mariotti Göteborg, jun 19th 2006
INSTITUTE OF RADIOASTRONOMY, - ITALYINSTITUTE OF RADIOASTRONOMY, - ITALY UNIVERSITY “TOR VERGATA” - ROMEUNIVERSITY “TOR VERGATA” - ROME
ThanksThanks