serbia - food and agriculture organization · omladinskih brigada 1; belgrade...
TRANSCRIPT
Serbia
GLOBAL FOREST RESOURCES ASSESSMENT 2015
COUNTRY REPORT
Rome, 2014

FAO, at the request of its member countries, regularly monitors the world´s forests and theirmanagement and uses through the Global Forest Resources Assessment (FRA). This country reportis prepared as a contribution to the FAO publication, the Global Forest Resources Assessment 2015(FRA 2015).The content and the structure are in accordance with the recommendations and guidelines given byFAO in the document Guide for country reporting for FRA 2015 (http://www.fao.org/3/a-au190e.pdf).These reports were submitted to FAO as official government documents.
The content and the views expressed in this report are the responsibility of the entity submitting thereport to FAO. FAO may not be held responsible for the use which may be made of the informationcontained in this report.
FRA 2015 – Country Report, Serbia
3
TABLE OF CONTENTSReport preparation and contact persons...............................................................................................................................41. What is the area of forest and other wooded land and how has it changed over time? ................................................. 62. What is the area of natural and planted forest and how has it changed over time? ..................................................... 143. What are the stocks and growth rates of the forests and how have they changed? .....................................................194. What is the status of forest production and how has it changed over time? .................................................................295. How much forest area is managed for protection of soil and water and ecosystem services? ..................................... 376. How much forest area is protected and designated for the conservation of biodiversity and how has it changed overtime? ................................................................................................................................................................................... 437. What is the area of forest affected by woody invasive species? .................................................................................. 468. How much forest area is damaged each year? ............................................................................................................ 499. What is the forest area with reduced canopy cover? ....................................................................................................5510. What forest policy and regulatory framework exists to support implementation of sustainable forest managementSFM? .................................................................................................................................................................................. 5611. Is there a national platform that promotes stakeholder participation in forest policy development? ............................ 5812. What is the forest area intended to be in permanent forest land use and how has it changed over time? .................. 5913. How does your country measure and report progress towards SFM at the national level? ........................................ 6214. What is the area of forest under a forest management plan and how is this monitored? ........................................... 6515. How are stakeholders involved in the management decision making for publicly owned forests? .............................. 6716. What is the area of forest under an independently verified forest certification scheme? .............................................6917. How much money do governments collect from and spend on forests? .....................................................................7118. Who owns and manages the forests and how has this changed? ..............................................................................7319. How many people are directly employed in forestry? ................................................................................................. 7920. What is the contribution of forestry to Gross Domestic Product (GDP)? .................................................................... 8221. What is forest area likely to be in the future ...............................................................................................................83
FRA 2015 – Country Report, Serbia
4
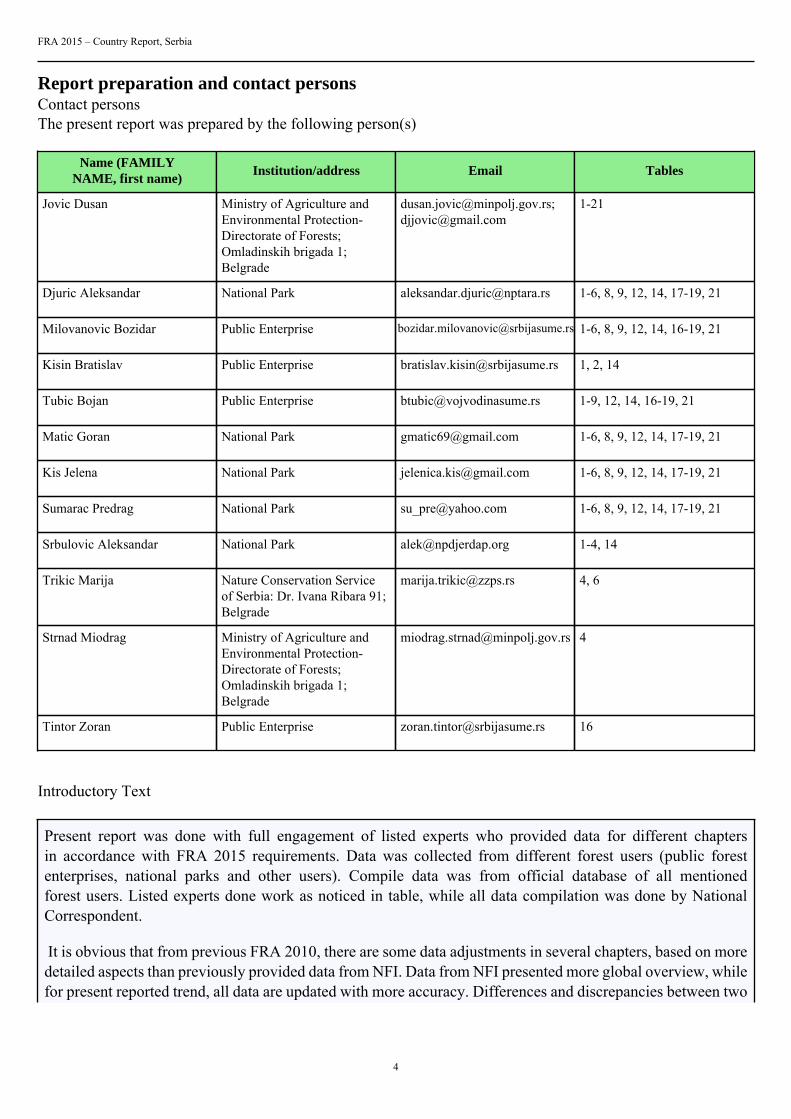
Report preparation and contact personsContact personsThe present report was prepared by the following person(s)
Name (FAMILYNAME, first name)
Institution/address Email Tables
Jovic Dusan Ministry of Agriculture andEnvironmental Protection-Directorate of Forests;Omladinskih brigada 1;Belgrade
[email protected];[email protected]
1-21
Djuric Aleksandar National Park [email protected] 1-6, 8, 9, 12, 14, 17-19, 21
Milovanovic Bozidar Public Enterprise [email protected] 1-6, 8, 9, 12, 14, 16-19, 21
Kisin Bratislav Public Enterprise [email protected] 1, 2, 14
Tubic Bojan Public Enterprise [email protected] 1-9, 12, 14, 16-19, 21
Matic Goran National Park [email protected] 1-6, 8, 9, 12, 14, 17-19, 21
Kis Jelena National Park [email protected] 1-6, 8, 9, 12, 14, 17-19, 21
Sumarac Predrag National Park [email protected] 1-6, 8, 9, 12, 14, 17-19, 21
Srbulovic Aleksandar National Park [email protected] 1-4, 14
Trikic Marija Nature Conservation Serviceof Serbia: Dr. Ivana Ribara 91;Belgrade
[email protected] 4, 6
Strnad Miodrag Ministry of Agriculture andEnvironmental Protection-Directorate of Forests;Omladinskih brigada 1;Belgrade
Tintor Zoran Public Enterprise [email protected] 16
Introductory Text
Present report was done with full engagement of listed experts who provided data for different chaptersin accordance with FRA 2015 requirements. Data was collected from different forest users (public forestenterprises, national parks and other users). Compile data was from official database of all mentionedforest users. Listed experts done work as noticed in table, while all data compilation was done by NationalCorrespondent.
It is obvious that from previous FRA 2010, there are some data adjustments in several chapters, based on moredetailed aspects than previously provided data from NFI. Data from NFI presented more global overview, whilefor present reported trend, all data are updated with more accuracy. Differences and discrepancies between two
FRA 2015 – Country Report, Serbia
5
reported trends (2010 and 2015), are result of data updating based mainly on forest users forest managementplans and field reports, which are with more precision and exactness.
Desk Study?
Check "yes" if this survey is a Desk Study, "no" otherwise
Desk Study? no
FRA 2015 – Country Report, Serbia
6
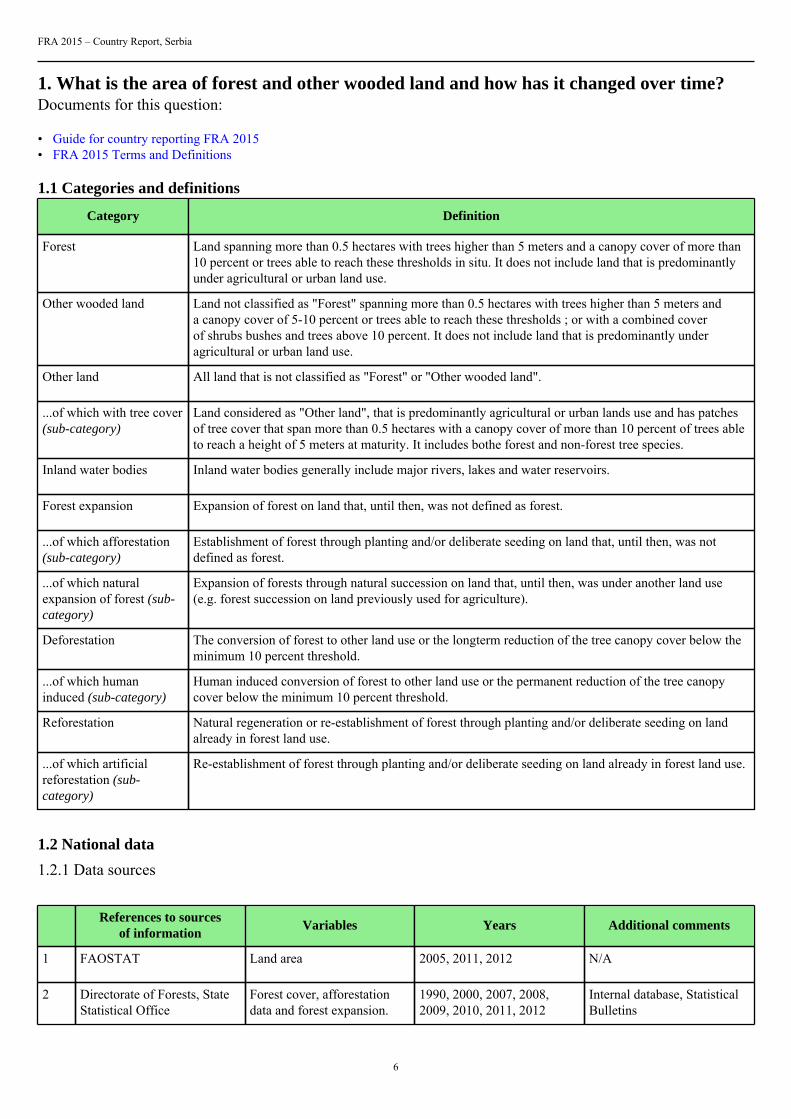
1. What is the area of forest and other wooded land and how has it changed over time?Documents for this question:
• Guide for country reporting FRA 2015• FRA 2015 Terms and Definitions
1.1 Categories and definitions
Category Definition
Forest Land spanning more than 0.5 hectares with trees higher than 5 meters and a canopy cover of more than10 percent or trees able to reach these thresholds in situ. It does not include land that is predominantlyunder agricultural or urban land use.
Other wooded land Land not classified as "Forest" spanning more than 0.5 hectares with trees higher than 5 meters anda canopy cover of 5-10 percent or trees able to reach these thresholds ; or with a combined coverof shrubs bushes and trees above 10 percent. It does not include land that is predominantly underagricultural or urban land use.
Other land All land that is not classified as "Forest" or "Other wooded land".
...of which with tree cover(sub-category)
Land considered as "Other land", that is predominantly agricultural or urban lands use and has patchesof tree cover that span more than 0.5 hectares with a canopy cover of more than 10 percent of trees ableto reach a height of 5 meters at maturity. It includes bothe forest and non-forest tree species.
Inland water bodies Inland water bodies generally include major rivers, lakes and water reservoirs.
Forest expansion Expansion of forest on land that, until then, was not defined as forest.
...of which afforestation(sub-category)
Establishment of forest through planting and/or deliberate seeding on land that, until then, was notdefined as forest.
...of which naturalexpansion of forest (sub-category)
Expansion of forests through natural succession on land that, until then, was under another land use(e.g. forest succession on land previously used for agriculture).
Deforestation The conversion of forest to other land use or the longterm reduction of the tree canopy cover below theminimum 10 percent threshold.
...of which humaninduced (sub-category)
Human induced conversion of forest to other land use or the permanent reduction of the tree canopycover below the minimum 10 percent threshold.
Reforestation Natural regeneration or re-establishment of forest through planting and/or deliberate seeding on landalready in forest land use.
...of which artificialreforestation (sub-category)
Re-establishment of forest through planting and/or deliberate seeding on land already in forest land use.
1.2 National data
1.2.1 Data sources
References to sourcesof information
Variables Years Additional comments
1 FAOSTAT Land area 2005, 2011, 2012 N/A
2 Directorate of Forests, StateStatistical Office
Forest cover, afforestationdata and forest expansion.
1990, 2000, 2007, 2008,2009, 2010, 2011, 2012
Internal database, StatisticalBulletins
FRA 2015 – Country Report, Serbia
7
3 Public Enterprises, NationalParks and other forest users.
Forest cover, afforestationdata, forest expansion.
2008, 2010, 2012 Official data of two PEs andadditional data from NationalParks and other users.
4 National Forest Inventory Forest cover, forest origin,afforestation data and forestexpansion.
2008 N/A
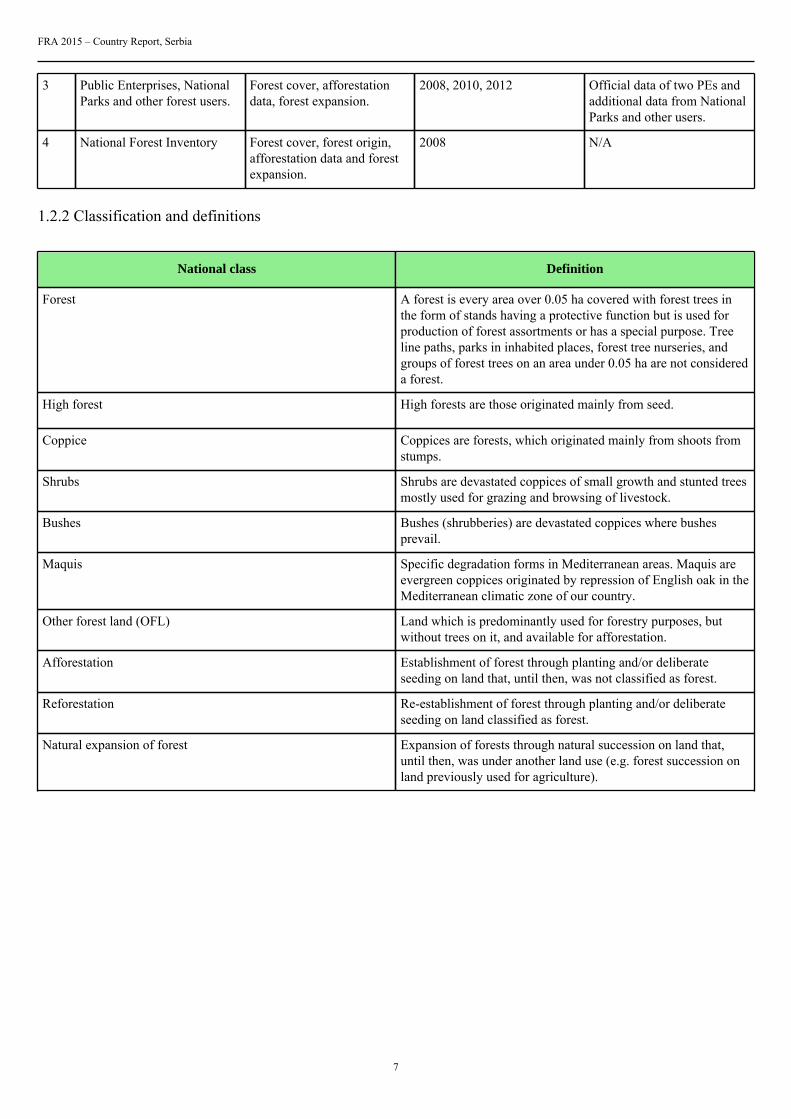
1.2.2 Classification and definitions
National class Definition
Forest A forest is every area over 0.05 ha covered with forest trees inthe form of stands having a protective function but is used forproduction of forest assortments or has a special purpose. Treeline paths, parks in inhabited places, forest tree nurseries, andgroups of forest trees on an area under 0.05 ha are not considereda forest.
High forest High forests are those originated mainly from seed.
Coppice Coppices are forests, which originated mainly from shoots fromstumps.
Shrubs Shrubs are devastated coppices of small growth and stunted treesmostly used for grazing and browsing of livestock.
Bushes Bushes (shrubberies) are devastated coppices where bushesprevail.
Maquis Specific degradation forms in Mediterranean areas. Maquis areevergreen coppices originated by repression of English oak in theMediterranean climatic zone of our country.
Other forest land (OFL) Land which is predominantly used for forestry purposes, butwithout trees on it, and available for afforestation.
Afforestation Establishment of forest through planting and/or deliberateseeding on land that, until then, was not classified as forest.
Reforestation Re-establishment of forest through planting and/or deliberateseeding on land classified as forest.
Natural expansion of forest Expansion of forests through natural succession on land that,until then, was under another land use (e.g. forest succession onland previously used for agriculture).
FRA 2015 – Country Report, Serbia
8
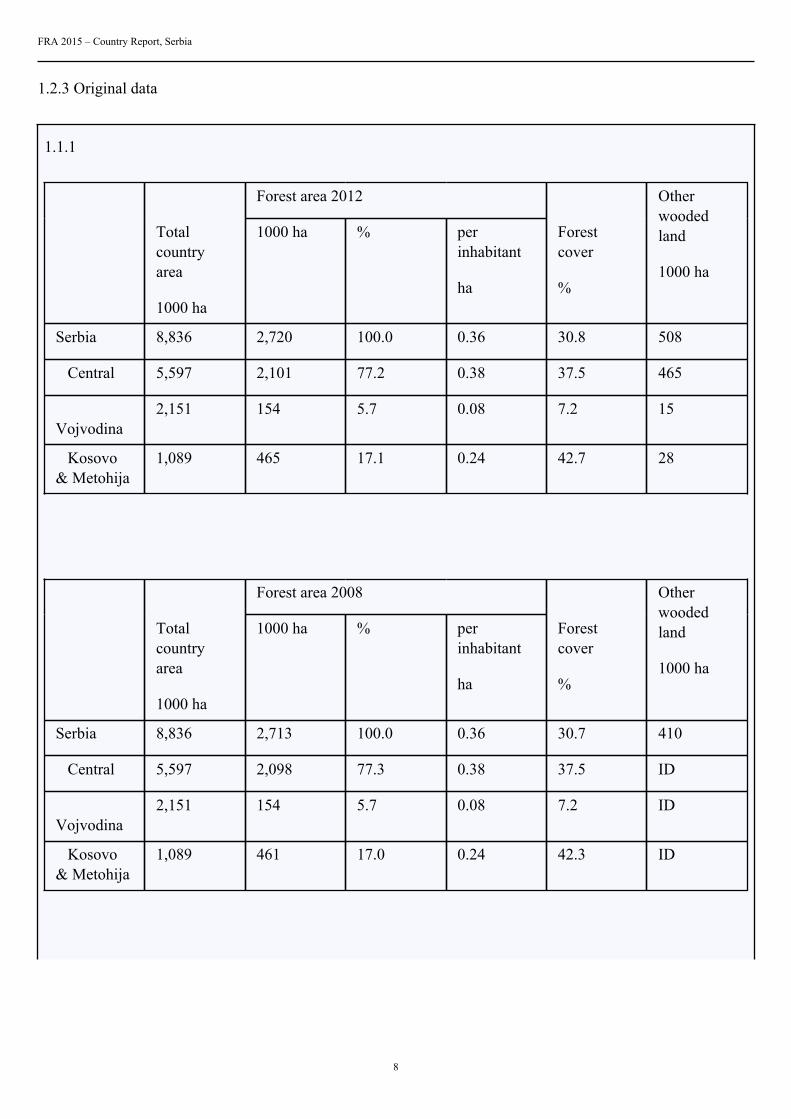
1.2.3 Original data
1.1.1
Forest area 2012
Totalcountryarea
1000 ha
1000 ha % perinhabitant
ha
Forestcover
%
Otherwoodedland
1000 ha
Serbia 8,836 2,720 100.0 0.36 30.8 508
Central 5,597 2,101 77.2 0.38 37.5 465
Vojvodina
2,151 154 5.7 0.08 7.2 15
Kosovo& Metohija
1,089 465 17.1 0.24 42.7 28
Forest area 2008
Totalcountryarea
1000 ha
1000 ha % perinhabitant
ha
Forestcover
%
Otherwoodedland
1000 ha
Serbia 8,836 2,713 100.0 0.36 30.7 410
Central 5,597 2,098 77.3 0.38 37.5 ID
Vojvodina
2,151 154 5.7 0.08 7.2 ID
Kosovo& Metohija
1,089 461 17.0 0.24 42.3 ID
FRA 2015 – Country Report, Serbia
9
Forest area 2005
Totalcountryarea
1000 ha
1000 ha % perinhabitant
ha
Forestcover
%
Otherwoodedland
1000 ha
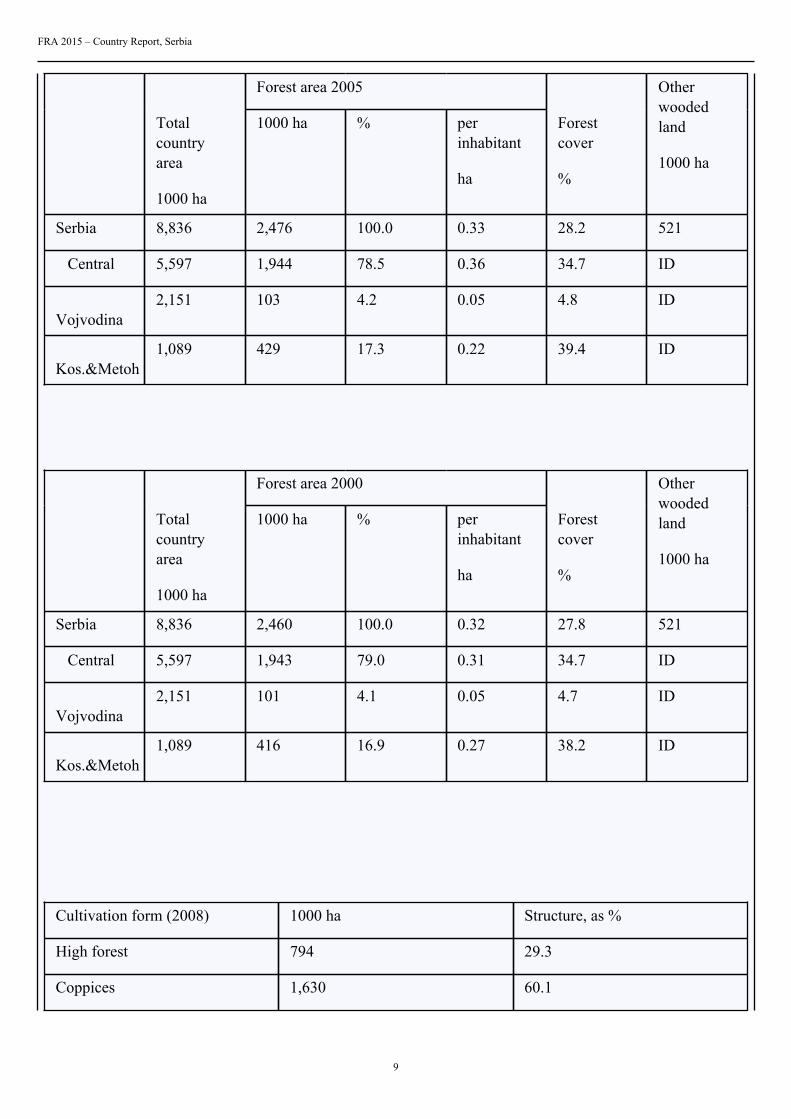
Serbia 8,836 2,476 100.0 0.33 28.2 521
Central 5,597 1,944 78.5 0.36 34.7 ID
Vojvodina
2,151 103 4.2 0.05 4.8 ID
Kos.&Metoh
1,089 429 17.3 0.22 39.4 ID
Forest area 2000
Totalcountryarea
1000 ha
1000 ha % perinhabitant
ha
Forestcover
%
Otherwoodedland
1000 ha
Serbia 8,836 2,460 100.0 0.32 27.8 521
Central 5,597 1,943 79.0 0.31 34.7 ID
Vojvodina
2,151 101 4.1 0.05 4.7 ID
Kos.&Metoh
1,089 416 16.9 0.27 38.2 ID
Cultivation form (2008) 1000 ha Structure, as %
High forest 794 29.3
Coppices 1,630 60.1
FRA 2015 – Country Report, Serbia
10
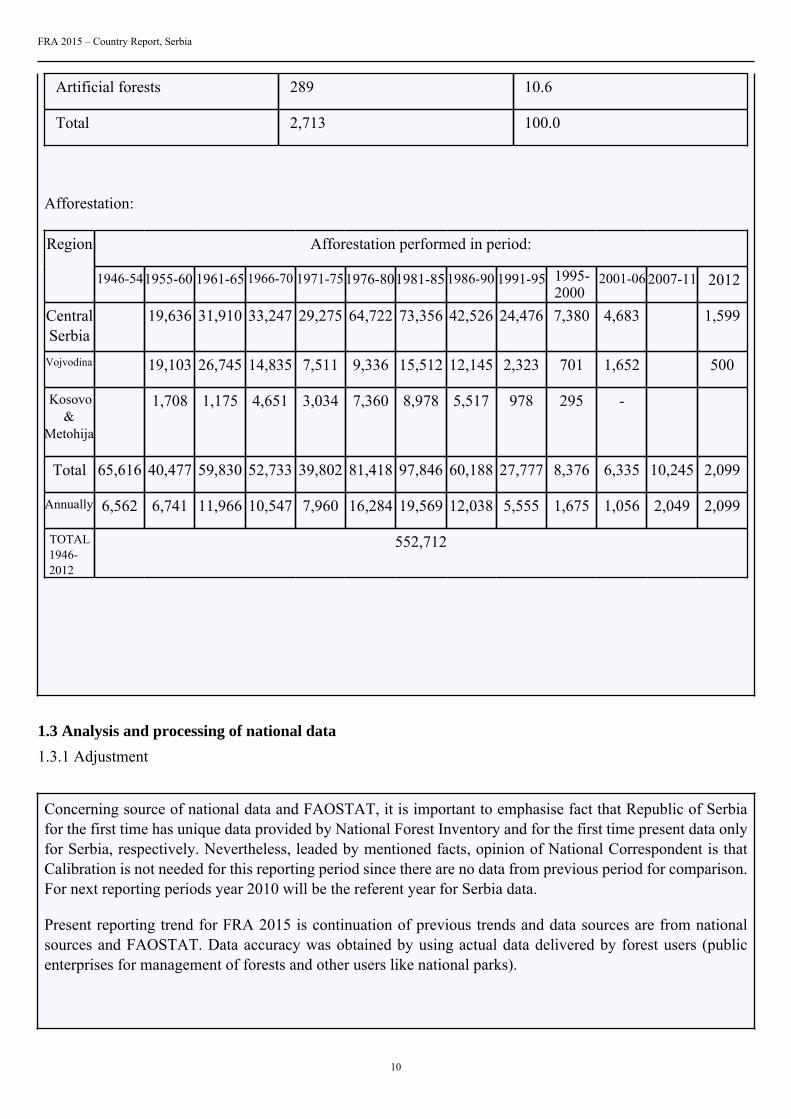
Artificial forests 289 10.6
Total 2,713 100.0
Afforestation:
Afforestation performed in period:Region
1946-541955-60 1961-65 1966-70 1971-751976-801981-85 1986-90 1991-95 1995-2000
2001-06 2007-11 2012
CentralSerbia
19,636 31,910 33,247 29,275 64,722 73,356 42,526 24,476 7,380 4,683 1,599
Vojvodina 19,103 26,745 14,835 7,511 9,336 15,512 12,145 2,323 701 1,652 500
Kosovo&
Metohija
1,708 1,175 4,651 3,034 7,360 8,978 5,517 978 295 -
Total 65,616 40,477 59,830 52,733 39,802 81,418 97,846 60,188 27,777 8,376 6,335 10,245 2,099
Annually 6,562 6,741 11,966 10,547 7,960 16,284 19,569 12,038 5,555 1,675 1,056 2,049 2,099
TOTAL 1946- 2012
552,712
1.3 Analysis and processing of national data
1.3.1 Adjustment
Concerning source of national data and FAOSTAT, it is important to emphasise fact that Republic of Serbiafor the first time has unique data provided by National Forest Inventory and for the first time present data onlyfor Serbia, respectively. Nevertheless, leaded by mentioned facts, opinion of National Correspondent is thatCalibration is not needed for this reporting period since there are no data from previous period for comparison.For next reporting periods year 2010 will be the referent year for Serbia data.
Present reporting trend for FRA 2015 is continuation of previous trends and data sources are from nationalsources and FAOSTAT. Data accuracy was obtained by using actual data delivered by forest users (publicenterprises for management of forests and other users like national parks).
FRA 2015 – Country Report, Serbia
11
1.3.2 Estimation and forecasting
1.3.3 Reclassification
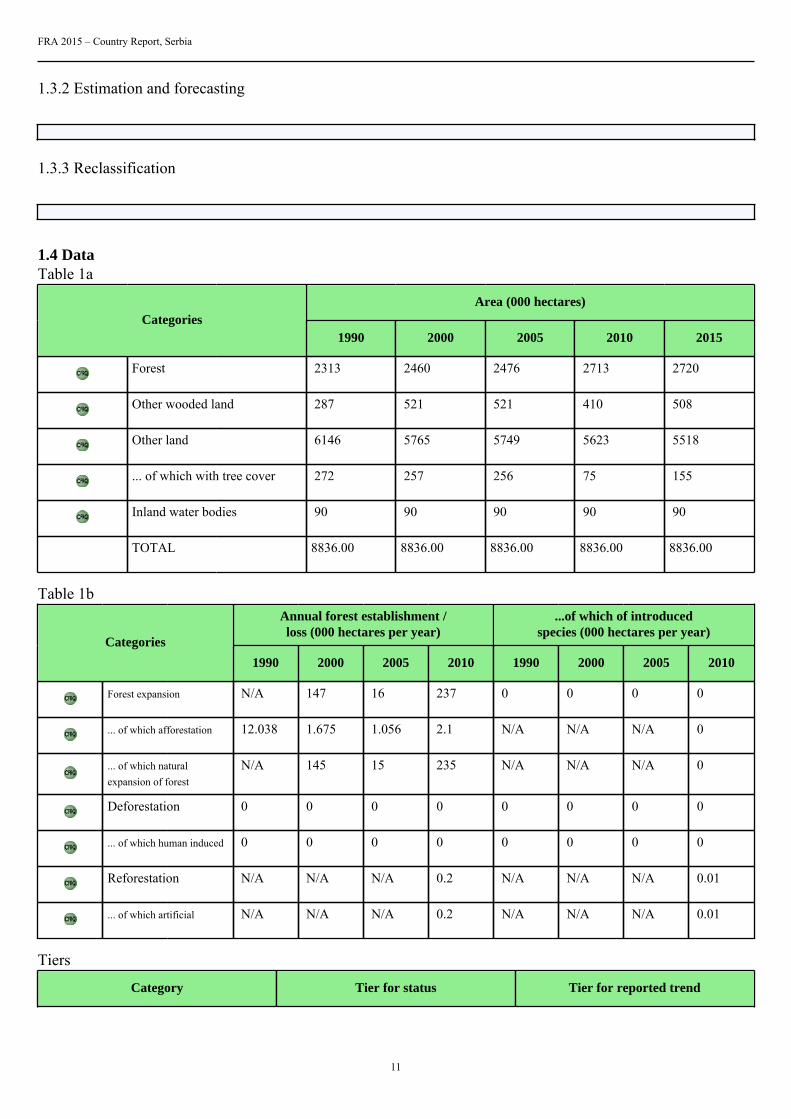
1.4 DataTable 1a
Area (000 hectares)Categories
1990 2000 2005 2010 2015
Forest 2313 2460 2476 2713 2720
Other wooded land 287 521 521 410 508
Other land 6146 5765 5749 5623 5518
... of which with tree cover 272 257 256 75 155
Inland water bodies 90 90 90 90 90
TOTAL 8836.00 8836.00 8836.00 8836.00 8836.00
Table 1bAnnual forest establishment /loss (000 hectares per year)
...of which of introducedspecies (000 hectares per year)
Categories
1990 2000 2005 2010 1990 2000 2005 2010
Forest expansion N/A 147 16 237 0 0 0 0
... of which afforestation 12.038 1.675 1.056 2.1 N/A N/A N/A 0
... of which naturalexpansion of forest
N/A 145 15 235 N/A N/A N/A 0
Deforestation 0 0 0 0 0 0 0 0
... of which human induced 0 0 0 0 0 0 0 0
Reforestation N/A N/A N/A 0.2 N/A N/A N/A 0.01
... of which artificial N/A N/A N/A 0.2 N/A N/A N/A 0.01
Tiers
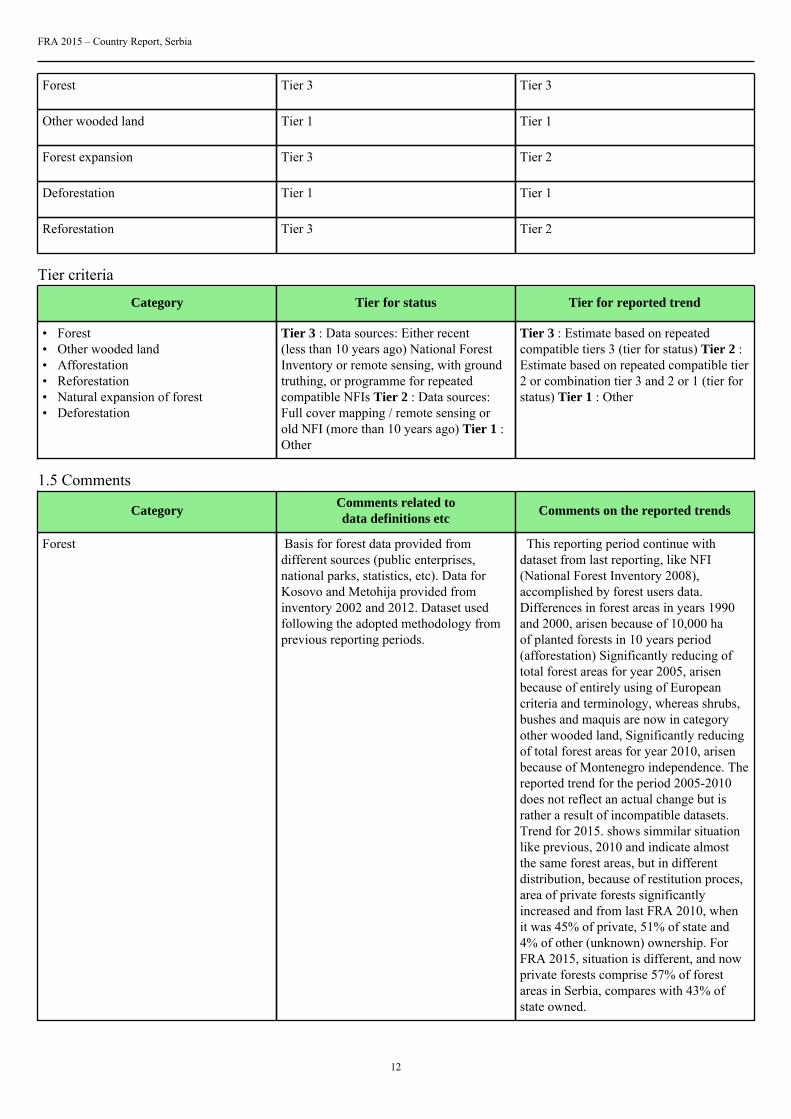
Category Tier for status Tier for reported trend
FRA 2015 – Country Report, Serbia
12
Forest Tier 3 Tier 3
Other wooded land Tier 1 Tier 1
Forest expansion Tier 3 Tier 2
Deforestation Tier 1 Tier 1
Reforestation Tier 3 Tier 2
Tier criteria
Category Tier for status Tier for reported trend
• Forest• Other wooded land• Afforestation• Reforestation• Natural expansion of forest• Deforestation
Tier 3 : Data sources: Either recent(less than 10 years ago) National ForestInventory or remote sensing, with groundtruthing, or programme for repeatedcompatible NFIs Tier 2 : Data sources:Full cover mapping / remote sensing orold NFI (more than 10 years ago) Tier 1 :Other
Tier 3 : Estimate based on repeatedcompatible tiers 3 (tier for status) Tier 2 :Estimate based on repeated compatible tier2 or combination tier 3 and 2 or 1 (tier forstatus) Tier 1 : Other
1.5 Comments
CategoryComments related todata definitions etc
Comments on the reported trends
Forest Basis for forest data provided fromdifferent sources (public enterprises,national parks, statistics, etc). Data forKosovo and Metohija provided frominventory 2002 and 2012. Dataset usedfollowing the adopted methodology fromprevious reporting periods.
This reporting period continue withdataset from last reporting, like NFI(National Forest Inventory 2008),accomplished by forest users data.Differences in forest areas in years 1990and 2000, arisen because of 10,000 haof planted forests in 10 years period(afforestation) Significantly reducing oftotal forest areas for year 2005, arisenbecause of entirely using of Europeancriteria and terminology, whereas shrubs,bushes and maquis are now in categoryother wooded land, Significantly reducingof total forest areas for year 2010, arisenbecause of Montenegro independence. Thereported trend for the period 2005-2010does not reflect an actual change but israther a result of incompatible datasets.Trend for 2015. shows simmilar situationlike previous, 2010 and indicate almostthe same forest areas, but in differentdistribution, because of restitution proces,area of private forests significantlyincreased and from last FRA 2010, whenit was 45% of private, 51% of state and4% of other (unknown) ownership. ForFRA 2015, situation is different, and nowprivate forests comprise 57% of forestareas in Serbia, compares with 43% ofstate owned.
FRA 2015 – Country Report, Serbia
13
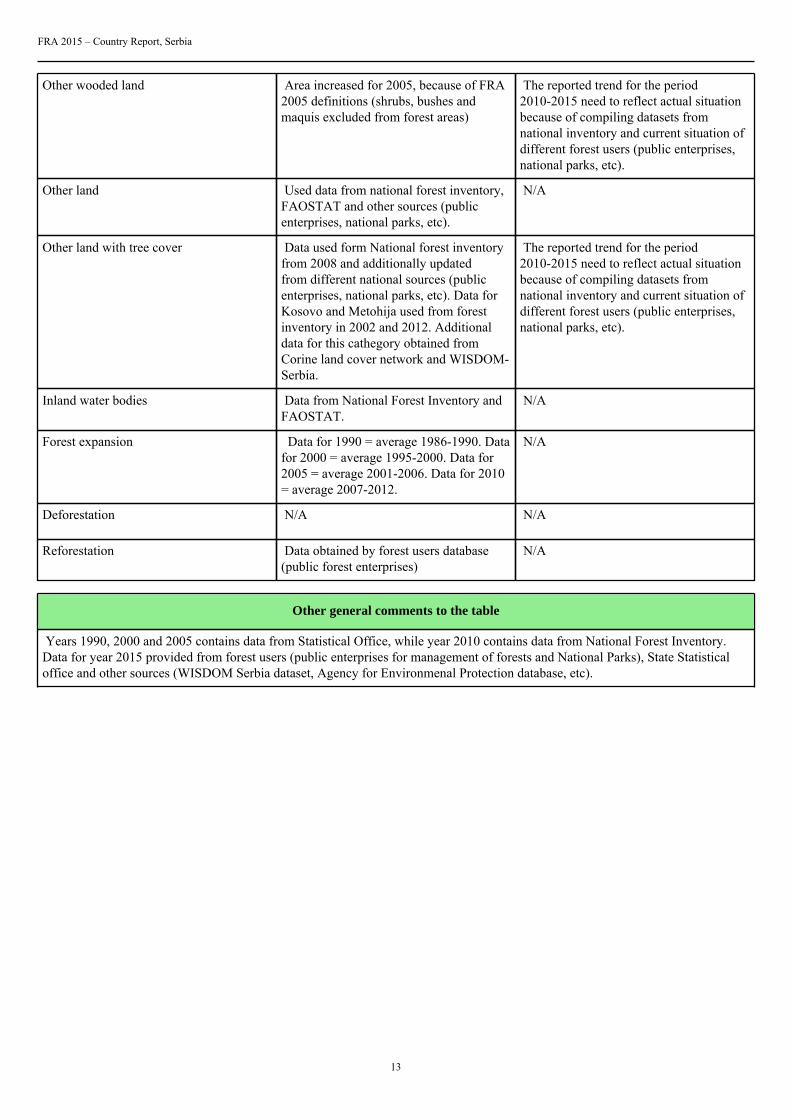
Other wooded land Area increased for 2005, because of FRA2005 definitions (shrubs, bushes andmaquis excluded from forest areas)
The reported trend for the period2010-2015 need to reflect actual situationbecause of compiling datasets fromnational inventory and current situation ofdifferent forest users (public enterprises,national parks, etc).
Other land Used data from national forest inventory,FAOSTAT and other sources (publicenterprises, national parks, etc).
N/A
Other land with tree cover Data used form National forest inventoryfrom 2008 and additionally updatedfrom different national sources (publicenterprises, national parks, etc). Data forKosovo and Metohija used from forestinventory in 2002 and 2012. Additionaldata for this cathegory obtained fromCorine land cover network and WISDOM-Serbia.
The reported trend for the period2010-2015 need to reflect actual situationbecause of compiling datasets fromnational inventory and current situation ofdifferent forest users (public enterprises,national parks, etc).
Inland water bodies Data from National Forest Inventory andFAOSTAT.
N/A
Forest expansion Data for 1990 = average 1986-1990. Datafor 2000 = average 1995-2000. Data for2005 = average 2001-2006. Data for 2010= average 2007-2012.
N/A
Deforestation N/A N/A
Reforestation Data obtained by forest users database(public forest enterprises)
N/A
Other general comments to the table
Years 1990, 2000 and 2005 contains data from Statistical Office, while year 2010 contains data from National Forest Inventory.Data for year 2015 provided from forest users (public enterprises for management of forests and National Parks), State Statisticaloffice and other sources (WISDOM Serbia dataset, Agency for Environmenal Protection database, etc).
FRA 2015 – Country Report, Serbia
14
2. What is the area of natural and planted forest and how has it changed over time?Documents for this question:
• Guide for country reporting FRA 2015• FRA 2015 Terms and Definitions
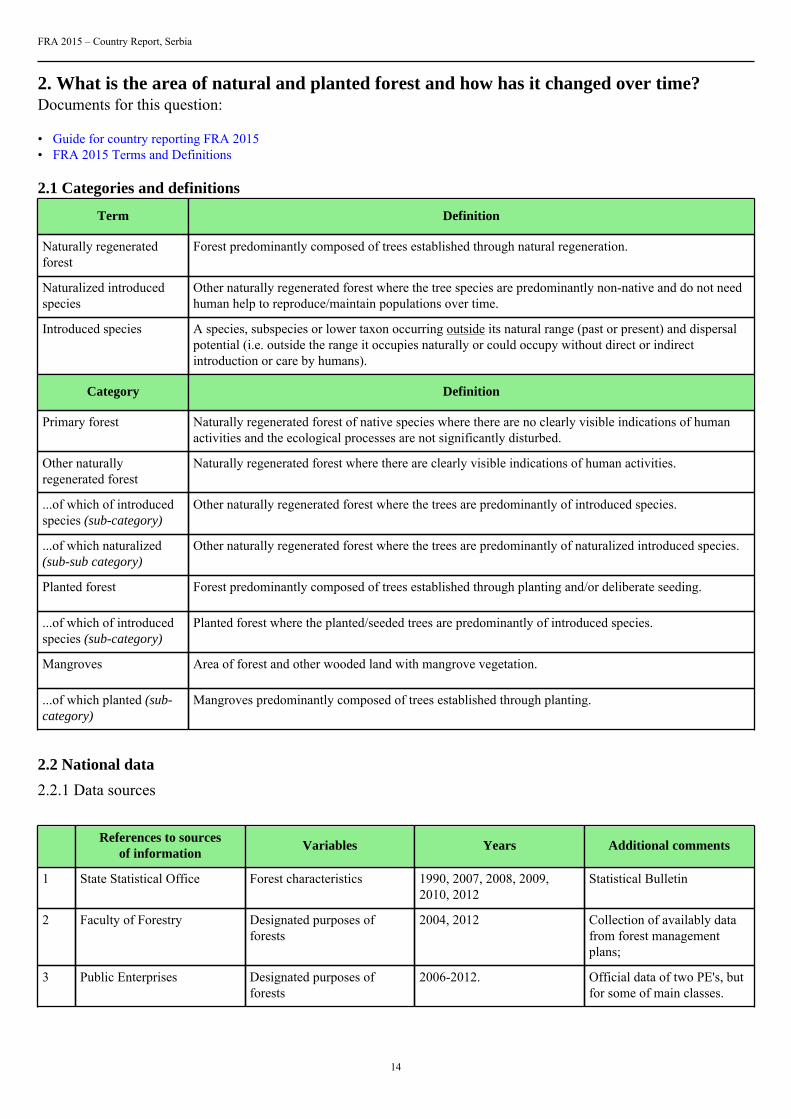
2.1 Categories and definitions
Term Definition
Naturally regeneratedforest
Forest predominantly composed of trees established through natural regeneration.
Naturalized introducedspecies
Other naturally regenerated forest where the tree species are predominantly non-native and do not needhuman help to reproduce/maintain populations over time.
Introduced species A species, subspecies or lower taxon occurring outside its natural range (past or present) and dispersalpotential (i.e. outside the range it occupies naturally or could occupy without direct or indirectintroduction or care by humans).
Category Definition
Primary forest Naturally regenerated forest of native species where there are no clearly visible indications of humanactivities and the ecological processes are not significantly disturbed.
Other naturallyregenerated forest
Naturally regenerated forest where there are clearly visible indications of human activities.
...of which of introducedspecies (sub-category)
Other naturally regenerated forest where the trees are predominantly of introduced species.
...of which naturalized(sub-sub category)
Other naturally regenerated forest where the trees are predominantly of naturalized introduced species.
Planted forest Forest predominantly composed of trees established through planting and/or deliberate seeding.
...of which of introducedspecies (sub-category)
Planted forest where the planted/seeded trees are predominantly of introduced species.
Mangroves Area of forest and other wooded land with mangrove vegetation.
...of which planted (sub-category)
Mangroves predominantly composed of trees established through planting.
2.2 National data
2.2.1 Data sources
References to sourcesof information
Variables Years Additional comments
1 State Statistical Office Forest characteristics 1990, 2007, 2008, 2009,2010, 2012
Statistical Bulletin
2 Faculty of Forestry Designated purposes offorests
2004, 2012 Collection of availably datafrom forest managementplans;
3 Public Enterprises Designated purposes offorests
2006-2012. Official data of two PE's, butfor some of main classes.
FRA 2015 – Country Report, Serbia
15
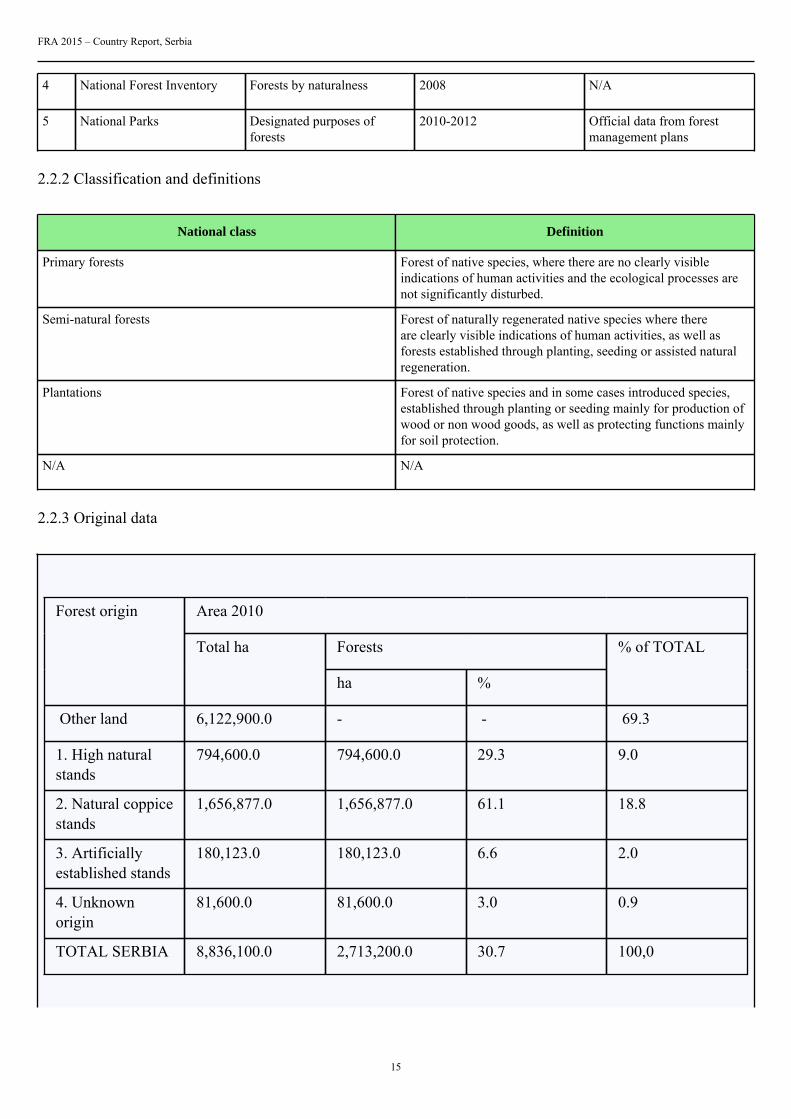
4 National Forest Inventory Forests by naturalness 2008 N/A
5 National Parks Designated purposes offorests
2010-2012 Official data from forestmanagement plans
2.2.2 Classification and definitions
National class Definition
Primary forests Forest of native species, where there are no clearly visibleindications of human activities and the ecological processes arenot significantly disturbed.
Semi-natural forests Forest of naturally regenerated native species where thereare clearly visible indications of human activities, as well asforests established through planting, seeding or assisted naturalregeneration.
Plantations Forest of native species and in some cases introduced species,established through planting or seeding mainly for production ofwood or non wood goods, as well as protecting functions mainlyfor soil protection.
N/A N/A
2.2.3 Original data
Area 2010
Forests
Forest origin
Total ha
ha %
% of TOTAL
Other land 6,122,900.0 - - 69.3
1. High naturalstands
794,600.0 794,600.0 29.3 9.0
2. Natural coppicestands
1,656,877.0 1,656,877.0 61.1 18.8
3. Artificiallyestablished stands
180,123.0 180,123.0 6.6 2.0
4. Unknownorigin
81,600.0 81,600.0 3.0 0.9
TOTAL SERBIA 8,836,100.0 2,713,200.0 30.7 100,0
FRA 2015 – Country Report, Serbia
16
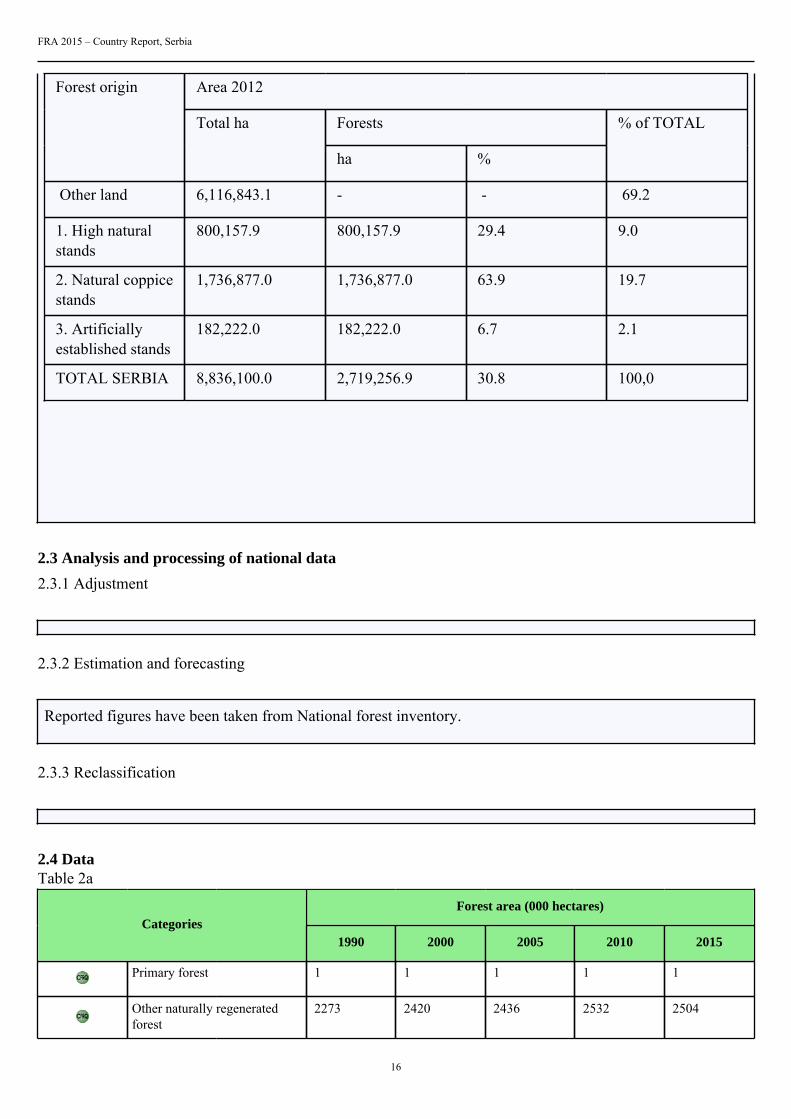
Area 2012
Forests
Forest origin
Total ha
ha %
% of TOTAL
Other land 6,116,843.1 - - 69.2
1. High naturalstands
800,157.9 800,157.9 29.4 9.0
2. Natural coppicestands
1,736,877.0 1,736,877.0 63.9 19.7
3. Artificiallyestablished stands
182,222.0 182,222.0 6.7 2.1
TOTAL SERBIA 8,836,100.0 2,719,256.9 30.8 100,0
2.3 Analysis and processing of national data
2.3.1 Adjustment
2.3.2 Estimation and forecasting
Reported figures have been taken from National forest inventory.
2.3.3 Reclassification
2.4 DataTable 2a
Forest area (000 hectares)Categories
1990 2000 2005 2010 2015
Primary forest 1 1 1 1 1
Other naturally regeneratedforest
2273 2420 2436 2532 2504
FRA 2015 – Country Report, Serbia
17
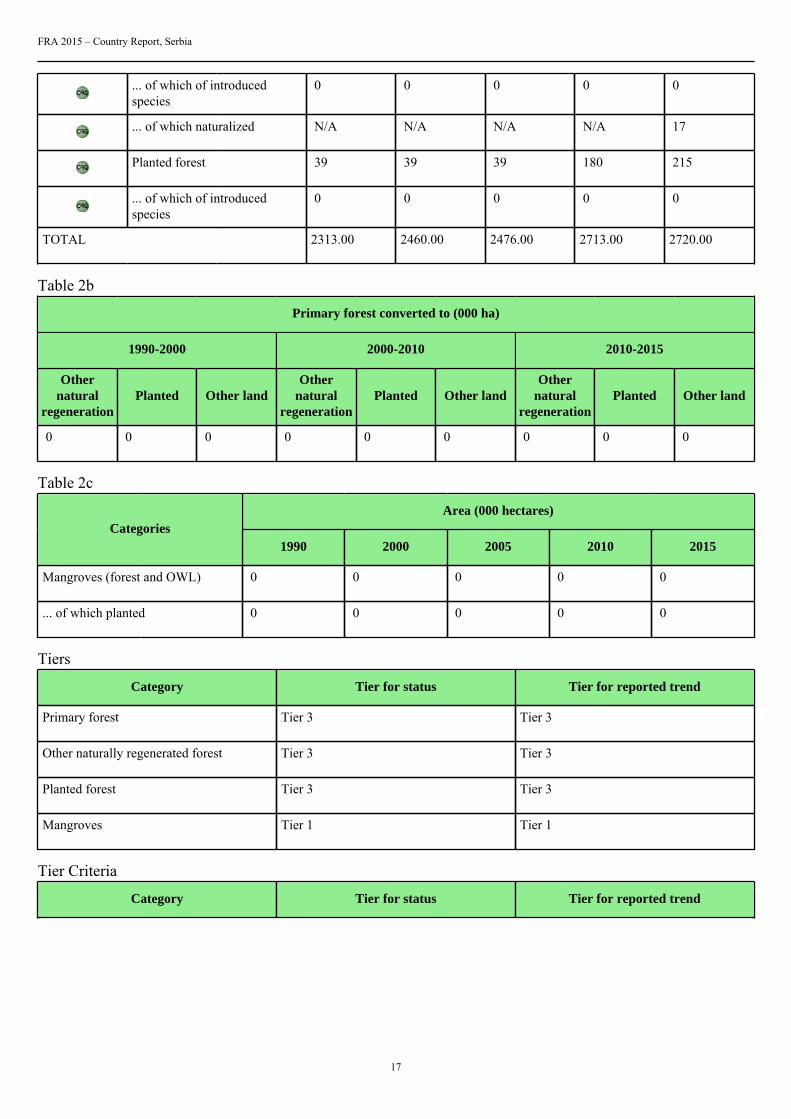
... of which of introducedspecies
0 0 0 0 0
... of which naturalized N/A N/A N/A N/A 17
Planted forest 39 39 39 180 215
... of which of introducedspecies
0 0 0 0 0
TOTAL 2313.00 2460.00 2476.00 2713.00 2720.00
Table 2b
Primary forest converted to (000 ha)
1990-2000 2000-2010 2010-2015
Othernatural
regenerationPlanted Other land
Othernatural
regenerationPlanted Other land
Othernatural
regenerationPlanted Other land
0 0 0 0 0 0 0 0 0
Table 2c
Area (000 hectares)Categories
1990 2000 2005 2010 2015
Mangroves (forest and OWL) 0 0 0 0 0
... of which planted 0 0 0 0 0
Tiers
Category Tier for status Tier for reported trend
Primary forest Tier 3 Tier 3
Other naturally regenerated forest Tier 3 Tier 3
Planted forest Tier 3 Tier 3
Mangroves Tier 1 Tier 1
Tier Criteria
Category Tier for status Tier for reported trend
FRA 2015 – Country Report, Serbia
18
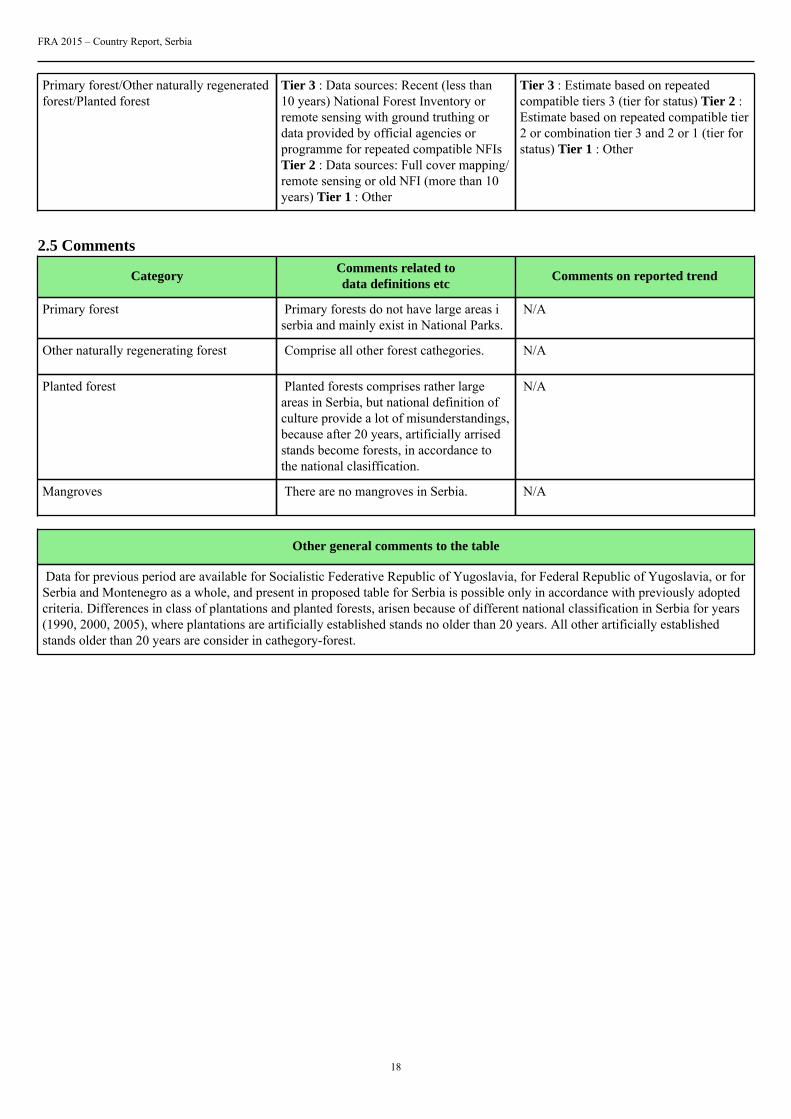
Primary forest/Other naturally regeneratedforest/Planted forest
Tier 3 : Data sources: Recent (less than10 years) National Forest Inventory orremote sensing with ground truthing ordata provided by official agencies orprogramme for repeated compatible NFIsTier 2 : Data sources: Full cover mapping/remote sensing or old NFI (more than 10years) Tier 1 : Other
Tier 3 : Estimate based on repeatedcompatible tiers 3 (tier for status) Tier 2 :Estimate based on repeated compatible tier2 or combination tier 3 and 2 or 1 (tier forstatus) Tier 1 : Other
2.5 Comments
CategoryComments related todata definitions etc
Comments on reported trend
Primary forest Primary forests do not have large areas iserbia and mainly exist in National Parks.
N/A
Other naturally regenerating forest Comprise all other forest cathegories. N/A
Planted forest Planted forests comprises rather largeareas in Serbia, but national definition ofculture provide a lot of misunderstandings,because after 20 years, artificially arrisedstands become forests, in accordance tothe national clasiffication.
N/A
Mangroves There are no mangroves in Serbia. N/A
Other general comments to the table
Data for previous period are available for Socialistic Federative Republic of Yugoslavia, for Federal Republic of Yugoslavia, or forSerbia and Montenegro as a whole, and present in proposed table for Serbia is possible only in accordance with previously adoptedcriteria. Differences in class of plantations and planted forests, arisen because of different national classification in Serbia for years(1990, 2000, 2005), where plantations are artificially established stands no older than 20 years. All other artificially establishedstands older than 20 years are consider in cathegory-forest.
FRA 2015 – Country Report, Serbia
19
3. What are the stocks and growth rates of the forests and how have they changed?Documents for this question:
• Guide for country reporting FRA 2015• FRA 2015 Terms and Definitions
3.1 Categories and definitions
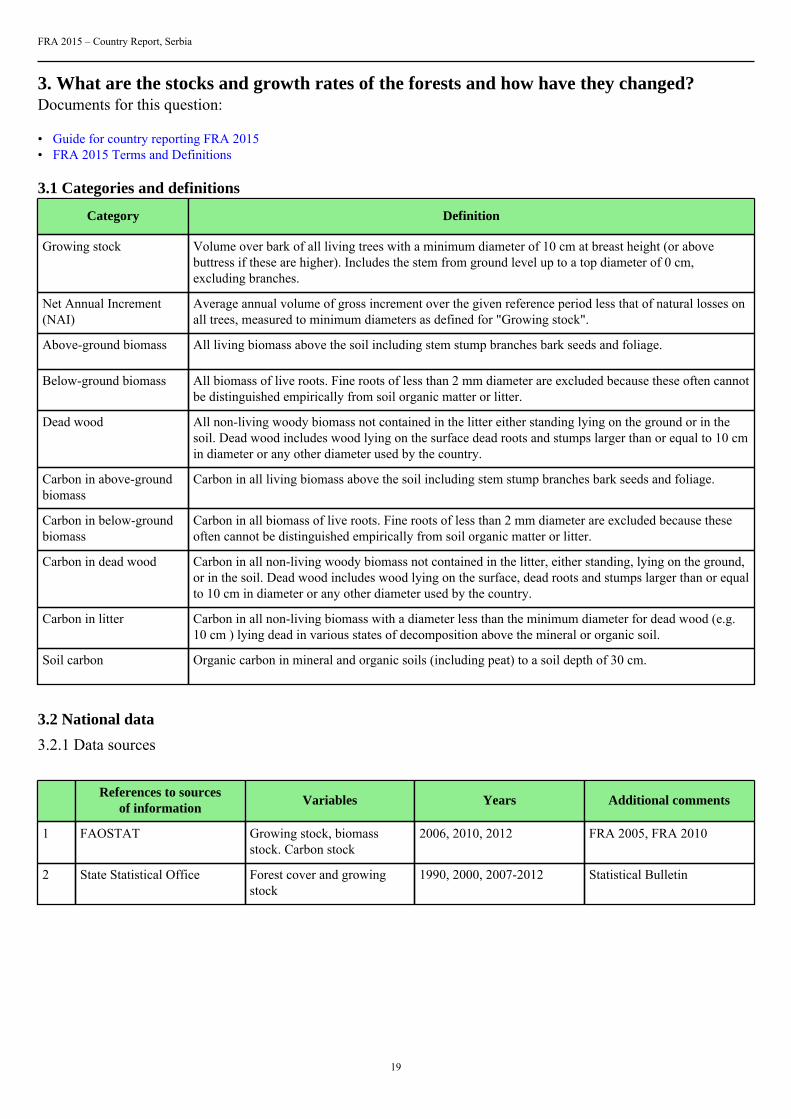
Category Definition
Growing stock Volume over bark of all living trees with a minimum diameter of 10 cm at breast height (or abovebuttress if these are higher). Includes the stem from ground level up to a top diameter of 0 cm,excluding branches.
Net Annual Increment(NAI)
Average annual volume of gross increment over the given reference period less that of natural losses onall trees, measured to minimum diameters as defined for "Growing stock".
Above-ground biomass All living biomass above the soil including stem stump branches bark seeds and foliage.
Below-ground biomass All biomass of live roots. Fine roots of less than 2 mm diameter are excluded because these often cannotbe distinguished empirically from soil organic matter or litter.
Dead wood All non-living woody biomass not contained in the litter either standing lying on the ground or in thesoil. Dead wood includes wood lying on the surface dead roots and stumps larger than or equal to 10 cmin diameter or any other diameter used by the country.
Carbon in above-groundbiomass
Carbon in all living biomass above the soil including stem stump branches bark seeds and foliage.
Carbon in below-groundbiomass
Carbon in all biomass of live roots. Fine roots of less than 2 mm diameter are excluded because theseoften cannot be distinguished empirically from soil organic matter or litter.
Carbon in dead wood Carbon in all non-living woody biomass not contained in the litter, either standing, lying on the ground,or in the soil. Dead wood includes wood lying on the surface, dead roots and stumps larger than or equalto 10 cm in diameter or any other diameter used by the country.
Carbon in litter Carbon in all non-living biomass with a diameter less than the minimum diameter for dead wood (e.g.10 cm ) lying dead in various states of decomposition above the mineral or organic soil.
Soil carbon Organic carbon in mineral and organic soils (including peat) to a soil depth of 30 cm.
3.2 National data
3.2.1 Data sources
References to sourcesof information
Variables Years Additional comments
1 FAOSTAT Growing stock, biomassstock. Carbon stock
2006, 2010, 2012 FRA 2005, FRA 2010
2 State Statistical Office Forest cover and growingstock
1990, 2000, 2007-2012 Statistical Bulletin
FRA 2015 – Country Report, Serbia
20
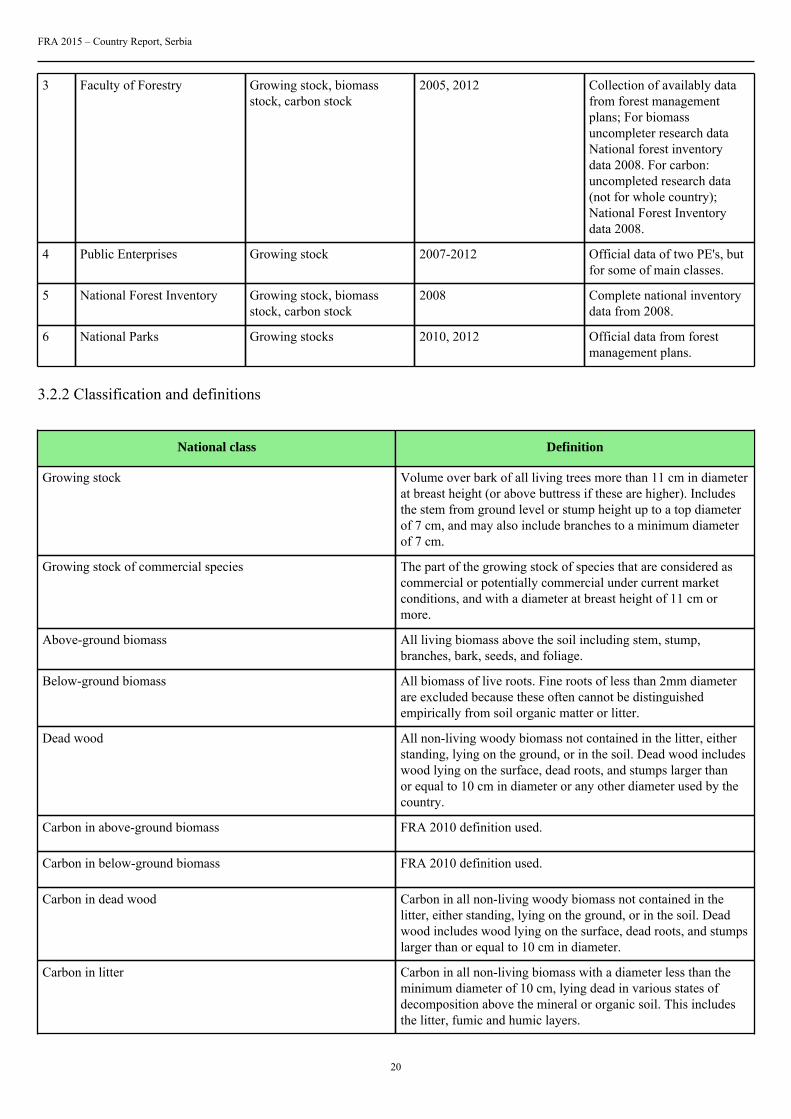
3 Faculty of Forestry Growing stock, biomassstock, carbon stock
2005, 2012 Collection of availably datafrom forest managementplans; For biomassuncompleter research dataNational forest inventorydata 2008. For carbon:uncompleted research data(not for whole country);National Forest Inventorydata 2008.
4 Public Enterprises Growing stock 2007-2012 Official data of two PE's, butfor some of main classes.
5 National Forest Inventory Growing stock, biomassstock, carbon stock
2008 Complete national inventorydata from 2008.
6 National Parks Growing stocks 2010, 2012 Official data from forestmanagement plans.
3.2.2 Classification and definitions
National class Definition
Growing stock Volume over bark of all living trees more than 11 cm in diameterat breast height (or above buttress if these are higher). Includesthe stem from ground level or stump height up to a top diameterof 7 cm, and may also include branches to a minimum diameterof 7 cm.
Growing stock of commercial species The part of the growing stock of species that are considered ascommercial or potentially commercial under current marketconditions, and with a diameter at breast height of 11 cm ormore.
Above-ground biomass All living biomass above the soil including stem, stump,branches, bark, seeds, and foliage.
Below-ground biomass All biomass of live roots. Fine roots of less than 2mm diameterare excluded because these often cannot be distinguishedempirically from soil organic matter or litter.
Dead wood All non-living woody biomass not contained in the litter, eitherstanding, lying on the ground, or in the soil. Dead wood includeswood lying on the surface, dead roots, and stumps larger thanor equal to 10 cm in diameter or any other diameter used by thecountry.
Carbon in above-ground biomass FRA 2010 definition used.
Carbon in below-ground biomass FRA 2010 definition used.
Carbon in dead wood Carbon in all non-living woody biomass not contained in thelitter, either standing, lying on the ground, or in the soil. Deadwood includes wood lying on the surface, dead roots, and stumpslarger than or equal to 10 cm in diameter.
Carbon in litter Carbon in all non-living biomass with a diameter less than theminimum diameter of 10 cm, lying dead in various states ofdecomposition above the mineral or organic soil. This includesthe litter, fumic and humic layers.
FRA 2015 – Country Report, Serbia
21
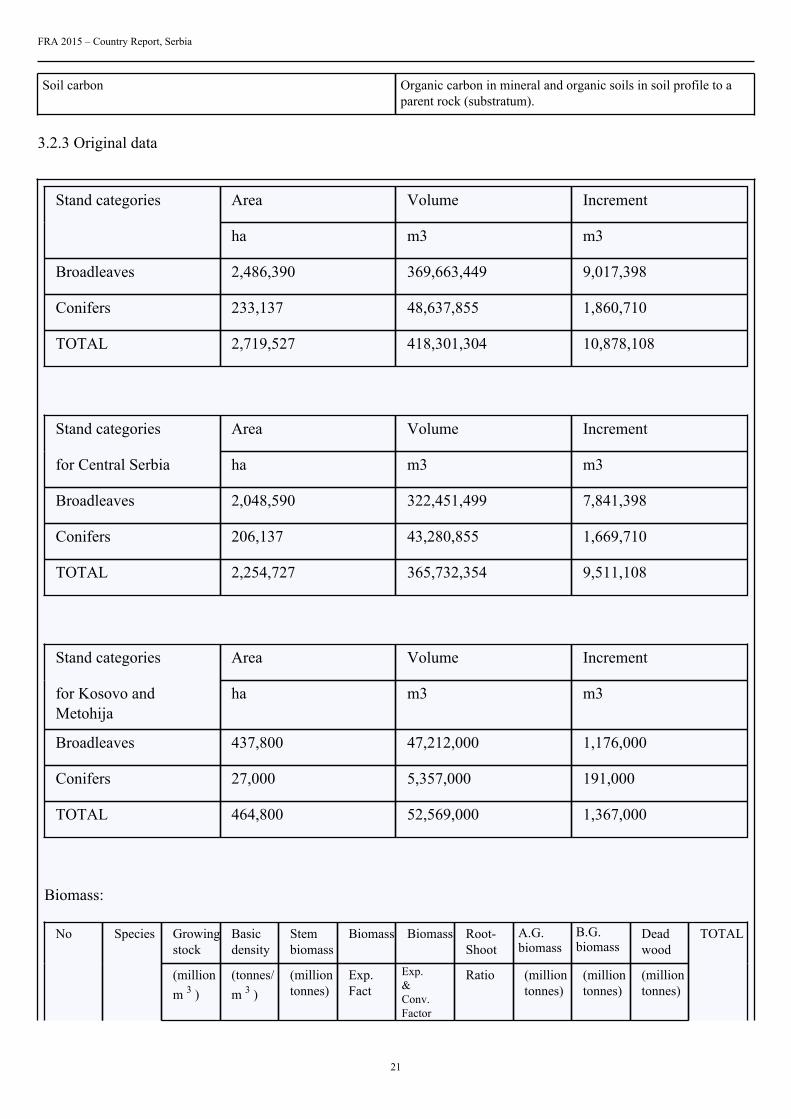
Soil carbon Organic carbon in mineral and organic soils in soil profile to aparent rock (substratum).
3.2.3 Original data
Area Volume IncrementStand categories
ha m3 m3
Broadleaves 2,486,390 369,663,449 9,017,398
Conifers 233,137 48,637,855 1,860,710
TOTAL 2,719,527 418,301,304 10,878,108
Area Volume IncrementStand categories
for Central Serbia ha m3 m3
Broadleaves 2,048,590 322,451,499 7,841,398
Conifers 206,137 43,280,855 1,669,710
TOTAL 2,254,727 365,732,354 9,511,108
Area Volume IncrementStand categories
for Kosovo andMetohija
ha m3 m3
Broadleaves 437,800 47,212,000 1,176,000
Conifers 27,000 5,357,000 191,000
TOTAL 464,800 52,569,000 1,367,000
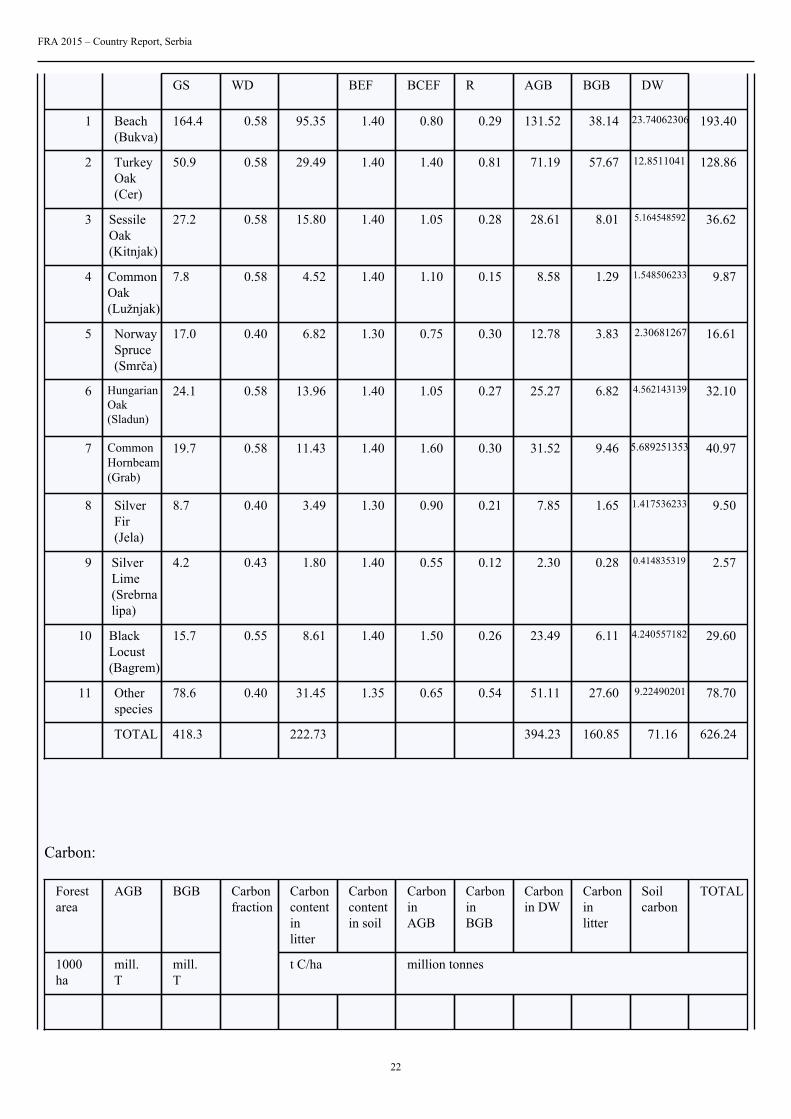
Biomass:
Growingstock
Basicdensity
Stembiomass
Biomass Biomass Root-Shoot
A.G.biomass
B.G.biomass
Deadwood
No Species
(millionm 3 )
(tonnes/m 3 )
(milliontonnes)
Exp.Fact
Exp.&Conv.Factor
Ratio (milliontonnes)
(milliontonnes)
(milliontonnes)
TOTAL
FRA 2015 – Country Report, Serbia
22
GS WD BEF BCEF R AGB BGB DW
1 Beach(Bukva)
164.4 0.58 95.35 1.40 0.80 0.29 131.52 38.14 23.74062306 193.40
2 TurkeyOak(Cer)
50.9 0.58 29.49 1.40 1.40 0.81 71.19 57.67 12.8511041 128.86
3 SessileOak(Kitnjak)
27.2 0.58 15.80 1.40 1.05 0.28 28.61 8.01 5.164548592 36.62
4 CommonOak(Lužnjak)
7.8 0.58 4.52 1.40 1.10 0.15 8.58 1.29 1.548506233 9.87
5 NorwaySpruce(Smrča)
17.0 0.40 6.82 1.30 0.75 0.30 12.78 3.83 2.30681267 16.61
6 HungarianOak(Sladun)
24.1 0.58 13.96 1.40 1.05 0.27 25.27 6.82 4.562143139 32.10
7 CommonHornbeam(Grab)
19.7 0.58 11.43 1.40 1.60 0.30 31.52 9.46 5.689251353 40.97
8 SilverFir(Jela)
8.7 0.40 3.49 1.30 0.90 0.21 7.85 1.65 1.417536233 9.50
9 SilverLime(Srebrnalipa)
4.2 0.43 1.80 1.40 0.55 0.12 2.30 0.28 0.414835319 2.57
10 BlackLocust(Bagrem)
15.7 0.55 8.61 1.40 1.50 0.26 23.49 6.11 4.240557182 29.60
11 Otherspecies
78.6 0.40 31.45 1.35 0.65 0.54 51.11 27.60 9.22490201 78.70
TOTAL 418.3 222.73 394.23 160.85 71.16 626.24
Carbon:
Forestarea
AGB BGB Carboncontentinlitter
Carboncontentin soil
CarboninAGB
CarboninBGB
Carbonin DW
Carboninlitter
Soilcarbon
TOTAL
1000ha
mill.T
mill.T
Carbonfraction
t C/ha million tonnes
FRA 2015 – Country Report, Serbia
23
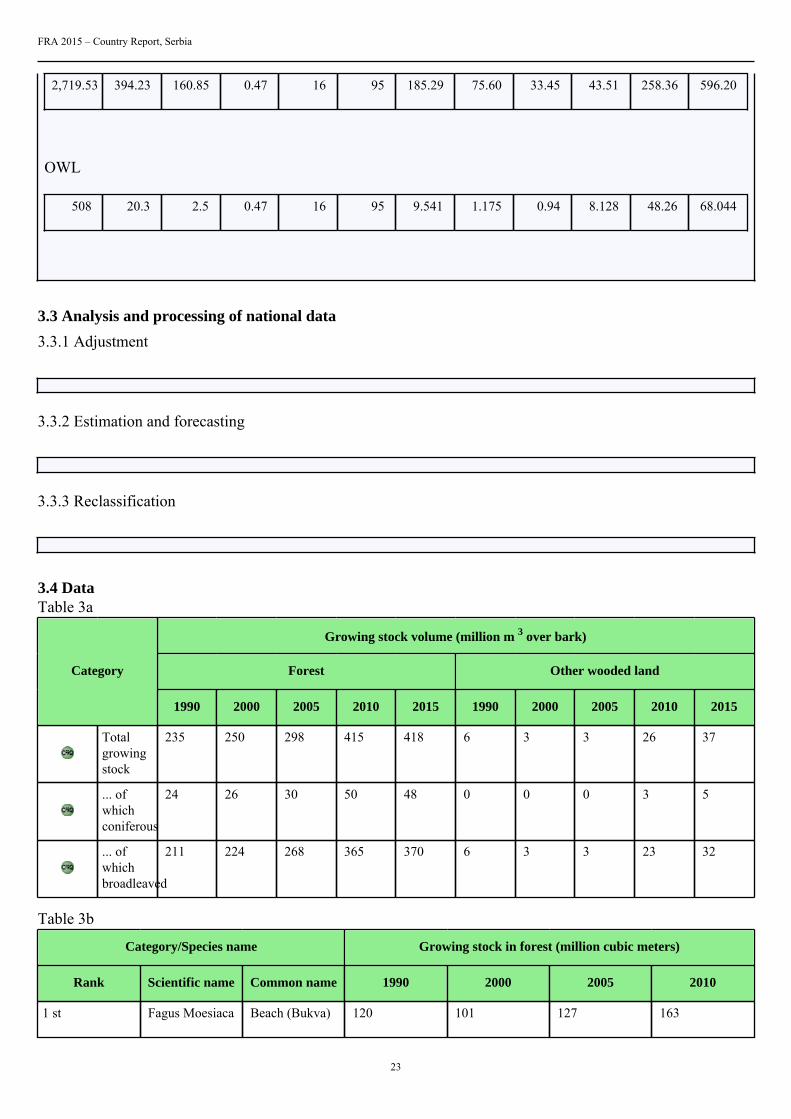
2,719.53 394.23 160.85 0.47 16 95 185.29 75.60 33.45 43.51 258.36 596.20
OWL
508 20.3 2.5 0.47 16 95 9.541 1.175 0.94 8.128 48.26 68.044
3.3 Analysis and processing of national data
3.3.1 Adjustment
3.3.2 Estimation and forecasting
3.3.3 Reclassification
3.4 DataTable 3a
Growing stock volume (million m 3 over bark)
Forest Other wooded landCategory
1990 2000 2005 2010 2015 1990 2000 2005 2010 2015
Totalgrowingstock
235 250 298 415 418 6 3 3 26 37
... ofwhichconiferous
24 26 30 50 48 0 0 0 3 5
... ofwhichbroadleaved
211 224 268 365 370 6 3 3 23 32
Table 3b
Category/Species name Growing stock in forest (million cubic meters)
Rank Scientific name Common name 1990 2000 2005 2010
1 st Fagus Moesiaca Beach (Bukva) 120 101 127 163
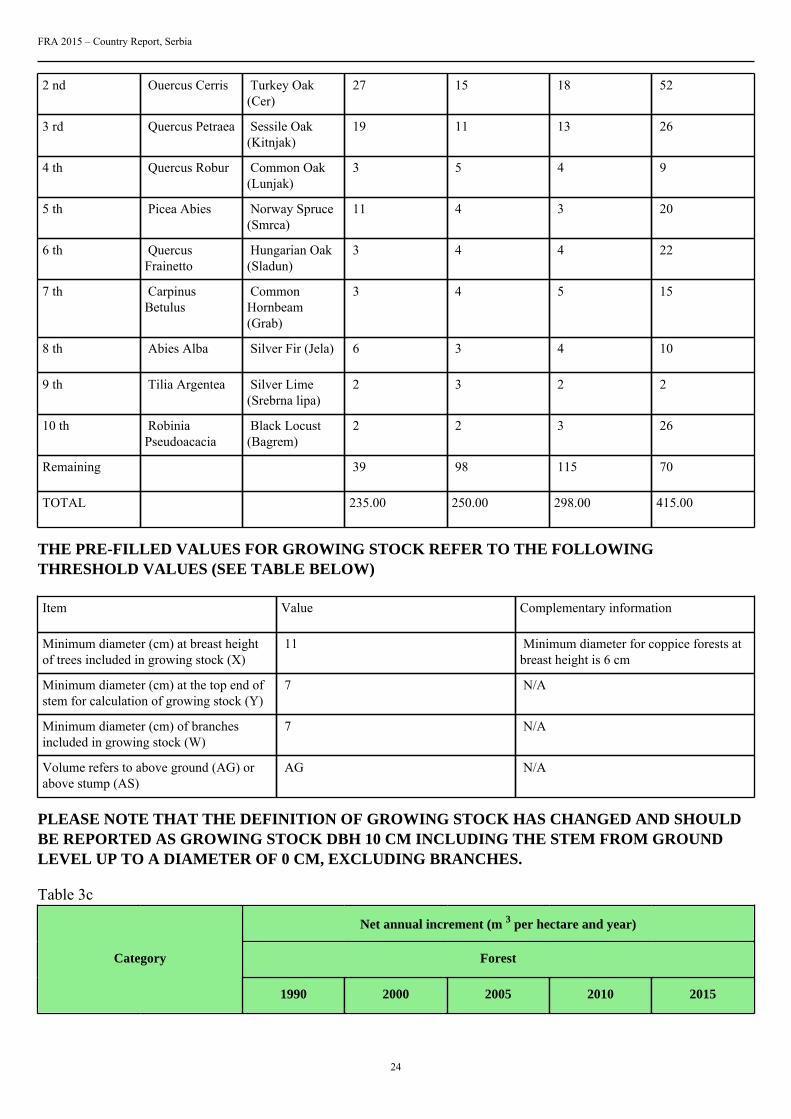
FRA 2015 – Country Report, Serbia
24
2 nd Ouercus Cerris Turkey Oak(Cer)
27 15 18 52
3 rd Quercus Petraea Sessile Oak(Kitnjak)
19 11 13 26
4 th Quercus Robur Common Oak(Lunjak)
3 5 4 9
5 th Picea Abies Norway Spruce(Smrca)
11 4 3 20
6 th QuercusFrainetto
Hungarian Oak(Sladun)
3 4 4 22
7 th CarpinusBetulus
CommonHornbeam(Grab)
3 4 5 15
8 th Abies Alba Silver Fir (Jela) 6 3 4 10
9 th Tilia Argentea Silver Lime(Srebrna lipa)
2 3 2 2
10 th RobiniaPseudoacacia
Black Locust(Bagrem)
2 2 3 26
Remaining 39 98 115 70
TOTAL 235.00 250.00 298.00 415.00
THE PRE-FILLED VALUES FOR GROWING STOCK REFER TO THE FOLLOWINGTHRESHOLD VALUES (SEE TABLE BELOW)
Item Value Complementary information
Minimum diameter (cm) at breast heightof trees included in growing stock (X)
11 Minimum diameter for coppice forests atbreast height is 6 cm
Minimum diameter (cm) at the top end ofstem for calculation of growing stock (Y)
7 N/A
Minimum diameter (cm) of branchesincluded in growing stock (W)
7 N/A
Volume refers to above ground (AG) orabove stump (AS)
AG N/A
PLEASE NOTE THAT THE DEFINITION OF GROWING STOCK HAS CHANGED AND SHOULDBE REPORTED AS GROWING STOCK DBH 10 CM INCLUDING THE STEM FROM GROUNDLEVEL UP TO A DIAMETER OF 0 CM, EXCLUDING BRANCHES.
Table 3c
Net annual increment (m 3 per hectare and year)
ForestCategory
1990 2000 2005 2010 2015
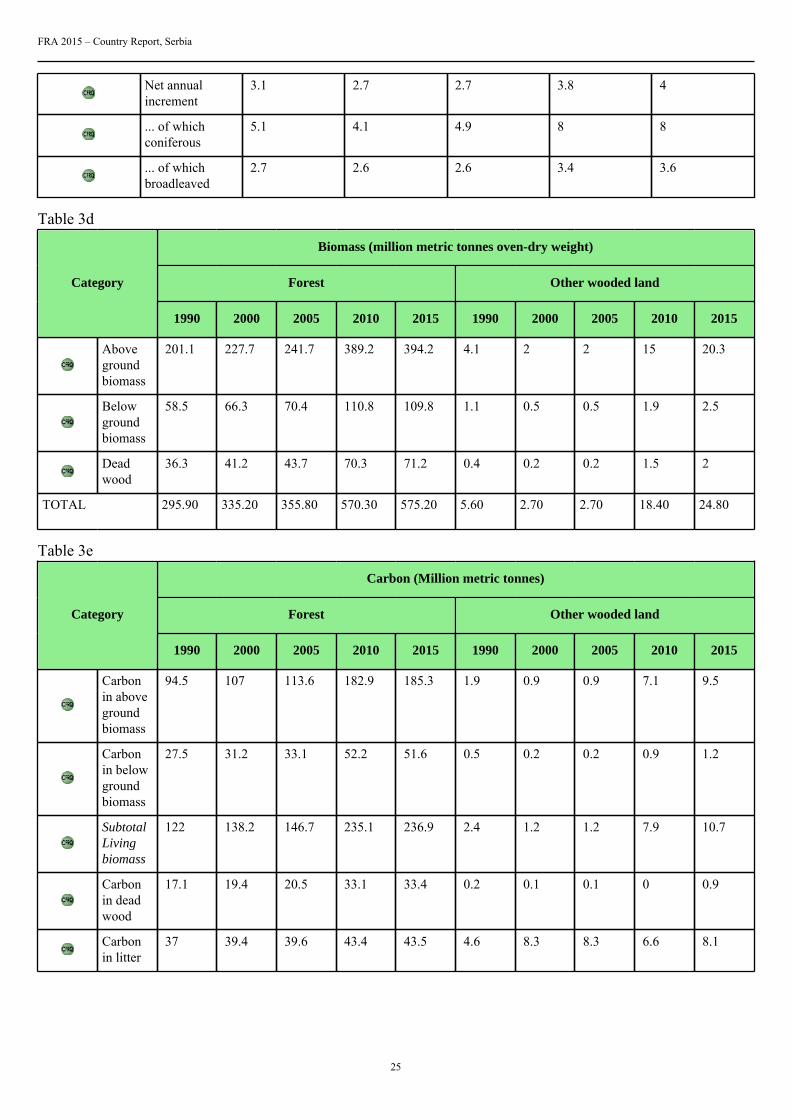
FRA 2015 – Country Report, Serbia
25
Net annualincrement
3.1 2.7 2.7 3.8 4
... of whichconiferous
5.1 4.1 4.9 8 8
... of whichbroadleaved
2.7 2.6 2.6 3.4 3.6
Table 3d
Biomass (million metric tonnes oven-dry weight)
Forest Other wooded landCategory
1990 2000 2005 2010 2015 1990 2000 2005 2010 2015
Abovegroundbiomass
201.1 227.7 241.7 389.2 394.2 4.1 2 2 15 20.3
Belowgroundbiomass
58.5 66.3 70.4 110.8 109.8 1.1 0.5 0.5 1.9 2.5
Deadwood
36.3 41.2 43.7 70.3 71.2 0.4 0.2 0.2 1.5 2
TOTAL 295.90 335.20 355.80 570.30 575.20 5.60 2.70 2.70 18.40 24.80
Table 3e
Carbon (Million metric tonnes)
Forest Other wooded landCategory
1990 2000 2005 2010 2015 1990 2000 2005 2010 2015
Carbonin abovegroundbiomass
94.5 107 113.6 182.9 185.3 1.9 0.9 0.9 7.1 9.5
Carbonin belowgroundbiomass
27.5 31.2 33.1 52.2 51.6 0.5 0.2 0.2 0.9 1.2
SubtotalLivingbiomass
122 138.2 146.7 235.1 236.9 2.4 1.2 1.2 7.9 10.7
Carbonin deadwood
17.1 19.4 20.5 33.1 33.4 0.2 0.1 0.1 0 0.9
Carbonin litter
37 39.4 39.6 43.4 43.5 4.6 8.3 8.3 6.6 8.1
FRA 2015 – Country Report, Serbia
26
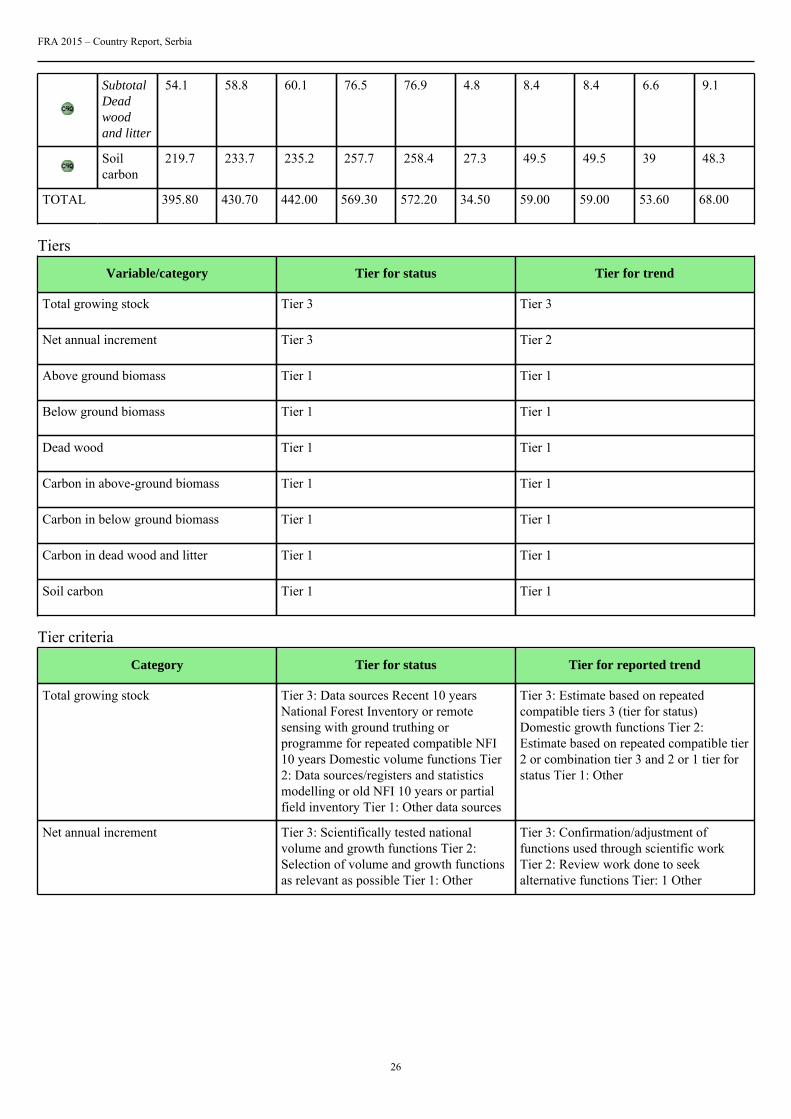
SubtotalDeadwoodand litter
54.1 58.8 60.1 76.5 76.9 4.8 8.4 8.4 6.6 9.1
Soilcarbon
219.7 233.7 235.2 257.7 258.4 27.3 49.5 49.5 39 48.3
TOTAL 395.80 430.70 442.00 569.30 572.20 34.50 59.00 59.00 53.60 68.00
Tiers
Variable/category Tier for status Tier for trend
Total growing stock Tier 3 Tier 3
Net annual increment Tier 3 Tier 2
Above ground biomass Tier 1 Tier 1
Below ground biomass Tier 1 Tier 1
Dead wood Tier 1 Tier 1
Carbon in above-ground biomass Tier 1 Tier 1
Carbon in below ground biomass Tier 1 Tier 1
Carbon in dead wood and litter Tier 1 Tier 1
Soil carbon Tier 1 Tier 1
Tier criteria
Category Tier for status Tier for reported trend
Total growing stock Tier 3: Data sources Recent 10 yearsNational Forest Inventory or remotesensing with ground truthing orprogramme for repeated compatible NFI10 years Domestic volume functions Tier2: Data sources/registers and statisticsmodelling or old NFI 10 years or partialfield inventory Tier 1: Other data sources
Tier 3: Estimate based on repeatedcompatible tiers 3 (tier for status)Domestic growth functions Tier 2:Estimate based on repeated compatible tier2 or combination tier 3 and 2 or 1 tier forstatus Tier 1: Other
Net annual increment Tier 3: Scientifically tested nationalvolume and growth functions Tier 2:Selection of volume and growth functionsas relevant as possible Tier 1: Other
Tier 3: Confirmation/adjustment offunctions used through scientific workTier 2: Review work done to seekalternative functions Tier: 1 Other
FRA 2015 – Country Report, Serbia
27
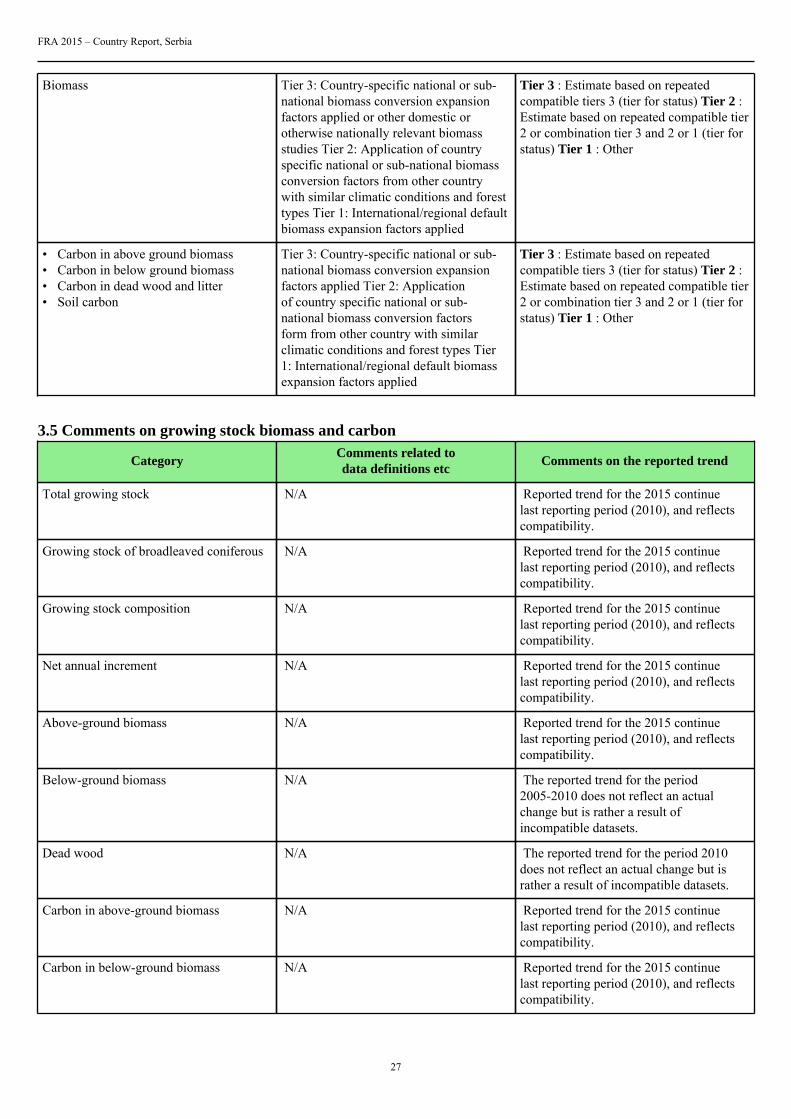
Biomass Tier 3: Country-specific national or sub-national biomass conversion expansionfactors applied or other domestic orotherwise nationally relevant biomassstudies Tier 2: Application of countryspecific national or sub-national biomassconversion factors from other countrywith similar climatic conditions and foresttypes Tier 1: International/regional defaultbiomass expansion factors applied
Tier 3 : Estimate based on repeatedcompatible tiers 3 (tier for status) Tier 2 :Estimate based on repeated compatible tier2 or combination tier 3 and 2 or 1 (tier forstatus) Tier 1 : Other
• Carbon in above ground biomass• Carbon in below ground biomass• Carbon in dead wood and litter• Soil carbon
Tier 3: Country-specific national or sub-national biomass conversion expansionfactors applied Tier 2: Applicationof country specific national or sub-national biomass conversion factorsform from other country with similarclimatic conditions and forest types Tier1: International/regional default biomassexpansion factors applied
Tier 3 : Estimate based on repeatedcompatible tiers 3 (tier for status) Tier 2 :Estimate based on repeated compatible tier2 or combination tier 3 and 2 or 1 (tier forstatus) Tier 1 : Other
3.5 Comments on growing stock biomass and carbon
CategoryComments related todata definitions etc
Comments on the reported trend
Total growing stock N/A Reported trend for the 2015 continuelast reporting period (2010), and reflectscompatibility.
Growing stock of broadleaved coniferous N/A Reported trend for the 2015 continuelast reporting period (2010), and reflectscompatibility.
Growing stock composition N/A Reported trend for the 2015 continuelast reporting period (2010), and reflectscompatibility.
Net annual increment N/A Reported trend for the 2015 continuelast reporting period (2010), and reflectscompatibility.
Above-ground biomass N/A Reported trend for the 2015 continuelast reporting period (2010), and reflectscompatibility.
Below-ground biomass N/A The reported trend for the period2005-2010 does not reflect an actualchange but is rather a result ofincompatible datasets.
Dead wood N/A The reported trend for the period 2010does not reflect an actual change but israther a result of incompatible datasets.
Carbon in above-ground biomass N/A Reported trend for the 2015 continuelast reporting period (2010), and reflectscompatibility.
Carbon in below-ground biomass N/A Reported trend for the 2015 continuelast reporting period (2010), and reflectscompatibility.
FRA 2015 – Country Report, Serbia
28
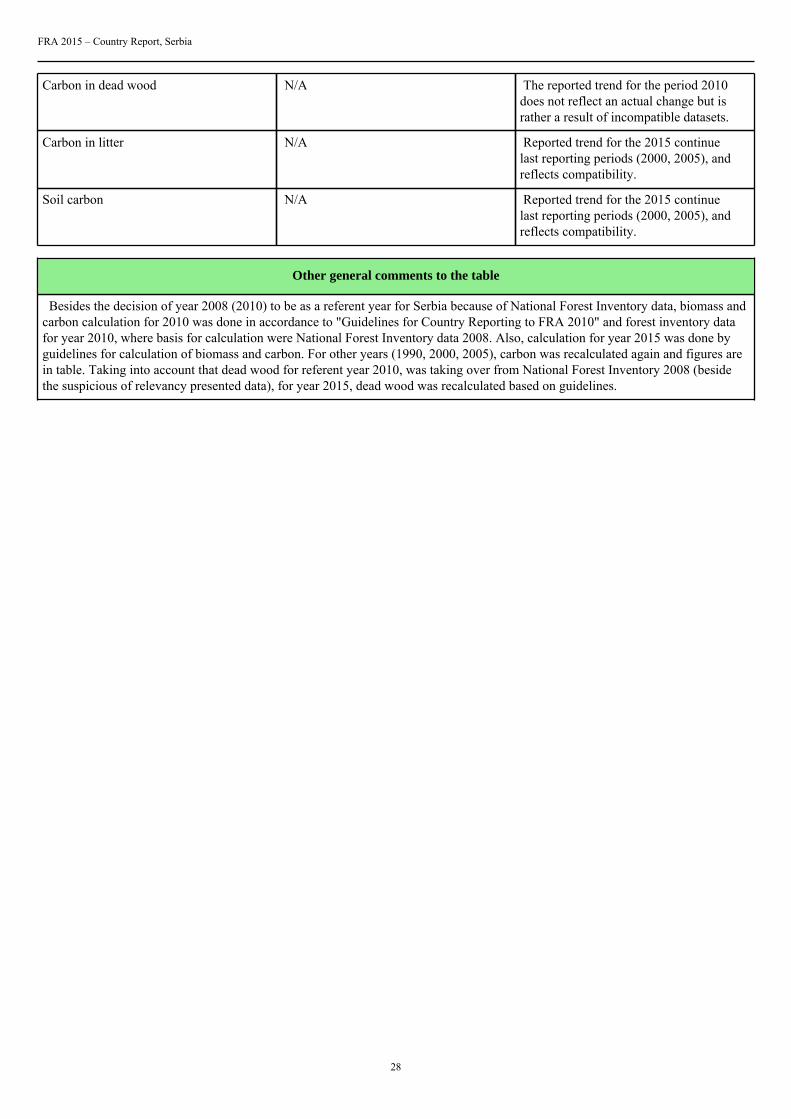
Carbon in dead wood N/A The reported trend for the period 2010does not reflect an actual change but israther a result of incompatible datasets.
Carbon in litter N/A Reported trend for the 2015 continuelast reporting periods (2000, 2005), andreflects compatibility.
Soil carbon N/A Reported trend for the 2015 continuelast reporting periods (2000, 2005), andreflects compatibility.
Other general comments to the table
Besides the decision of year 2008 (2010) to be as a referent year for Serbia because of National Forest Inventory data, biomass andcarbon calculation for 2010 was done in accordance to "Guidelines for Country Reporting to FRA 2010" and forest inventory datafor year 2010, where basis for calculation were National Forest Inventory data 2008. Also, calculation for year 2015 was done byguidelines for calculation of biomass and carbon. For other years (1990, 2000, 2005), carbon was recalculated again and figures arein table. Taking into account that dead wood for referent year 2010, was taking over from National Forest Inventory 2008 (besidethe suspicious of relevancy presented data), for year 2015, dead wood was recalculated based on guidelines.
FRA 2015 – Country Report, Serbia
29
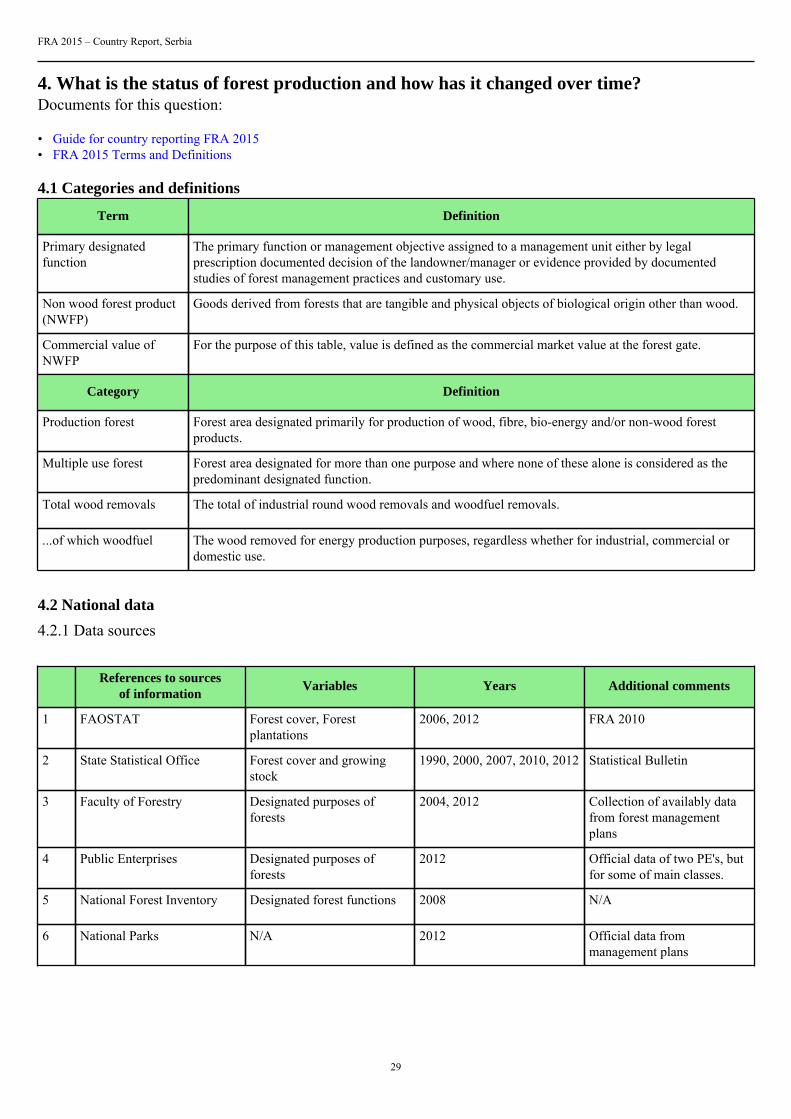
4. What is the status of forest production and how has it changed over time?Documents for this question:
• Guide for country reporting FRA 2015• FRA 2015 Terms and Definitions
4.1 Categories and definitions
Term Definition
Primary designatedfunction
The primary function or management objective assigned to a management unit either by legalprescription documented decision of the landowner/manager or evidence provided by documentedstudies of forest management practices and customary use.
Non wood forest product(NWFP)
Goods derived from forests that are tangible and physical objects of biological origin other than wood.
Commercial value ofNWFP
For the purpose of this table, value is defined as the commercial market value at the forest gate.
Category Definition
Production forest Forest area designated primarily for production of wood, fibre, bio-energy and/or non-wood forestproducts.
Multiple use forest Forest area designated for more than one purpose and where none of these alone is considered as thepredominant designated function.
Total wood removals The total of industrial round wood removals and woodfuel removals.
...of which woodfuel The wood removed for energy production purposes, regardless whether for industrial, commercial ordomestic use.
4.2 National data
4.2.1 Data sources
References to sourcesof information
Variables Years Additional comments
1 FAOSTAT Forest cover, Forestplantations
2006, 2012 FRA 2010
2 State Statistical Office Forest cover and growingstock
1990, 2000, 2007, 2010, 2012 Statistical Bulletin
3 Faculty of Forestry Designated purposes offorests
2004, 2012 Collection of availably datafrom forest managementplans
4 Public Enterprises Designated purposes offorests
2012 Official data of two PE's, butfor some of main classes.
5 National Forest Inventory Designated forest functions 2008 N/A
6 National Parks N/A 2012 Official data frommanagement plans
FRA 2015 – Country Report, Serbia
30
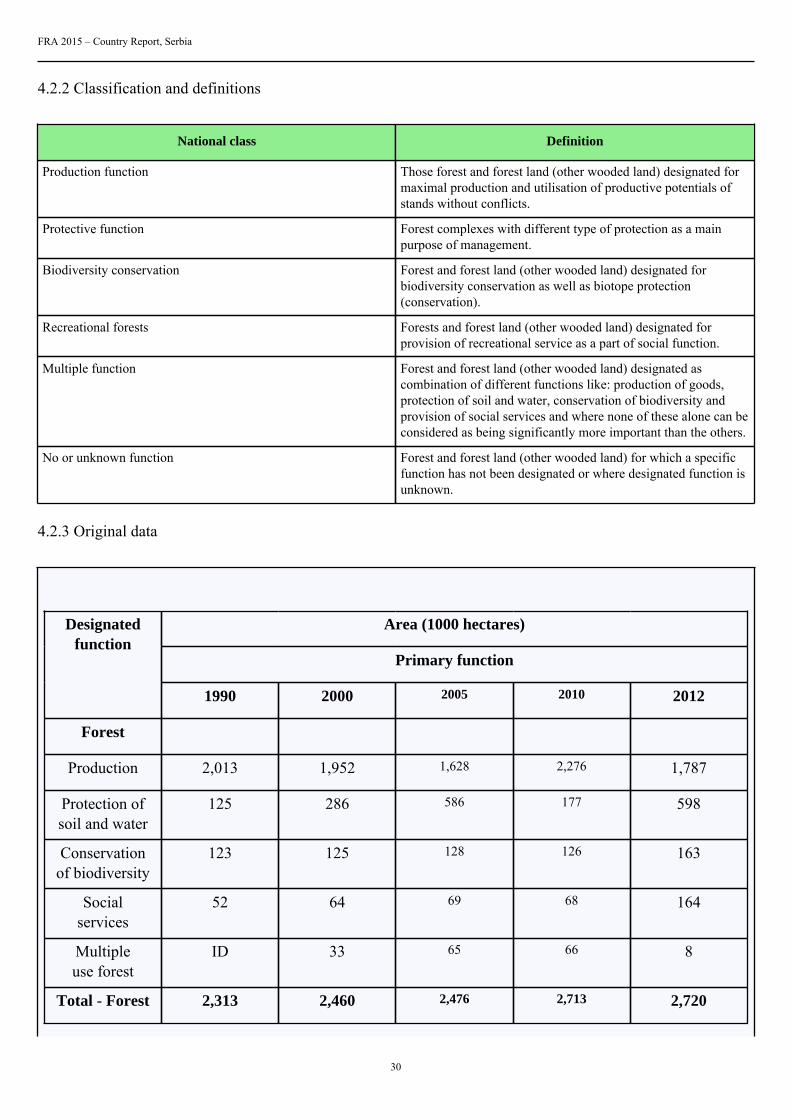
4.2.2 Classification and definitions
National class Definition
Production function Those forest and forest land (other wooded land) designated formaximal production and utilisation of productive potentials ofstands without conflicts.
Protective function Forest complexes with different type of protection as a mainpurpose of management.
Biodiversity conservation Forest and forest land (other wooded land) designated forbiodiversity conservation as well as biotope protection(conservation).
Recreational forests Forests and forest land (other wooded land) designated forprovision of recreational service as a part of social function.
Multiple function Forest and forest land (other wooded land) designated ascombination of different functions like: production of goods,protection of soil and water, conservation of biodiversity andprovision of social services and where none of these alone can beconsidered as being significantly more important than the others.
No or unknown function Forest and forest land (other wooded land) for which a specificfunction has not been designated or where designated function isunknown.
4.2.3 Original data
Area (1000 hectares)
Primary function
Designatedfunction
1990 2000 2005 2010 2012
Forest
Production 2,013 1,952 1,628 2,276 1,787
Protection ofsoil and water
125 286 586 177 598
Conservationof biodiversity
123 125 128 126 163
Socialservices
52 64 69 68 164
Multipleuse forest
ID 33 65 66 8
Total - Forest 2,313 2,460 2,476 2,713 2,720
FRA 2015 – Country Report, Serbia
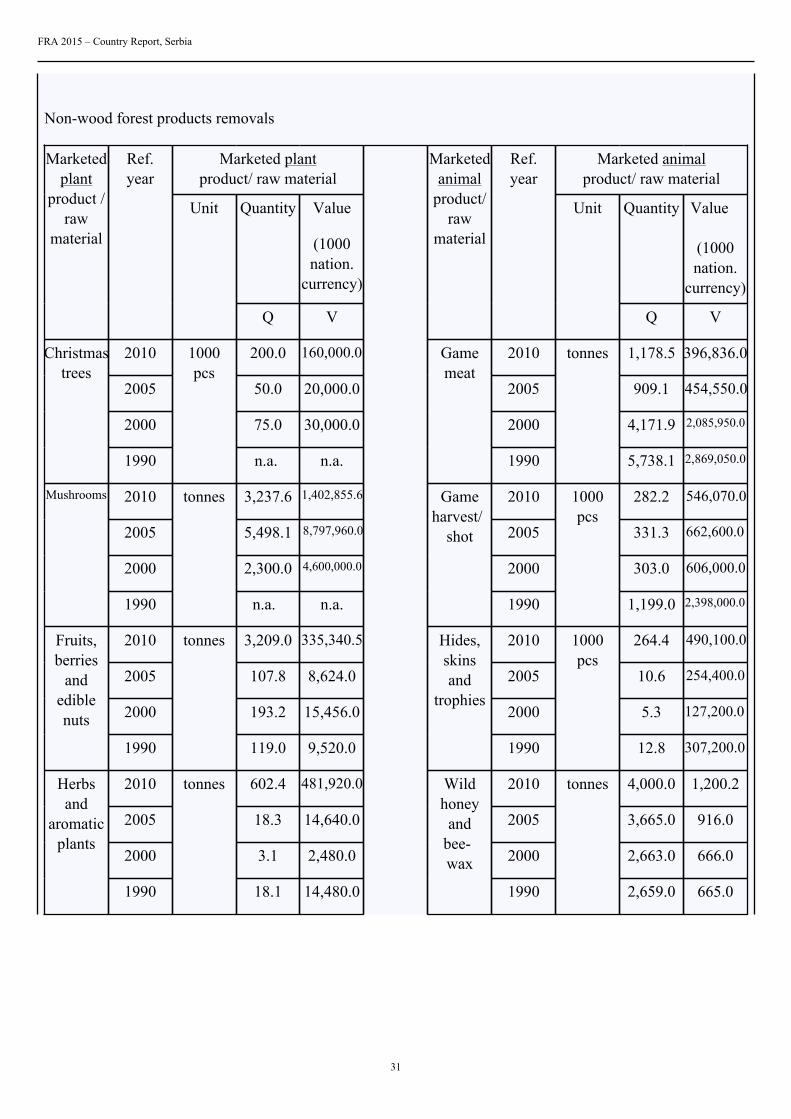
31
Non-wood forest products removals
Marketed plantproduct/ raw material
Marketed animalproduct/ raw material
Quantity Value
(1000nation.
currency)
Quantity Value
(1000nation.
currency)
Marketedplant
product /raw
material
Ref.year
Unit
Q V
Marketedanimal
product/raw
material
Ref.year
Unit
Q V
2010 200.0 160,000.0 2010 1,178.5 396,836.0
2005 50.0 20,000.0 2005 909.1 454,550.0
2000 75.0 30,000.0 2000 4,171.9 2,085,950.0
Christmastrees
1990
1000pcs
n.a. n.a.
Gamemeat
1990
tonnes
5,738.1 2,869,050.0
2010 3,237.6 1,402,855.6 2010 282.2 546,070.0
2005 5,498.1 8,797,960.0 2005 331.3 662,600.0
2000 2,300.0 4,600,000.0 2000 303.0 606,000.0
Mushrooms
1990
tonnes
n.a. n.a.
Gameharvest/
shot
1990
1000pcs
1,199.0 2,398,000.0
2010 3,209.0 335,340.5 2010 264.4 490,100.0
2005 107.8 8,624.0 2005 10.6 254,400.0
2000 193.2 15,456.0 2000 5.3 127,200.0
Fruits,berries
andediblenuts
1990
tonnes
119.0 9,520.0
Hides,skinsand
trophies
1990
1000pcs
12.8 307,200.0
2010 602.4 481,920.0 2010 4,000.0 1,200.2
2005 18.3 14,640.0 2005 3,665.0 916.0
2000 3.1 2,480.0 2000 2,663.0 666.0
Herbsand
aromaticplants
1990
tonnes
18.1 14,480.0
Wildhoneyand
bee-wax
1990
tonnes
2,659.0 665.0
FRA 2015 – Country Report, Serbia
32
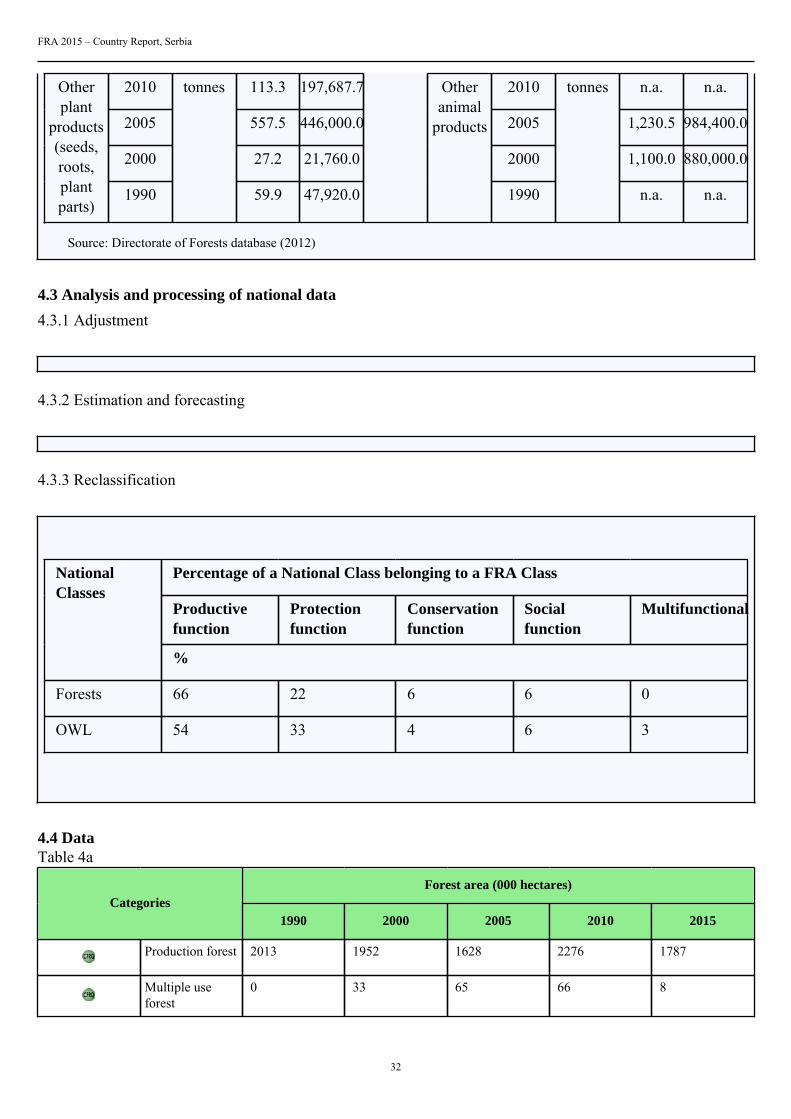
2010 113.3 197,687.7 2010 n.a. n.a.
2005 557.5 446,000.0 2005 1,230.5 984,400.0
2000 27.2 21,760.0 2000 1,100.0 880,000.0
Otherplant
products(seeds,roots,plantparts)
1990
tonnes
59.9 47,920.0
Otheranimal
products
1990
tonnes
n.a. n.a.
Source: Directorate of Forests database (2012)
4.3 Analysis and processing of national data
4.3.1 Adjustment
4.3.2 Estimation and forecasting
4.3.3 Reclassification
Percentage of a National Class belonging to a FRA Class
Productivefunction
Protectionfunction
Conservationfunction
Socialfunction
Multifunctional
NationalClasses
%
Forests 66 22 6 6 0
OWL 54 33 4 6 3
4.4 DataTable 4a
Forest area (000 hectares)Categories
1990 2000 2005 2010 2015
Production forest 2013 1952 1628 2276 1787
Multiple useforest
0 33 65 66 8
FRA 2015 – Country Report, Serbia
33
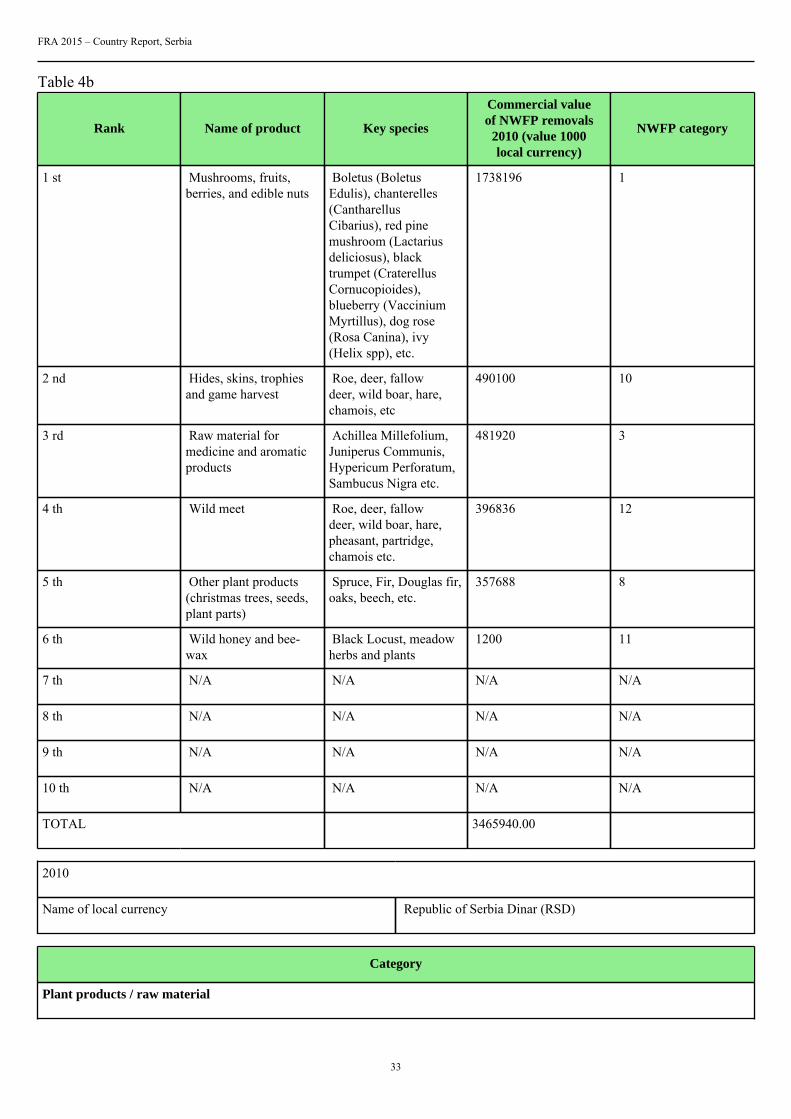
Table 4b
Rank Name of product Key species
Commercial valueof NWFP removals
2010 (value 1000local currency)
NWFP category
1 st Mushrooms, fruits,berries, and edible nuts
Boletus (BoletusEdulis), chanterelles(CantharellusCibarius), red pinemushroom (Lactariusdeliciosus), blacktrumpet (CraterellusCornucopioides),blueberry (VacciniumMyrtillus), dog rose(Rosa Canina), ivy(Helix spp), etc.
1738196 1
2 nd Hides, skins, trophiesand game harvest
Roe, deer, fallowdeer, wild boar, hare,chamois, etc
490100 10
3 rd Raw material formedicine and aromaticproducts
Achillea Millefolium,Juniperus Communis,Hypericum Perforatum,Sambucus Nigra etc.
481920 3
4 th Wild meet Roe, deer, fallowdeer, wild boar, hare,pheasant, partridge,chamois etc.
396836 12
5 th Other plant products(christmas trees, seeds,plant parts)
Spruce, Fir, Douglas fir,oaks, beech, etc.
357688 8
6 th Wild honey and bee-wax
Black Locust, meadowherbs and plants
1200 11
7 th N/A N/A N/A N/A
8 th N/A N/A N/A N/A
9 th N/A N/A N/A N/A
10 th N/A N/A N/A N/A
TOTAL 3465940.00
2010
Name of local currency Republic of Serbia Dinar (RSD)
Category
Plant products / raw material
FRA 2015 – Country Report, Serbia
34
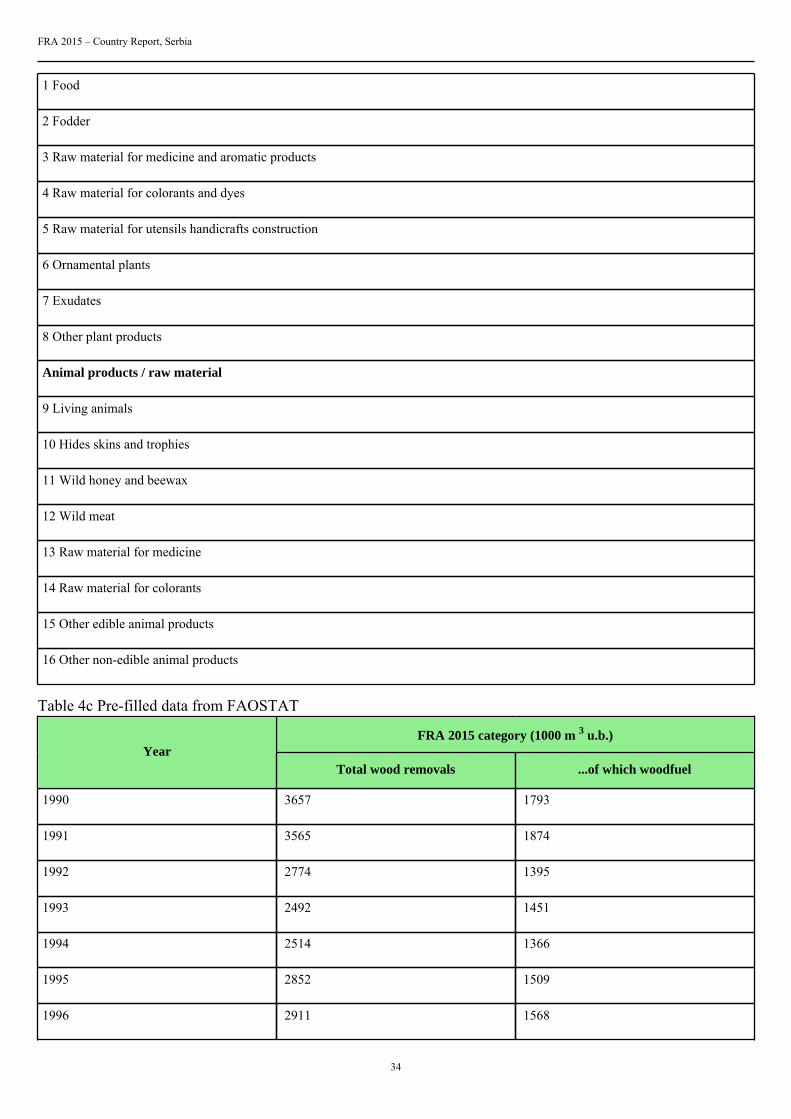
1 Food
2 Fodder
3 Raw material for medicine and aromatic products
4 Raw material for colorants and dyes
5 Raw material for utensils handicrafts construction
6 Ornamental plants
7 Exudates
8 Other plant products
Animal products / raw material
9 Living animals
10 Hides skins and trophies
11 Wild honey and beewax
12 Wild meat
13 Raw material for medicine
14 Raw material for colorants
15 Other edible animal products
16 Other non-edible animal products
Table 4c Pre-filled data from FAOSTAT
FRA 2015 category (1000 m 3 u.b.)Year
Total wood removals ...of which woodfuel
1990 3657 1793
1991 3565 1874
1992 2774 1395
1993 2492 1451
1994 2514 1366
1995 2852 1509
1996 2911 1568
FRA 2015 – Country Report, Serbia
35
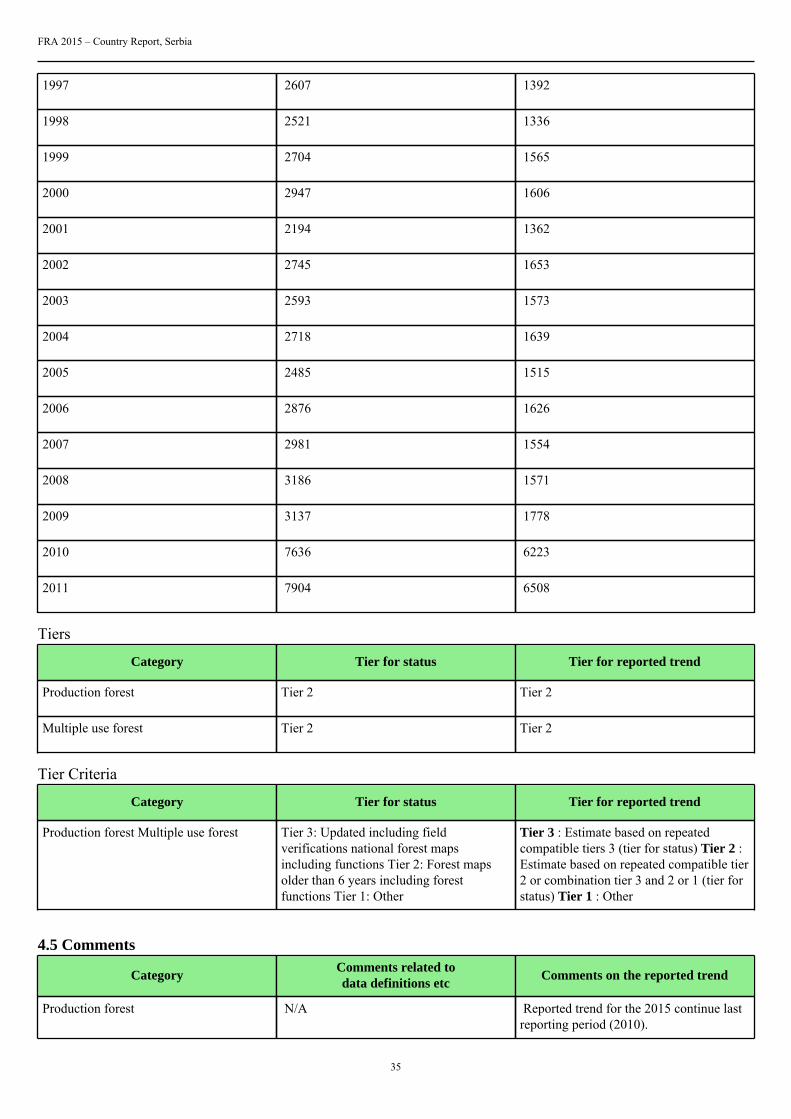
1997 2607 1392
1998 2521 1336
1999 2704 1565
2000 2947 1606
2001 2194 1362
2002 2745 1653
2003 2593 1573
2004 2718 1639
2005 2485 1515
2006 2876 1626
2007 2981 1554
2008 3186 1571
2009 3137 1778
2010 7636 6223
2011 7904 6508
Tiers
Category Tier for status Tier for reported trend
Production forest Tier 2 Tier 2
Multiple use forest Tier 2 Tier 2
Tier Criteria
Category Tier for status Tier for reported trend
Production forest Multiple use forest Tier 3: Updated including fieldverifications national forest mapsincluding functions Tier 2: Forest mapsolder than 6 years including forestfunctions Tier 1: Other
Tier 3 : Estimate based on repeatedcompatible tiers 3 (tier for status) Tier 2 :Estimate based on repeated compatible tier2 or combination tier 3 and 2 or 1 (tier forstatus) Tier 1 : Other
4.5 Comments
CategoryComments related todata definitions etc
Comments on the reported trend
Production forest N/A Reported trend for the 2015 continue lastreporting period (2010).
FRA 2015 – Country Report, Serbia
36
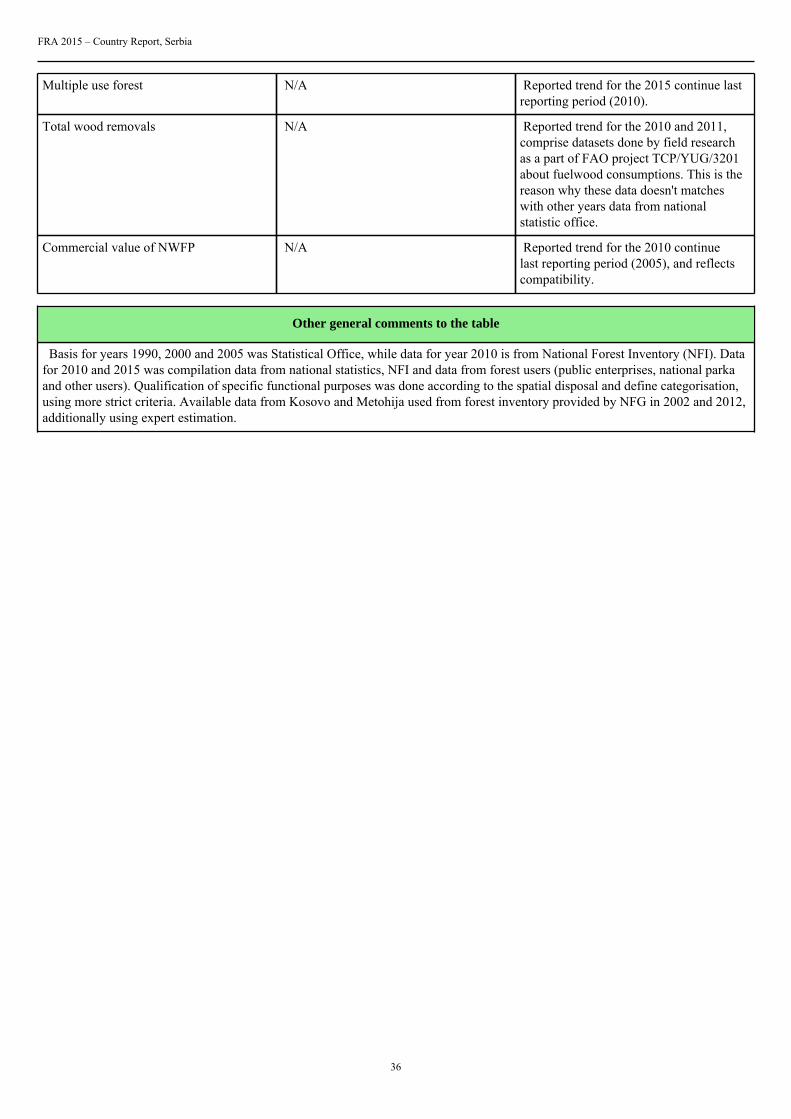
Multiple use forest N/A Reported trend for the 2015 continue lastreporting period (2010).
Total wood removals N/A Reported trend for the 2010 and 2011,comprise datasets done by field researchas a part of FAO project TCP/YUG/3201about fuelwood consumptions. This is thereason why these data doesn't matcheswith other years data from nationalstatistic office.
Commercial value of NWFP N/A Reported trend for the 2010 continuelast reporting period (2005), and reflectscompatibility.
Other general comments to the table
Basis for years 1990, 2000 and 2005 was Statistical Office, while data for year 2010 is from National Forest Inventory (NFI). Datafor 2010 and 2015 was compilation data from national statistics, NFI and data from forest users (public enterprises, national parkaand other users). Qualification of specific functional purposes was done according to the spatial disposal and define categorisation,using more strict criteria. Available data from Kosovo and Metohija used from forest inventory provided by NFG in 2002 and 2012,additionally using expert estimation.
FRA 2015 – Country Report, Serbia
37
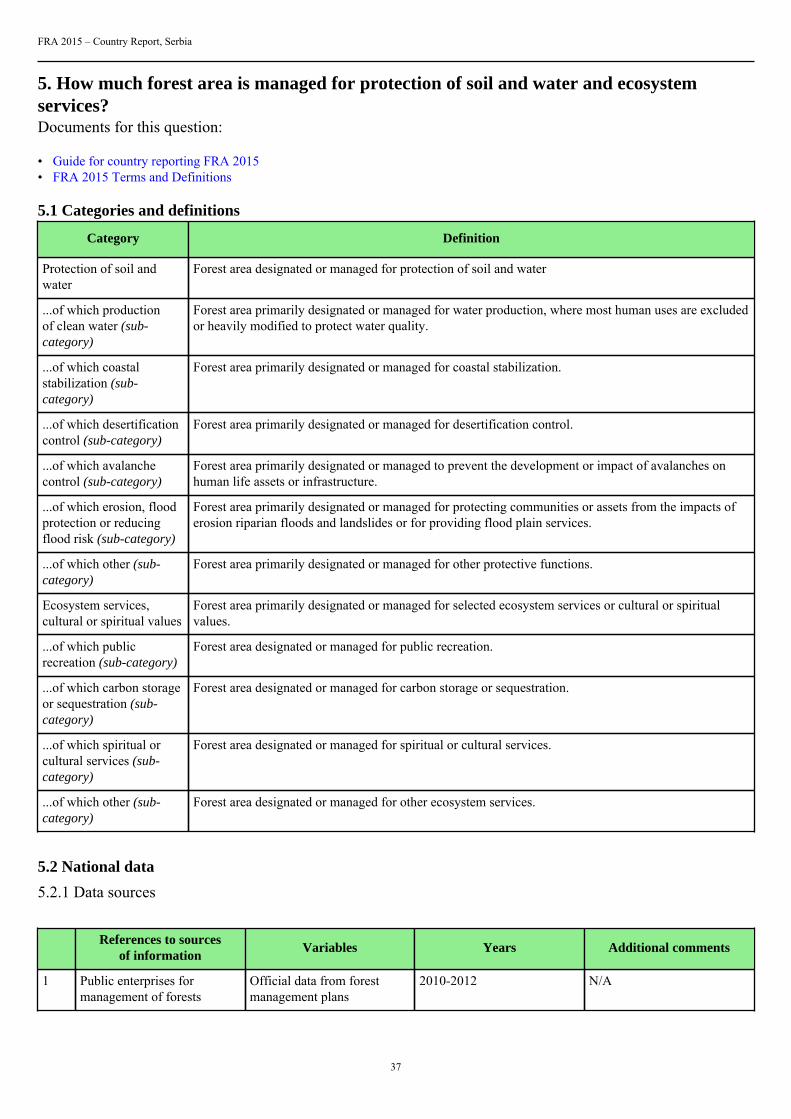
5. How much forest area is managed for protection of soil and water and ecosystemservices?Documents for this question:
• Guide for country reporting FRA 2015• FRA 2015 Terms and Definitions
5.1 Categories and definitions
Category Definition
Protection of soil andwater
Forest area designated or managed for protection of soil and water
...of which productionof clean water (sub-category)
Forest area primarily designated or managed for water production, where most human uses are excludedor heavily modified to protect water quality.
...of which coastalstabilization (sub-category)
Forest area primarily designated or managed for coastal stabilization.
...of which desertificationcontrol (sub-category)
Forest area primarily designated or managed for desertification control.
...of which avalanchecontrol (sub-category)
Forest area primarily designated or managed to prevent the development or impact of avalanches onhuman life assets or infrastructure.
...of which erosion, floodprotection or reducingflood risk (sub-category)
Forest area primarily designated or managed for protecting communities or assets from the impacts oferosion riparian floods and landslides or for providing flood plain services.
...of which other (sub-category)
Forest area primarily designated or managed for other protective functions.
Ecosystem services,cultural or spiritual values
Forest area primarily designated or managed for selected ecosystem services or cultural or spiritualvalues.
...of which publicrecreation (sub-category)
Forest area designated or managed for public recreation.
...of which carbon storageor sequestration (sub-category)
Forest area designated or managed for carbon storage or sequestration.
...of which spiritual orcultural services (sub-category)
Forest area designated or managed for spiritual or cultural services.
...of which other (sub-category)
Forest area designated or managed for other ecosystem services.
5.2 National data
5.2.1 Data sources
References to sourcesof information
Variables Years Additional comments
1 Public enterprises formanagement of forests
Official data from forestmanagement plans
2010-2012 N/A
FRA 2015 – Country Report, Serbia
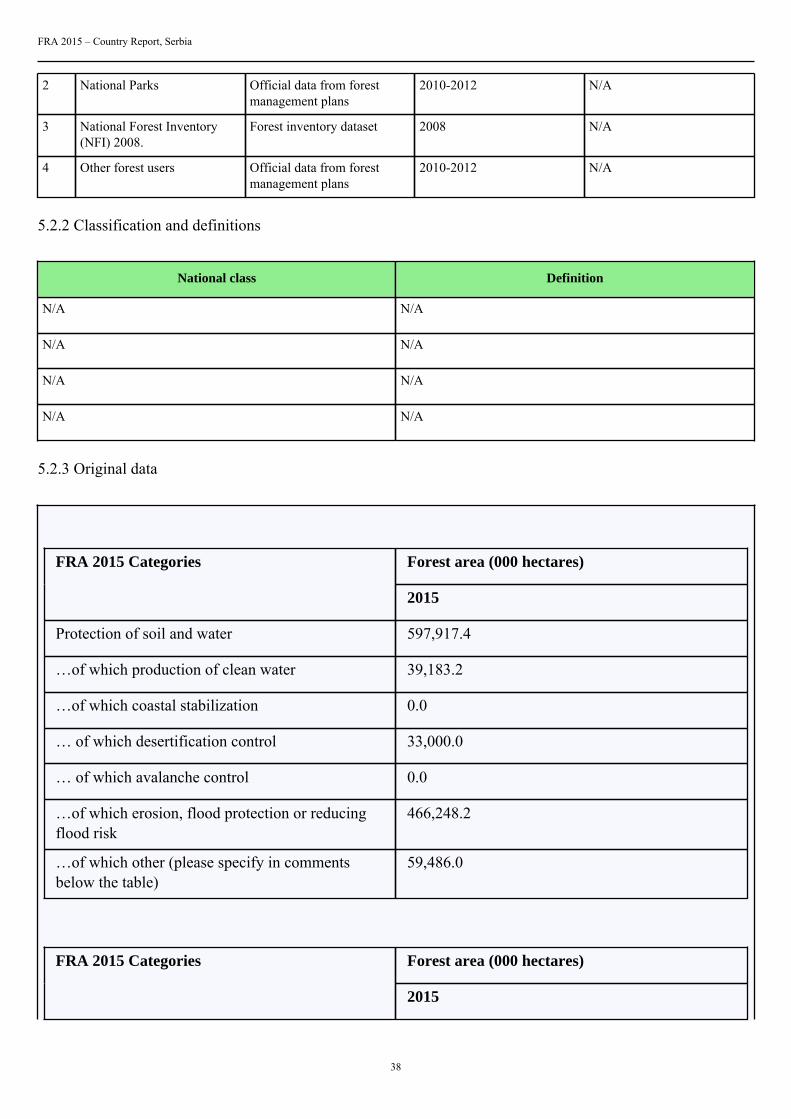
38
2 National Parks Official data from forestmanagement plans
2010-2012 N/A
3 National Forest Inventory(NFI) 2008.
Forest inventory dataset 2008 N/A
4 Other forest users Official data from forestmanagement plans
2010-2012 N/A
5.2.2 Classification and definitions
National class Definition
N/A N/A
N/A N/A
N/A N/A
N/A N/A
5.2.3 Original data
Forest area (000 hectares)FRA 2015 Categories
2015
Protection of soil and water 597,917.4
…of which production of clean water 39,183.2
…of which coastal stabilization 0.0
… of which desertification control 33,000.0
… of which avalanche control 0.0
…of which erosion, flood protection or reducingflood risk
466,248.2
…of which other (please specify in commentsbelow the table)
59,486.0
Forest area (000 hectares)FRA 2015 Categories
2015
FRA 2015 – Country Report, Serbia
39
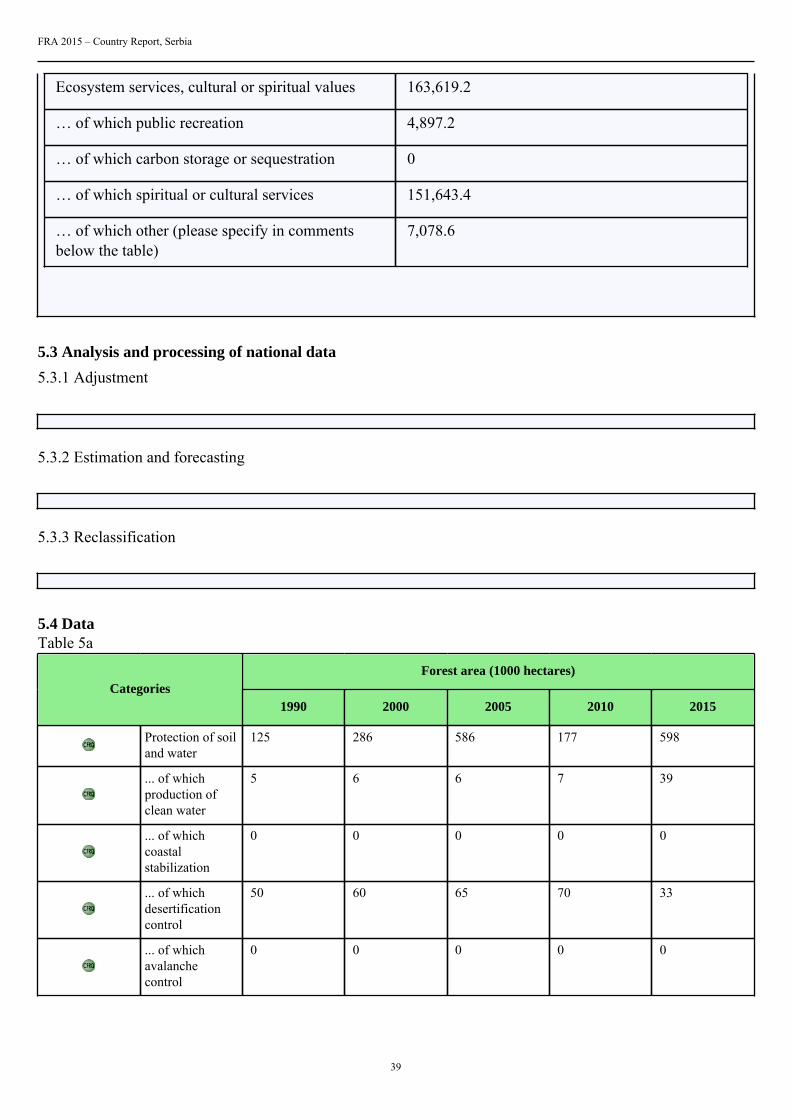
Ecosystem services, cultural or spiritual values 163,619.2
… of which public recreation 4,897.2
… of which carbon storage or sequestration 0
… of which spiritual or cultural services 151,643.4
… of which other (please specify in commentsbelow the table)
7,078.6
5.3 Analysis and processing of national data
5.3.1 Adjustment
5.3.2 Estimation and forecasting
5.3.3 Reclassification
5.4 DataTable 5a
Forest area (1000 hectares)Categories
1990 2000 2005 2010 2015
Protection of soiland water
125 286 586 177 598
... of whichproduction ofclean water
5 6 6 7 39
... of whichcoastalstabilization
0 0 0 0 0
... of whichdesertificationcontrol
50 60 65 70 33
... of whichavalanchecontrol
0 0 0 0 0
FRA 2015 – Country Report, Serbia
40
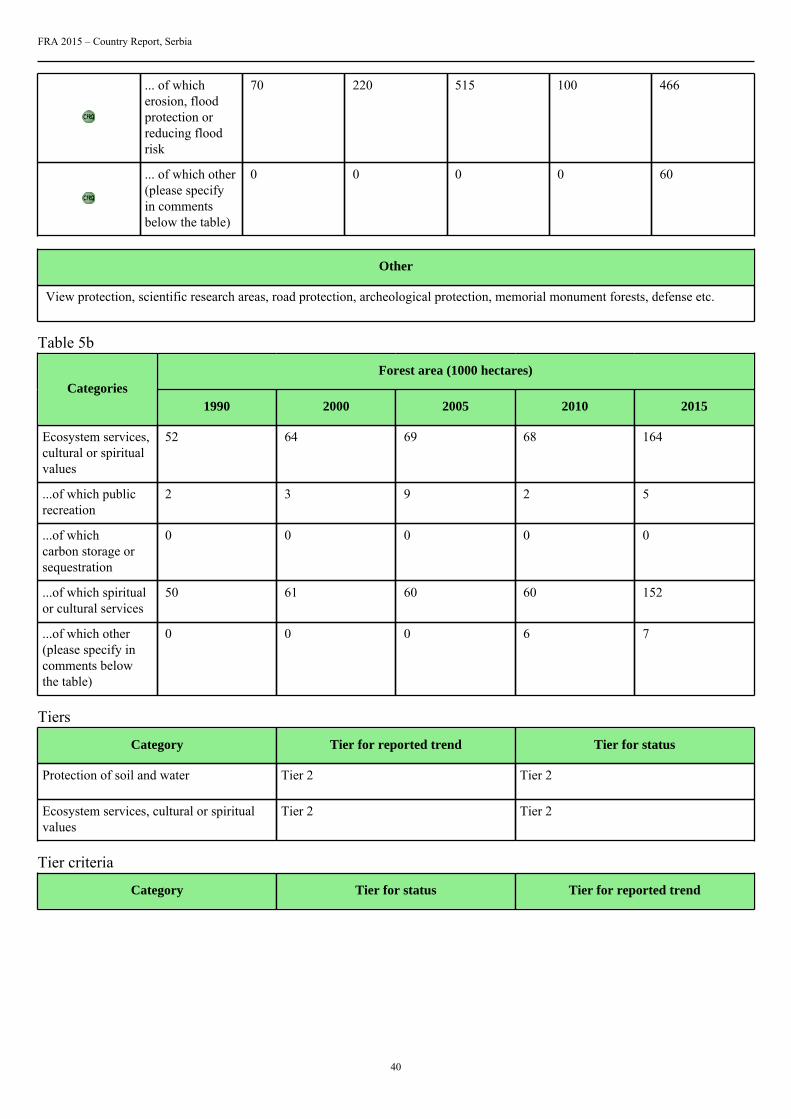
... of whicherosion, floodprotection orreducing floodrisk
70 220 515 100 466
... of which other(please specifyin commentsbelow the table)
0 0 0 0 60
Other
View protection, scientific research areas, road protection, archeological protection, memorial monument forests, defense etc.
Table 5b
Forest area (1000 hectares)Categories
1990 2000 2005 2010 2015
Ecosystem services,cultural or spiritualvalues
52 64 69 68 164
...of which publicrecreation
2 3 9 2 5
...of whichcarbon storage orsequestration
0 0 0 0 0
...of which spiritualor cultural services
50 61 60 60 152
...of which other(please specify incomments belowthe table)
0 0 0 6 7
Tiers
Category Tier for reported trend Tier for status
Protection of soil and water Tier 2 Tier 2
Ecosystem services, cultural or spiritualvalues
Tier 2 Tier 2
Tier criteria
Category Tier for status Tier for reported trend
FRA 2015 – Country Report, Serbia
41
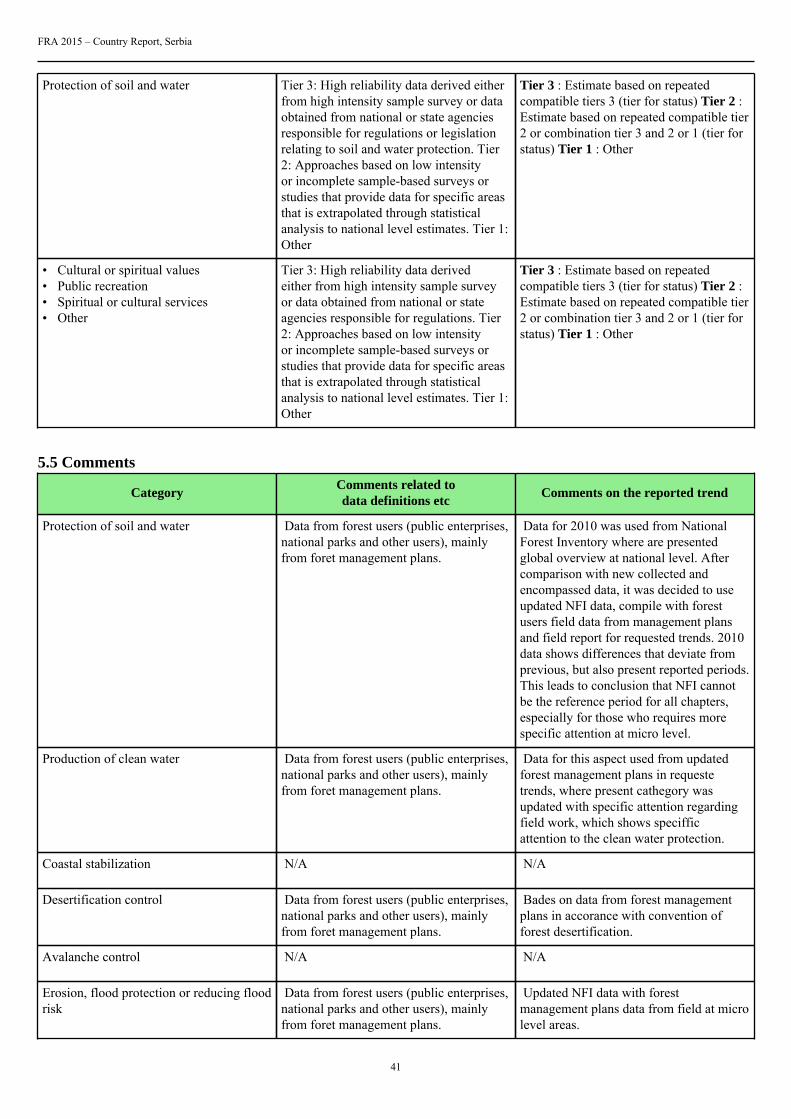
Protection of soil and water Tier 3: High reliability data derived eitherfrom high intensity sample survey or dataobtained from national or state agenciesresponsible for regulations or legislationrelating to soil and water protection. Tier2: Approaches based on low intensityor incomplete sample-based surveys orstudies that provide data for specific areasthat is extrapolated through statisticalanalysis to national level estimates. Tier 1:Other
Tier 3 : Estimate based on repeatedcompatible tiers 3 (tier for status) Tier 2 :Estimate based on repeated compatible tier2 or combination tier 3 and 2 or 1 (tier forstatus) Tier 1 : Other
• Cultural or spiritual values• Public recreation• Spiritual or cultural services• Other
Tier 3: High reliability data derivedeither from high intensity sample surveyor data obtained from national or stateagencies responsible for regulations. Tier2: Approaches based on low intensityor incomplete sample-based surveys orstudies that provide data for specific areasthat is extrapolated through statisticalanalysis to national level estimates. Tier 1:Other
Tier 3 : Estimate based on repeatedcompatible tiers 3 (tier for status) Tier 2 :Estimate based on repeated compatible tier2 or combination tier 3 and 2 or 1 (tier forstatus) Tier 1 : Other
5.5 Comments
CategoryComments related todata definitions etc
Comments on the reported trend
Protection of soil and water Data from forest users (public enterprises,national parks and other users), mainlyfrom foret management plans.
Data for 2010 was used from NationalForest Inventory where are presentedglobal overview at national level. Aftercomparison with new collected andencompassed data, it was decided to useupdated NFI data, compile with forestusers field data from management plansand field report for requested trends. 2010data shows differences that deviate fromprevious, but also present reported periods.This leads to conclusion that NFI cannotbe the reference period for all chapters,especially for those who requires morespecific attention at micro level.
Production of clean water Data from forest users (public enterprises,national parks and other users), mainlyfrom foret management plans.
Data for this aspect used from updatedforest management plans in requestetrends, where present cathegory wasupdated with specific attention regardingfield work, which shows specifficattention to the clean water protection.
Coastal stabilization N/A N/A
Desertification control Data from forest users (public enterprises,national parks and other users), mainlyfrom foret management plans.
Bades on data from forest managementplans in accorance with convention offorest desertification.
Avalanche control N/A N/A
Erosion, flood protection or reducing floodrisk
Data from forest users (public enterprises,national parks and other users), mainlyfrom foret management plans.
Updated NFI data with forestmanagement plans data from field at microlevel areas.
FRA 2015 – Country Report, Serbia
42
Other protective functions Data from forest users (public enterprises,national parks and other users), mainlyfrom foret management plans.
Updated NFI data with forestmanagement plans data from field at microlevel areas.
Ecosystem services, cultural or spiritualvalues
Data from forest users (public enterprises,national parks and other users), mainlyfrom foret management plans.
N/A
Public recreation Data from forest users (public enterprises,national parks and other users), mainlyfrom foret management plans.
Updated NFI data with forestmanagement plans data from field at microlevel areas.
Carbon storage or sequestration N/A N/A
Spiritual or cultural services Data from forest users (public enterprises,national parks and other users), mainlyfrom foret management plans.
Updated NFI data with forestmanagement plans data from field at microlevel areas.
Other ecosystem services Data from forest users (public enterprises,national parks and other users), mainlyfrom foret management plans.
Other services include areas for scientificresearch and educational purposes, as wellas other specific purposes like defense.
Other general comments to the table
View protection, scientific research areas, road protection, archeological protection, memorial monument forests, defense etc.
FRA 2015 – Country Report, Serbia
43
6. How much forest area is protected and designated for the conservation of biodiversityand how has it changed over time?Documents for this question:
• Guide for country reporting FRA 2015• FRA 2015 Terms and Definitions
6.1 Categories and definitions
Category Definition
Conservation ofbiodiversity
Forest area designated primarily for conservation of biological diversity. Includes but is not limited toareas designated for biodiversity conservation within the protected areas.
Forest area withinprotected areas
Forest area within formally established protected areas independently of the purpose for which theprotected areas were established.
6.2 National data
6.2.1 Data sources
References to sourcesof information
Variables Years Additional comments
1 FAOSTAT Forest cover, Forestplantations
2006, 2012 FRA 2010
2 State Statistical Office Forest cover and growingstock
1990, 2000, 2007-2012 Statistical Bulletin
3 Faculty of Forestry Designated purposes offorests
2004, 2010, 2012 Collection of availably datafrom forest managementplans
4 Public Enterprises Designated purposes offorests
2006, 2010-2012 Official data of two PE's, butfor some of main classes.
5 National Forest Inventory Designated forest functions 2008 N/A
6 National Parks Designated forest functions 2010-2012 Official data from forestmanagement plans
7 Nature Protection Service ofSerbia
Nature protection data base 2012 Official data
6.2.2 Classification and definitions
National class Definition
N/A See 4.2.2
N/A N/A
N/A N/A
N/A N/A
FRA 2015 – Country Report, Serbia
44
6.2.3 Original data
See 4.2.3
6.3 Analysis and processing of national data
6.3.1 Adjustment
6.3.2 Estimation and forecasting
6.3.3 Reclassification
6.4 DataTable 6
Forest area (000 hectares)Categories
1990 2000 2005 2010 2015
Conservation ofbiodiversity
123 125 128 126 163
Forest areawithin protectedareas
N/A 239 380 452 501
Tiers
Category Tier for status Tier for reported trend
Conservation of biodiversity Tier 3 Tier 3
Forest area within protected areas Tier 3 Tier 3
Tier criteria
Category Tier for status Tier for reported trend
• Conservation of biodiversity• Forests within protected areas
Tier 3: Data obtained from national orstate agencies responsible for conservationand protected area or legislation relatingto area protection. Tier 2: Studies thatprovide data for specific areas that isextrapolated through statistical analysis tonational level estimates Tier 1 Other
Tier 3 : Estimate based on repeatedcompatible tiers 3 (tier for status) Tier 2 :Estimate based on repeated compatible tier2 or combination tier 3 and 2 or 1 (tier forstatus) Tier 1 : Other
FRA 2015 – Country Report, Serbia
45
6.5 Comments
CategoryComments related todata definitions etc
Comments on the reported trend
Conservation of biodiversity Regarding to Law on Nature Protection,there are three levels/degrees of natureprotection, while biodiversity conservationis achieved in 1st and 2nd degrees.
Reported trend for the 2015 continue lastreporting period (2010).
Forest area within protected areas Data used from public forest enterprisesand national parks.
Reported trend for the 2015 continue lastreporting period (2010).
Other general comments to the table
Basis for reporting year/period 2015 is compilation data from different sources (statistical office, public enterptises, national parks,nature protection service and NFI). Qualification of specific functional purposes was done according to the spatial disposal anddefine categorisation, using more strict criteria Available data from Kosovo and Metohija used from forest inventory in 2002 and2012, together with other strategic publications, additionally with expert estimation.
FRA 2015 – Country Report, Serbia
46
7. What is the area of forest affected by woody invasive species?Documents for this question:
• Guide for country reporting FRA 2015• FRA 2015 Terms and Definitions
7.1 Categories and definitions
Category Definition
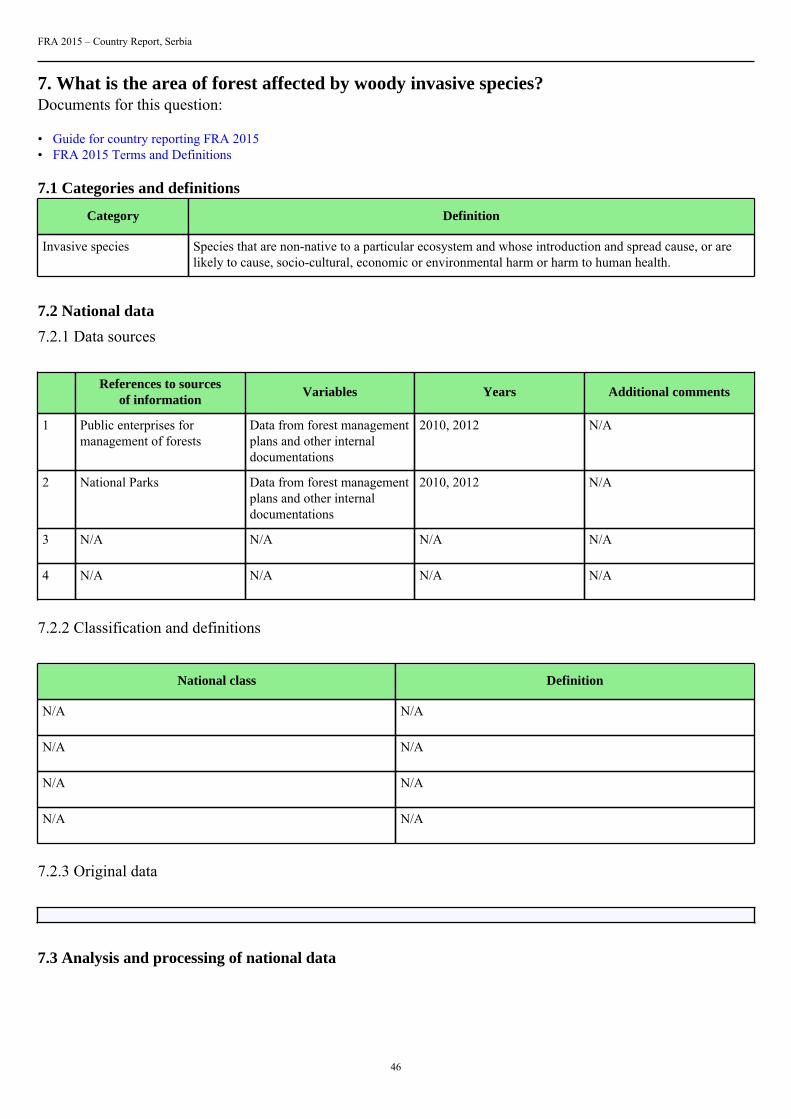
Invasive species Species that are non-native to a particular ecosystem and whose introduction and spread cause, or arelikely to cause, socio-cultural, economic or environmental harm or harm to human health.
7.2 National data
7.2.1 Data sources
References to sourcesof information
Variables Years Additional comments
1 Public enterprises formanagement of forests
Data from forest managementplans and other internaldocumentations
2010, 2012 N/A
2 National Parks Data from forest managementplans and other internaldocumentations
2010, 2012 N/A
3 N/A N/A N/A N/A
4 N/A N/A N/A N/A
7.2.2 Classification and definitions
National class Definition
N/A N/A
N/A N/A
N/A N/A
N/A N/A
7.2.3 Original data
7.3 Analysis and processing of national data
FRA 2015 – Country Report, Serbia
47
7.3.1 Adjustment
7.3.2 Estimation and forecasting
7.3.3 Reclassification
7.4 DataTable 7
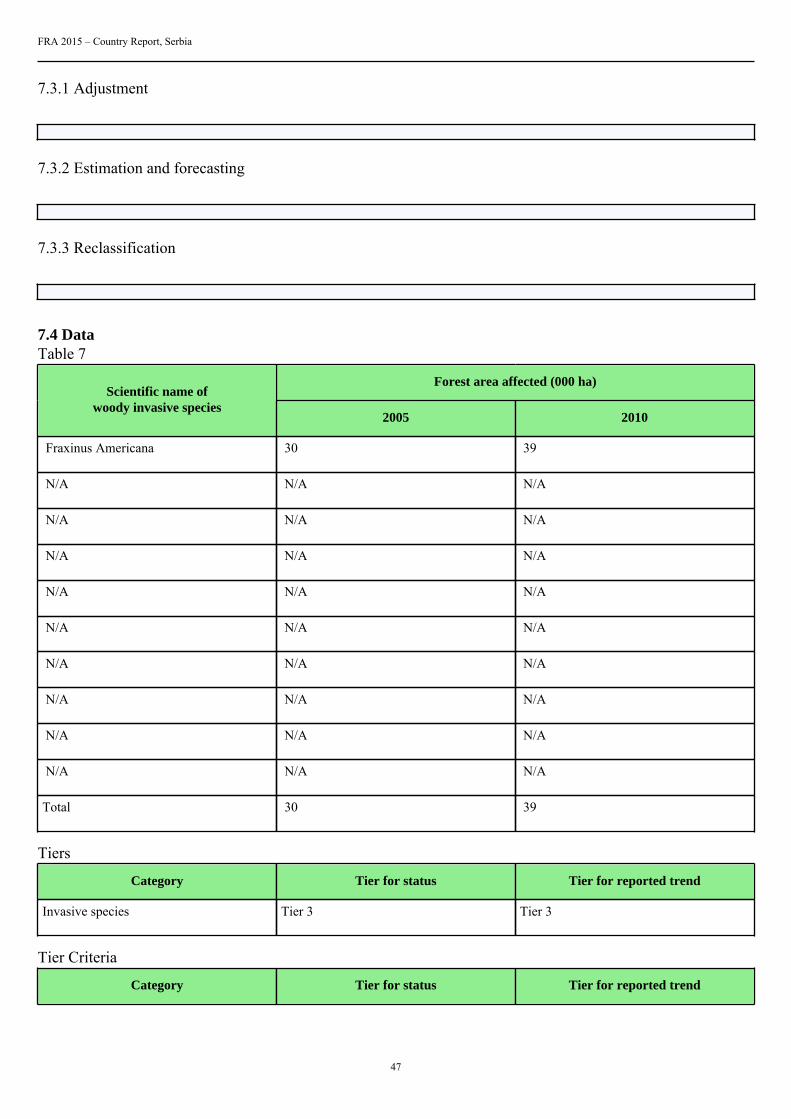
Forest area affected (000 ha)Scientific name of
woody invasive species2005 2010
Fraxinus Americana 30 39
N/A N/A N/A
N/A N/A N/A
N/A N/A N/A
N/A N/A N/A
N/A N/A N/A
N/A N/A N/A
N/A N/A N/A
N/A N/A N/A
N/A N/A N/A
Total 30 39
Tiers
Category Tier for status Tier for reported trend
Invasive species Tier 3 Tier 3
Tier Criteria
Category Tier for status Tier for reported trend
FRA 2015 – Country Report, Serbia
48
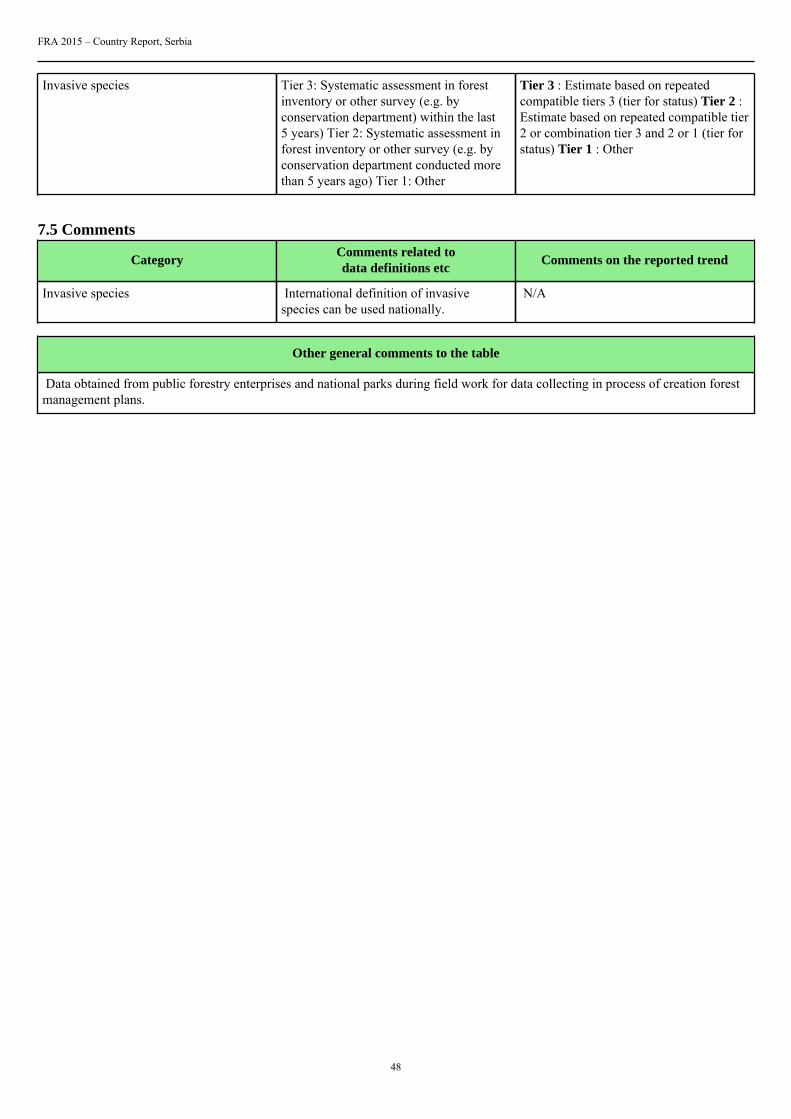
Invasive species Tier 3: Systematic assessment in forestinventory or other survey (e.g. byconservation department) within the last5 years) Tier 2: Systematic assessment inforest inventory or other survey (e.g. byconservation department conducted morethan 5 years ago) Tier 1: Other
Tier 3 : Estimate based on repeatedcompatible tiers 3 (tier for status) Tier 2 :Estimate based on repeated compatible tier2 or combination tier 3 and 2 or 1 (tier forstatus) Tier 1 : Other
7.5 Comments
CategoryComments related todata definitions etc
Comments on the reported trend
Invasive species International definition of invasivespecies can be used nationally.
N/A
Other general comments to the table
Data obtained from public forestry enterprises and national parks during field work for data collecting in process of creation forestmanagement plans.
FRA 2015 – Country Report, Serbia
49
8. How much forest area is damaged each year?Documents for this question:
• Guide for country reporting FRA 2015• FRA 2015 Terms and Definitions
8.1 Categories and definitions
Category Definition
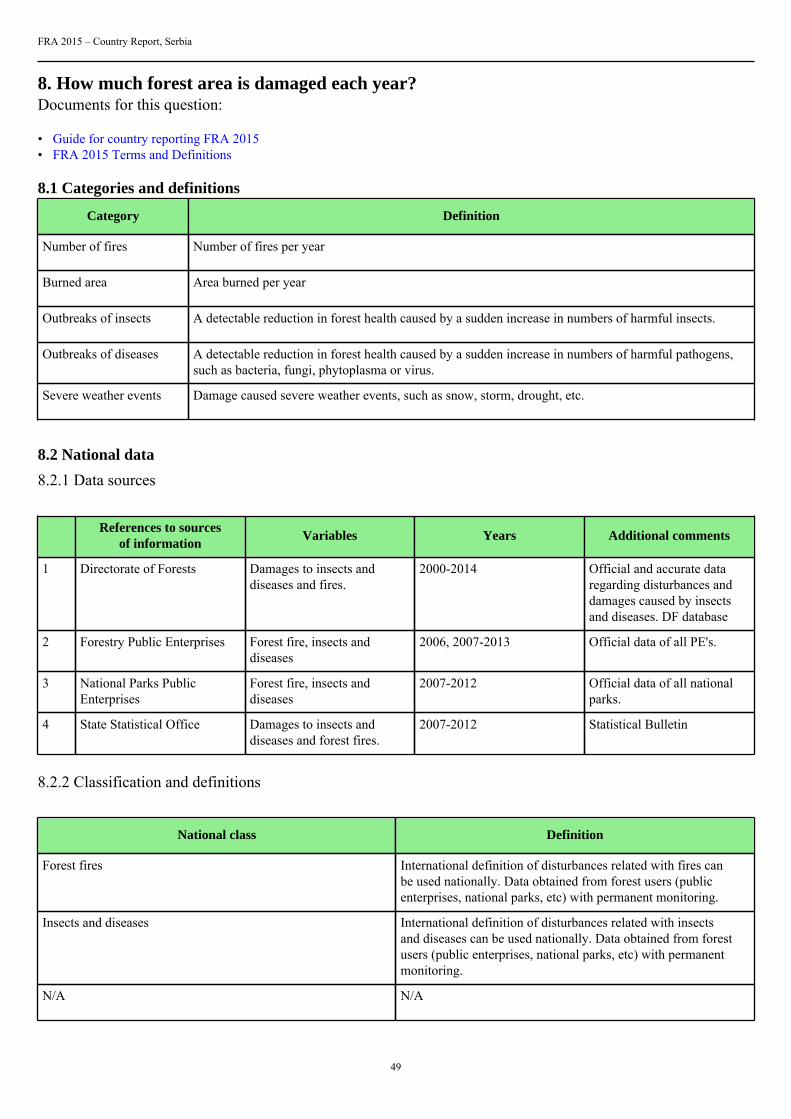
Number of fires Number of fires per year
Burned area Area burned per year
Outbreaks of insects A detectable reduction in forest health caused by a sudden increase in numbers of harmful insects.
Outbreaks of diseases A detectable reduction in forest health caused by a sudden increase in numbers of harmful pathogens,such as bacteria, fungi, phytoplasma or virus.
Severe weather events Damage caused severe weather events, such as snow, storm, drought, etc.
8.2 National data
8.2.1 Data sources
References to sourcesof information
Variables Years Additional comments
1 Directorate of Forests Damages to insects anddiseases and fires.
2000-2014 Official and accurate dataregarding disturbances anddamages caused by insectsand diseases. DF database
2 Forestry Public Enterprises Forest fire, insects anddiseases
2006, 2007-2013 Official data of all PE's.
3 National Parks PublicEnterprises
Forest fire, insects anddiseases
2007-2012 Official data of all nationalparks.
4 State Statistical Office Damages to insects anddiseases and forest fires.
2007-2012 Statistical Bulletin
8.2.2 Classification and definitions
National class Definition
Forest fires International definition of disturbances related with fires canbe used nationally. Data obtained from forest users (publicenterprises, national parks, etc) with permanent monitoring.
Insects and diseases International definition of disturbances related with insectsand diseases can be used nationally. Data obtained from forestusers (public enterprises, national parks, etc) with permanentmonitoring.
N/A N/A
FRA 2015 – Country Report, Serbia
50
N/A N/A
8.2.3 Original data
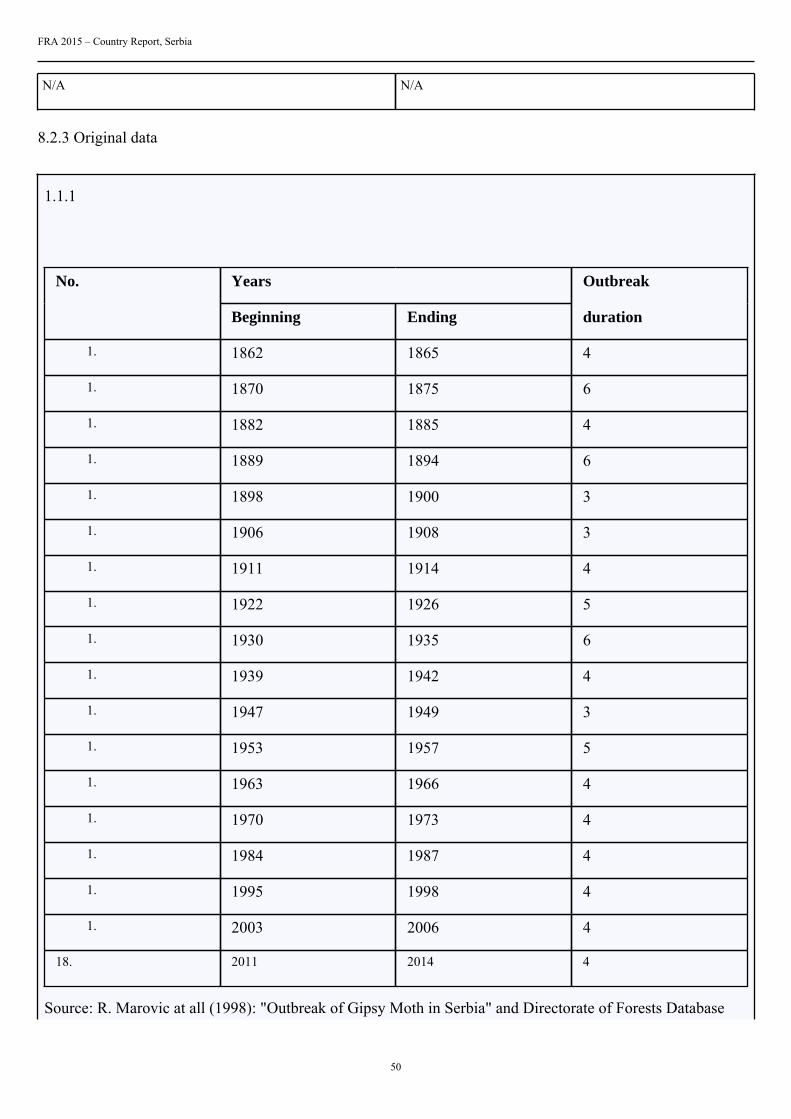
1.1.1
YearsNo.
Beginning Ending
Outbreak
duration
1. 1862 1865 4
1. 1870 1875 6
1. 1882 1885 4
1. 1889 1894 6
1. 1898 1900 3
1. 1906 1908 3
1. 1911 1914 4
1. 1922 1926 5
1. 1930 1935 6
1. 1939 1942 4
1. 1947 1949 3
1. 1953 1957 5
1. 1963 1966 4
1. 1970 1973 4
1. 1984 1987 4
1. 1995 1998 4
1. 2003 2006 4
18. 2011 2014 4
Source: R. Marovic at all (1998): "Outbreak of Gipsy Moth in Serbia" and Directorate of Forests Database
FRA 2015 – Country Report, Serbia
51
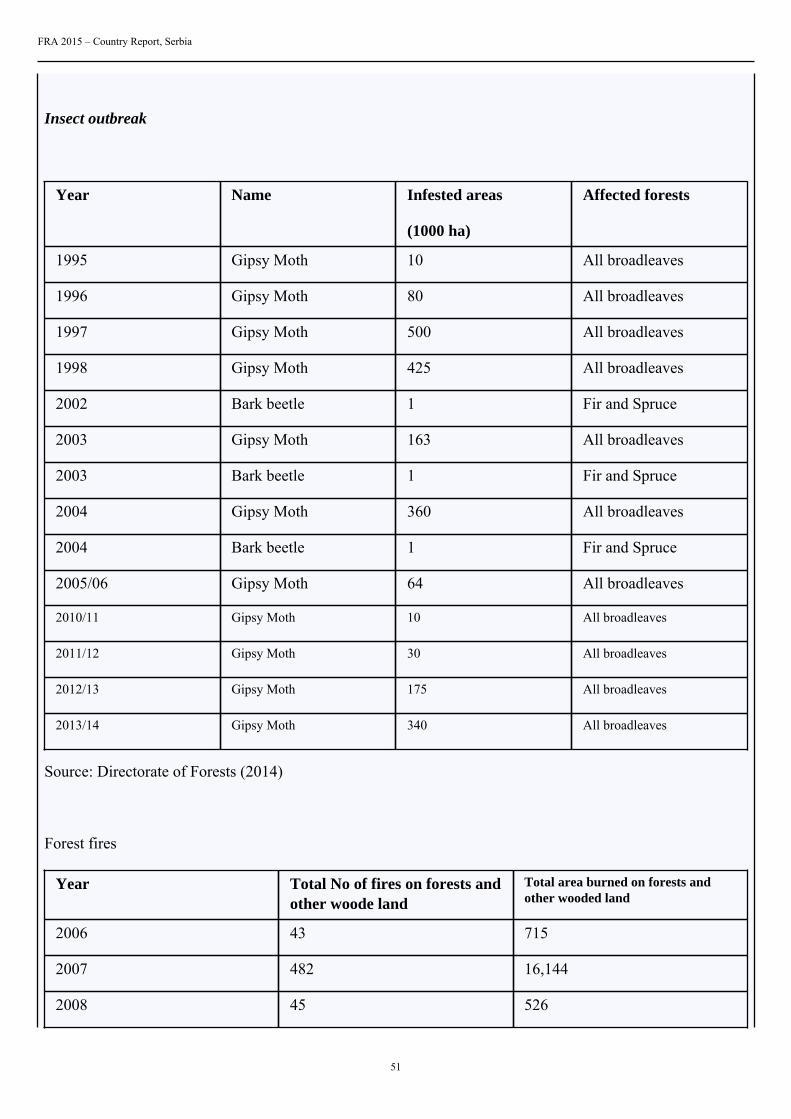
Insect outbreak
Year Name Infested areas
(1000 ha)
Affected forests
1995 Gipsy Moth 10 All broadleaves
1996 Gipsy Moth 80 All broadleaves
1997 Gipsy Moth 500 All broadleaves
1998 Gipsy Moth 425 All broadleaves
2002 Bark beetle 1 Fir and Spruce
2003 Gipsy Moth 163 All broadleaves
2003 Bark beetle 1 Fir and Spruce
2004 Gipsy Moth 360 All broadleaves
2004 Bark beetle 1 Fir and Spruce
2005/06 Gipsy Moth 64 All broadleaves
2010/11 Gipsy Moth 10 All broadleaves
2011/12 Gipsy Moth 30 All broadleaves
2012/13 Gipsy Moth 175 All broadleaves
2013/14 Gipsy Moth 340 All broadleaves
Source: Directorate of Forests (2014)
Forest fires
Year Total No of fires on forests andother woode land
Total area burned on forests andother wooded land
2006 43 715
2007 482 16,144
2008 45 526
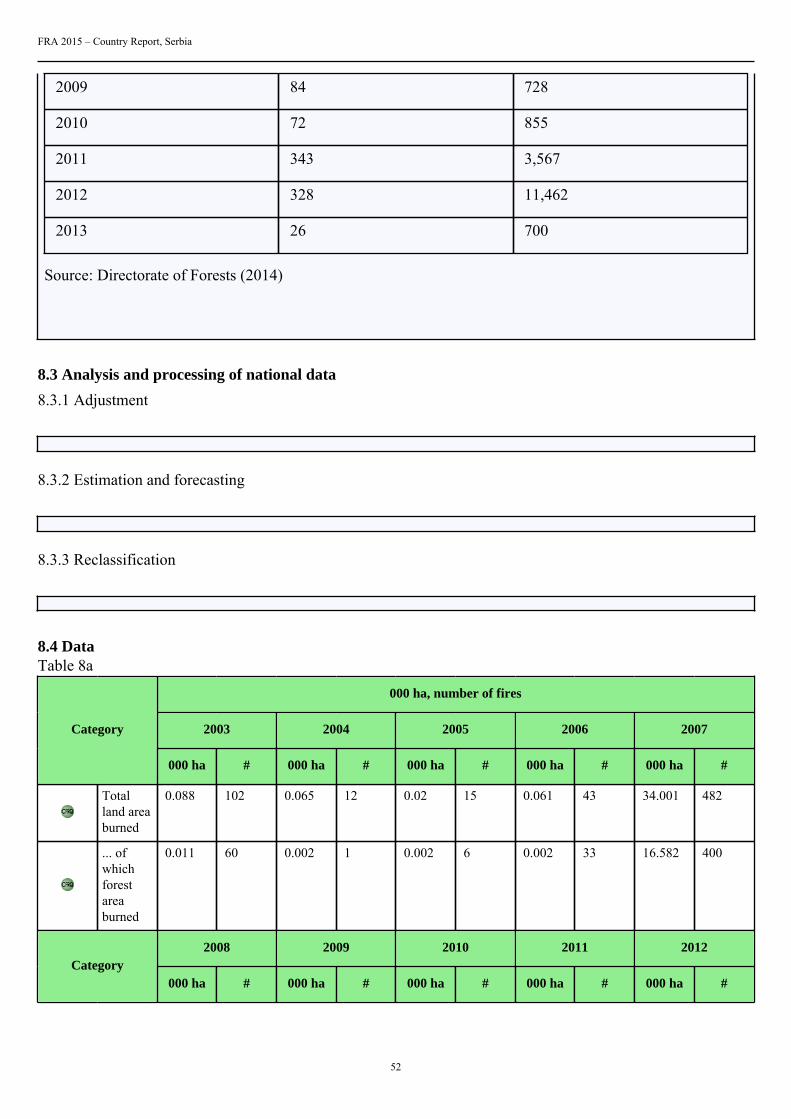
FRA 2015 – Country Report, Serbia
52
2009 84 728
2010 72 855
2011 343 3,567
2012 328 11,462
2013 26 700
Source: Directorate of Forests (2014)
8.3 Analysis and processing of national data
8.3.1 Adjustment
8.3.2 Estimation and forecasting
8.3.3 Reclassification
8.4 DataTable 8a
000 ha, number of fires
2003 2004 2005 2006 2007Category
000 ha # 000 ha # 000 ha # 000 ha # 000 ha #
Totalland areaburned
0.088 102 0.065 12 0.02 15 0.061 43 34.001 482
... ofwhichforestareaburned
0.011 60 0.002 1 0.002 6 0.002 33 16.582 400
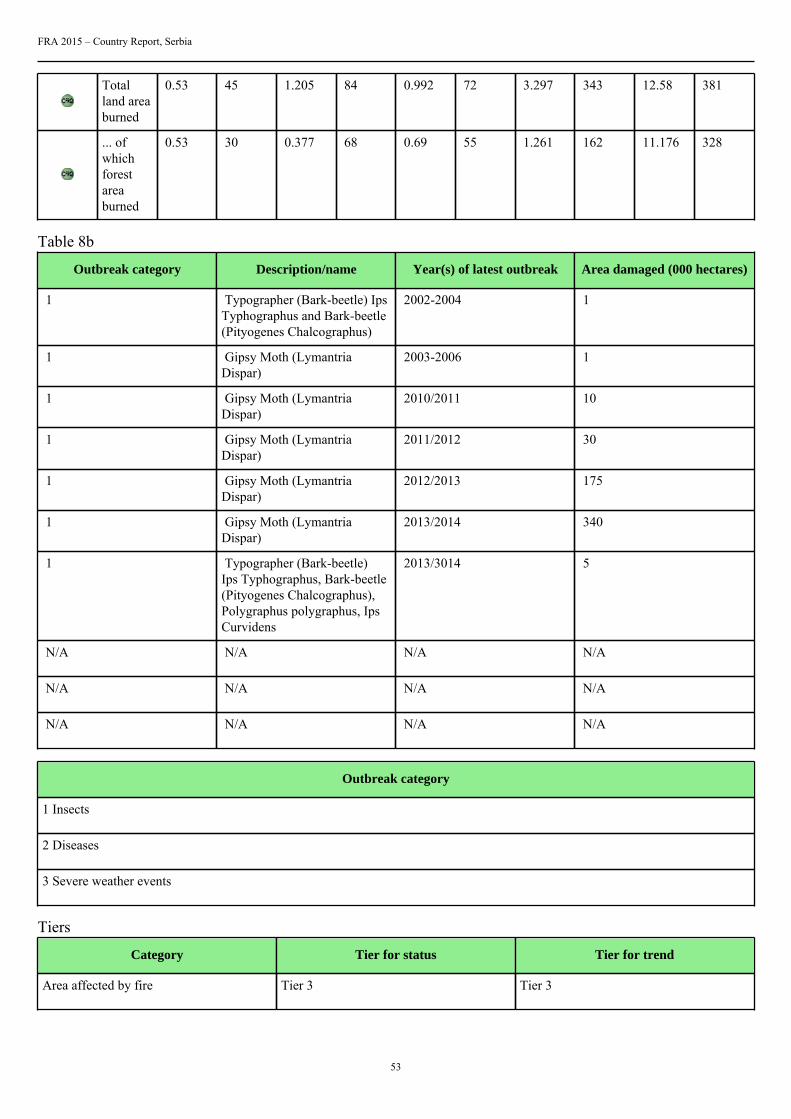
2008 2009 2010 2011 2012Category
000 ha # 000 ha # 000 ha # 000 ha # 000 ha #
FRA 2015 – Country Report, Serbia
53
Totalland areaburned
0.53 45 1.205 84 0.992 72 3.297 343 12.58 381
... ofwhichforestareaburned
0.53 30 0.377 68 0.69 55 1.261 162 11.176 328
Table 8b
Outbreak category Description/name Year(s) of latest outbreak Area damaged (000 hectares)
1 Typographer (Bark-beetle) IpsTyphographus and Bark-beetle(Pityogenes Chalcographus)
2002-2004 1
1 Gipsy Moth (LymantriaDispar)
2003-2006 1
1 Gipsy Moth (LymantriaDispar)
2010/2011 10
1 Gipsy Moth (LymantriaDispar)
2011/2012 30
1 Gipsy Moth (LymantriaDispar)
2012/2013 175
1 Gipsy Moth (LymantriaDispar)
2013/2014 340
1 Typographer (Bark-beetle)Ips Typhographus, Bark-beetle(Pityogenes Chalcographus),Polygraphus polygraphus, IpsCurvidens
2013/3014 5
N/A N/A N/A N/A
N/A N/A N/A N/A
N/A N/A N/A N/A
Outbreak category
1 Insects
2 Diseases
3 Severe weather events
Tiers
Category Tier for status Tier for trend
Area affected by fire Tier 3 Tier 3
FRA 2015 – Country Report, Serbia
54
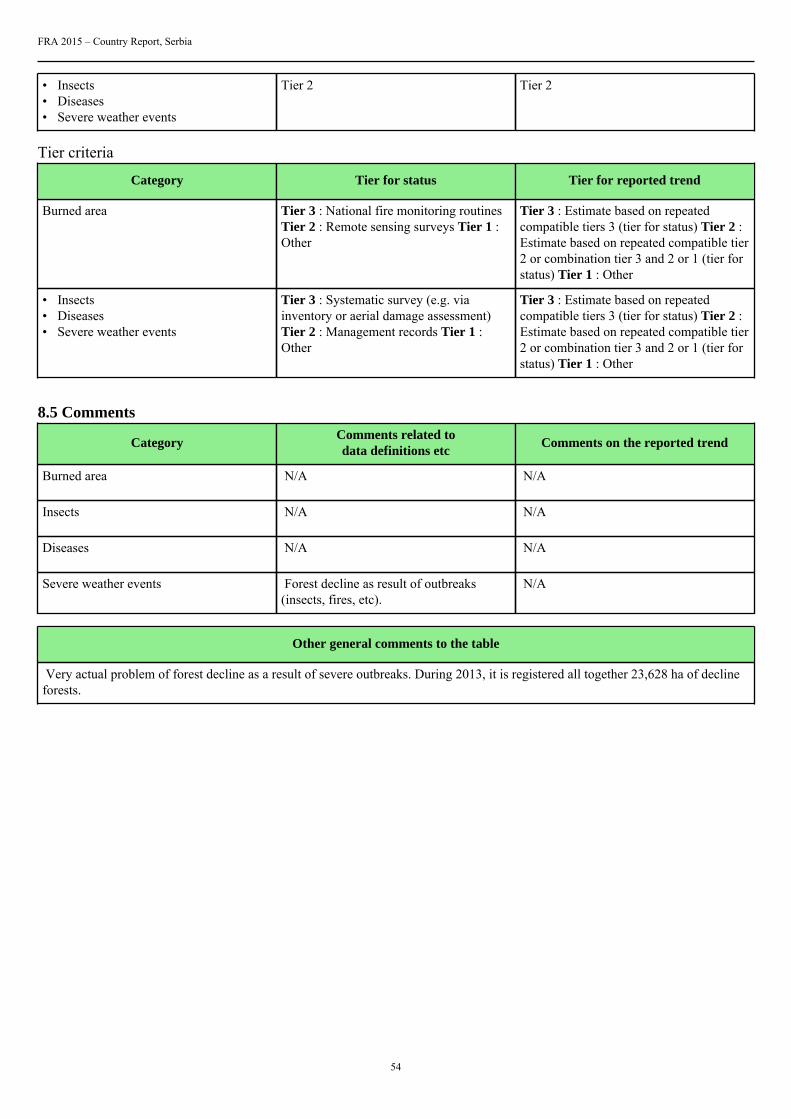
• Insects• Diseases• Severe weather events
Tier 2 Tier 2
Tier criteria
Category Tier for status Tier for reported trend
Burned area Tier 3 : National fire monitoring routinesTier 2 : Remote sensing surveys Tier 1 :Other
Tier 3 : Estimate based on repeatedcompatible tiers 3 (tier for status) Tier 2 :Estimate based on repeated compatible tier2 or combination tier 3 and 2 or 1 (tier forstatus) Tier 1 : Other
• Insects• Diseases• Severe weather events
Tier 3 : Systematic survey (e.g. viainventory or aerial damage assessment)Tier 2 : Management records Tier 1 :Other
Tier 3 : Estimate based on repeatedcompatible tiers 3 (tier for status) Tier 2 :Estimate based on repeated compatible tier2 or combination tier 3 and 2 or 1 (tier forstatus) Tier 1 : Other
8.5 Comments
CategoryComments related todata definitions etc
Comments on the reported trend
Burned area N/A N/A
Insects N/A N/A
Diseases N/A N/A
Severe weather events Forest decline as result of outbreaks(insects, fires, etc).
N/A
Other general comments to the table
Very actual problem of forest decline as a result of severe outbreaks. During 2013, it is registered all together 23,628 ha of declineforests.
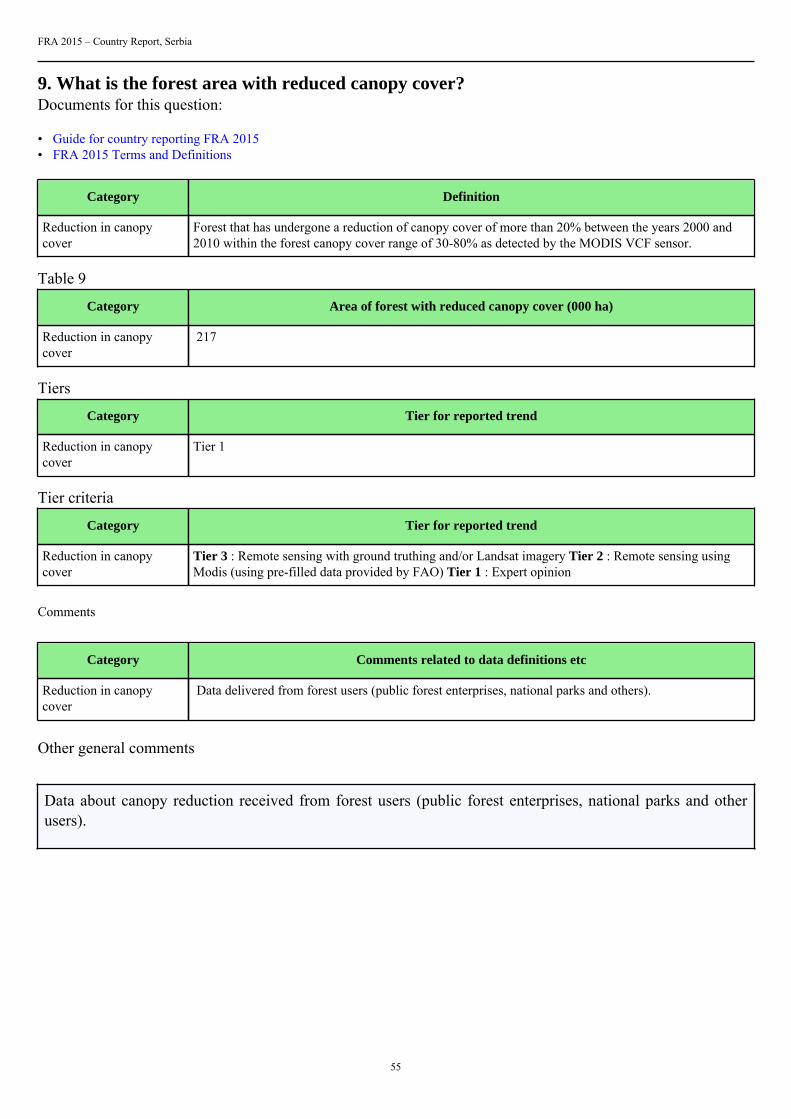
FRA 2015 – Country Report, Serbia
55
9. What is the forest area with reduced canopy cover?Documents for this question:
• Guide for country reporting FRA 2015• FRA 2015 Terms and Definitions
Category Definition
Reduction in canopycover
Forest that has undergone a reduction of canopy cover of more than 20% between the years 2000 and2010 within the forest canopy cover range of 30-80% as detected by the MODIS VCF sensor.
Table 9
Category Area of forest with reduced canopy cover (000 ha)
Reduction in canopycover
217
Tiers
Category Tier for reported trend
Reduction in canopycover
Tier 1
Tier criteria
Category Tier for reported trend
Reduction in canopycover
Tier 3 : Remote sensing with ground truthing and/or Landsat imagery Tier 2 : Remote sensing usingModis (using pre-filled data provided by FAO) Tier 1 : Expert opinion
Comments
Category Comments related to data definitions etc
Reduction in canopycover
Data delivered from forest users (public forest enterprises, national parks and others).
Other general comments
Data about canopy reduction received from forest users (public forest enterprises, national parks and otherusers).
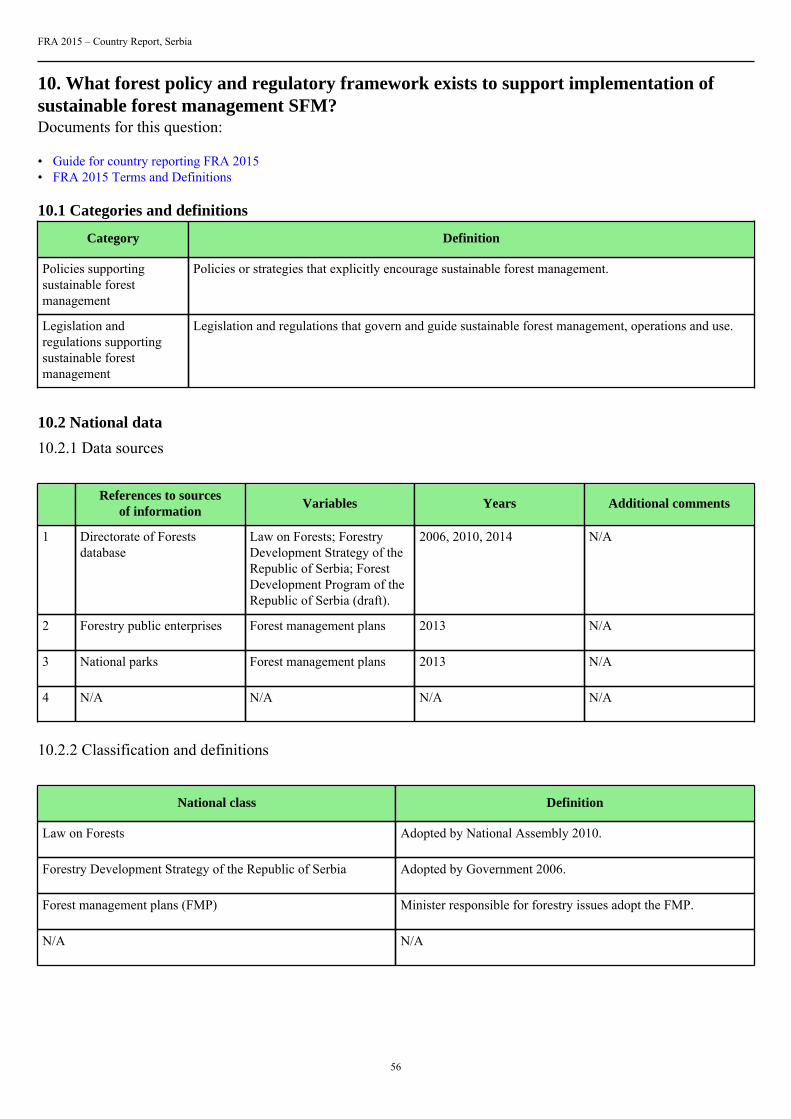
FRA 2015 – Country Report, Serbia
56
10. What forest policy and regulatory framework exists to support implementation ofsustainable forest management SFM?Documents for this question:
• Guide for country reporting FRA 2015• FRA 2015 Terms and Definitions
10.1 Categories and definitions
Category Definition
Policies supportingsustainable forestmanagement
Policies or strategies that explicitly encourage sustainable forest management.
Legislation andregulations supportingsustainable forestmanagement
Legislation and regulations that govern and guide sustainable forest management, operations and use.
10.2 National data
10.2.1 Data sources
References to sourcesof information
Variables Years Additional comments
1 Directorate of Forestsdatabase
Law on Forests; ForestryDevelopment Strategy of theRepublic of Serbia; ForestDevelopment Program of theRepublic of Serbia (draft).
2006, 2010, 2014 N/A
2 Forestry public enterprises Forest management plans 2013 N/A
3 National parks Forest management plans 2013 N/A
4 N/A N/A N/A N/A
10.2.2 Classification and definitions
National class Definition
Law on Forests Adopted by National Assembly 2010.
Forestry Development Strategy of the Republic of Serbia Adopted by Government 2006.
Forest management plans (FMP) Minister responsible for forestry issues adopt the FMP.
N/A N/A
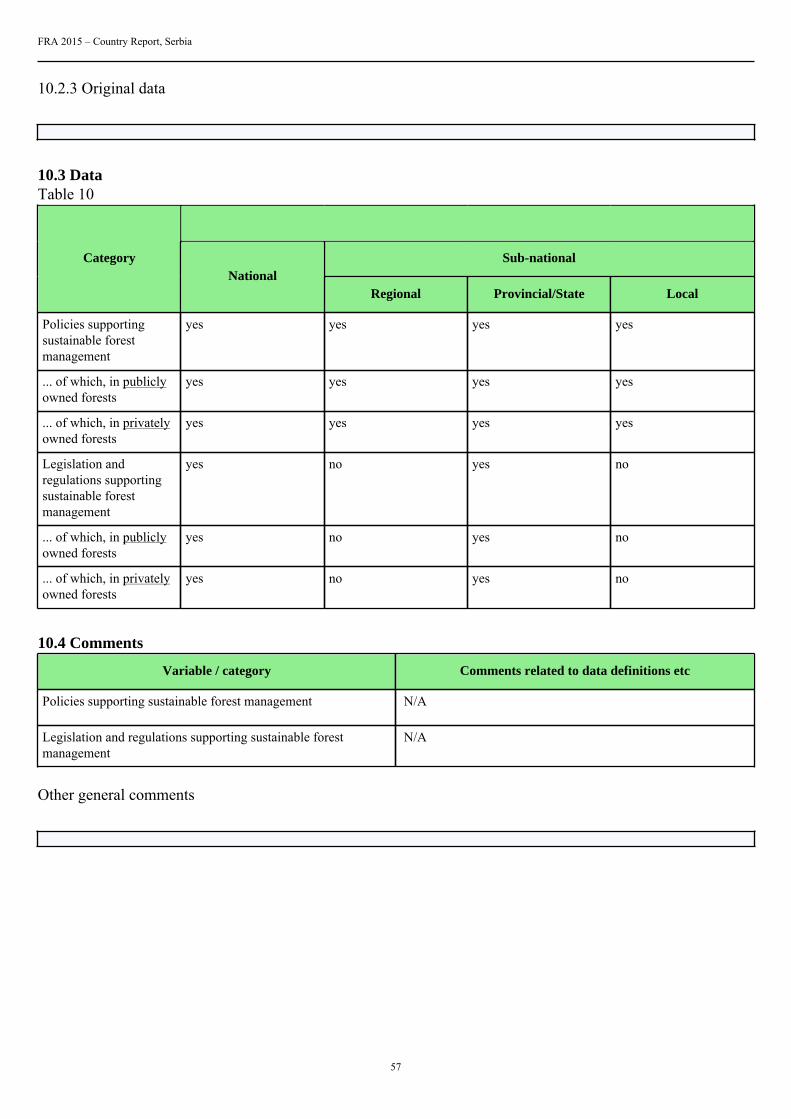
FRA 2015 – Country Report, Serbia
57
10.2.3 Original data
10.3 DataTable 10
Sub-nationalCategoryNational
Regional Provincial/State Local
Policies supportingsustainable forestmanagement
yes yes yes yes
... of which, in publiclyowned forests
yes yes yes yes
... of which, in privatelyowned forests
yes yes yes yes
Legislation andregulations supportingsustainable forestmanagement
yes no yes no
... of which, in publiclyowned forests
yes no yes no
... of which, in privatelyowned forests
yes no yes no
10.4 Comments
Variable / category Comments related to data definitions etc
Policies supporting sustainable forest management N/A
Legislation and regulations supporting sustainable forestmanagement
N/A
Other general comments
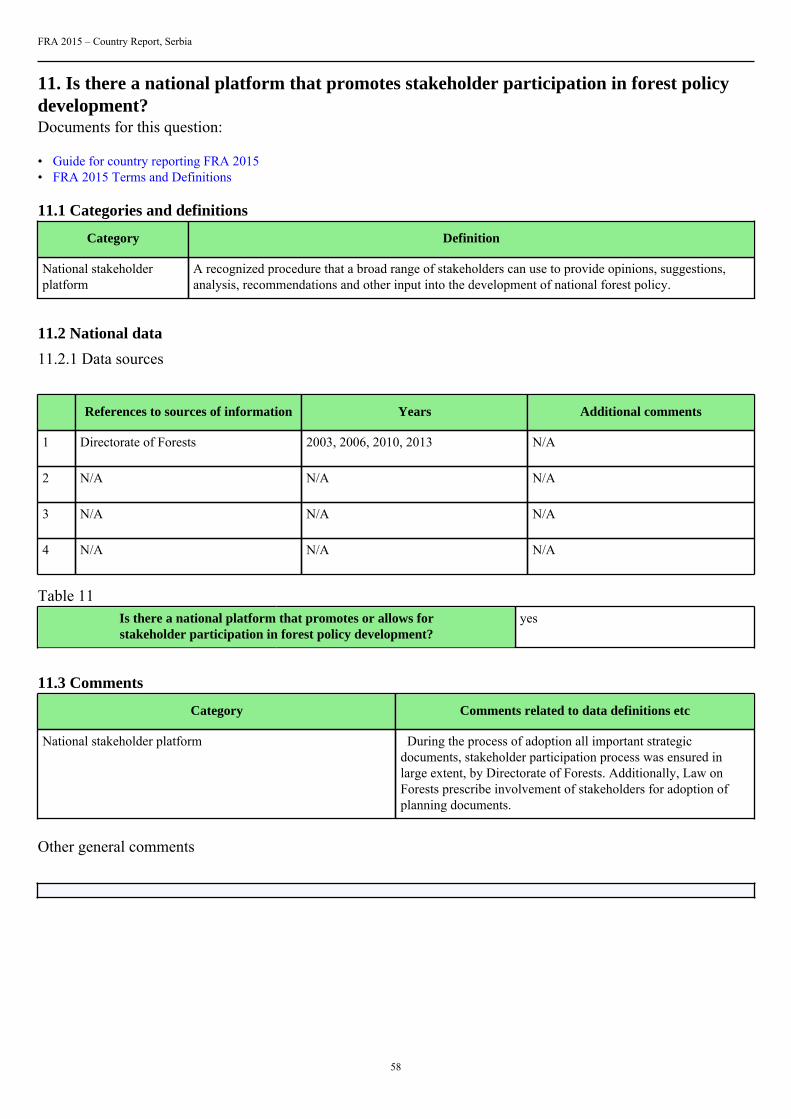
FRA 2015 – Country Report, Serbia
58
11. Is there a national platform that promotes stakeholder participation in forest policydevelopment?Documents for this question:
• Guide for country reporting FRA 2015• FRA 2015 Terms and Definitions
11.1 Categories and definitions
Category Definition
National stakeholderplatform
A recognized procedure that a broad range of stakeholders can use to provide opinions, suggestions,analysis, recommendations and other input into the development of national forest policy.
11.2 National data
11.2.1 Data sources
References to sources of information Years Additional comments
1 Directorate of Forests 2003, 2006, 2010, 2013 N/A
2 N/A N/A N/A
3 N/A N/A N/A
4 N/A N/A N/A
Table 11Is there a national platform that promotes or allows forstakeholder participation in forest policy development?
yes
11.3 Comments
Category Comments related to data definitions etc
National stakeholder platform During the process of adoption all important strategicdocuments, stakeholder participation process was ensured inlarge extent, by Directorate of Forests. Additionally, Law onForests prescribe involvement of stakeholders for adoption ofplanning documents.
Other general comments
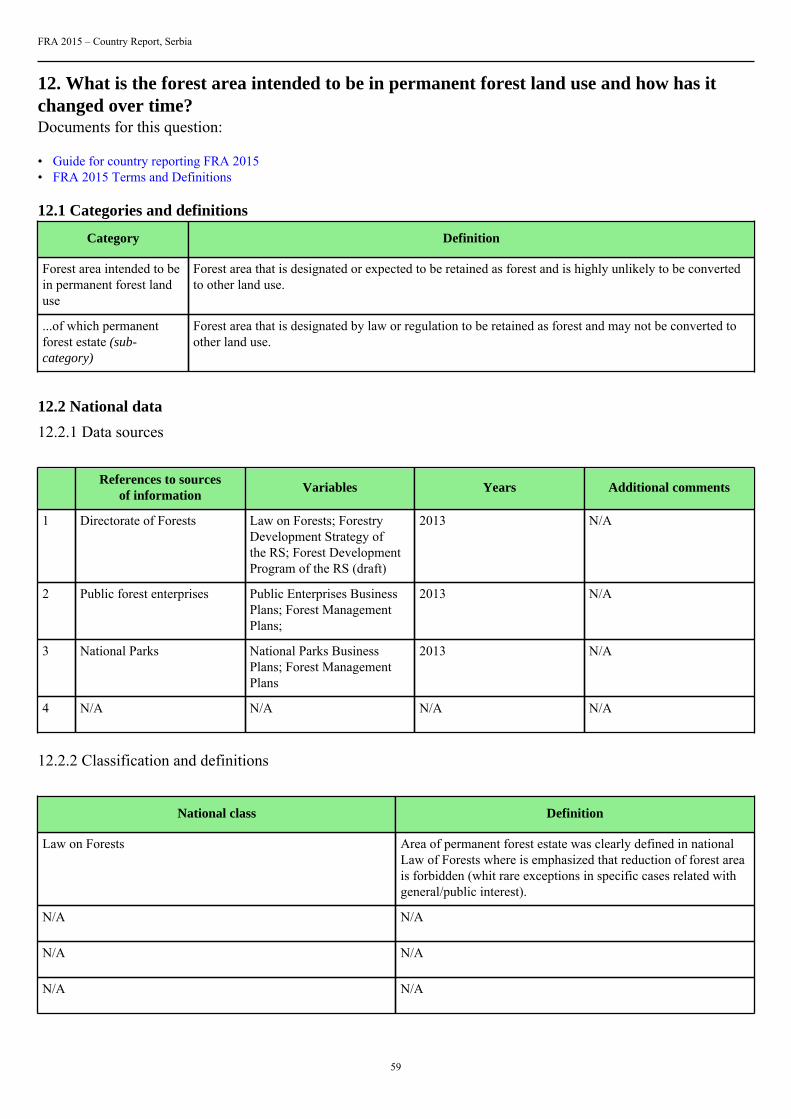
FRA 2015 – Country Report, Serbia
59
12. What is the forest area intended to be in permanent forest land use and how has itchanged over time?Documents for this question:
• Guide for country reporting FRA 2015• FRA 2015 Terms and Definitions
12.1 Categories and definitions
Category Definition
Forest area intended to bein permanent forest landuse
Forest area that is designated or expected to be retained as forest and is highly unlikely to be convertedto other land use.
...of which permanentforest estate (sub-category)
Forest area that is designated by law or regulation to be retained as forest and may not be converted toother land use.
12.2 National data
12.2.1 Data sources
References to sourcesof information
Variables Years Additional comments
1 Directorate of Forests Law on Forests; ForestryDevelopment Strategy ofthe RS; Forest DevelopmentProgram of the RS (draft)
2013 N/A
2 Public forest enterprises Public Enterprises BusinessPlans; Forest ManagementPlans;
2013 N/A
3 National Parks National Parks BusinessPlans; Forest ManagementPlans
2013 N/A
4 N/A N/A N/A N/A
12.2.2 Classification and definitions
National class Definition
Law on Forests Area of permanent forest estate was clearly defined in nationalLaw of Forests where is emphasized that reduction of forest areais forbidden (whit rare exceptions in specific cases related withgeneral/public interest).
N/A N/A
N/A N/A
N/A N/A
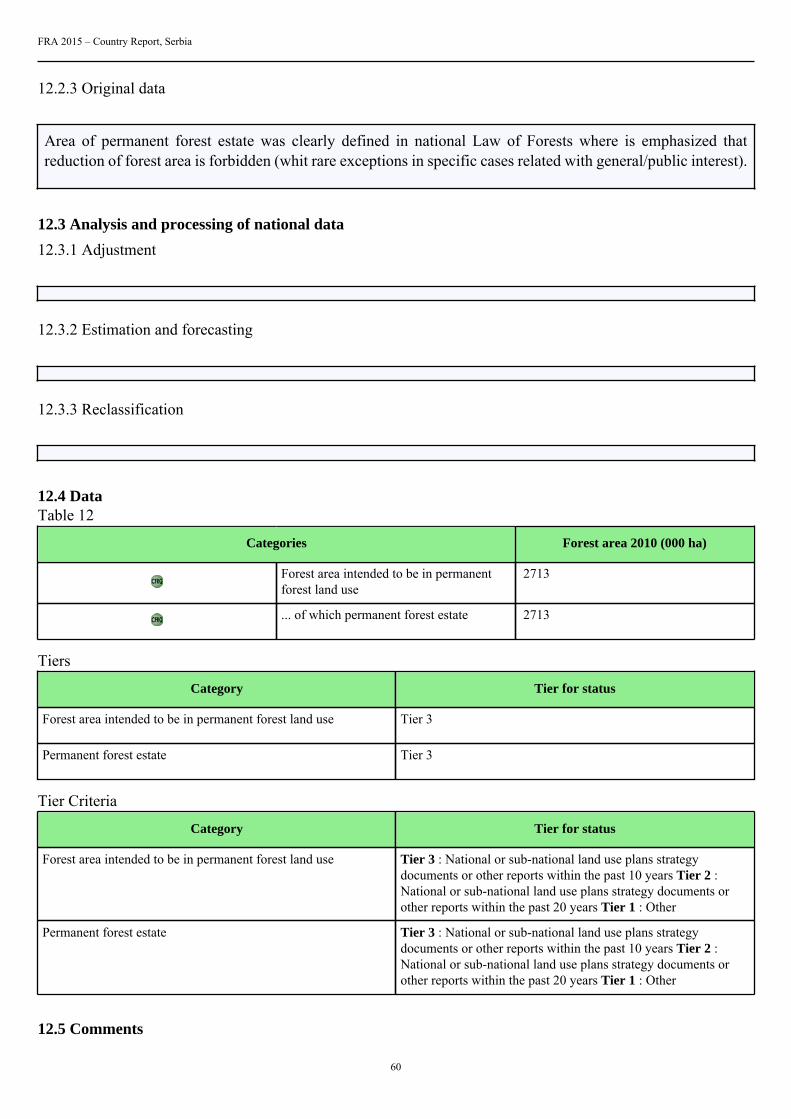
FRA 2015 – Country Report, Serbia
60
12.2.3 Original data
Area of permanent forest estate was clearly defined in national Law of Forests where is emphasized thatreduction of forest area is forbidden (whit rare exceptions in specific cases related with general/public interest).
12.3 Analysis and processing of national data
12.3.1 Adjustment
12.3.2 Estimation and forecasting
12.3.3 Reclassification
12.4 DataTable 12
Categories Forest area 2010 (000 ha)
Forest area intended to be in permanentforest land use
2713
... of which permanent forest estate 2713
Tiers
Category Tier for status
Forest area intended to be in permanent forest land use Tier 3
Permanent forest estate Tier 3
Tier Criteria
Category Tier for status
Forest area intended to be in permanent forest land use Tier 3 : National or sub-national land use plans strategydocuments or other reports within the past 10 years Tier 2 :National or sub-national land use plans strategy documents orother reports within the past 20 years Tier 1 : Other
Permanent forest estate Tier 3 : National or sub-national land use plans strategydocuments or other reports within the past 10 years Tier 2 :National or sub-national land use plans strategy documents orother reports within the past 20 years Tier 1 : Other
12.5 Comments

FRA 2015 – Country Report, Serbia
61
Category Comments related to data definitions etc
Forest area intended to be in permanent forest land use Law on Forests and strategic forestry documents indicate thatforest areas cannot be reduce.
Permanent forest estate Area of permanent forest estate was clearly defined in nationalLaw of Forests where is emphasized that reduction of forest areais forbidden (whit rare exceptions in specific cases related withgeneral/public interest).
Other general comments
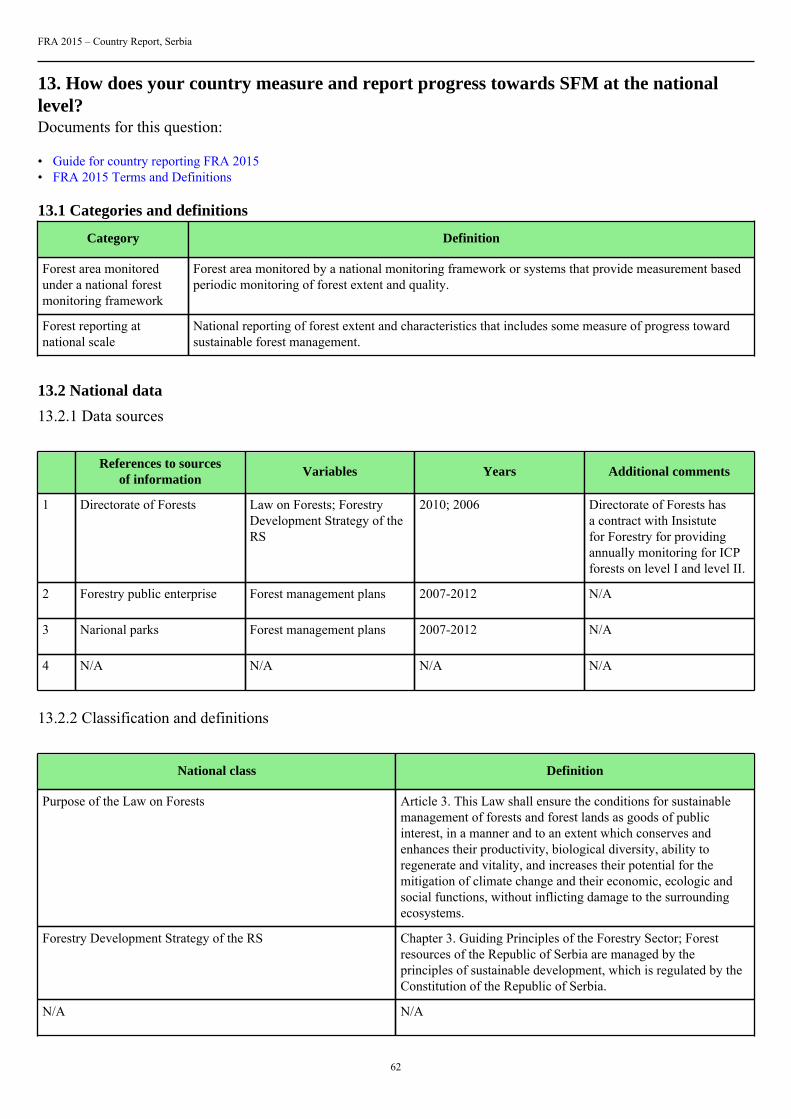
FRA 2015 – Country Report, Serbia
62
13. How does your country measure and report progress towards SFM at the nationallevel?Documents for this question:
• Guide for country reporting FRA 2015• FRA 2015 Terms and Definitions
13.1 Categories and definitions
Category Definition
Forest area monitoredunder a national forestmonitoring framework
Forest area monitored by a national monitoring framework or systems that provide measurement basedperiodic monitoring of forest extent and quality.
Forest reporting atnational scale
National reporting of forest extent and characteristics that includes some measure of progress towardsustainable forest management.
13.2 National data
13.2.1 Data sources
References to sourcesof information
Variables Years Additional comments
1 Directorate of Forests Law on Forests; ForestryDevelopment Strategy of theRS
2010; 2006 Directorate of Forests hasa contract with Insistutefor Forestry for providingannually monitoring for ICPforests on level I and level II.
2 Forestry public enterprise Forest management plans 2007-2012 N/A
3 Narional parks Forest management plans 2007-2012 N/A
4 N/A N/A N/A N/A
13.2.2 Classification and definitions
National class Definition
Purpose of the Law on Forests Article 3. This Law shall ensure the conditions for sustainablemanagement of forests and forest lands as goods of publicinterest, in a manner and to an extent which conserves andenhances their productivity, biological diversity, ability toregenerate and vitality, and increases their potential for themitigation of climate change and their economic, ecologic andsocial functions, without inflicting damage to the surroundingecosystems.
Forestry Development Strategy of the RS Chapter 3. Guiding Principles of the Forestry Sector; Forestresources of the Republic of Serbia are managed by theprinciples of sustainable development, which is regulated by theConstitution of the Republic of Serbia.
N/A N/A
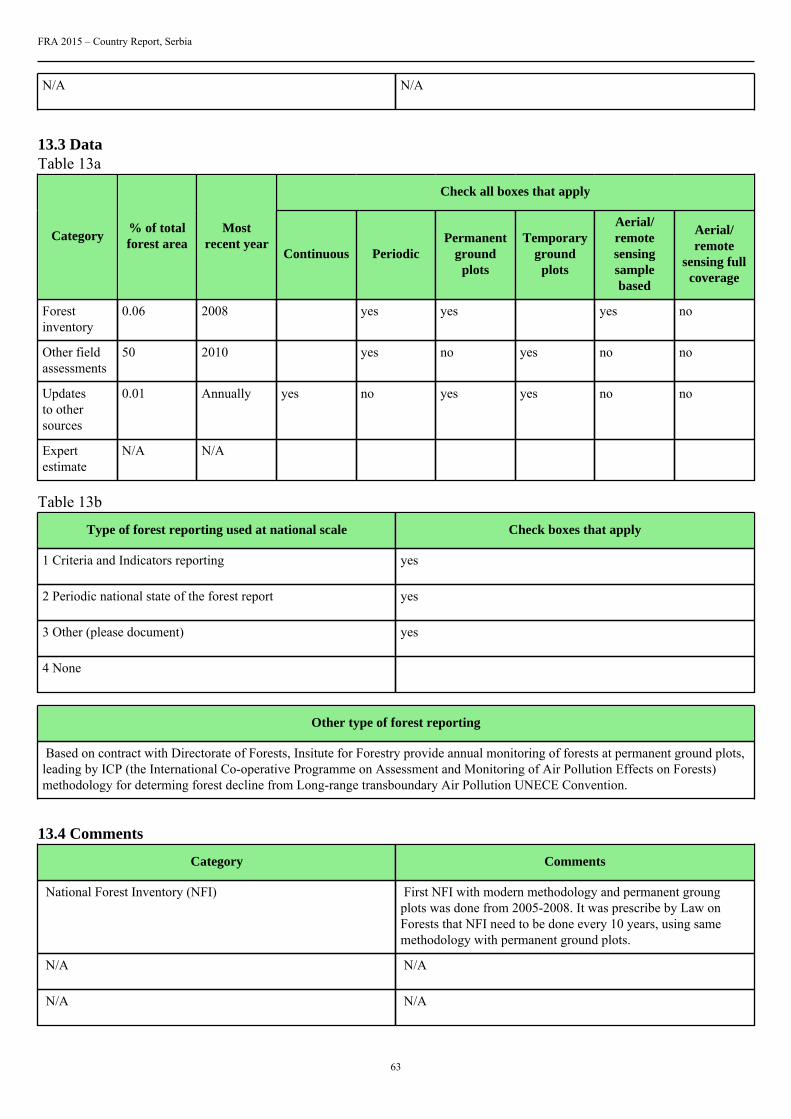
FRA 2015 – Country Report, Serbia
63
N/A N/A
13.3 DataTable 13a
Check all boxes that apply
Category% of totalforest area
Mostrecent year
Continuous PeriodicPermanent
groundplots
Temporaryground
plots
Aerial/remotesensingsamplebased
Aerial/remote
sensing fullcoverage
Forestinventory
0.06 2008 yes yes yes no
Other fieldassessments
50 2010 yes no yes no no
Updatesto othersources
0.01 Annually yes no yes yes no no
Expertestimate
N/A N/A
Table 13b
Type of forest reporting used at national scale Check boxes that apply
1 Criteria and Indicators reporting yes
2 Periodic national state of the forest report yes
3 Other (please document) yes
4 None
Other type of forest reporting
Based on contract with Directorate of Forests, Insitute for Forestry provide annual monitoring of forests at permanent ground plots,leading by ICP (the International Co-operative Programme on Assessment and Monitoring of Air Pollution Effects on Forests)methodology for determing forest decline from Long-range transboundary Air Pollution UNECE Convention.
13.4 Comments
Category Comments
National Forest Inventory (NFI) First NFI with modern methodology and permanent groungplots was done from 2005-2008. It was prescribe by Law onForests that NFI need to be done every 10 years, using samemethodology with permanent ground plots.
N/A N/A
N/A N/A

FRA 2015 – Country Report, Serbia
64
Other general comments
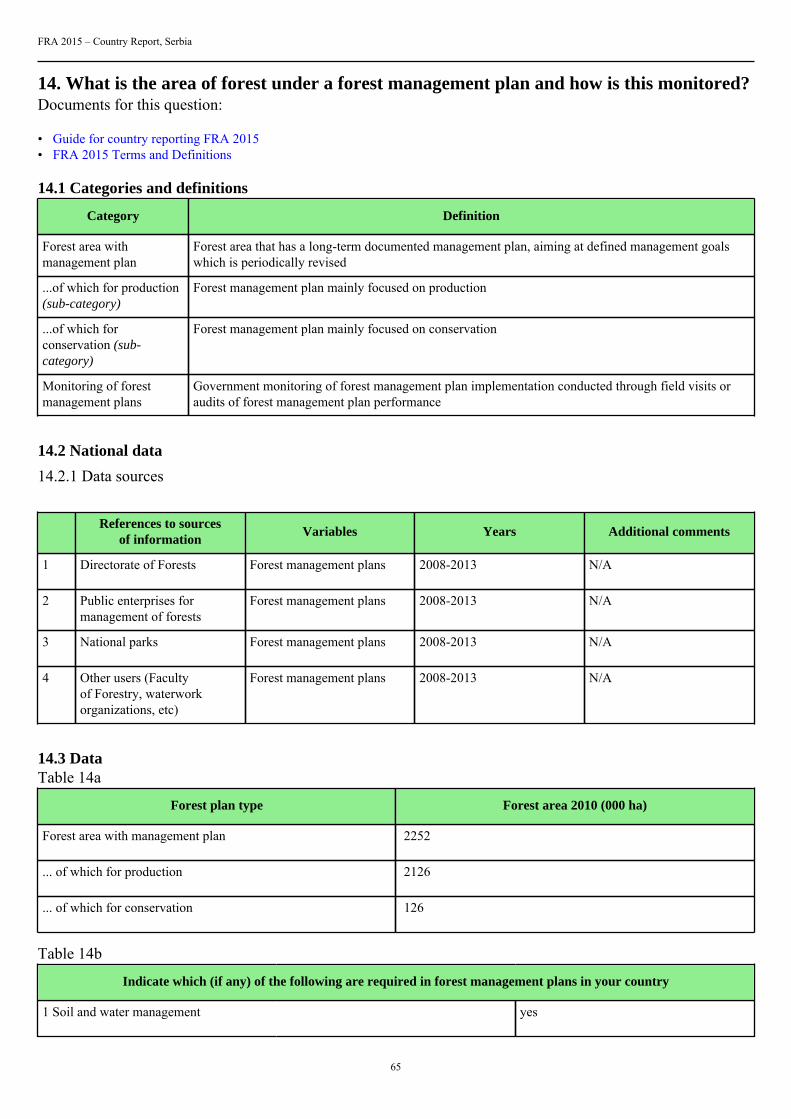
FRA 2015 – Country Report, Serbia
65
14. What is the area of forest under a forest management plan and how is this monitored?Documents for this question:
• Guide for country reporting FRA 2015• FRA 2015 Terms and Definitions
14.1 Categories and definitions
Category Definition
Forest area withmanagement plan
Forest area that has a long-term documented management plan, aiming at defined management goalswhich is periodically revised
...of which for production(sub-category)
Forest management plan mainly focused on production
...of which forconservation (sub-category)
Forest management plan mainly focused on conservation
Monitoring of forestmanagement plans
Government monitoring of forest management plan implementation conducted through field visits oraudits of forest management plan performance
14.2 National data
14.2.1 Data sources
References to sourcesof information
Variables Years Additional comments
1 Directorate of Forests Forest management plans 2008-2013 N/A
2 Public enterprises formanagement of forests
Forest management plans 2008-2013 N/A
3 National parks Forest management plans 2008-2013 N/A
4 Other users (Facultyof Forestry, waterworkorganizations, etc)
Forest management plans 2008-2013 N/A
14.3 DataTable 14a
Forest plan type Forest area 2010 (000 ha)
Forest area with management plan 2252
... of which for production 2126
... of which for conservation 126
Table 14b
Indicate which (if any) of the following are required in forest management plans in your country
1 Soil and water management yes
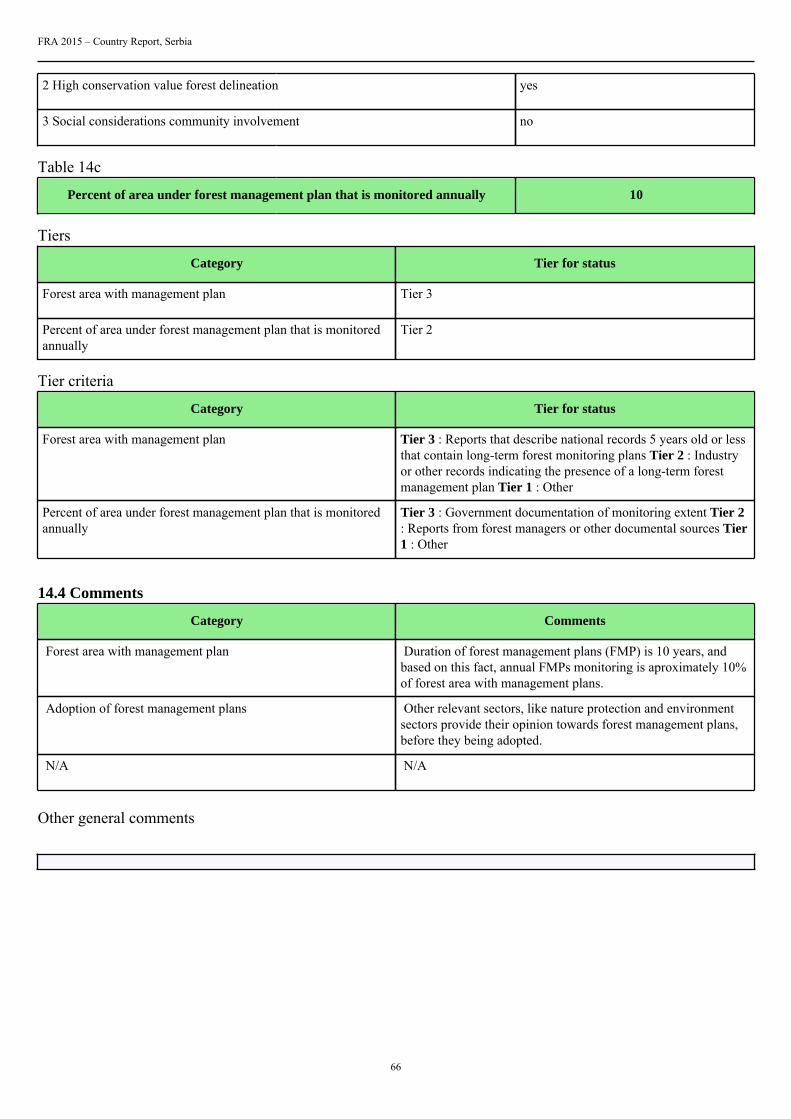
FRA 2015 – Country Report, Serbia
66
2 High conservation value forest delineation yes
3 Social considerations community involvement no
Table 14c
Percent of area under forest management plan that is monitored annually 10
Tiers
Category Tier for status
Forest area with management plan Tier 3
Percent of area under forest management plan that is monitoredannually
Tier 2
Tier criteria
Category Tier for status
Forest area with management plan Tier 3 : Reports that describe national records 5 years old or lessthat contain long-term forest monitoring plans Tier 2 : Industryor other records indicating the presence of a long-term forestmanagement plan Tier 1 : Other
Percent of area under forest management plan that is monitoredannually
Tier 3 : Government documentation of monitoring extent Tier 2: Reports from forest managers or other documental sources Tier1 : Other
14.4 Comments
Category Comments
Forest area with management plan Duration of forest management plans (FMP) is 10 years, andbased on this fact, annual FMPs monitoring is aproximately 10%of forest area with management plans.
Adoption of forest management plans Other relevant sectors, like nature protection and environmentsectors provide their opinion towards forest management plans,before they being adopted.
N/A N/A
Other general comments
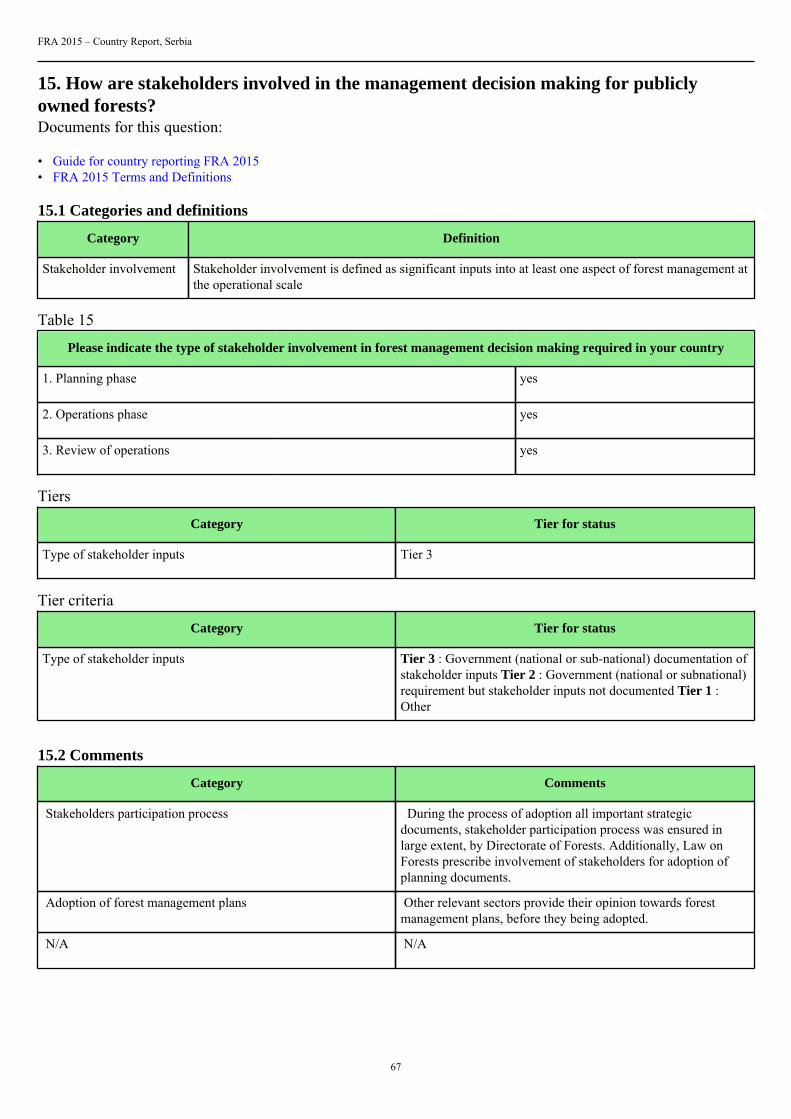
FRA 2015 – Country Report, Serbia
67
15. How are stakeholders involved in the management decision making for publiclyowned forests?Documents for this question:
• Guide for country reporting FRA 2015• FRA 2015 Terms and Definitions
15.1 Categories and definitions
Category Definition
Stakeholder involvement Stakeholder involvement is defined as significant inputs into at least one aspect of forest management atthe operational scale
Table 15
Please indicate the type of stakeholder involvement in forest management decision making required in your country
1. Planning phase yes
2. Operations phase yes
3. Review of operations yes
Tiers
Category Tier for status
Type of stakeholder inputs Tier 3
Tier criteria
Category Tier for status
Type of stakeholder inputs Tier 3 : Government (national or sub-national) documentation ofstakeholder inputs Tier 2 : Government (national or subnational)requirement but stakeholder inputs not documented Tier 1 :Other
15.2 Comments
Category Comments
Stakeholders participation process During the process of adoption all important strategicdocuments, stakeholder participation process was ensured inlarge extent, by Directorate of Forests. Additionally, Law onForests prescribe involvement of stakeholders for adoption ofplanning documents.
Adoption of forest management plans Other relevant sectors provide their opinion towards forestmanagement plans, before they being adopted.
N/A N/A

FRA 2015 – Country Report, Serbia
68
Other general comments
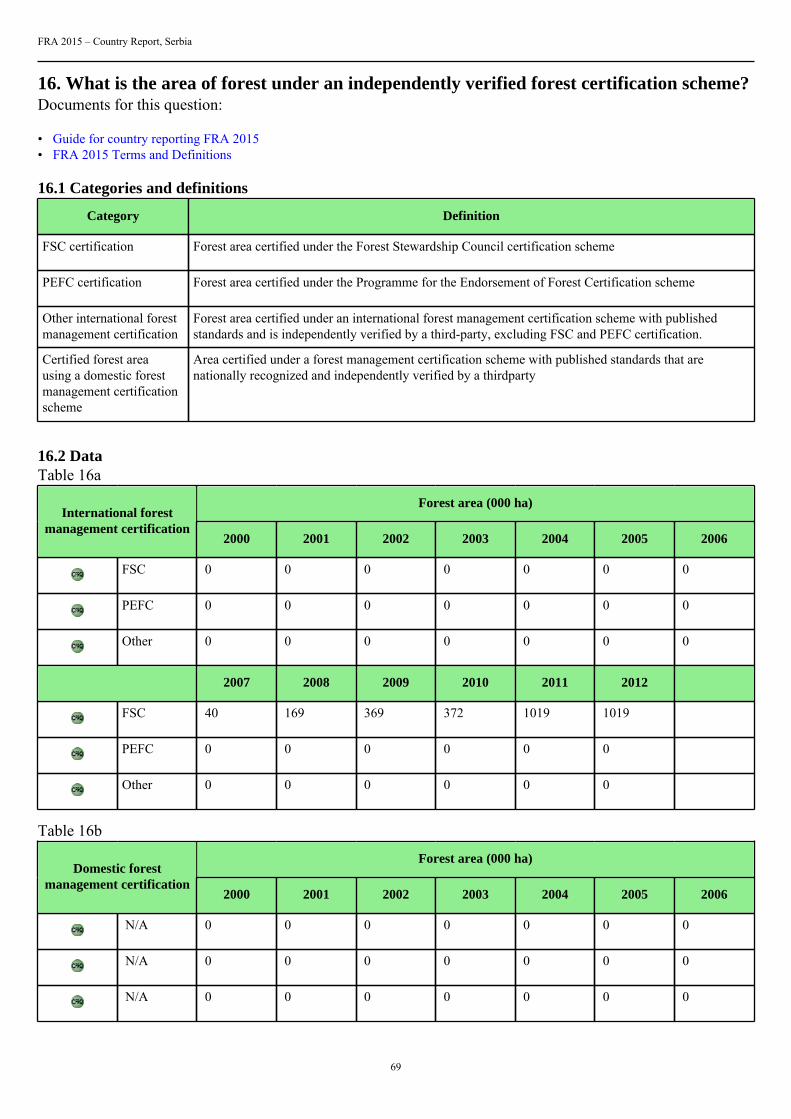
FRA 2015 – Country Report, Serbia
69
16. What is the area of forest under an independently verified forest certification scheme?Documents for this question:
• Guide for country reporting FRA 2015• FRA 2015 Terms and Definitions
16.1 Categories and definitions
Category Definition
FSC certification Forest area certified under the Forest Stewardship Council certification scheme
PEFC certification Forest area certified under the Programme for the Endorsement of Forest Certification scheme
Other international forestmanagement certification
Forest area certified under an international forest management certification scheme with publishedstandards and is independently verified by a third-party, excluding FSC and PEFC certification.
Certified forest areausing a domestic forestmanagement certificationscheme
Area certified under a forest management certification scheme with published standards that arenationally recognized and independently verified by a thirdparty
16.2 DataTable 16a
Forest area (000 ha)International forest
management certification2000 2001 2002 2003 2004 2005 2006
FSC 0 0 0 0 0 0 0
PEFC 0 0 0 0 0 0 0
Other 0 0 0 0 0 0 0
2007 2008 2009 2010 2011 2012
FSC 40 169 369 372 1019 1019
PEFC 0 0 0 0 0 0
Other 0 0 0 0 0 0
Table 16b
Forest area (000 ha)Domestic forest
management certification2000 2001 2002 2003 2004 2005 2006
N/A 0 0 0 0 0 0 0
N/A 0 0 0 0 0 0 0
N/A 0 0 0 0 0 0 0
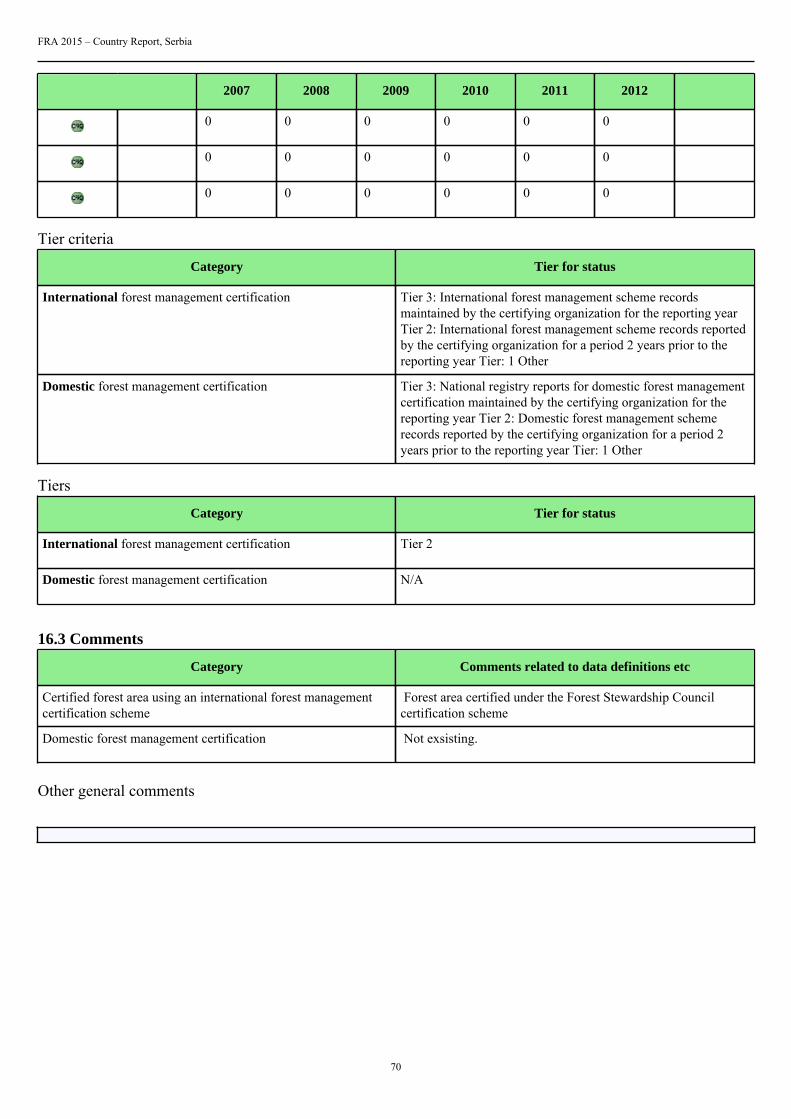
FRA 2015 – Country Report, Serbia
70
2007 2008 2009 2010 2011 2012
0 0 0 0 0 0
0 0 0 0 0 0
0 0 0 0 0 0
Tier criteria
Category Tier for status
International forest management certification Tier 3: International forest management scheme recordsmaintained by the certifying organization for the reporting yearTier 2: International forest management scheme records reportedby the certifying organization for a period 2 years prior to thereporting year Tier: 1 Other
Domestic forest management certification Tier 3: National registry reports for domestic forest managementcertification maintained by the certifying organization for thereporting year Tier 2: Domestic forest management schemerecords reported by the certifying organization for a period 2years prior to the reporting year Tier: 1 Other
Tiers
Category Tier for status
International forest management certification Tier 2
Domestic forest management certification N/A
16.3 Comments
Category Comments related to data definitions etc
Certified forest area using an international forest managementcertification scheme
Forest area certified under the Forest Stewardship Councilcertification scheme
Domestic forest management certification Not exsisting.
Other general comments
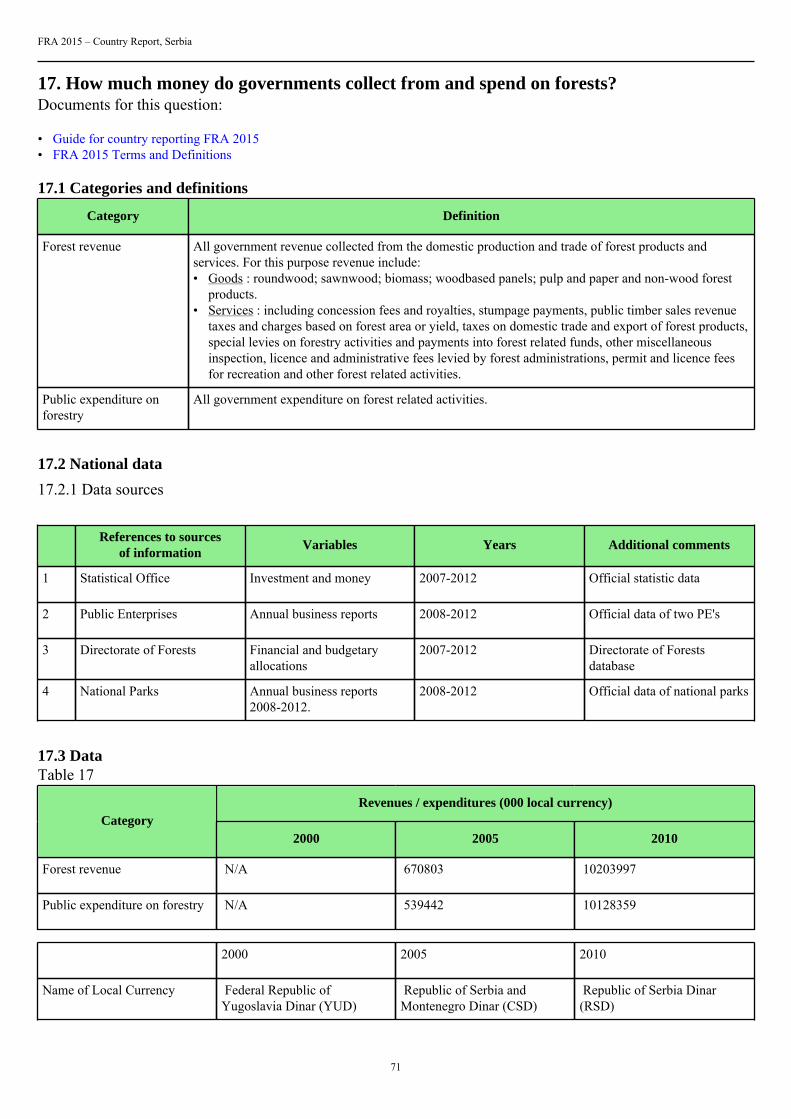
FRA 2015 – Country Report, Serbia
71
17. How much money do governments collect from and spend on forests?Documents for this question:
• Guide for country reporting FRA 2015• FRA 2015 Terms and Definitions
17.1 Categories and definitions
Category Definition
Forest revenue All government revenue collected from the domestic production and trade of forest products andservices. For this purpose revenue include:• Goods : roundwood; sawnwood; biomass; woodbased panels; pulp and paper and non-wood forest
products.• Services : including concession fees and royalties, stumpage payments, public timber sales revenue
taxes and charges based on forest area or yield, taxes on domestic trade and export of forest products,special levies on forestry activities and payments into forest related funds, other miscellaneousinspection, licence and administrative fees levied by forest administrations, permit and licence feesfor recreation and other forest related activities.
Public expenditure onforestry
All government expenditure on forest related activities.
17.2 National data
17.2.1 Data sources
References to sourcesof information
Variables Years Additional comments
1 Statistical Office Investment and money 2007-2012 Official statistic data
2 Public Enterprises Annual business reports 2008-2012 Official data of two PE's
3 Directorate of Forests Financial and budgetaryallocations
2007-2012 Directorate of Forestsdatabase
4 National Parks Annual business reports2008-2012.
2008-2012 Official data of national parks
17.3 DataTable 17
Revenues / expenditures (000 local currency)Category
2000 2005 2010
Forest revenue N/A 670803 10203997
Public expenditure on forestry N/A 539442 10128359
2000 2005 2010
Name of Local Currency Federal Republic ofYugoslavia Dinar (YUD)
Republic of Serbia andMontenegro Dinar (CSD)
Republic of Serbia Dinar(RSD)
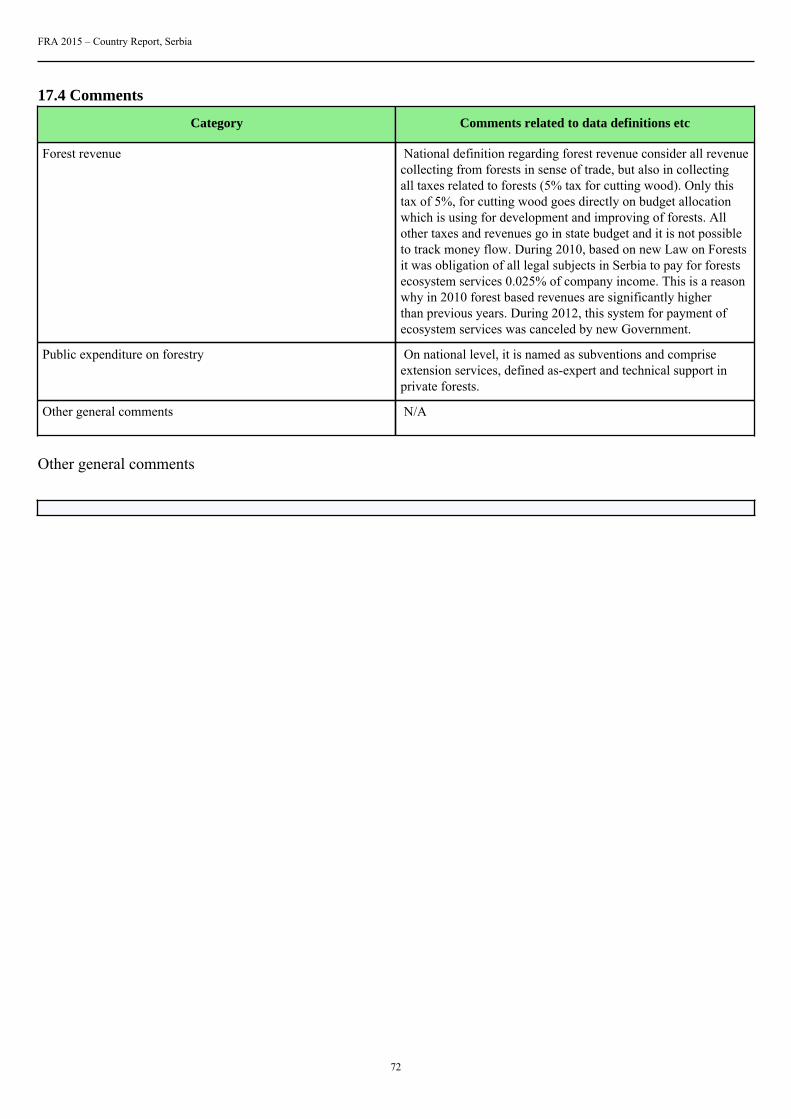
FRA 2015 – Country Report, Serbia
72
17.4 Comments
Category Comments related to data definitions etc
Forest revenue National definition regarding forest revenue consider all revenuecollecting from forests in sense of trade, but also in collectingall taxes related to forests (5% tax for cutting wood). Only thistax of 5%, for cutting wood goes directly on budget allocationwhich is using for development and improving of forests. Allother taxes and revenues go in state budget and it is not possibleto track money flow. During 2010, based on new Law on Forestsit was obligation of all legal subjects in Serbia to pay for forestsecosystem services 0.025% of company income. This is a reasonwhy in 2010 forest based revenues are significantly higherthan previous years. During 2012, this system for payment ofecosystem services was canceled by new Government.
Public expenditure on forestry On national level, it is named as subventions and compriseextension services, defined as-expert and technical support inprivate forests.
Other general comments N/A
Other general comments
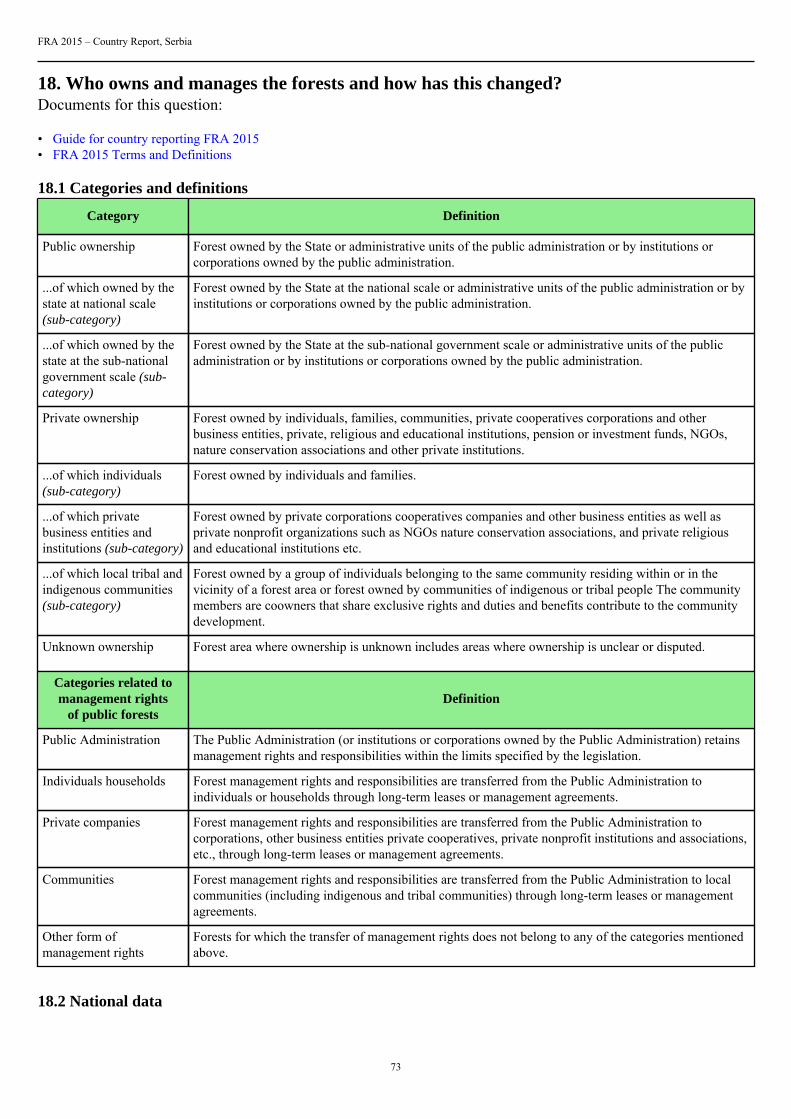
FRA 2015 – Country Report, Serbia
73
18. Who owns and manages the forests and how has this changed?Documents for this question:
• Guide for country reporting FRA 2015• FRA 2015 Terms and Definitions
18.1 Categories and definitions
Category Definition
Public ownership Forest owned by the State or administrative units of the public administration or by institutions orcorporations owned by the public administration.
...of which owned by thestate at national scale(sub-category)
Forest owned by the State at the national scale or administrative units of the public administration or byinstitutions or corporations owned by the public administration.
...of which owned by thestate at the sub-nationalgovernment scale (sub-category)
Forest owned by the State at the sub-national government scale or administrative units of the publicadministration or by institutions or corporations owned by the public administration.
Private ownership Forest owned by individuals, families, communities, private cooperatives corporations and otherbusiness entities, private, religious and educational institutions, pension or investment funds, NGOs,nature conservation associations and other private institutions.
...of which individuals(sub-category)
Forest owned by individuals and families.
...of which privatebusiness entities andinstitutions (sub-category)
Forest owned by private corporations cooperatives companies and other business entities as well asprivate nonprofit organizations such as NGOs nature conservation associations, and private religiousand educational institutions etc.
...of which local tribal andindigenous communities(sub-category)
Forest owned by a group of individuals belonging to the same community residing within or in thevicinity of a forest area or forest owned by communities of indigenous or tribal people The communitymembers are coowners that share exclusive rights and duties and benefits contribute to the communitydevelopment.
Unknown ownership Forest area where ownership is unknown includes areas where ownership is unclear or disputed.
Categories related tomanagement rights
of public forestsDefinition
Public Administration The Public Administration (or institutions or corporations owned by the Public Administration) retainsmanagement rights and responsibilities within the limits specified by the legislation.
Individuals households Forest management rights and responsibilities are transferred from the Public Administration toindividuals or households through long-term leases or management agreements.
Private companies Forest management rights and responsibilities are transferred from the Public Administration tocorporations, other business entities private cooperatives, private nonprofit institutions and associations,etc., through long-term leases or management agreements.
Communities Forest management rights and responsibilities are transferred from the Public Administration to localcommunities (including indigenous and tribal communities) through long-term leases or managementagreements.
Other form ofmanagement rights
Forests for which the transfer of management rights does not belong to any of the categories mentionedabove.
18.2 National data
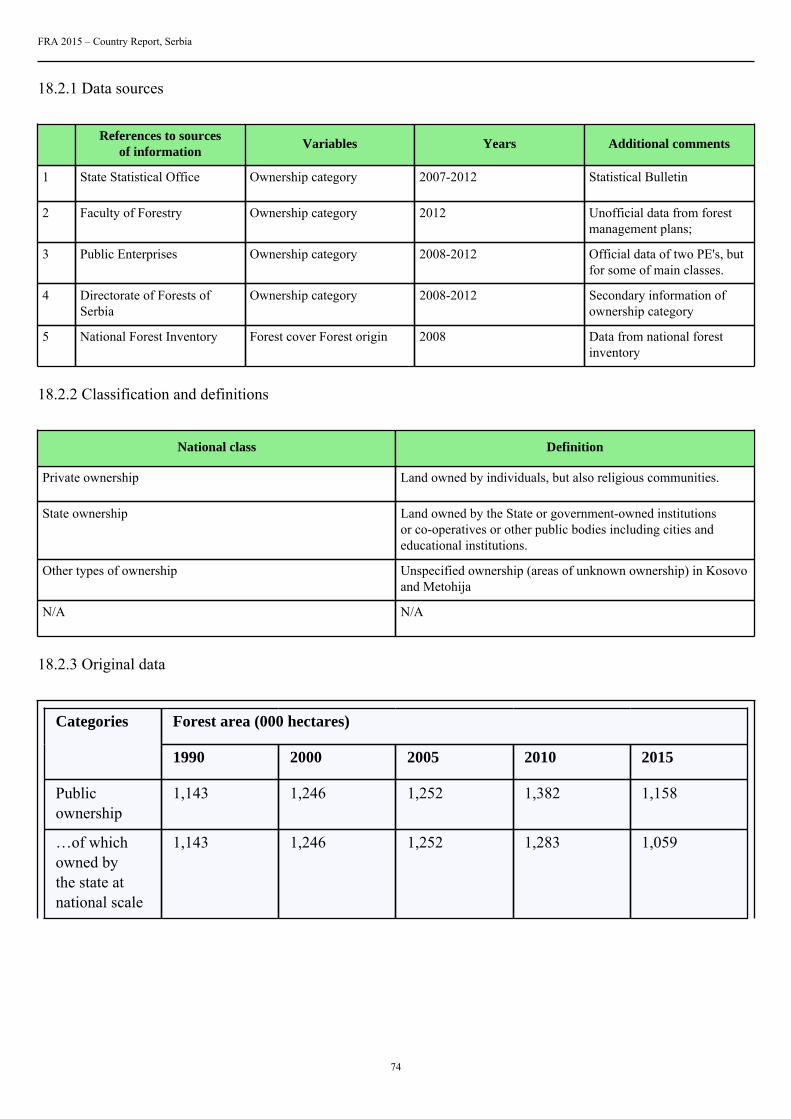
FRA 2015 – Country Report, Serbia
74
18.2.1 Data sources
References to sourcesof information
Variables Years Additional comments
1 State Statistical Office Ownership category 2007-2012 Statistical Bulletin
2 Faculty of Forestry Ownership category 2012 Unofficial data from forestmanagement plans;
3 Public Enterprises Ownership category 2008-2012 Official data of two PE's, butfor some of main classes.
4 Directorate of Forests ofSerbia
Ownership category 2008-2012 Secondary information ofownership category
5 National Forest Inventory Forest cover Forest origin 2008 Data from national forestinventory
18.2.2 Classification and definitions
National class Definition
Private ownership Land owned by individuals, but also religious communities.
State ownership Land owned by the State or government-owned institutionsor co-operatives or other public bodies including cities andeducational institutions.
Other types of ownership Unspecified ownership (areas of unknown ownership) in Kosovoand Metohija
N/A N/A
18.2.3 Original data
Forest area (000 hectares)Categories
1990 2000 2005 2010 2015
Publicownership
1,143 1,246 1,252 1,382 1,158
…of whichowned bythe state atnational scale
1,143 1,246 1,252 1,283 1,059
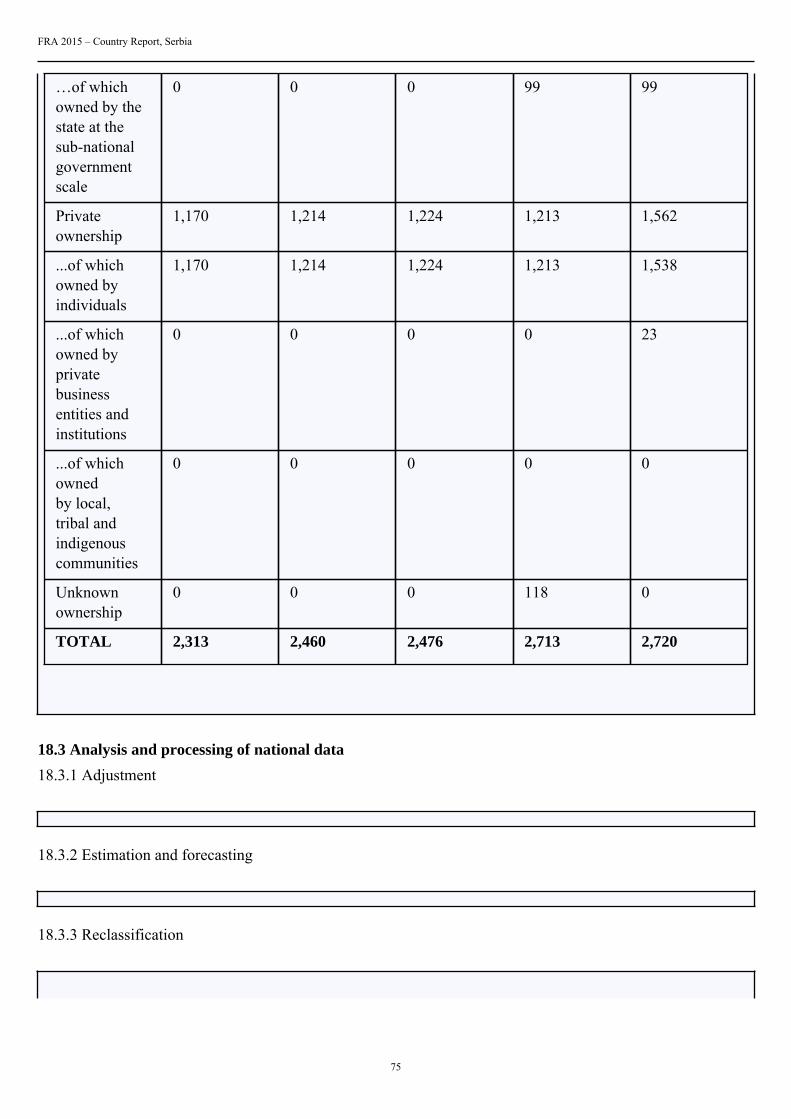
FRA 2015 – Country Report, Serbia
75
…of whichowned by thestate at thesub-nationalgovernmentscale
0 0 0 99 99
Privateownership
1,170 1,214 1,224 1,213 1,562
...of whichowned byindividuals
1,170 1,214 1,224 1,213 1,538
...of whichowned byprivatebusinessentities andinstitutions
0 0 0 0 23
...of whichownedby local,tribal andindigenouscommunities
0 0 0 0 0
Unknownownership
0 0 0 118 0
TOTAL 2,313 2,460 2,476 2,713 2,720
18.3 Analysis and processing of national data
18.3.1 Adjustment
18.3.2 Estimation and forecasting
18.3.3 Reclassification
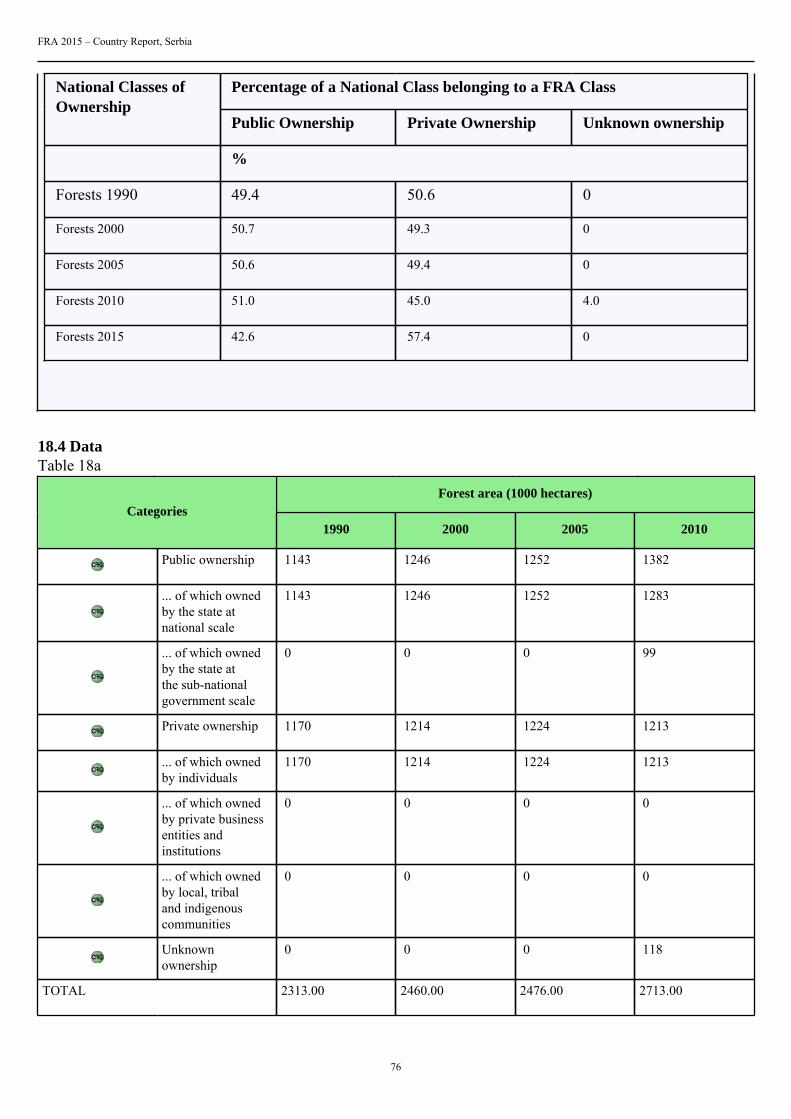
FRA 2015 – Country Report, Serbia
76
Percentage of a National Class belonging to a FRA ClassNational Classes ofOwnership
Public Ownership Private Ownership Unknown ownership
%
Forests 1990 49.4 50.6 0
Forests 2000 50.7 49.3 0
Forests 2005 50.6 49.4 0
Forests 2010 51.0 45.0 4.0
Forests 2015 42.6 57.4 0
18.4 DataTable 18a
Forest area (1000 hectares)Categories
1990 2000 2005 2010
Public ownership 1143 1246 1252 1382
... of which ownedby the state atnational scale
1143 1246 1252 1283
... of which ownedby the state atthe sub-nationalgovernment scale
0 0 0 99
Private ownership 1170 1214 1224 1213
... of which ownedby individuals
1170 1214 1224 1213
... of which ownedby private businessentities andinstitutions
0 0 0 0
... of which ownedby local, tribaland indigenouscommunities
0 0 0 0
Unknownownership
0 0 0 118
TOTAL 2313.00 2460.00 2476.00 2713.00
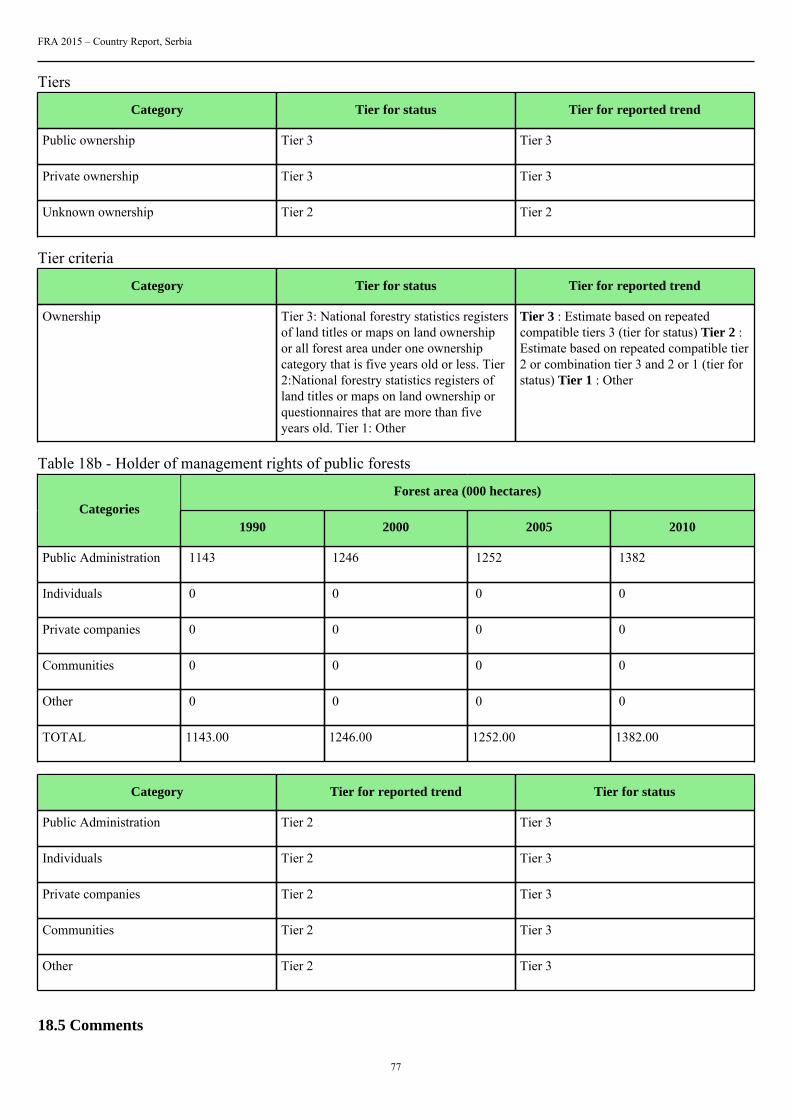
FRA 2015 – Country Report, Serbia
77
Tiers
Category Tier for status Tier for reported trend
Public ownership Tier 3 Tier 3
Private ownership Tier 3 Tier 3
Unknown ownership Tier 2 Tier 2
Tier criteria
Category Tier for status Tier for reported trend
Ownership Tier 3: National forestry statistics registersof land titles or maps on land ownershipor all forest area under one ownershipcategory that is five years old or less. Tier2:National forestry statistics registers ofland titles or maps on land ownership orquestionnaires that are more than fiveyears old. Tier 1: Other
Tier 3 : Estimate based on repeatedcompatible tiers 3 (tier for status) Tier 2 :Estimate based on repeated compatible tier2 or combination tier 3 and 2 or 1 (tier forstatus) Tier 1 : Other
Table 18b - Holder of management rights of public forests
Forest area (000 hectares)Categories
1990 2000 2005 2010
Public Administration 1143 1246 1252 1382
Individuals 0 0 0 0
Private companies 0 0 0 0
Communities 0 0 0 0
Other 0 0 0 0
TOTAL 1143.00 1246.00 1252.00 1382.00
Category Tier for reported trend Tier for status
Public Administration Tier 2 Tier 3
Individuals Tier 2 Tier 3
Private companies Tier 2 Tier 3
Communities Tier 2 Tier 3
Other Tier 2 Tier 3
18.5 Comments
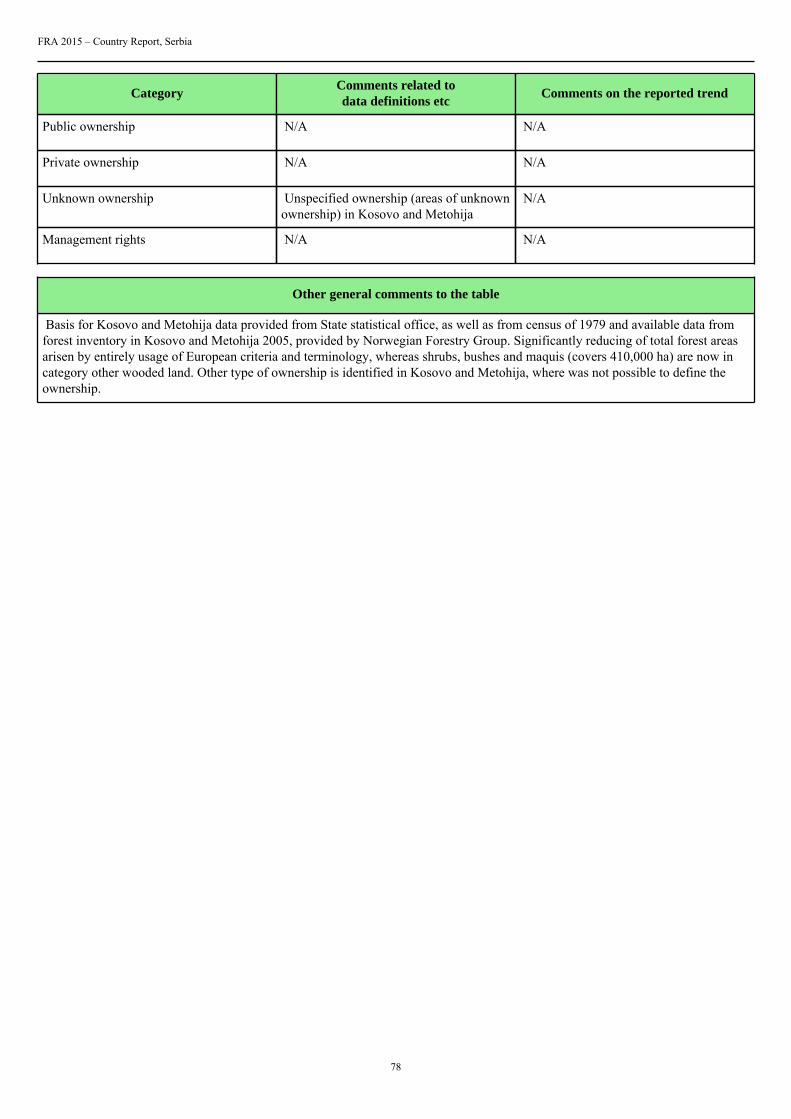
FRA 2015 – Country Report, Serbia
78
CategoryComments related todata definitions etc
Comments on the reported trend
Public ownership N/A N/A
Private ownership N/A N/A
Unknown ownership Unspecified ownership (areas of unknownownership) in Kosovo and Metohija
N/A
Management rights N/A N/A
Other general comments to the table
Basis for Kosovo and Metohija data provided from State statistical office, as well as from census of 1979 and available data fromforest inventory in Kosovo and Metohija 2005, provided by Norwegian Forestry Group. Significantly reducing of total forest areasarisen by entirely usage of European criteria and terminology, whereas shrubs, bushes and maquis (covers 410,000 ha) are now incategory other wooded land. Other type of ownership is identified in Kosovo and Metohija, where was not possible to define theownership.
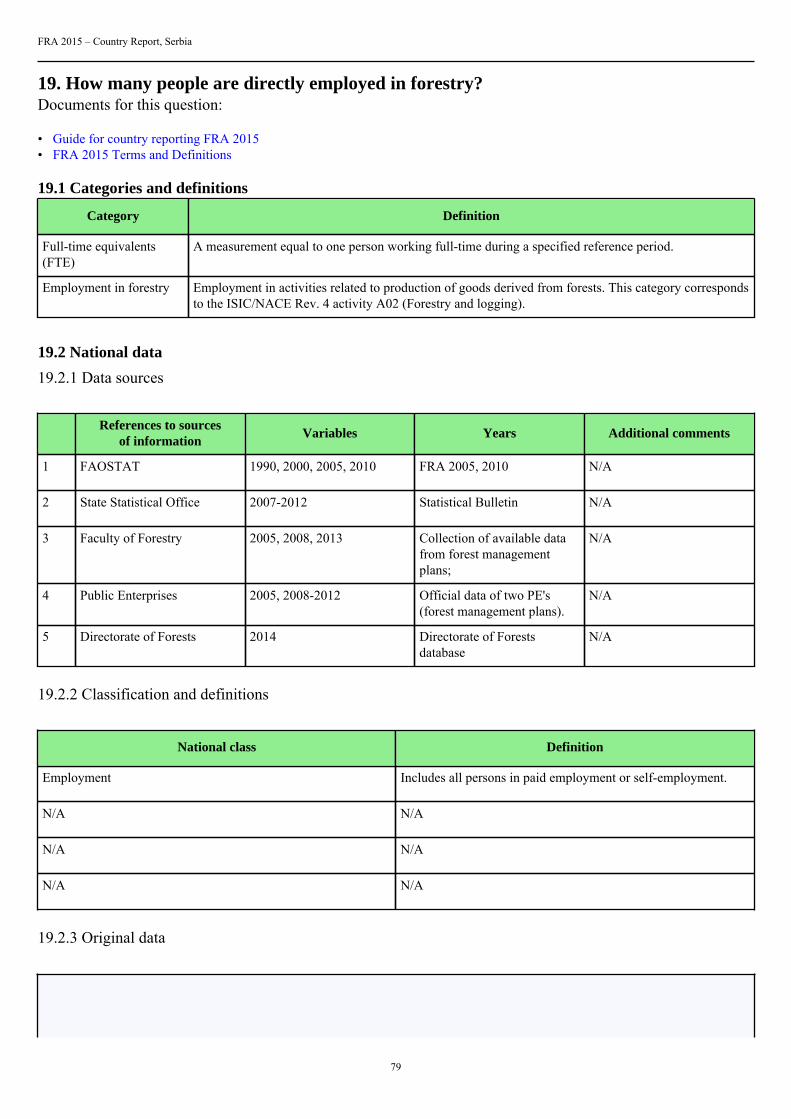
FRA 2015 – Country Report, Serbia
79
19. How many people are directly employed in forestry?Documents for this question:
• Guide for country reporting FRA 2015• FRA 2015 Terms and Definitions
19.1 Categories and definitions
Category Definition
Full-time equivalents(FTE)
A measurement equal to one person working full-time during a specified reference period.
Employment in forestry Employment in activities related to production of goods derived from forests. This category correspondsto the ISIC/NACE Rev. 4 activity A02 (Forestry and logging).
19.2 National data
19.2.1 Data sources
References to sourcesof information
Variables Years Additional comments
1 FAOSTAT 1990, 2000, 2005, 2010 FRA 2005, 2010 N/A
2 State Statistical Office 2007-2012 Statistical Bulletin N/A
3 Faculty of Forestry 2005, 2008, 2013 Collection of available datafrom forest managementplans;
N/A
4 Public Enterprises 2005, 2008-2012 Official data of two PE's(forest management plans).
N/A
5 Directorate of Forests 2014 Directorate of Forestsdatabase
N/A
19.2.2 Classification and definitions
National class Definition
Employment Includes all persons in paid employment or self-employment.
N/A N/A
N/A N/A
N/A N/A
19.2.3 Original data
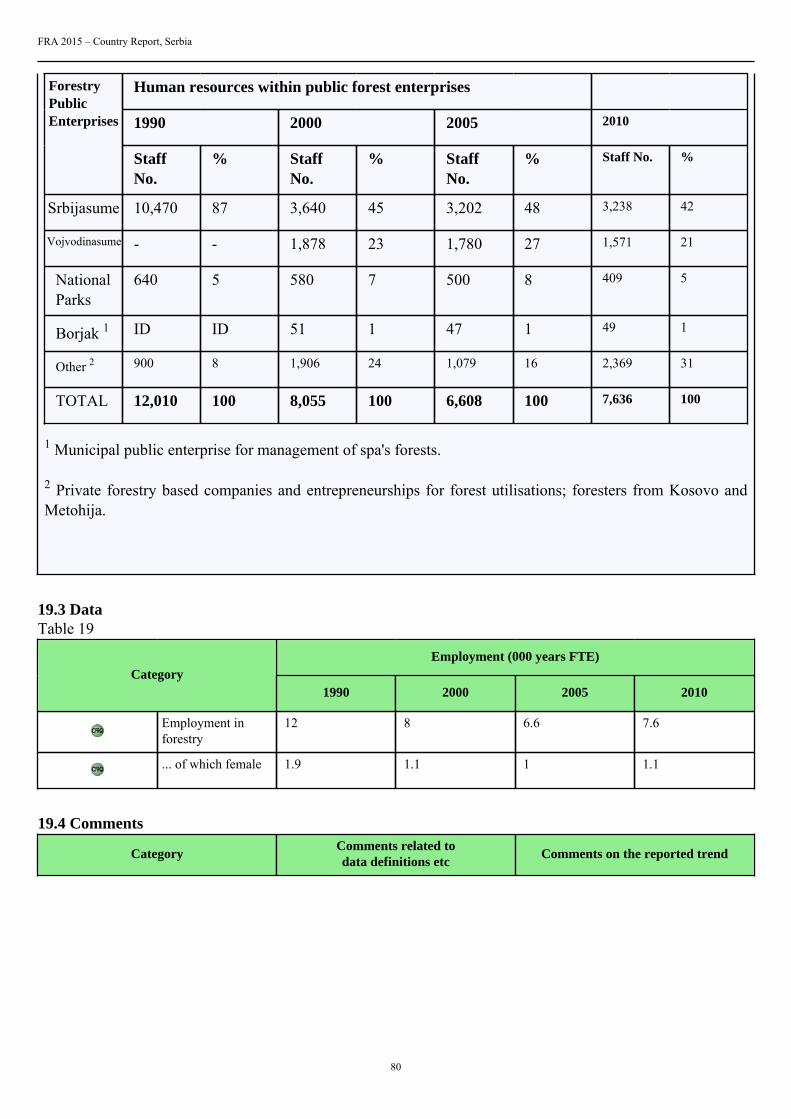
FRA 2015 – Country Report, Serbia
80
Human resources within public forest enterprises
1990 2000 2005 2010
ForestryPublicEnterprises
StaffNo.
% StaffNo.
% StaffNo.
% Staff No. %
Srbijasume 10,470 87 3,640 45 3,202 48 3,238 42
Vojvodinasume - - 1,878 23 1,780 27 1,571 21
NationalParks
640 5 580 7 500 8 409 5
Borjak 1 ID ID 51 1 47 1 49 1
Other 2 900 8 1,906 24 1,079 16 2,369 31
TOTAL 12,010 100 8,055 100 6,608 100 7,636 100
1 Municipal public enterprise for management of spa's forests.
2 Private forestry based companies and entrepreneurships for forest utilisations; foresters from Kosovo andMetohija.
19.3 DataTable 19
Employment (000 years FTE)Category
1990 2000 2005 2010
Employment inforestry
12 8 6.6 7.6
... of which female 1.9 1.1 1 1.1
19.4 Comments
CategoryComments related todata definitions etc
Comments on the reported trend
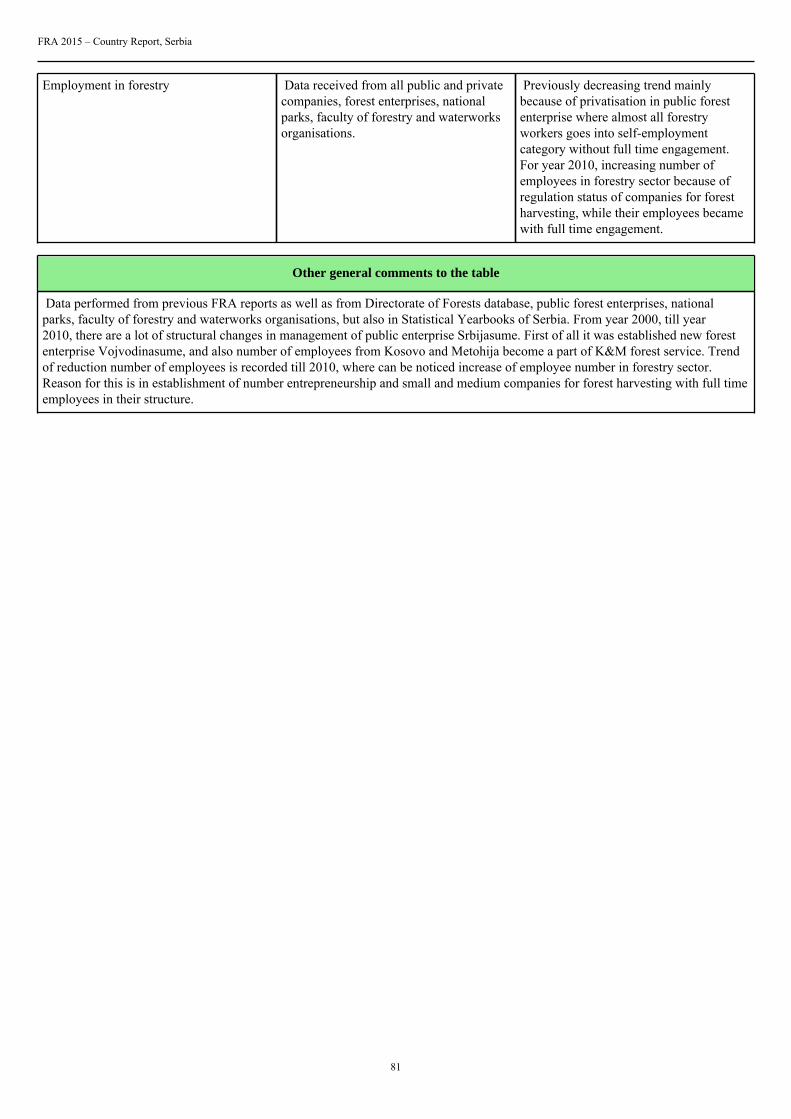
FRA 2015 – Country Report, Serbia
81
Employment in forestry Data received from all public and privatecompanies, forest enterprises, nationalparks, faculty of forestry and waterworksorganisations.
Previously decreasing trend mainlybecause of privatisation in public forestenterprise where almost all forestryworkers goes into self-employmentcategory without full time engagement.For year 2010, increasing number ofemployees in forestry sector because ofregulation status of companies for forestharvesting, while their employees becamewith full time engagement.
Other general comments to the table
Data performed from previous FRA reports as well as from Directorate of Forests database, public forest enterprises, nationalparks, faculty of forestry and waterworks organisations, but also in Statistical Yearbooks of Serbia. From year 2000, till year2010, there are a lot of structural changes in management of public enterprise Srbijasume. First of all it was established new forestenterprise Vojvodinasume, and also number of employees from Kosovo and Metohija become a part of K&M forest service. Trendof reduction number of employees is recorded till 2010, where can be noticed increase of employee number in forestry sector.Reason for this is in establishment of number entrepreneurship and small and medium companies for forest harvesting with full timeemployees in their structure.
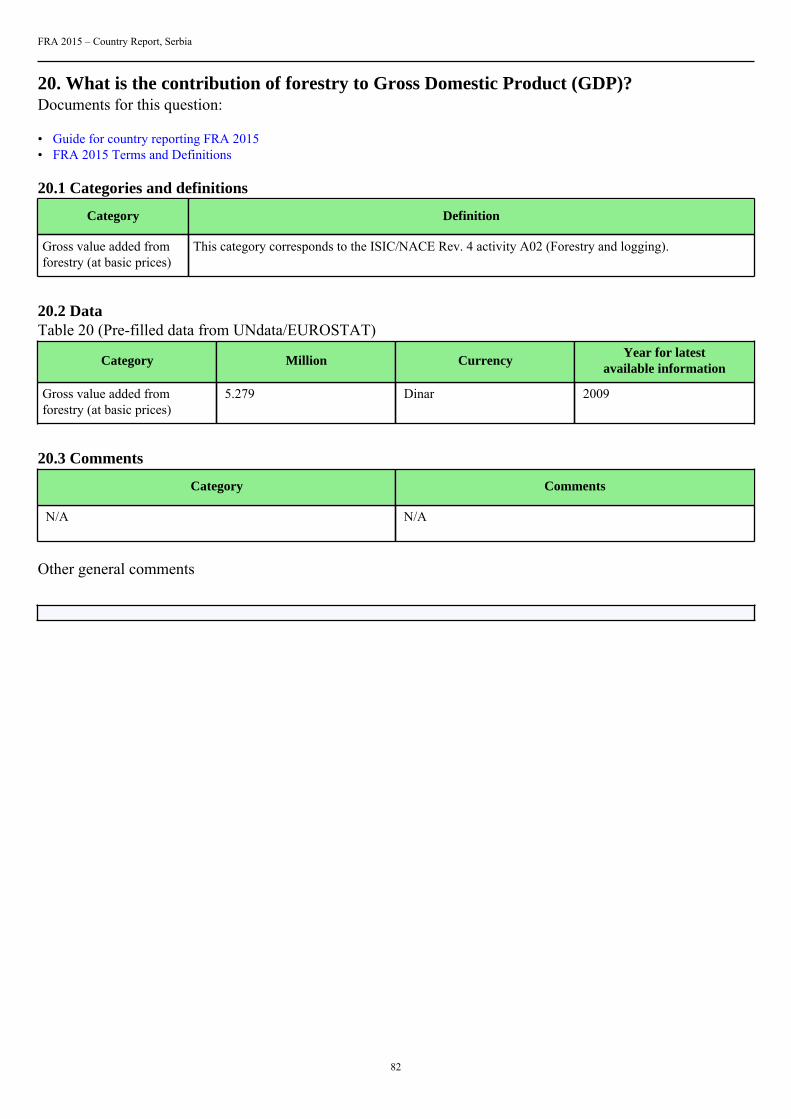
FRA 2015 – Country Report, Serbia
82
20. What is the contribution of forestry to Gross Domestic Product (GDP)?Documents for this question:
• Guide for country reporting FRA 2015• FRA 2015 Terms and Definitions
20.1 Categories and definitions
Category Definition
Gross value added fromforestry (at basic prices)
This category corresponds to the ISIC/NACE Rev. 4 activity A02 (Forestry and logging).
20.2 DataTable 20 (Pre-filled data from UNdata/EUROSTAT)
Category Million CurrencyYear for latest
available information
Gross value added fromforestry (at basic prices)
5.279 Dinar 2009
20.3 Comments
Category Comments
N/A N/A
Other general comments
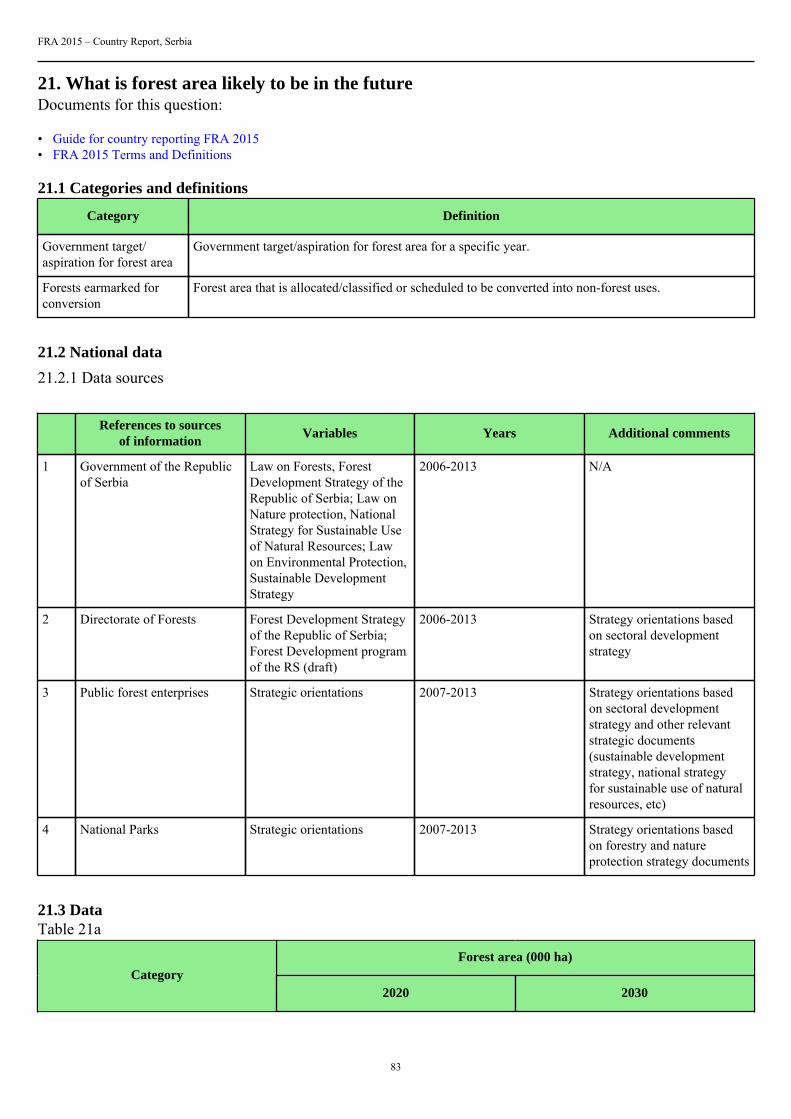
FRA 2015 – Country Report, Serbia
83
21. What is forest area likely to be in the futureDocuments for this question:
• Guide for country reporting FRA 2015• FRA 2015 Terms and Definitions
21.1 Categories and definitions
Category Definition
Government target/aspiration for forest area
Government target/aspiration for forest area for a specific year.
Forests earmarked forconversion
Forest area that is allocated/classified or scheduled to be converted into non-forest uses.
21.2 National data
21.2.1 Data sources
References to sourcesof information
Variables Years Additional comments
1 Government of the Republicof Serbia
Law on Forests, ForestDevelopment Strategy of theRepublic of Serbia; Law onNature protection, NationalStrategy for Sustainable Useof Natural Resources; Lawon Environmental Protection,Sustainable DevelopmentStrategy
2006-2013 N/A
2 Directorate of Forests Forest Development Strategyof the Republic of Serbia;Forest Development programof the RS (draft)
2006-2013 Strategy orientations basedon sectoral developmentstrategy
3 Public forest enterprises Strategic orientations 2007-2013 Strategy orientations basedon sectoral developmentstrategy and other relevantstrategic documents(sustainable developmentstrategy, national strategyfor sustainable use of naturalresources, etc)
4 National Parks Strategic orientations 2007-2013 Strategy orientations basedon forestry and natureprotection strategy documents
21.3 DataTable 21a
Forest area (000 ha)Category
2020 2030
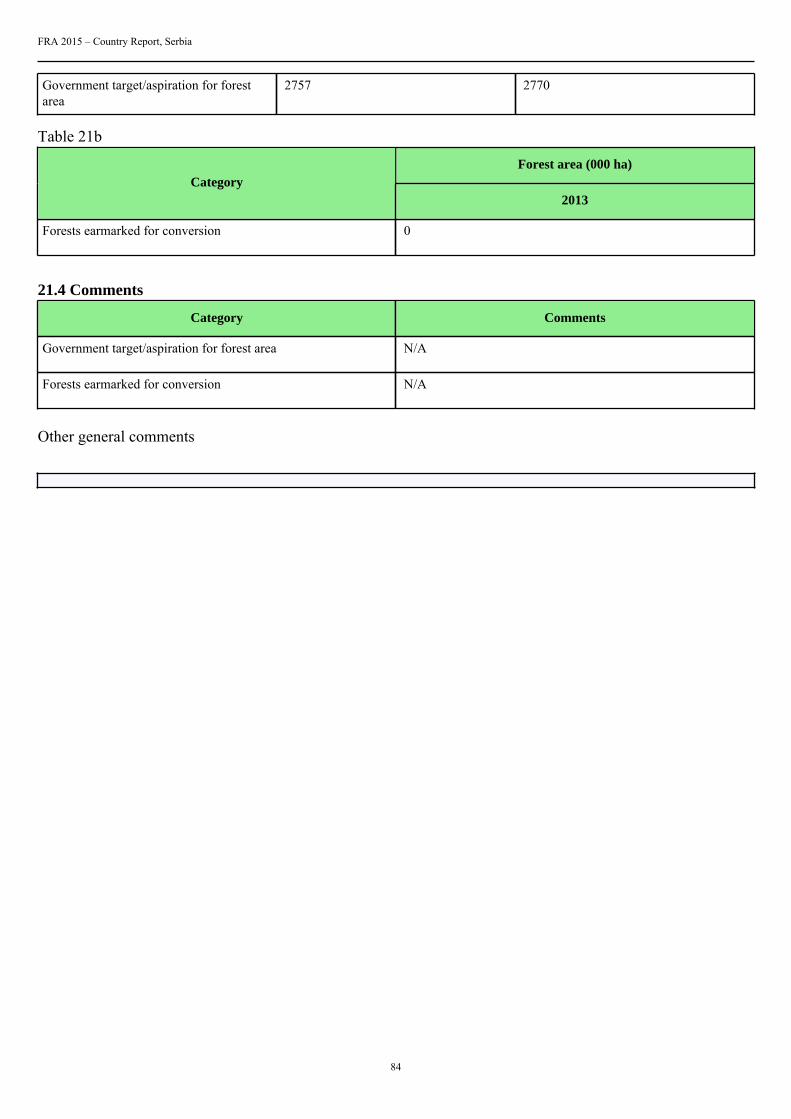
FRA 2015 – Country Report, Serbia
84
Government target/aspiration for forestarea
2757 2770
Table 21b
Forest area (000 ha)Category
2013
Forests earmarked for conversion 0
21.4 Comments
Category Comments
Government target/aspiration for forest area N/A
Forests earmarked for conversion N/A
Other general comments