sequential anaerobic dechlorination of pentachlorophenol: competitive inhibition effects and a...
TRANSCRIPT
Sequential Anaerobic Dechlorinationof Pentachlorophenol: CompetitiveInhibition Effects and a KineticModelV I C T O R S . M A G A R , * H . D A V I D S T E N S E L ,J A A K K O A . P U H A K K A , † A N DJ O H N F . F E R G U S O N
Department of Civil and Environmental Engineering,301 More Hall, University of Washington,Seattle, Washington 98195-2700
The fate and dechlorination kinetics of PCP and itsintermediates were studied in two fluidized-bed reactors(FBRs) with methanogenic enrichments. The two FBRs wereoperated at a 1-day hydraulic retention time and fedlactate at 400 mg/L and pentachlorophenol (PCP) at 5 mg/L(18.8 µmol/L). PCP was meta-dechlorinated to 2,3,4,6-tetrachlorophenol (2346-TeCP). Approximately 75% of the 2346-TeCP was meta-dechlorinated to 2,4,6-trichlorophenol (246-TCP), followed by sequential o-chlorine removals to4-monochlorophenol (4-MCP); the remaining 2346-TeCPwas ortho-dechlorinated via 245-TCP to 3,4-dichlorophenol (34-DCP). Neither 34-DCP nor 4-MCP were dechlorinatedthroughout the 18-month testing period. In mixed-CP batchtests, CPs competed with each other, resulting in reduceddechlorination rates; competition was position-specificwith respect to ortho- and meta-dechlorination reactions.Michaelis-Menten dechlorination kinetic coefficientsand linear solid-liquid partition coefficients were determinedfor PCP, 2346-TeCP, 246-TCP, 245-TCP, 24-DCP, 34-DCP,and 4-MCP. These coefficients were used in a Michaelis-Menten, sequential dechlorination, competitive inhibitionkinetic model that used the experimentally determined CP half-saturation coefficients (Ks) for respective inhibitioncoefficients. The model reasonably predicted CP concentra-tions over time in batch tests fed 246-TCP or PCP.Without competitive inhibition, the model increasinglyoverestimated CP dechlorination rates with each successivedechlorination step and underestimated the time fordechlorination.
IntroductionPentachlorophenol (PCP) and other chlorophenols (CPs) havebeen widely used as biocides and herbicides in the UnitedStates since the 1950s. PCP has since been detected in surfacewaters, sediments, rainwater, drinking water, aquatic organ-isms, soils, and food and has been identified in at least 235of the 1300 hazardous waste sites on the National PrioritiesList (1). Within the last two decades, extensive research has
been conducted to determine the ability of anaerobicmicroorganisms to degrade PCP and other chloroorganiccompounds in the environment and in controlled processes(for reviews, see refs 2 and 3).
Anaerobic biotransformation of CPs occurs via reductivedechlorination, in which chlorine removal and substitutionwith hydrogen results in a reduced organic compound withfewer chlorines (3). Reports of anaerobic CP dechlorinationusing pure cultures (4-9) and undefined enrichment cultures(10-16) demonstrate that the dechlorination of PCP and otherCPs is carried out by a variety of bacteria that catalyze ortho-,meta-, or para-position-specific dechlorination reactions.
Despite our growing knowledge of CP anaerobic dechlo-rination pathways and bacteria, few studies have rigorouslyexamined the dechlorination kinetics of CPs in mixedanaerobic cultures. PCP dechlorination proceeds sequentiallywith ortho-, meta-, and para-dechlorination reactions toproduce various chlorinated intermediates. Such position-specific dechlorination raises the possibility that more thanone compound could compete for the same dechlorinationenzyme. The likelihood and the effect of competitive inhibi-tion on dechlorination kinetics in CP mixtures were of primaryinterest in this study.
The fate and degradation kinetics of PCP and its dechlo-rination intermediates were studied in two anaerobic fluid-ized-bed reactors (FBRs) with methanogenic enrichments.The FBRs were used to develop PCP-dechlorinating enrich-ments and to conduct dechlorination kinetic tests usingsingle- and multiple-CPs. Kinetic coefficients from the single-CP tests were incorporated into a Michaelis-Menten com-petitive inhibition model that described sequential dechlo-rination of PCP and its dechlorination intermediates usingcompetitive inhibition kinetics. A specific goal of this researchwas to determine for which CPs competitive inhibition occursand whether the competing CP compounds could becharacterized by the number of chlorines or by positionspecificity of dechlorination.
Materials and MethodsFBR Design and Operation. PCP-dechlorinating cultureswere enriched and maintained in two FBRs for 18 months.The FBRs (FBR-1 and FBR-2) were 450-mL glass reactors (4cm diameter by 35 cm tall) maintained in a 35 °C incubationchamber (10, 17). Each reactor contained 50 g of supportmedia, Celite (Type R-633; World Minerals, Inc.; Lompoc,CA). Type R-633 Celite had a 30/50 mesh size (i.e., 80% ofthe particles are between 300 and 600 µm in diameter) anda specific surface area (including the pore volume) of 1.3m2/g (World Minerals, Inc.; Lompoc, CA). Sampling portsallowed liquid or support media/biomass sampling. Peri-staltic pumps were used for liquid recycling and feeding,and Viton tubing (Cole-Parmer; Vernon Hills, IL) was usedfor feed and recycle lines to minimize CP partitioning.Neoprene tubing (Cole-Parmer; Vernon Hills, IL) was usedfor the peristaltic pumps. The Celite was fluidized under arecycle flow rate of approximately 570 mL/min, providing100% bed expansion. The empty bed hydraulic residencetime was 24 h, based on the 450-mL reactor volume.
The FBRs were operated with continuous feeding of areduced nutrient medium (RNM) buffered with sodiumbicarbonate (2 g/L) and supplemented with 18 µmol/L (5mg/L) PCP plus 400 mg/L lactate as an electron donor. TheRNM media was modified from Shelton and Tiedje (18) andincluded 0.27 g/L KH2PO4, 0.35 g/L K2HPO4, 0.53 g/L NH4Cl,75 mg/L CaCl2‚2H2O, 100 mg/L MgCl2‚6H2O, 20 mg/L FeCl2‚4H2O, 0.5 mg/L MnCl2‚4H2O, 0.05 mg/L H3BO3, 0.05 mg/L
* Corresponding author present address: Battelle MemorialInstitute, 505 King Ave., Columbus, OH 43201; telephone: (614)-424-4604; fax: (614)424-3667; e-mail: [email protected].
† Present address: Institute of Water and Environmental Engi-neering, Tampere University of Technology, P.O. Box 541, FIN-33101Tampere, Finland.
Environ. Sci. Technol. 1999, 33, 1604-1611
1604 9 ENVIRONMENTAL SCIENCE & TECHNOLOGY / VOL. 33, NO. 10, 1999 10.1021/es9808696 CCC: $18.00 1999 American Chemical SocietyPublished on Web 03/31/1999

ZnCl2, 0.03 mg/L CuCl2, 0.01 mg/L NaMoO4‚2H2O, 0.5 mg/LCoCl2‚6H2O, 0.05 mg/L NiCl2‚6H2O, 0.05 mg/L Na2SeO3, and1.0 g/L NaHCO3. RNM feed solutions were boiled under astream of N2 to remove oxygen, and sulfide (Na2S‚9H2O; 5mg/L as Na2S) was added as a reducing agent. Feed solutionswere prepared once every 4 days and were stored in closed,4-L Erlenmeyer glass flasks to maintain reduced conditionsduring feeding. Reduced conditions in the feed solutionsand in the FBRs were confirmed by the presence of Resazurin(Supelco, Inc.) (19), which remained clear throughout theexperimental period. Feed lines entered the closed flasksthrough 3-cm-thick rubber stoppers, and N2 was suppliedcontinuously at low pressures (less than 1 psi) to replace theliquid medium pumped from the feed flasks. The feedsolutions were maintained at ambient temperatures.
The FBRs were inoculated with a PCP-degrading enrich-ment culture obtained from laboratory-scale sludge digestersthat had been fed PCP for approximately 2 years (17). ThePCP feed concentration was increased gradually from 1.5(0.4 mg/L) to 18.8 µmol/L (5 mg/L) over a 150-day acclimationperiod. The lactate concentration was increased from 100 to400 mg/L by day 84. PCP was dechlorinated to 34-DCP and4-MCP in the FBRs under normal operating conditions.
FBR Batch Dechlorination Rate Tests Conducted forSingle-CP Compounds. Single-CP batch dechlorination ratetests were conducted with PCP and each of its dechlorinationintermediates using FBR-1. Over a 1-month period, each CPwas tested at three to four initial CP concentrations, exceptfor 2345-TeCP, which was tested only at a single concentra-tion. Each CP was spiked directly into the FBR, and reactorfeeding was discontinued while maintaining recycle flows.Lactate (100 mg/L) was spiked at the beginning of each testand once every 30 min thereafter to maintain excess electrondonor levels.
The FBR aqueous phase was monitored over time untilall parent CP compounds and their dechlorination inter-mediates were dechlorinated to 34-DCP or 4-MCP, the finalPCP dechlorination products. The first sample point, takenat 1 min after CP spiking to allow for complete mixing, wasestablished as time zero.
Effect of CP Mixtures on Batch Dechlorination Rates.Using both FBRs, batch dechlorination tests were conductedwith CP mixtures to determine whether CP dechlorinationrates were affected by the type and concentration of otherCPs. The hypothesis for this work was that CP compoundswith the same position-specific dechlorination reactionwould exhibit competitive inhibition when combined in theFBRs. The goal was to observe the effect of CP mixtures oninitial dechlorination rates; dechlorination rates of single-CP compounds were compared with rates in CP mixtures.Three sets of tests were conducted: the first set of testscombined ortho-dechlorinated CPs or meta-dechlorinatedCPs; the second set of tests combined CPs that underwentboth ortho- and meta-dechlorination reactions; the third setof tests combined CPs that underwent solely ortho-dechlo-rination reactions with those that underwent solely meta-dechlorination reactions. These tests were conducted overa 3-month period, approximately 1 year after inoculatingthe FBRs and 2 months after conducting the single-CP batchdechlorination kinetic tests.
Because tests were conducted chronologically, there wasa need to verify that changes in dechlorination rates weredue to inhibition rather than other environmental changes(i.e., population changes, long-term toxicity, or changes inthe feed media). Therefore, selected single-CP batch testswere repeated to confirm the stability of the cultures.Furthermore, the sequence of tests was randomized.
Analytical Methods. The PCP-fed FBRs were monitoredfor aqueous-phase CP concentrations. One-milliliter aque-ous-phase samples were obtained from the FBRs by syringe.
Phenol and the CPs were acetylated by adding 40 µL ofconcentrated K2CO3 (720 g/L) buffer plus 40 µL of reagent-grade acetic anhydride/1 mL aqueous-phase sample in 4-mLglass vials. An internal standard (2,4,6-tribromophenol [246-TBP]) was added to each sample to account for extractionlosses. The CPs and 246-TBP were extracted into 1 mL ofhexane, followed by the addition of 200 µL of tetrabutyl-ammonium hydrogen sulfide to remove sulfides. Hexaneextractions were stored at 4 °C until GC analysis. Eight-pointstandards were prepared gravimetrically for quantificationof each of the 19 possible CPs plus phenol. The CP standardswere extracted and analyzed using the same methodsdescribed above, and aqueous CP concentrations weredetermined by comparison with the standard curves.
Hexane extractions were analyzed using a Perkin-ElmerAutosystem GC equipped with an electron capture detector(ECD) connected to a 30-m RtX-1 (0.32 mm i.d.; 1.00 µm df;Restek Corporation; Bellefonte, PA) and a flame ionizationdetector (FID) connected to a DB-5 megabore column (0.548mm i.d.; 1.50 µm df; J&W Scientific; Folsom, CA). DCPs, TCPs,TeCPs, and PCP were analyzed using the ECD, and phenoland MCPs were analyzed using the FID. The carrier gas washelium (He), and the ECD makeup gas consisted of 95% argonplus 5% methane; 1-µL samples were injected onto the GCand split 90:1. FID operating temperatures were 100 °C for2 min to 250 °C at 5.5 °C/min, held at 225 °C for 5 min; ECDoperating temperatures were 175 to 225 °C at 5 °C/min, heldat 225 °C for 5 min. Detection limits were as follows: 0.04µM PCP; 0.11 µM TeCPs; 0.13 µM TCPs, except for 0.25 µM246-TCP; 0.61 µM DCPs, except for 0.31 µM 23-DCP and 1.5µM 24-DCP; 3.9 µM 2-MCP and 4-MCP and 2.0 µM 3-MCP.
FBR biomass concentrations were determined by mea-suring the mass of volatile solids (VS) per unit Celite mass.Biomass/Celite samples were withdrawn from the FBRs anddried overnight at 110 °C in preweighed, pretreated (550 °Cfor 1 h) aluminum trays to determine the mass (g) of totalsolids (TS). The samples subsequently were heated at 550 °Cfor 30 min to burn off the VS and to determine the mass ofnonvolatile solids (NVS), which was assumed to equal theCelite mass (g) in the samples. The VS mass (g) was thedifference between the TS and the NVS and was normalizedto NVS mass. Total reactor VS concentrations were estimatedby multiplying the milligrams of VS/gram of Celite by 50grams of Celite/FBR (110 g of Celite/L-reactor).
Phenol and chlorinated phenols were obtained fromAldrich Chemical Co. (Milwaukee, WI). All compounds weregreater than 99% purity except for 3-MCP, 25-DCP, 26-DCP,246-TCP, and 2345-TeCP (which were 98% pure) and 2346-TeCP (which was 90% pure). The impurity in 2346-TeCP,which primarily consisted of PCP, was corrected for whencalculating 2346-TeCP dechlorination rates. Concentratedstock solutions of phenolic compounds were preparedgravimetrically in organic-free deionized (DI) water and werepH-adjusted with sodium hydroxide (NaOH). Lactate wasobtained from Aldrich Chemical Co. (Milwaukee, WI).
Modeling CP Dechlorination in the FBRs. CP removal inthe FBRs is described by a sequential Michaelis-Mentendechlorination model that relates CP dechlorination rates toaqueous-phase CP concentrations. The reactor biomassconcentration and CP solid-liquid partitioning coefficientsfor desorption were included to account for the total CPmass in the reactor. Because the dechlorination reaction rateswere relatively slow as compared to CP desorption kinetics(17), solid-liquid partitioning equilibrium was assumed, andpartitioning rates were not incorporated into the model. Notransfer to the gas phase was assumed due to the low Henry’sconstants for chlorinated phenols, which were added to thereactors as sodium salts.
At pH 7.3-7.4, for all samples, the desorption partitioncoefficient (Kd,n) values obtained and used with the kinetic
VOL. 33, NO. 10, 1999 / ENVIRONMENTAL SCIENCE & TECHNOLOGY 9 1605

test data are as follows (17): Kp,PCP ) 0.273 L/g; Kp,2346-TeCP
) 0.139 L/g; Kp,2345-TeCP ) 0.286 L/g; Kp,246-TCP ) 0.149 L/g;Kp,245-TCP ) 0.187 L/g; Kp,345-TCP ) 0.401 L/g; Kp,24-DCP ) 0.121L/g; Kp,34-DCP ) 0.252 L/g; Kp,4-MCP ) 0.092 L/g. FBR VSconcentrations were 9.8 ( 0.7 mg of VS/g of Celite in FBR-1and 11.4 ( 1.1 mg of VS/g of Celite in FBR-2. Thus, the fractionof CPs adsorbed onto the Celite biomass ranged from 9% for4-MCP to 31% for 345-TCP.
The general mass balance equation describing the fate ofa single-CP in the liquid phase is shown in eq 1:
where Φ is the FBR liquid volume (L); Q is the liquid flow rate(L/d); Kd,n is the CP solid-liquid partition coefficient (L/g ofVS) ) Xn/M‚CPn; Xn is the CPn mass sorbed (µg); M is themass of volatile solids (g of VS); VS is the volatile solidsconcentration (g/L); CPn is the reactor aqueous-phase CPconcentration (µmol/L); CPni is the influent CP concentration(µmol/L); r is the net CP transformation rate (µmol/L-day);and n is the number of chlorines, identifying the CP congener.
The CP transformation kinetics are described in eq 2. Foreach CP intermediate, the model included a production termdue to the dechlorination of a previous, more chlorinatedCP (CPn+1) and included a depletion term due to thedechlorination of the intermediate (CPn):
where Vm,n is the maximum dechlorination rate of CPn (µmol/L-day) and K s,n
app is the apparent half-saturation constant forCPn (µmol/L).
The FBR biomass included fermentation, methanogenic,and dechlorinating bacteria. Because the dechlorinatingbiomass concentration could not be separated from theoverall biomass concentration in the FBRs, the term Vm wasused to represent the maximum dechlorination rate (kX′),where k equals the maximum specific dechlorination rate(µmol/g-day) and X′ equals the CP-dechlorinating biomassconcentration (g/L). Where appropriate, the apparent half-saturation constant accounts for competitive inhibition, asshown in eq 3:
where CPn(1, CPn(2, etc. are the concentrations of inhibitingCPs (n ( 1) and (n ( 2) (µmol/L) and Ki,n(1, Ki,n(2, etc. arethe inhibitor constants (Ks) for CPs (n ( 1) and (n ( 2) (µmol/L). When no competitive inhibition was found, K s,n
app equalsKs,n, which was determined in the single-compound tests.Although kinetic models have been developed by empiricallyselecting Ki values (20), in this competitive inhibition modelthe experimentally determined Ks value for a CP was usedas its Ki value in determining K s,n
app values (21).The maximum CP dechlorination rates (Vm) and the half-
saturation coefficients (Ks) were determined individually forPCP and each CP intermediate from the single-compoundbatch dechlorination tests. The dechlorination rates ac-counted for changes in the total CP mass over time, includingaqueous- and solid-phase concentrations, based on aqueous-phase Vm values (Vm(aq)) and CP partition coefficients (eq 4).Vm(aq) values were determined from linear regressions of initialchanges in aqueous-phase CP concentrations versus time.The single-compound Ks values were determined using astatistical data-fitting program (22). Competitive inhibitionbetween parent compounds and their competing CP inter-
mediates was factored into the analysis of Ks values forcompeting CPs, as shown in eq 4:
A basic assumption for the model was that biofilmdiffusion limitations were not significant. This assumptionwas supported by transmission electron microscopy (TEM)studies (17) that showed a thin biofilm on the outer surfaceof the Celite particles of about 15-50 µm (see SupportingInformation). An estimated biofilm thickness of 10 µm wascalculated (17), based on the FBR VS concentrations and thetotal external (spherical) Celite surface area (see SupportingInformation), supporting the thin biofilm assumption.
The model was solved using Stella II, Version 3.0.5 software(23). Stella calculates the dynamic response for multipledifferential equations using Runge-Kutta analysis by in-corporating a series of simultaneous differential equationsfor each compound and its metabolites in the solid and liquidphases.
Results and DiscussionCP-Dechlorination Pathways. During startup of the metha-nogenic FBRs, PCP dechlorinated via initial o- and m-chlorineremovals, producing 2345- and 2346-TeCP; 345-, 245-, and246-TCP; and 24-DCP as intermediates. Low concentrations(e5 µmol/L) of dechlorination intermediates were measuredin the FBRs, but after 6.5 months, the concentrations ofintermediates were below their detection limits; 34-DCP and4-MCP were the sole end products of PCP dechlorination.
Figure 1 shows the PCP-dechlorination pathways in theFBRs. Solid (single- or double-lined) arrows represent thePCP-dechlorination pathways from the 3rd to 14th monthsof operation after startup. During this time, which was whenthe single-CP batch kinetic tests were conducted (month 8),PCP was solely meta-dechlorinated to 2346-TeCP, and morethan 80% of the 2346-TeCP produced via PCP dechlorinationwas meta-dechlorinated to 246-TCP. The 246-TCP wasdechlorinated sequentially to 4-MCP. Double-lined arrowsrepresent this pathway. The remaining 2346-TeCP wasdechlorinated sequentially via 245-TCP to 34-DCP, repre-sented by single-lined arrows. Despite the prolonged expo-sure to 34-DCP and 4-MCP (over 2 years) and the high degreeof meta-dechlorination in the FBRs, para-dechlorination was
FIGURE 1. PCP dechlorination pathways in both FBRs. Arrowsdirected toward the right represent ortho-dechlorination reactions.Those directed toward the left represent meta-dechlorinationreactions. Solid lines represent the PCP dechlorination pathwaysappearing during the first 14 months of operation. Dashed linesrepresent a minor pathway that first appeared after 14 months ofoperation. Double lines indicate the dominant dechlorinationpathway observed throughout the experimental period.
Φ(1 + Kd,n‚VS)dCPn
dt) Q‚CPni - Q‚CPn + Φr (1)
r ) -Vm,n‚CPn
K s,napp + CPn
+Vm,n+1‚CPn+1
K s,n+1app + CPn+1
(2)
K s,napp ) Ks,n(1 +
CPn(1
Ki,n(1+
CPn(2
Ki,n(2+ ...) (3)
Vm ) Vm(aq)(1 + Kd,n‚VS) (4)
1606 9 ENVIRONMENTAL SCIENCE & TECHNOLOGY / VOL. 33, NO. 10, 1999
not observed throughout the study period, and 245-TCP and34-DCP were never meta-dechlorinated.
After 14 months of continuous operation, ortho-PCPdechlorination was seen with the appearance of 2345-TeCP;this pathway is represented by dashed arrows in Figure 1.The 2345-TeCP subsequently was dechlorinated to 34-DCPvia 345-TCP or 245-TCP. The first appearance of 2345-TeCPoccurred after a series of 246-TCP and 245-TCP batchdechlorination tests, suggesting that the repeated applicationof 246-TCP and/or 245-TCP in the FBRs enriched for ortho-PCP dechlorination to 345-TCP. Enrichment of position-specific dechlorination using mono-, di-, or trichlorophenolshas been reported by others (11, 13, 15, 16), and several ortho-dechlorinating strains that dechlorinate higher CPs have beenreported (4-8). Thus, the reappearance of ortho-PCP dechlo-rination after the TCP kinetic tests showed that the PCPdechlorination pathways in the FBRs were subject to changeover time and that the ortho-dechlorination pathway couldbe stimulated by the growth of ortho-TCP dechlorinators.
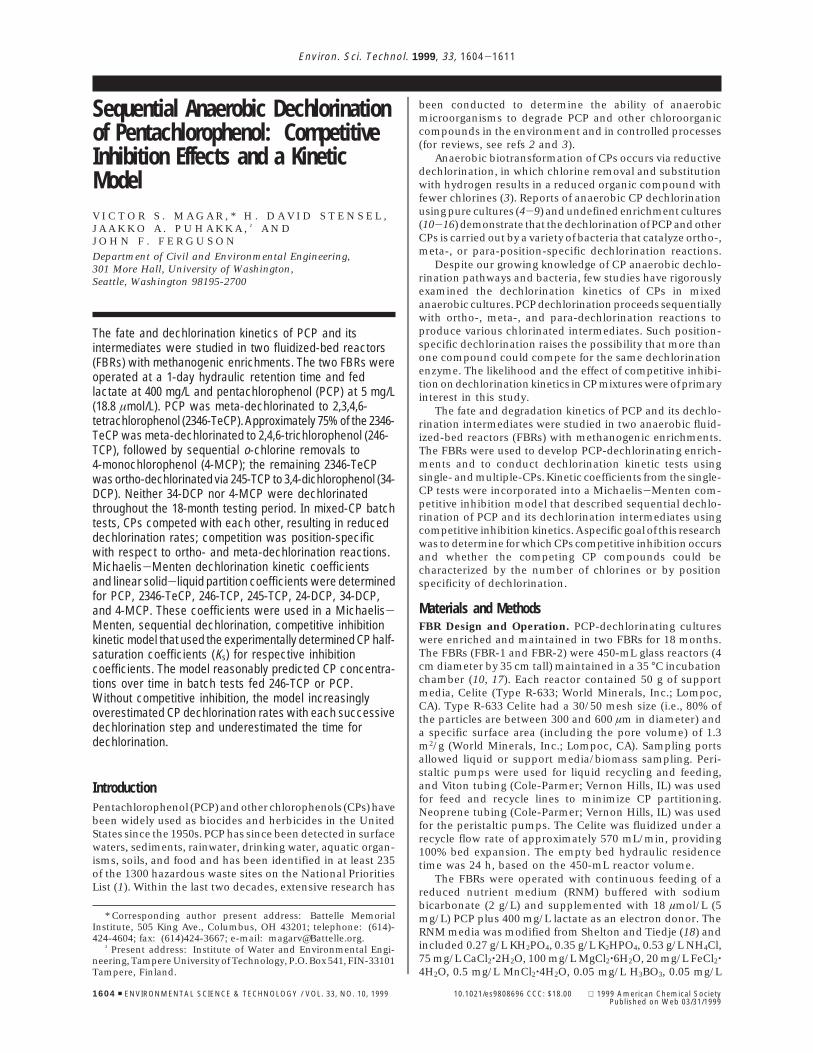
Determination of Michaelis-Menten Kinetic Coef-ficients for Single-CP Compound Batch Kinetic Tests inthe FBRs. Batch tests were conducted using single-CPcompounds, to establish Michaelis-Menten kinetic ratecoefficients, for each CP in the PCP-dechlorination pathway.Examples of the single-compound CP batch kinetic test resultsare shown in Figures 2 and 3, where measured parentcompound aqueous-phase concentrations are plotted formultiple batch kinetic tests. The batch 245-TCP dechlori-nation test results (Figure 2) are shown as an example of aCP that underwent a single dechlorination step, in this caseto 34-DCP. The 2346-TeCP dechlorination results (Figure 3)are shown as an example CP that underwent multipledechlorination steps, ending with 34-DCP and 4-MCP.
Initial linear dechlorination rates (V(aq)) were determinedfrom each batch kinetic test, as shown in Figures 2 and 3.The maximum measured V(aq) value for each CP was takenas Vm(aq). For 2346-TeCP, the dechlorination rates werecorrected for initial PCP dechlorination to 2346-TeCP. TheVm and Ks values determined from the single-CP-compoundtests are shown in Table 1, along with confidence limits forKs. Vm values are highest for PCP and 2345-TeCP, followedby 2346-TeCP, 245-TCP, and 345-TCP, and are lowest for246-TCP and 24-DCP. All Ks values were below 1.0 µmol/L,which is in agreement with the fact that CP-intermediateconcentrations were below their respective detection limitsduring steady-state FBR operation.
Competition between CPs. Examination of the position-specific dechlorination reactions shown in Figure 1 showsthat some CPs were dechlorinated only via ortho or metareactions, while others were dechlorinated at both positionswith one being the dominant reaction.
A series of batch tests was carried out to test the hypothesisthat the same enzymes are used to attack CPs with the sameposition-specific dechlorination reactions, resulting in com-petition between these compounds. If competition exists,CP dechlorination rates should decrease in the presence ofcompeting CPs. For some CPs where both ortho and metareactions could occur (i.e., PCP and 2346-TeCP), the me-tabolite distribution also was evaluated, because competitionat one reaction site could shift more of the dechlorinationto the other site.
Competition between meta-Dechlorinated CPs. Figure4 shows that the presence of 345-TCP or 2345-TeCP decreasedthe rate of PCP dechlorination. Because 345-TCP was solelymeta-dechlorinated and both PCP and 2345-TeCP wereprimarily meta-dechlorinated, these results demonstratemeta-specific competition. Initial PCP dechlorination rateswere determined for each batch test using linear regressions
FIGURE 2. Aqueous-phase 245-TCP concentrations versus time forbatch 245-TCP dechlorination tests in FBR-1. Solid lines highlightaqueous-phase, zero-order dechlorination rates with calculatedvalues.
TABLE 1. Michaelis-Menten CP Dechlorination Kinetic ValuesDetermined from Batch FBR Tests
Ks 95% confidence limitschlorophenol
Vm (µmolL-1 h-1)
Ks(µmol/L) lower 95% upper 95%
PCP 16.6 0.41 0.29 0.532345-TeCP 17.0 0.38 0.17 0.592346-TeCP 11.4 0.06 0.03 0.10345-TCP 9.7 0.23 0.07 0.39245-TCP 12.4 0.82 0.58 1.05246-TCP 6.4 0.11 0.06 0.1724-DCP 6.0 0.30 0.02 0.58
FIGURE 3. Aqueous-phase 2346-TeCP (4) concentrations and PCPconcentrations (0) versus time for batch 2346-TeCP dechlorinationtests in FBR-1. Solid lines highlight aqueous-phase, zero-orderdechlorination rates with calculated values.
FIGURE 4. Aqueous-phase PCP concentration versus time with 5.6µmol/L 345-TCP (4) or 8.1 µmol/L 2345-TeCP (O) in mixed-CP batch-fed dechlorination tests. Duplicate PCP-only tests (0) are shownto demonstrate the reproducibility of the tests.
VOL. 33, NO. 10, 1999 / ENVIRONMENTAL SCIENCE & TECHNOLOGY 9 1607

of the first three to four time points (i.e., the first 10-15 min)of each curve in Figure 4.
The PCP-only dechlorination test was replicated todetermine the variation in dechlorination rates during the2-week testing period for these tests. Initial dechlorinationrates are shown in the figure. The PCP dechlorination ratesof the duplicate batch tests averaged 4.02 ( 0.05 µmol L-1
h-1, demonstrating reproducibility of the PCP-only batchtests. In the presence of 5.6 µmol/L 345-TCP, the initial PCPdechlorination rate was reduced by approximately 65%, andin the presence of 8.1 µmol/L 2345-TeCP, the initial PCPdechlorination rate was reduced by 55%.
Increasing initial 345-TCP and 2345-TeCP concentrationsalso led to increasing ortho-dechlorination metabolite con-centrations and decreasing meta-dechlorination metaboliteconcentrations (data not shown) supporting the hypothesisthat the inhibition of PCP dechlorination by 345-TCP and2345-TeCP primarily was meta-specific.
Competition between ortho-Dechlorinated CPs. Figure5 shows that the presence of 246-TCP decreased the 2346-TeCP dechlorination rate, whether 246-TCP was introducedat the onset of the test or 1 h after spiking the reactor with2346-TeCP. Initial 2346-TeCP dechlorination rates with andwithout 246-TCP are shown in the figure. The addition of246-TCP resulted in a 56% reduction in the 2346-TeCP-dechlorination rate when added at the onset of the experi-ment and resulted in a 65% reduction when added 60 minafter 2346-TeCP. 2346-TeCP also was tested for ortho-specificinhibition using 245-TCP. The addition of 5.2 µmol/L 245-TCP with 4.2 µmol/L 2346-TeCP resulted in a 57% reductionin the initial 2346-TeCP-dechlorination rate (results notshown). Because 246-TCP and 245-TCP were solely ortho-dechlorinated, these results are used to demonstrate ortho-specific inhibition of 2346-TeCP.
246-TCP (15 µM) was tested with PCP (5 µM) to examineortho-specific PCP inhibition. Because PCP primarily wasmeta-dechlorinated, reduced ortho-PCP dechlorination hada negligible effect on the PCP dechlorination rate; i.e., PCPdechlorination rates with and without 246-TCP averaged 4.0( 0.24 µmol L-1 h-1 (results not shown). However, the additionof 246-TCP led to decreased 2345-TeCP and 34-DCP inter-mediate concentrations (peak concentrations decreased from0.4 µmol/L to below detection limit and from 3.0 to 1.5 µmol/L, respectively) and increased 2346-TeCP intermediateconcentrations (peak concentrations increased from 1.4 to2.5 µmol/L). Thus for PCP, competition at the ortho-dechlorination site shifted more of the dechlorination to themeta site, suggesting that ortho-specific inhibition of PCPdechlorination occurred although PCP dechlorination rateswere unaffected.
Competition between ortho-Dechlorinated CPs andmeta-Dechlorinated CPs. In separate tests, 345-TCP wascombined with 246-TCP or 245-TCP to investigate inhibitionbetween ortho- and meta-dechlorinated CPs. Tables 2 and3show results of the single- and mixed-CP batch tests for246-TCP and 345-TCP and for 246-TCP and 345-TCP,respectively. The presence of 345-TCP did not affect the 245-TCP and 246-TCP dechlorination rates, and the presence of245-TCP and 246-TCP did not affect 345-TCP dechlorinationrates. These results support the hypothesis that competitionis position-specific, where CP dechlorination rates wereunaffected by CPs dechlorinated at strictly different positions.
Competition between CPs with both ortho- and meta-Dechlorination Reactions. Batch PCP dechlorination testswere conducted with initial PCP concentrations of 3.5 ( 0.3µmol/L and initial 2346-TeCP concentrations of 0, 5.2, and8.6 µmol/L to examine inhibition between PCP and 2346-TeCP. Surprisingly, 2346-TeCP did not affect PCP dechlo-rination rates (PCP dechlorination rates were 11.4 ( 0.7 µmolL-1 h-1), and the distribution of ortho- and meta-dechlori-nation reactions did not reveal position-specific inhibition(not shown). The effect of PCP on 2346-TeCP was difficultto ascertain because 2346-TeCP was a metabolite of PCP.
Table 4 summarizes the observed position-specific com-petitive inhibition for CP dechlorination. 245-TCP did notappear to compete with 246-TCP or 24-DCP, although allthree CPs were ortho-dechlorinated and both TCPs competedwith common CPs (i.e., both competed with PCP, 2345-TeCP,and 2346-TeCP). This observation could be explained ifmultiple ortho-dechlorinating microorganisms were presentin the FBRs, masking the effect of competition between theseCPs. Although this conclusion could not be verified by theresults, it is supported by the variety of ortho-dechlorinatingbacteria identified in the literature.
The competition studies provide evidence for at least threedifferent position-specific groups of CP-dechlorinating bac-teria in the FBRs, one meta- and two ortho-dechlorinatinggroups. Indirectly, they also suggest a fourth group of
FIGURE 5. Aqueous-phase 2346-TeCP concentrations versus timewith 11 µmol/L 246-TCP added with 2346-TeCP (4) or added 60 minafter spiking with 2346-TeCP (O) in mixed-CP batch-fed dechlo-rination tests. One test includes 2346-TeCP only (0) without 246-TCP addition.
TABLE 2. Effect of 345-TCP on 246-TCP Dechlorination andThat of 246-TCP on 345-TCP Dechlorination in Batch FBRTestsa
initial CP concn (µmol/L) dechlorination rate (µmol L-1 h-1)
246-TCP 345-TCP 246-TCP 345-TCP
12.8 3.1(12.8-11.4)
14.4 1.5 3.3 2.2(13.5-12.2) (1.4-0.2)
1.4 2.0(1.5-0.5)
a Parentheses ( ) identify concentration ranges over which dechlo-rination rates were determined.
TABLE 3. Effect of 345-TCP on 245-TCP Dechlorination andThat of 245-TCP on 345-TCP Dechlorination in Batch FBRTestsa
initial CP concn (µmol/L) dechlorination rate (µmol L-1 h-1)
245-TCP 345-TCP 245-TCP 345-TCP
6.7 4.4(6.7-3.0)
6.7 1.6 4.9 2.3(6.7-3.2) (1.4-0.5)
1.4 2.0(0.7-0.3)
a Parentheses ( ) identify concentration ranges over which dechlo-rination rates were determined.
1608 9 ENVIRONMENTAL SCIENCE & TECHNOLOGY / VOL. 33, NO. 10, 1999
dechlorinating bacteria not present in the FBRs, which wouldbe required for para-dechlorination.
Modeling CP Dechlorination in the FBRs for Single-Compound Batch Tests. The Vm and Ks values obtained fromthe single-CP batch tests were incorporated into a sequentialdechlorination Michaelis-Menten model to predict aqueous-phase CP concentrations in batch dechlorination tests. Themodel assumed no competition, competitive inhibition,noncompetitive inhibition, or mixed inhibition between CPs.In each case, competition was modeled using Michaelis-Menten kinetics, where Ks values of competing CPs equaledtheir corresponding Ki values (21). The noncompetitive andmixed inhibition models significantly overestimated theextent of competition and underestimated the dechlorinationrates of parent CPs and their dechlorination intermediates(17), resulting in overestimated CP concentrations over time(results not shown). For this reason, the noncompetitive andmixed inhibition models were ruled out.
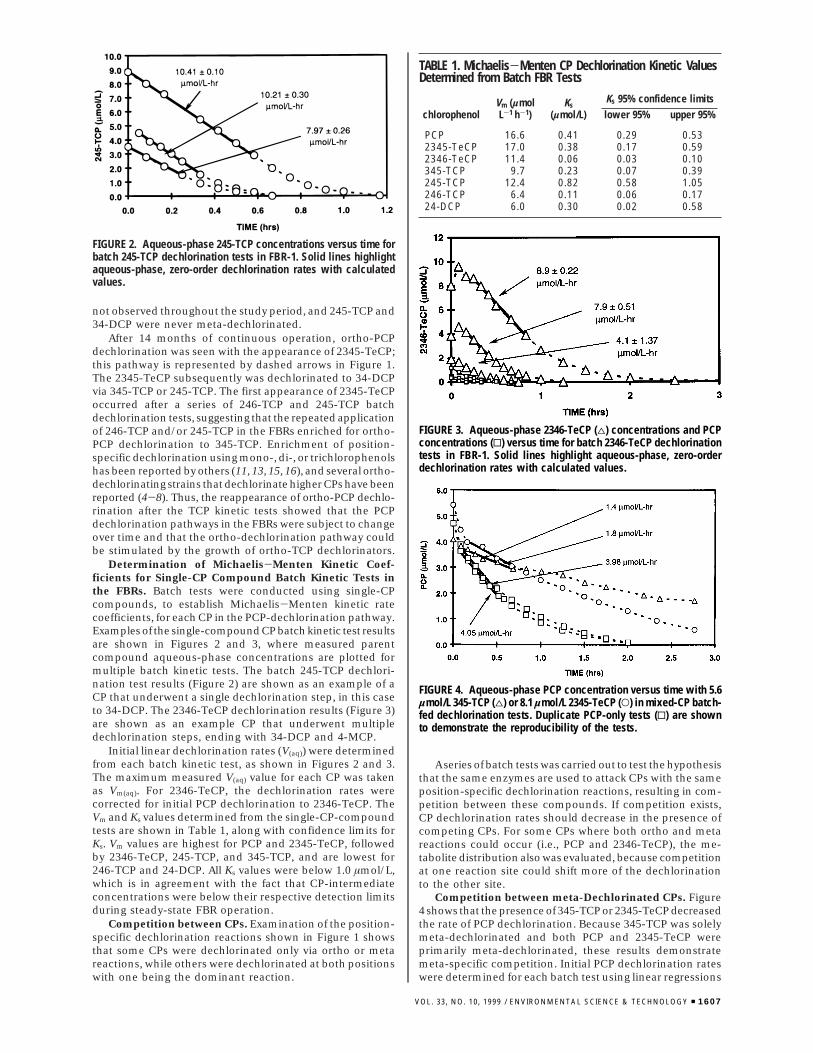
Figure 6 shows model-predicted CP concentrations for a246-TCP batch dechlorination experiment, with and withoutcompetitive inhibition. The model without competitiveinhibition (Figure 6a) overestimates the 246-TCP and 24-DCP dechlorination rates. When competitive inhibition isincluded (Figure 6b), the predicted aqueous-phase CPconcentrations were close to their corresponding measuredconcentrations. These results support the observed orthocompetition between 246-TCP and 24-DCP and suggest thatMichaelis-Menten competitive inhibition kinetics can beused to describe the two-step dechlorination process.
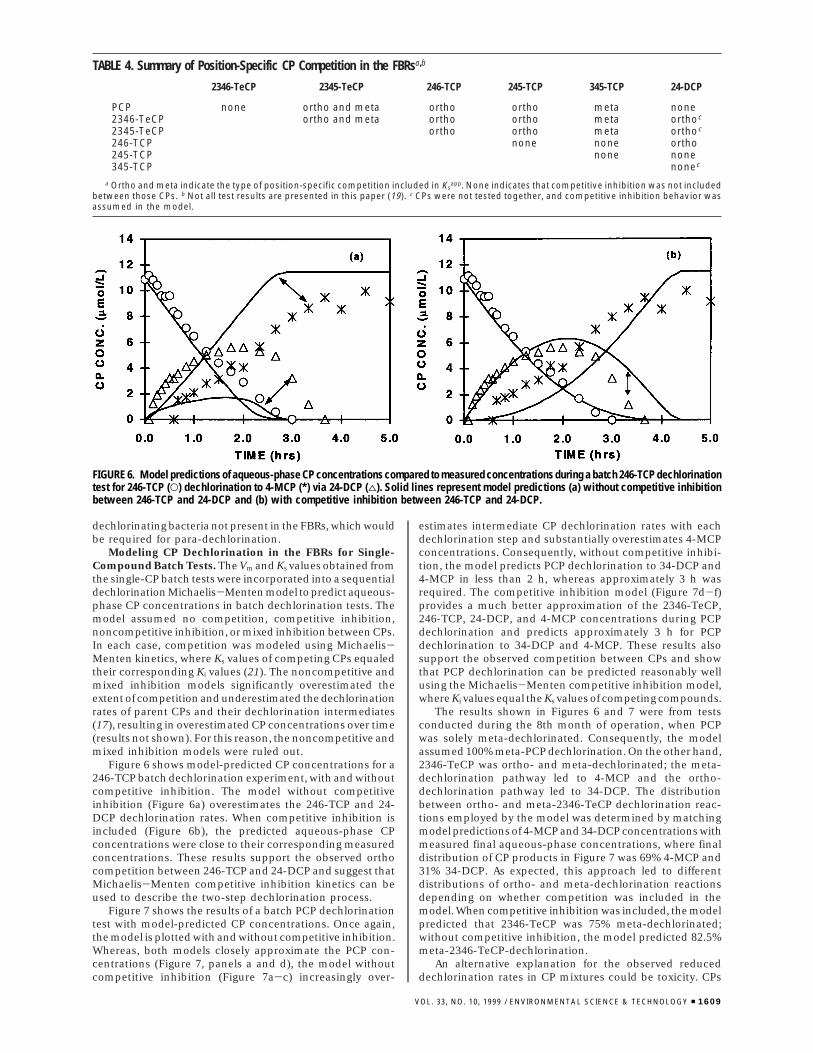
Figure 7 shows the results of a batch PCP dechlorinationtest with model-predicted CP concentrations. Once again,the model is plotted with and without competitive inhibition.Whereas, both models closely approximate the PCP con-centrations (Figure 7, panels a and d), the model withoutcompetitive inhibition (Figure 7a-c) increasingly over-
estimates intermediate CP dechlorination rates with eachdechlorination step and substantially overestimates 4-MCPconcentrations. Consequently, without competitive inhibi-tion, the model predicts PCP dechlorination to 34-DCP and4-MCP in less than 2 h, whereas approximately 3 h wasrequired. The competitive inhibition model (Figure 7d-f)provides a much better approximation of the 2346-TeCP,246-TCP, 24-DCP, and 4-MCP concentrations during PCPdechlorination and predicts approximately 3 h for PCPdechlorination to 34-DCP and 4-MCP. These results alsosupport the observed competition between CPs and showthat PCP dechlorination can be predicted reasonably wellusing the Michaelis-Menten competitive inhibition model,where Ki values equal the Ks values of competing compounds.
The results shown in Figures 6 and 7 were from testsconducted during the 8th month of operation, when PCPwas solely meta-dechlorinated. Consequently, the modelassumed 100% meta-PCP dechlorination. On the other hand,2346-TeCP was ortho- and meta-dechlorinated; the meta-dechlorination pathway led to 4-MCP and the ortho-dechlorination pathway led to 34-DCP. The distributionbetween ortho- and meta-2346-TeCP dechlorination reac-tions employed by the model was determined by matchingmodel predictions of 4-MCP and 34-DCP concentrations withmeasured final aqueous-phase concentrations, where finaldistribution of CP products in Figure 7 was 69% 4-MCP and31% 34-DCP. As expected, this approach led to differentdistributions of ortho- and meta-dechlorination reactionsdepending on whether competition was included in themodel. When competitive inhibition was included, the modelpredicted that 2346-TeCP was 75% meta-dechlorinated;without competitive inhibition, the model predicted 82.5%meta-2346-TeCP-dechlorination.
An alternative explanation for the observed reduceddechlorination rates in CP mixtures could be toxicity. CPs
TABLE 4. Summary of Position-Specific CP Competition in the FBRsa,b
2346-TeCP 2345-TeCP 246-TCP 245-TCP 345-TCP 24-DCP
PCP none ortho and meta ortho ortho meta none2346-TeCP ortho and meta ortho ortho meta orthoc
2345-TeCP ortho ortho meta orthoc
246-TCP none none ortho245-TCP none none345-TCP nonec
a Ortho and meta indicate the type of position-specific competition included in Ksapp. None indicates that competitive inhibition was not included
between those CPs. b Not all test results are presented in this paper (19). c CPs were not tested together, and competitive inhibition behavior wasassumed in the model.
FIGURE 6. Model predictions of aqueous-phase CP concentrations compared to measured concentrations during a batch 246-TCP dechlorinationtest for 246-TCP (O) dechlorination to 4-MCP (*) via 24-DCP (4). Solid lines represent model predictions (a) without competitive inhibitionbetween 246-TCP and 24-DCP and (b) with competitive inhibition between 246-TCP and 24-DCP.
VOL. 33, NO. 10, 1999 / ENVIRONMENTAL SCIENCE & TECHNOLOGY 9 1609
are known uncouplers of oxidative phosphorylation and aretoxic to anaerobic organisms. Three factors indicate theinhibition observed in the mixed-CP batch tests was not dueto toxicity. First, toxicity can be reduced by acclimation toCPs. Thus, the FBR cultures were expected to be moreresistant to CP toxicity than unacclimated cultures. Second,the appearance of position-specific inhibition makes toxicityan unlikely explanation for the observed inhibition effectsbetween CPs. Although toxicity may be considered “isomer-specific” (i.e., certain CPs could be more toxic than others
could), it is not likely that toxicity would result in the selectiveinhibition of position-specific dechlorination pathways.Third, the sequential dechlorination model, which did notaccount for toxicity, demonstrated that CP dechlorinationcould be modeled using Michaelis-Menten competitiveinhibition kinetics.
A greater understanding of kinetic behavior and the effectsof competition among CPs should lead to more efficient exsitu anaerobic treatment reactor designs and better predic-tions of the behavior of PCP and other CPs during anaerobic
FIGURE 7. Model predictions of aqueous-phase CP concentrations compared to measured concentrations during a batch PCP dechlorinationtest where PCP (0) dechlorinated to 34-DCP (+) and 4-MCP (*) via 2346-TeCP (4), 245-TCP (×), 246-TCP (O), and 24-DCP (]). Solid lineswithout symbols represent model predictions (a-c) without competitive inhibition and (d-f) with competitive inhibition among CPs.
1610 9 ENVIRONMENTAL SCIENCE & TECHNOLOGY / VOL. 33, NO. 10, 1999

in situ bioremediation. Historically, groundwater fate andtransport models, such as Bioplume I and II (24), relied onsimple first-order degradation rates. However, newer models,such as RT3D (25) or BioF&T-3D (26), increasingly useMichaelis-Menten kinetics. Models that do not incorporateMichaelis-Menten kinetics cannot address competitiveinhibition. Furthermore, design models that do not includecompetition between CPs risk over predicting CP dechlo-rination rates in CP mixtures and under predicting the timefor remediation.
AcknowledgmentsThis research was supported by the Water EnvironmentResearch Foundation (Grant 91-TFT-3) and the King CountyDepartment of Natural Resources.
Supporting Information AvailableTEM examination of biofilm depth on the Celite supportmatrix, including four figures (8 pages). This material isavailable free of charge via the Internet at http://pubs.acs.org.
Literature Cited(1) U.S. Department of Health and Human Services. Toxicological
Profile for Pentachlorophenol; Agency for Toxic Substances andDisease Registry, U.S. DHHS: Atlanta, GA, 1992.
(2) Haggblom, M. M. FEMS Microbiol. Rev. 1992, 103, 29-72.(3) Mohn, W. W.; Tiedje, J. M. Microbiol. Rev. 1992, 56, 482-507.(4) Christiansen, N.; Ahring, B. K. Int. J. Syst. Bacteriol. 1996, 46,
442-448.(5) Sanford, R. A.; Cole, J. R.; Loffler, R. E.; Tiedje, J. M. Appl. Environ.
Microbiol. 1996, 62, 3800-3808.(6) Cole, J. R.; Cascarelli, A. L.; Mohn, W. W.; Tiedje, J. M. Appl.
Environ. Microbiol. 1994, 60, 3536-3542.(7) Utkin, I.; Woese, C.; Wiegel, J. Int. J. Syst. Bacteriol. 1994, 44,
612-619.(8) Madsen, T.; Licht, D. Appl. Environ. Microbiol. 1992, 58, 2874-
2878.(9) Mohn, W. W.; Kennedy, K. J. Appl. Environ. Microbiol. 1992, 58,
1367-1370.(10) Magar, V. S.; Mohn, H.; Puhakka, J. A.; Stensel, H. D.; Ferguson,
J. F. In Bioremediation of Chlorinated Solvents; Hinchee, R. E.,Leeson, A., Semprini, L., Eds.; Battelle Press: Columbus, OH,1995.
(11) Mohn, W. W.; Kennedy, K. J. Appl. Environ. Microbiol. 1992, 58,2131-2136.
(12) Nicholson, D. K.; Woods, S. L.; Istok, J. D.; Peek, D. C. Appl.Environ. Microbiol. 1992, 58, 2280-2286.
(13) Bryant, F. O.; Hale, D. D.; Rogers, J. E. Appl. Environ. Microbiol.1991, 57, 2293-2301.
(14) Woods, S. L.; Ferguson, J. F.; Benjamin, M. M. Environ. Sci.Technol. 1989, 23, 62-68.
(15) Mikesell, M. D.; Boyd, S. A. Appl. Environ. Microbiol. 1986, 52,861-865.
(16) Boyd, S. A.; Shelton, D. R. Appl. Environ. Microbiol. 1984, 47,272-277.
(17) Magar, V. S. Ph.D. Dissertation, University of Washington,Seattle, WA, 1996.
(18) Shelton, D. R.; Tiedje, J. M. Appl. Environ. Microbiol. 1984, 47,850-857.
(19) Breznak, J. A.; Costilow, R. N. In Methods for General andMolecular Bacteriology; Gerhardt, P., Murray, R. G. E., Wood,W. A., Krieg, N. R., Eds.; American Society for Microbiology:Washington, DC, 1994.
(20) Suflita, J. M.; Robinson, J. A.; Tiedje, J. M. Appl. Environ.Microbiol. 1983, 45, 1466-1473.
(21) Bailey, J. E.; Ollis, D. F. Biochemical Engineering Fundamentals;McGraw-Hill: New York, 1986.
(22) SYSTAT, Inc. SYSTAT Version 5.04 for Windows; SYSTAT:Evanston, IL, 1994.
(23) High Performance Systems, Inc. STELLA II, Version 3.07; AlturaSoftware, Inc.: Hanover, NH, 1996.
(24) Rifai, H. S.; Bedient, P. B.; Haasbeek, J. F.; Borden, R. C. BioplumeII, Version 1.01; International Ground Water Modeling Center(IGWMC), Colorado School of Mines: Boulder, CO, 1988.
(25) Brigham Young UniversitysEngineering Computer GraphicsLaboratory. GMS Department of Defense Groundwater ModelingSystem, RT3D; Brigham Young University: Provo, UT, 1995.
(26) Draper Aden Environmental Modeling. BioF&T-3D (Version 1.1),Flow and Transport in the Saturated and Unsaturated Zones in2- or 3-Dimensions; Draper Aden Environmental Modeling,Inc.: Blacksburg, VA, 1995.
Received for review August 24, 1998. Revised manuscriptreceived February 12, 1999. Accepted February 15, 1999.
ES9808696
VOL. 33, NO. 10, 1999 / ENVIRONMENTAL SCIENCE & TECHNOLOGY 9 1611