sequence divergence, functional constraint and … divergence, functional constraint and selection...
TRANSCRIPT

Sequence divergence, functional constraint andselection in protein evolution
Justin C. Fay ∗
Department of Genome SciencesLawrence Berkeley National Laboratory
Berkeley, CA 94720and
Chung-I WuDepartment of Ecology and Evolution
University of ChicagoChicago, IL 60637
January 29, 2003
Abstract
The genome sequences of multiple species has made possible func-tional inferences from comparative genomics. A primary objective isto infer biological functions from the conservation of homologous DNAsequences between species. A second more difficult objective is to un-derstand what functional DNA sequences have changed over time andare responsible for species’ phenotypic differences. The neutral theoryof molecular evolution provides a theoretical framework in which bothobjectives can be explicitly tested. Development of statistical testswithin this framework has provided much insight into the evolution-ary forces that constrain and in some cases change DNA sequencesand the resulting patterns that emerge. Here, we review recent work
∗Corresponding Author: Justin Fay ( [email protected] ), One Cyclotron Road, Mailstop84-171, LBNL, Berkeley, CA 94720, Phone 510-486-6791. Fax 510-486-5614
1

on how functional constraint and changes in protein function are in-ferred from protein polymorphism and divergence data. We relatethese studies to our understanding of the neutral theory and adaptiveevolution.
Contents
1 Introduction 3
2 Divergence 42.1 Theory . . . . . . . . . . . . . . . . . . . . . . . . . . . . . . . 52.2 ka/ks test . . . . . . . . . . . . . . . . . . . . . . . . . . . . . 6
2.2.1 Estimating ka/ks . . . . . . . . . . . . . . . . . . . . . 62.2.2 Application of the ka/ks test . . . . . . . . . . . . . . 82.2.3 Codon based ka/ks tests . . . . . . . . . . . . . . . . . 92.2.4 Lineage specific ka/ks test . . . . . . . . . . . . . . . . 10
2.3 Change in ka/ks . . . . . . . . . . . . . . . . . . . . . . . . . 102.3.1 Relative rates test . . . . . . . . . . . . . . . . . . . . . 112.3.2 Duplicate genes . . . . . . . . . . . . . . . . . . . . . . 12
2.4 Genome comparisons . . . . . . . . . . . . . . . . . . . . . . . 122.5 Independence . . . . . . . . . . . . . . . . . . . . . . . . . . . 142.6 Selection on synonymous sites . . . . . . . . . . . . . . . . . . 15
3 Polymorphism 153.1 Theory . . . . . . . . . . . . . . . . . . . . . . . . . . . . . . . 163.2 Detecting selection . . . . . . . . . . . . . . . . . . . . . . . . 173.3 Application to data . . . . . . . . . . . . . . . . . . . . . . . . 18
4 Polymorphism and Divergence 204.1 Detecting selection . . . . . . . . . . . . . . . . . . . . . . . . 204.2 Application to data . . . . . . . . . . . . . . . . . . . . . . . . 21
5 Conclusions 22
2

1 Introduction
Evolution has left us with a fascinating puzzle. What are the DNA differ-ences that distinguish species and how did these differences arise? Before thisquestion can be addressed we must know what DNA sequences in an organ-ism’s genome are functional and how they are translated into the diversity ofbiological functions seen in nature. Both of these questions can now, at leastto some extent, be answered through the comparison of multiple genome se-quences. Although the methods of analysis have become quite sophisticated,the idea behind this approach is quite simple. Functional DNA sequencesshould be conserved over time and shared among closely related species,whereas non-functional or neutral sequences are free to change. This ap-proach has been particularly useful at identifying protein coding sequenceswithin a genome and will hopefully be as useful in identifying functionalnon-coding sequences. However, even with all coding and regulatory DNAsequences defined between two species, only a fraction of the DNA differ-ences are relevant to the species’ biological differences. For instance, it iswell known that many changes in a protein coding region can change theamino acid sequence of a protein without affecting its function. The devel-opment of statistical methods used to infer whether changes in the aminoacid sequence of a protein are functional or neutral has been of interest toboth human geneticists interested in deleterious substitutions and evolution-ary geneticists interested in adaptive substitutions.
The neutral theory of molecular evolution provides an essential frame-work in which both functional DNA sequences can be defined and functionalchanges can be identified. The neutral mutation random drift hypothesiswas proposed independently in 1968 by Kimura [45] and in 1969 by King andJukes [49]. The hypothesis was that the vast majority of DNA polymorphismwithin a species and divergence between species is neutral or non-functionalwith respect to fitness. Since its proposal, it has and still is intensely de-bated as to what are the relative contributions of positively selected andneutral mutations to DNA polymorphism and divergence. Positively selectedmutations concur a fitness advantage and are rapidly fixed whereas neutralmutations follow a stochastic process of genetic drift through a population.Regardless of the actual contribution of selection and drift, the neutral the-ory has provided an invaluable theoretical framework in which both neutraland selective models of molecular evolution can be tested. In its simplestformulation mutations occur in a finite population of size N with rate µ per
3
generation. Assuming the effective population size, N , and mutation rate,µ, remain constant, at mutation drift equilibrium the rate of molecular evo-lution k = µ, and the expected per site heterozygosity in a population underthe infinite sites model, H = 4Nµ [92]. Mutations which cause functionalchanges and are deleterious to an organism are assumed to be eliminatedfrom a population and so do not contribute to either DNA polymorphismor divergence. As will be discussed, relaxing this latter assumption is quiteimportant to understanding molecular evolution and is the main point of thenearly neutral theory proposed by Ohta [66]. However, it should be notedthat despite known violations of even the simplest formulation of the neutralmodel, it adequately describes many important features of DNA polymor-phism and divergence data [47].
In this review, we will examine empirical and theoretical work on howmutation, selection and drift affect the molecular evolution of protein codingsequences, and how, with the proper controls for these forces, amino acidchanges with functional consequences and particularly those driven by posi-tive selection can be identified. Although most research has been limited toprotein coding DNA, much of the theory and methods which will be discussedare also applicable to non-coding DNA sequences.
2 Divergence
The protein sequence of hemoglobin and cytochrome c from multiple speciesenabled the first estimates of the rate of protein evolution and indicated thatwhile each protein has its own rate of amino acid substitution the rate is con-stant across phylogenetic lineages [105]. Subsequent work made it clear thatfunctionally important sites evolve more slowly than average [49] [13] andamino acids with similar physicochemical properties are substituted moreoften than dissimilar amino acids [105]. These observations are compatiblewith the neutral theory, under which functionally important amino acid po-sitions in a protein remain constrained while neutral substitutions constitutethe bulk of protein evolution. Two questions that immediately arise are: towhat extent can protein sequence diverge while protein function remains thesame, and to what extent do proteins’ function change? The answers to thesequestions can, to some extent, be obtained from detailed characterization ofthe rate of amino acid substitution within a protein over time compared tothe rate of substitution within neutral or non-functional sequences. Of par-
4

ticular utility is a phylogenetic approach wherein an increase in the rate ofamino acid substitution in a protein along a single lineage of a phylogeny isindicative of a change in selective constraint. Although mutation rate het-erogeneities have not yet been fully characterized, the genome sequences ofclosely related species will enable the full potential of this approach to berealized.
2.1 Theory
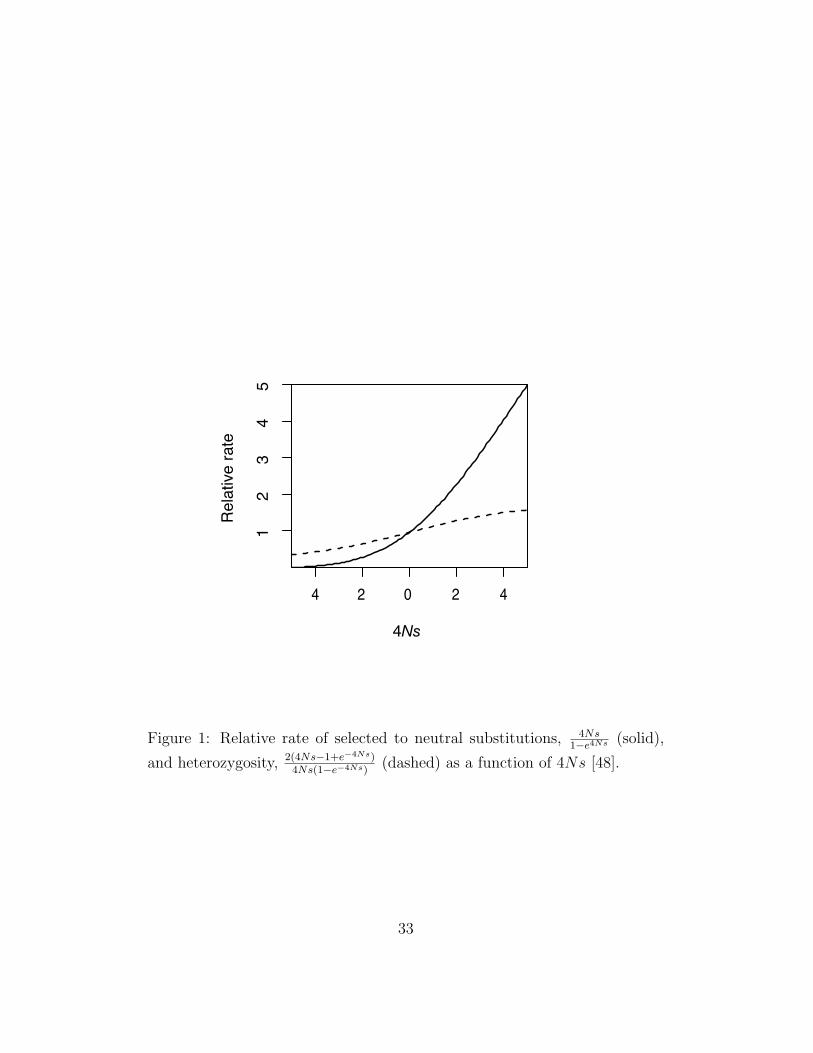
The rate of molecular evolution, or rate of DNA sequence divergence be-tween species, is a function of the rate of neutral, deleterious and advan-tageous mutations, their selection coefficients and the effective populationsize. Assuming mutations act independently of one another, the expectedrate of substitution is equal to the per generation influx of new mutationsinto a population times their probability of fixation. In a randomly matingpopulation of constant size the probability of fixation is (1−e2s)/(1−e−4Ns),where N is the effective population size and 2s is the selection coefficient ofthe homozygote [44]. Thus, the probability of fixation of a neutral substitu-tion is 1/2N and the rate of neutral substitutions is µ since every generation2Nµ new neutral mutations arise in a diploid population of size N . The rateof adaptive substitutions is approximately 4Nsµa, where µa is the mutationrate to advantageous alleles [38]. The relative rate of selected compared toneutral substitutions is shown in Figure 1. This result underlies one of themajor tenets of the neutral theory: functionally important sites will remainconstrained over time with high probability whereas neutral sites will evolveat a much faster rate determined by the mutation rate. In an evolutionaryframework, function is defined with respect to fitness and functionally con-strained sites are defined as those for which 4Ns << −1. Thus, functionalsites which when lost confer a fitness loss of as little as 0.1% are expected tobe constrained even in humans who have a small effective population size,≈ 13,000 [103]. These results suggest that sites under positive and negativeselection can be identified by their having a rate of evolution greater than orless than, respectively, the rate of neutrally evolving sites. However, muta-tion rate heterogeneities, either within or between genomes, and fluctuationsin effective population size also influence the rate of molecular evolution andso must be carefully accounted for. For instance, it is critical to control formutational heterogeneities in order to distinguish between mutational cold-spots and functionally constrained sites in cross genome comparisons.
5

2.2 ka/ks test
In protein coding sequences positive or negative selection can be tested forby a rate of amino acid substitution greater than or less than the neutralsubstitution rate, respectively. The ka/ks test does this by comparing therate of amino acid substitutions to the rate of synonymous substitutions,which are assumed to be neutral. Synonymous substitutions are those thatdo not change the amino acid sequence of a protein and typically are foundin the third but sometimes first position of a codon. Assuming synonymoussites are neutral they serve as an excellent internal control for spatial andtemporal mutational heterogeneities because they are interleaved with non-synonymous, or amino acid altering sites. Although synonymous sites maynot always be neutral this probably does not much affect the results of thetest, as will be discussed later.
2.2.1 Estimating ka/ks
Estimating ka/ks involves two steps: estimating the effective number of syn-onymous and nonsynonymous (amino acid altering) sites and estimating thesynonymous and nonsynonymous substitution rate from the number of syn-onymous and nonsynonymous differences between two sequences. These es-timates require that a mutation model be specified and can be quite sensitiveto the assumptions of the model. Most models assume a poisson process, i.e.mutations occur independently and with a constant rate. The simplest modelis to assume equal base frequencies and equal probability of mutation amongthe four bases. Under this model the effective number of synonymous sitescan be approximated as 1/3 the number of two-fold plus all the four-fold de-generate sites and the rate of synonymous and nonsynonymous substitutionbetween two sequences can be estimated by d = −3
4ln(1− 4
3p) [43], where p is
the proportion of synonymous and nonsynonymous differences, respectively.When divergence is high d is much greater than p to correct for multiplemutations at the same site and d becomes biased as sites becomes saturatedwith many substitutions per site. A maximum likelihood estimator of ka/kshas also been developed from the probability of substitution between codonsP (t) = eQt where Q is the rate matrix and t is time [32]. The maximumlikelihood estimate is often quite similar to the approximate estimate for lowlevels of divergence but is not biased when divergence is high [100].
Estimates of ka/ks are quite sensitive to the underlying mutation model
6

that is assumed. Most importantly, differences in the rate of transition andtransversion mutations must be accounted for since synonymous mutationsare more often transitions than transversions. Unequal base composition isoften found at first, second and third positions in a codon, reflecting bothmutational and selective forces [55]. For amino acid altering sites selection islikely the dominant force, whereas for synonymous sites both forces have beenshown to be influential. Comparison of base composition at synonymous andintergenic sites, assumed to be neutral, shows codon usage bias, or biasedbase composition among synonymous codons, can in part be explained bymutational biases which are expected to affect both coding and noncodingsequences [40] [88]. However, codon bias is often more extreme than basecomposition biases in surrounding regions and this remaining codon biasis best explained by weak selection |2Ns| ≈ 1 − 3 acting on translationalaccuracy or efficiency or some other character affecting fitness such as mRNAsecondary structure [1].
Both maximum likelihood and approximate methods have been developedto account for mutational biases [100]. These range from a two parametermodel, which accounts for different rates of transitions and transversions,to a 61 parameter model which accounts for unequal usage of all codons.Substantial biases in ka/ks estimates are obtained when the incorrect muta-tional model is used [100]. A common observation is a high G+C content atthird positions within a codon. It is easy to see that as third positions reachsaturation the number of differences per site is expected to be greater thanthe maximum of 3/4 expected under the Jukes-Cantor model [43], and pro-duce an overestimate of the substitution rate. Because mutation parametersare typically not known they must be estimated from the data. These arethen used to calculate both the effective number of synonymous and nonsyn-onymous sites and estimate the number of synonymous and nonsynonymoussubstitutions. When there are multiple substitutions within a codon morethan one order of events is possible and the number of synonymous and non-synonymous substitutions depend on this order. Most methods estimate theprobability of a nonsynonymous compared to synonymous substitution fromcodons with only a single change and then weight the order of events bytheir probability of occurrence [100]. For this reason and because of multiplemutations at a single site, ka/ks estimates are not reliable when either ka orks is greater than one.
More complex mutation models have also been developed to account forvariable mutation rates across sites [31]. Accounting for CpG sites, which
7
mutate at a rate 10 to 15 times higher than non-CpG sites in humans [37][50], is important to estimating substitution rates [70] but is not commonlydone. Finally, nonstationary nucleotide content can bias ka/ks estimates butis rarely incorporated into substitution models (but see [29]).
2.2.2 Application of the ka/ks test
The ka/ks test has been applied to numerous genes and is quite useful to un-derstanding the selective constraints acting on the encoded proteins as wellas any changes in selective constraints. A ka/ks of 0.20 can be interpretedas 80% of amino acid altering mutations within the protein being deleteriousor put differently 80% of the amino acid positions being functionally con-strained. The average ka/ks between human and rodent is 0.18 using 1880orthologous genes [58], 0.15 using 2112 genes [41], and the median of 12,615human and mouse orthologues is 0.12 [89]. The average ka/ks along thelineage leading to D. melanogaster is 0.20 and to D. simulans is 0.12 from 44genes [18]. Between Escherichia coli and other bacteria the average ka/ks is0.08 from 3106 genes [42]. Thus, most proteins are tightly constrained. Themagnitude of the difference between the synonymous and nonsynonymoussubstitution rates has been shown to be quite useful for identifying exonsfrom divergence data [62].
From genomic studies and from surveys of the literature [16] [56] lessthan 1% of genes have a ka/ks ratio that is significantly higher than one.Most of these genes are involved in sexual selection or disease resistance [98].These results indicate that most proteins are highly constrained and only afew proteins evolve rapidly under positive selection for a change in proteinfunction. However, the ka/ks test, while robust, is likely too conservativein detecting proteins that have evolved under positive selection between twospecies. The reason is that some regions of constraint within a protein arelikely maintained during the evolution of a new or improved function of aprotein. These regions will lower the overall rate of amino acid substitutionwithin a protein below the neutral rate unless the adaptive regions evolveat a rate fast enough to bring the average ka/ks of the entire protein aboveone. Alternatively, the period of adaptive evolution and rapid amino acidsubstitution may only occur for a short time period followed by selectiveconstraint on the new or improved protein. For instance, the Odysseus gene,identified by its involvement in reproductive isolation in Drosophila, has un-dergone 7 amino acid changes in its homeodomain in 700 million years of
8
divergence, whereas 10 amino acid substitutions have occurred in a half mil-lions years along the lineage leading to D. mauritiana [86]. Estimation ofnegative selection is also inhibited if spatial and temporal constraints are notaccounted for. A number of methods have been developed to account forpositive or negative selection limited in time or to a subset of amino acidpositions within a protein.
2.2.3 Codon based ka/ks tests
An alternative to estimating the average ka/ks of an entire protein, ka/kscan be estimated for protein domains or codons within a protein. Doingso has greatly facilitated both identifying proteins under positive selectionand better describing functional constraints on a protein [5] [64] [102] [98].Both a maximum likelihood and maximum parsimony method have beenimplemented to account for heterogeneous selection pressure among sites.
Within a maximum likelihood framework codons can evolve at differentrates under a variety of mutation models [32]. In general it is assumed that afraction of amino acid positions within a protein are constrained ka/ks < 1,a fraction are neutral ka/ks = 1, and a fraction are under positive selectionka/ks >1. Positive selection is detected if the likelihood ratio test indicatesthere is a significant improvement in the fit of the model to the data whenthe fraction of sites evolving under positive selection is greater than zero.Identification of the sites within each fraction is possible using a bayesianapproach [64]. A different approach is to use a maximum parsimony phy-logeny to infer ancestral states of a sequence and then estimate ka/ks foreach codon within a protein [78][24].
In general, both maximum likelihood and maximum parsimony methodsprovide vast improvements in describing the effects of both positive and neg-ative selection on a protein, however, there are some drawbacks. The max-imum likelihood method may depend on the initialization of the algorithmdue to multiple local maxima in the likelihood surface [79] and may also havea high rate of false positives due to assumptions of the methodologies [80].The maximum parsimony method does not incorporate many mutational bi-ases and codon usage bias. While both approaches appear to have reasonablepower and reliability [3] [4] [79] [80], a large number of sequences that arenot too close or distantly related are required for such analyses.
Codons can also be categorized by the physical and chemical propertiesof the amino acids they encode, and amino acid substitutions can be classi-
9

fied as conservative and radical based on these properties [33]. Across manyproteins, the rate of radical amino acid substitutions is much slower thanthat of conservative amino acid substitutions reflecting the greater strengthof purifying selection on changes that are more likely to affect the structure ofa protein [105] [34] [33] [95]. This classification also assists in the detection ofpositive selection. Comparison of human and old world monkey orthologuesrelated to male reproduction revealed a significantly higher rate of conser-vative amino acid substitutions to synonymous substitutions among the 11most rapidly evolving proteins. In contrast, the most rapidly evolving pro-teins unrelated to male reproduction showed constraint on both conservativeand radical substitutions [95].
2.2.4 Lineage specific ka/ks test
If a protein has experienced positive selection for a new or modified function,the rate of protein evolution in the lineage subject to positive selection isexpected to be higher than other phylogenetic lineages. By constructing aphylogeny and inferring the ancestral states of a protein, the ka/ks ratio canbe tested along each lineage of a phylogeny [61] [104] [25]. The drawbackof this approach is that it requires a true phylogeny and except for the caseof three species most phylogenies have considerable uncertainty. To avoidthis uncertainty a maximum likelihood approach was developed to estimateka/ks for each branch across all probable phylogenies weighted by their like-lihood [99]. Applications of lineage specific tests for positive selection showthey greatly facilitate its detection [61] [97] and the combination of codonand lineage specific estimation of ka/ks [101] provides a powerful meansof describing the effects of both positive and negative selection on proteinevolution.
2.3 Change in ka/ks
If the effective population size and the selective constraint on a protein re-mains constant over time, ka/ks is also expected to remain constant. Anincrease in ka/ks can result from a loss of constraint due to either a decreasein effective population size or a decrease in selection intensity. Positive se-lection can also increase ka/ks. Distinguishing between these possibilitiesis important to understanding what evolutionary forces drive protein evo-lution and why protein sequences differ in different species. A change in
10

effective population size can be distinguished from a change in selection in-tensity since a change in population size is expected to affect all genes alonga lineage whereas a change in selection intensity can be different for differentgenes [20]. Thus, a change in the average ka/ks of many genes along a lin-eage can be attributed to a change in effective population size and a greaterthan expected variance in ka/ks can be attributed to changes in selection,either positive or negative. Whether or not most proteins vary in their rateof evolution is relevant to the molecular clock hypothesis [53], which statesthat nearly all proteins have a constant but protein specific rate of aminoacid substitution [105].
2.3.1 Relative rates test
A change in the rate of evolution as measured by ka/ks can be tested forusing the relative rates test which compares pairwise rates of evolution us-ing three or more taxa [93]. For three taxa a, b and c where a and b arethe most closely related, the distance between a and c is expected to be thesame as the distance between b and c. Maximum likelihood methods can alsobe used to test for differences in ka/ks across lineages with the advantagethat pairwise estimates of ka/ks are not needed to calculate the ka/ks ratioalong different branches [99]. Using artiodactyl as an outgroup the averageka/ks along the primate lineage, 0.27, is significantly greater than along therodent lineage, 0.17 [68]. This difference can be attributed to the presum-ably smaller effective population size along the primate compared to rodentlineages. In addition to a difference in the average ka/ks, the index of dis-persion (variance/mean) of the substitution rate is high for both ka (5.6) andks (5.9) [68]. For a poisson process the index of dispersion is expected tobe one, but if selection has made slight but individually insignificant lineagespecific changes in the rate of ka or ks the index of dispersion is expected tobe greater than one [30]. In Drosophila the index of dispersion of ka and ksis greater than one in some but not all genes which may reflect mutationalheterogeneities, codon bias, or selection [83].
The genome sequence of closely related species has made it possible toapply the relative rates test to all orthologous proteins among three genomes.Of 2112 human-mouse-rat orthologues less than 1% show a significantly dif-ferent rate of evolution along one lineage [58][41]. Similar results were ob-tained from the comparison of closely related bacterial and archaeal species[41]. The small number of orthologous genes which have a variable rate of
11

evolution supports the molecular clock hypothesis and makes many proteinsquite useful for phylogenetic studies.
2.3.2 Duplicate genes
In contrast to the often constant rate of evolution of orthologous genes, anincrease in the rate of evolution is often observed in paralogues following geneduplication. This is expected if adaptive evolution often proceeds throughgene duplication followed by the evolution of new function [65]. The com-parison of orthologous and paralogous genes provides a powerful approach toinferring functional changes within a protein [35] [6]. Orthologues perform-ing the same function should be under the same selective constraints andshould have the same rate of evolution. If a duplicate has maintained thesame function, the location of its conserved domains and its rate of evolutionare expected to be equal to that of its orthologue and paralogue. Duplicatesof this nature may arise when the expression of a protein is needed in anew tissue or stage of development without any accompanying change in theamino acid sequence. If a duplicate has evolved a new function, its rate ofevolution is expected to be greater than that of its orthologue and paralogue.However, an alternative explanation for rapid evolution following gene dupli-cation is loss of constraint due to complete or partial loss of function in oneor both duplicates. If the duplicates subfunctionalize the original protein’sfunctions, both duplicates are expected to have a higher rate of evolution[57] [27]. Distinguishing loss of constraint from rapid evolution driven bypositive selection is quite difficult since loss of constraint often precedes theevolution of new function. The inference of a change in function or constraintis facilitated by examination of a protein’s structure and the types of aminoacid changes that distinguish paralogues [6].
Comparison of orthologues and paralogues from two pairs of closely re-lated bacterial and three closely related eukaryotic species revealed the ka/ksof paralogues is two to three times greater than that of their unduplicatedorthologue [52]. In support of the subfunctionalization model, of 105 pairs ofgenes, only five evolved at significantly different rates following duplication.
2.4 Genome comparisons
The genome sequences of closely related species makes it possible to quantifythe frequency of positive and negative selection in the genome and address
12
a number of new questions. Distantly related organisms cannot easily becompared since synonymous and other unconstrained sites become saturatedand only proteins under considerable constraint can be identified as ortho-logues. Even closely related species may contain genes that have evolved sorapidly that they are no longer easily identified [87]. The sequence of thehuman and mouse genome allows the neutral theory to be tested using theka/ks test. The median ka/ks of 12,845 putative orthologues is 0.115, andfew genes show ka/ks greater than one [89]. While this clearly demonstratesthe strong role of purifying selection in protein evolution it does not rule outa significant contribution of adaptive substitutions due to the conservativenature of the ka/ks test.
The human and mouse genomes also make it possible to characterize themutational biases and heterogeneities that have affected the divergence of thehuman and mouse genome. These can then be used to further refine mutationmodels and better estimate rates of neutral divergence either at synonymous,nonsynonymous or non-coding sites. Not only is this important to estimatingka/ks but also to identifying conserved non-coding sequences.
The most important parameter to estimate before function can be in-ferred from sequence constraint or divergence is the mean and variance inthe rate of neutral substutitions. For a neutral sequence, the divergence be-tween two species is the sum of the divergence that occurred since the splitof the two species, t, and the divergence between the two alleles in the an-cestral population that went on to become fixed in the two species (Figure2). The expectation of these two quantities is 2µt + 4Nu, where t is timein generations, 2µt is the divergence that occurred after speciation and 4Nµis the divergence due to segregation of ancestral polymorphism before spe-ciation. While the variance of 2µt is assumed to be poisson, the varianceof 4Nµ is greater than poisson since it includes the evolutionary varianceinherent to the coalescence process [82]. When there is recombination, eachlocus in the genome is expected to have its own genealogical history and so4Nµ is expected to be different for different genes in the genome. Further-more, because reproductive isolation is not instantaneous, different regionsof the genome may become incompatible between species before others [85].Thus, even in the absence of selective constraint and heterogeneous mutationrates across the genome, rates of divergence can be quite variable across thegenome. This makes it difficult to infer selective constraint for a non-codingregion with low levels of divergence.
The comparison of the human and mouse genome show substantial vari-
13
ability in rates of divergence across the genome [89]. In human babooncomparisons there is more variation than expected from a poisson processat both small, 10bp, and large, 100kb, scales [74]. Two approaches weretaken to estimate the mean and variance of the neutral substitution ratebetween human and mouse. The first was to estimate the distribution ofks from coding sequences and the second was to estimate ks from repetitiveelements as compared to their ancestral consensus sequence. This secondapproach, however, assumes that G+C content is stationary over time. Ifa transposable element with low G+C content arrives in a region of highG+C content, evolution to high G+C content may be rapid and may leadto biased estimates of the substitution rate [36]. So long as variation in theneutral substitution rate occurs on a scale larger than that of the length offunctional conserved non-coding elements, hidden markov models should beable to predict conserved regions using the surrounding region to estimatethe neutral substitution rate.
2.5 Independence
Thus far it has been assumed that amino acid changes within a protein oc-cur independently of one another. The covarion model supposes that aminoacid substitutions are not independent of one another [26]. The degree ofdependence, or epistasis among amino acid substitutions, can be defined asthe average fraction of all codons within a protein whose state determinesthe fitness effect of an amino acid substitution. Models which assume anamino acid substitution can affect the fitness effects of subsequent substitu-tions have been studied [81] and have been found to increase the variance inthe rate of evolution [69]. The fact that many human pathogenic amino acidsubstitutions are present in non human species suggests numerous epistaticinteractions either within or between proteins [51]. Comparison of the humanand mouse genome revealed 160 examples of such from 7,293 disease associ-ated amino acid mutations [89]. From 32 proteins with numerous pathogenicalleles defined it was estimated that approximately 10% of amino substi-tutions occur at sites known to cause pathogenesis [51]. This estimate isindependent of sequence divergence and has broad implications for studiesof molecular evolution which typically assume no fitness interactions amongsites (but see [40]). Epistasis is also known to occur between proteins, inwhich case substitutions in one protein influence the fitness effects of a sub-stitution in a second protein. These types of interactions are thought to play
14
an important role in the Dobzhansky-Muller hybrid incompatibilities thatdistinguish species [94]. To take advantage of these types of interactions amethod of detecting positive selection was developed which uses characterstates and the subsequent number of amino acid changes along a lineage toinfer positive selection [12].
2.6 Selection on synonymous sites
The inference of positive or negative selection based on the ka/ks test as-sumes changes at synonymous sites are neutral. In bacteria, yeast, nematodeand flies, codon usage bias ranges from highly biased genes to genes with al-most no bias and this bias is presumably caused by translational accuracyand/or efficiency since it is correlated with levels of gene expression [2]. Inprimates and rodents there is no support for selection acting on synony-mous sites, an observation that can be explained by their smaller effectivepopulation size [88]. Using population genetic theory and Drosophila data,the frequency of preferentially used codons can be explained by an intensityof selection,/2Ns, between 0.1 and 3 [1]. The critical issue is the extent towhich the synonymous substitution rate is increased or decreased due to pos-itive or negative selection on codon usage bias. For weak selection, 2Ns ≈ 1,selection on synonymous sites will have very little effect on the rate of substi-tution (Figure 1). Previous studies using approximate estimators of ks founda strong negative correlation between codon bias and ks, however, maximumlikelihood estimators of ks show no correlation between ks and codon biasin Drosophila [15] [60]. Thus, so long as ks remains unaffected by selectionon synonymous sites it may be used as a good approximation of the neutralsubstitution rate.
3 Polymorphism
The ability to survey protein polymorphism provided the opportunity of as-sociating protein polymorphism with phenotypic variation and/or naturalselection [54]. Despite surveys in numerous species most protein polymor-phism appeared neutral with respect to fitness and function [47]. The onlyevidence for abundant functional polymorphism under selection came fromamino acid mutations found at very low frequencies in a population, < 1%,and were interpreted as deleterious mutations kept at low frequencies by pu-
15

rifying selection [67]. However, the inference of deleterious mutations wasconfounded by changes in population size which could also explain the data[67] [90]. By examining the difference in the frequency spectrum of non-synonymous to synonymous mutations within a population the effects of apopulation’s demographic history are removed, as both nonsynonymous andsynonymous variation are affected by demographics. Thus far, both humans[21], D. melanogaster [22] and E. coli [73] contain a large amount of lowfrequency amino acid polymorphism which cannot be explained by demo-graphics. Of particular relevance to humans is the frequency distributionand identity of mutations (i.e. coding or non-coding) that contribute to hu-man genetic diseases and phenotypes. If a large fraction of these mutationsare deleterious with respect to fitness they are expected to reside at low,< 10%, frequencies in the population (see below). In contrast, if these mu-tations are neutral they are expected to reside at much higher frequencieson average, as proposed by the common disease common variant hypothesis[72]. The relationship between fitness and human health can now be exam-ined by comparing amino acid substitutions inferred to be deleterious frompolymorphism or divergence data to those found to be association with hu-man genetic diseases. While it is possible to make inferences on a collectionof amino acid polymorphism, the identification of particular amino acid poly-morphism under negative [75] and especially positive selection [19] is greatlyfacilitated using linked neutral polymorphism, which is also expected to beaffected by selection.
3.1 Theory
Levels of DNA polymorphism within a population are a complex function ofmutation rate, effective population size, population history and selection. Fora population of constant size under the infinite sites model, the expected persite heterozygosity or proportion of differences between two sequences is 4Nµ,and the frequency spectrum of segregating sites is given by φ(x)dx = 4Nµ
xdx
[92] [46]. The frequency spectrum of segregating sites reflects the balancebetween an average of 2Nµ mutations which enter the population at a fre-quency of 1/2N every generation and drift which results in the loss or fixationof mutations. Positive selection increases rates of polymorphism and resultsin more high frequency mutations compared to neutral mutations. Negativeselection removes mutations from a population and results only in low fre-quency polymorphism. Thus, both positive and negative selection produce a
16
skew in the frequency spectrum in comparison to neutral polymorphism (Fig-ure 3). The accumulation of non-neutral sites at low and high frequenciesreflects the greater efficacy of selection at intermediate frequencies comparedto low or high frequencies where the sampling variance is high and substantialdrift of non-neutral mutations can occur. The influence of selection becomesstronger than drift when the frequency of a mutation is greater than 1/4Ns[17]. Thus, slightly deleterious mutations can reach higher frequencies thanstrongly deleterious mutations, and in contrast to divergence data, selectiveconstraint can be quantified as a function of selection intensity.
3.2 Detecting selection
Positive and negative selection can be detected from the ratio of amino acidto synonymous polymorphism, conceptually equivalent to the ka/ks test.However, the ratio of amino acid to synonymous polymorphism changes asa function of frequency and as a function of the intensity of selection. Con-sidering just the effects of purifying selection, the ratio of amino acid tosynonymous polymorphism at a frequency of 1/2N is expected to be closeto one if the rate of polymorphism is measured using the effective numberof nonsynonymous and synonymous sites. Dominant lethals are eliminate ina single generation. A longer period of time is needed to eliminate deleteri-ous mutations and as a consequence they attain higher frequencies. Neutralmutations are only eliminated by chance. Thus, the ratio of amino acid tosynonymous polymorphism is expected to be close to one at very low fre-quencies and gradually decreases until only neutral polymorphism remains,at which point the ratio of the per site rate of amino acid to synonymousvariation is expected to be equal to the selective constraint on a protein. Ofcourse when positive selection is present the ratio of amino acid to synony-mous variation is expected to increase from intermediate to high frequenciesas well as for divergence (see below).
The frequency distribution of amino acid polymorphism can be used toestimate the strength of positive or negative selection [73] and the fractionof polymorphism which is neutral [67] [47]. Strongly deleterious mutations,such as those causing severe human genetic diseases, are kept at very lowfrequencies in a population whereas slightly deleterious mutations, such asthose contributing to complex human genetic diseases, are able to drift tohigher and even detectable frequencies (> 1%) in a population. Strongly ad-vantageous mutations tend to lie at very low or high frequencies (Figure 3).
17

Because amino acid polymorphism under selection tends to lie at either lowor high frequencies the ratio of amino acid to synonymous polymorphism atintermediate frequencies is a slight overestimate of the fraction of nonsynony-mous mutations which are effectively neutral, assuming no overdominance.The difference in the ratio of amino acid to synonymous polymorphism at in-termediate compared to low or high frequencies can be attributed to selection[21].
3.3 Application to data
Polymorphism data is particularly useful for understanding deleterious mu-tations because advantageous mutations spread quickly through a populationand so are rare compared to neutral mutations, and because deleterious mu-tations are expected to be common at low frequencies in a population. Sincethe earliest allozyme studies a substantial excess of low frequency aminoacid polymorphism was noted and attributed to slightly deleterious muta-tions [67]. However, demographic effects such as an increase in populationsize could also explain this excess of low frequency variation. A significantlyhigher ratio of amino acid to synonymous variation at low compared to in-termediate frequencies cannot be explained by an increase in population sizesince both nonsynonymous and synonymous polymorphic sites should besimilarly affected. From two different polymorphism surveys totaling 181genes, it was estimated that a half of low frequency (1-10%) amino acidpolymorphism is deleterious (a third of all amino acid altering single nu-cleotide polymorphism, SNPs) and the average number of deleterious aminoacid mutations carried by an individual was estimated to be at least 500[21]. Similar estimates were obtained by comparing population specific andshared SNPs with the logic that neutral but not deleterious SNPs are able tomigrate across populations. The large fraction of slightly deleterious aminoacid polymorphism has implications for our understanding of rates and pat-terns of molecular evolution since it is these mutations which first becomeeffectively neutral and are able to fix in a population with a smaller effectivesize. These results are also relevant to the assumption that many commoncomplex human genetic diseases are caused by common alleles in a popula-tion [72] [28] whereas both theoretical and empirical considerations suggestnearly all of these alleles likely reside at a frequency of less than 10% [21][71].
A number of other methods have also been devised to determine what
18
fraction of amino acid polymorphism is slightly deleterious. One approachis to determine whether an amino acid polymorphism has functional con-sequences based on protein structure annotations such as the location ofactive or binding sites and disulfide bonds, or based on physical and chemi-cal properties of an amino acid substitution such as the hydrophobicity andelectrostatic charge change and the effect on protein solubility. These mea-sures must be calibrated using amino acid changes known to affect function.Calibration can be obtained from amino acid changes annotated as causinga human genetic disease [77] or from studies of the lac repressor or lysozymeproteins for which function has been measured for nearly all possible aminoacid substitutions [11]. Using both structural and divergence data, estimatesof the fraction of amino acid polymorphism that is deleterious ranges from20% [77] to 29% [11] and an individual is expected to carry 103 to 104 ofthese mutations in their genome, respectively.
Another approach relies entirely on divergence data with the logic thatamino acid sites conserved over time are likely functional and deleteriouswhen mutated [63]. However, the opposite conclusions were reached usingthis method; very few amino acid SNPs were found to be damaging to theextent of affecting human health since 20% of SNPs were predicted to affectfunction and the estimated rate of false positives was also 20% [63]. Thehigher estimates of previous studies were attributed to not accounting forfalse positives [11] and to estimates based on SNPs biased to an unrepre-sentative set of genes [77]. However, the 20% estimate of the rate of falsepositives comes from a single protein, the lac repressor, and it is not clearthat this estimate is applicable to other proteins.
The different estimates of functional or deleterious amino acid polymor-phism likely stem from an important point relating to the definitions of ”dele-terious”, ”functional”, and ”human health”, which can be defined as follows.Deleterious mutations are those that affect fitness, are removed from a popu-lation and rarely contribute to protein divergence. Functional mutations arethose that in the lab produce a detectable phenotype. Mutations affectinghuman health are those that contribute to human genetic diseases. Whilethese categories of mutations obviously overlap their relationships are noteasily defined. The fraction of amino acid SNPs that affect human healthshould be directly estimated. A further complication of using divergence datato infer function is that many human disease alleles have been shown to bepresent in mouse [51]. While constraint estimated from polymorphism datadoes not suffer from this limitation there is no clear relationship between the
19
fitness consequence of a mutation and its affect on human health, althoughclearly the two must be correlated.
4 Polymorphism and Divergence
The comparison of polymorphism to divergence data presents the most pow-erful means of disentangling the selective and demographic forces governingprotein evolution. The comparison is also the most difficult. One of the firstand now most widely used comparisons of polymorphism and divergence isthe McDonald-Kreitman test [59]. Originally proposed as a test for posi-tive selection based on an excess of amino acid divergence compared to thatexpected based on levels of polymorphism, the test is equally capable of de-tecting negative selection based on an excess of amino acid polymorphismcompared to divergence [84]. In fact, a higher ratio of polymorphism com-pared to divergence is observed in a number of mitochondrial genomes and isinterpreted as segregating deleterious amino acid polymorphism [91]. Positiveand negative selection can be distinguished using frequency to infer the con-tribution of negative selection to polymorphism [22]. As previously discussed(ıSection 2.3), changes in effective population size and selective constraint areexpected to first change the ratio of amino acid to synonymous polymorphismand subsequently the ratio of amino acid to synonymous divergence. Distin-guishing between the influences of positive negative selection and drift willprovide the most meaningful understanding of how mutation, selection anddrift interact within natural populations and give rise to genome differences.The recent expansion in human population size in combination with changesin selective constraint provides a unique opportunity to address these issuesin humans.
4.1 Detecting selection
The McDonald-Kreitman test is a test of independence between the num-ber of nonsynonymous and synonymous polymorphic sites to the number ofnonsynonymous and synonymous fixed differences between species [59]. Ifall mutations are neutral the ratio of nonsynonymous to synonymous poly-morphism is expected to be equal that of divergence. Positive selection isexpected to increase the number of amino acid substitutions but have littleimpact on polymorphism (Figure 1). Negative selection is expected to af-
20

fect amino acid polymorphism but not divergence. A change in populationsize is expected to have a dynamic effect first on polymorphism and thenon divergence. As this is a non-stationary process no theoretical models ofthe process have been developed. However, the magnitude of the effect isexpected to be a function of the fraction of amino acid polymorphism withfitness effects that becomes effectively neutral for a given change in effectivepopulation size. The larger a decrease in effective population size, the largerthe fraction of amino acid mutations which become effectively neutral andthe larger the increase in ka. The large fraction of amino acid polymorphismfound at frequencies of 1-10% in both D. melanogaster [22] and humans [21]suggests that the effects of a change in population size on the rate of aminoacid substitution may be quite large. This makes it difficult to distinguish be-tween positive selection and a historical change in selective constraint whichcan both produce a ratio of amino acid to synonymous divergence higherthan that of polymorphism [22].
To distinguish positive and negative selection from changes in populationsize, polymorphism at different frequencies and divergence must be comparedat multiple loci [22]. Because the bulk of intermediate frequency amino acidpolymorphism is likely neutral it can be used to gauge the contribution ofdeleterious mutations to polymorphism by the ratio of amino acid to syn-onymous variation at low compared to intermediate frequencies. Positiveselection can be distinguished from a change in population size by examiningnumerous genes since all genes should be affected by a change in populationsize but only a small fraction of genes are likely under positive selection [22].
A maximum likelihood method of estimating the strength of positive ornegative selection has been developed based on the frequency spectrum ex-pected in an equilibrium population and divergence between species [9]. How-ever, the method must assume an equilibrium population and the data is fitto only a single selection coefficient, so positive and negative selection areconfounded. This framework has now been extended to estimate the distri-bution of either positive or negative selection coefficients [7].
4.2 Application to data
A number of species now have polymorphism and divergence data at multipleloci. The maximum likelihood estimates of 4Ns from 12 Arabidopsis genesis between −2 and 1 and from 32 Drosophila genes is between −1 and 4[8]. An approximate fit of the excess of amino acid polymorphism found in
21

humans to that expected in an equilibrium population produced estimatesof 4Ns between −10 and −1000 [21]. The excess of amino acid divergencebetween D. melanogaster and D. simulans compared to that expected basedon polymorphism suggested that about 1/3 of amino acid substitutions weredriven by positive selection [22] [76]. While a change in population sizecan not account for the entire excess of amino acid divergence it may havehad some impact [22]. Sampling of genes in other species will determine thecontribution of adaptive substitutions to divergence since a numerous speciesare not likely to have the same demographic history.
5 Conclusions
The number of questions limited by lack of divergence data is rapidly grow-ing smaller. The abundance of divergence data has lead to more accuratemutation models which are essential for estimating functional and fitness con-sequences of amino acid mutations. However, mutation rate parameters haveyet to be fully characterized with respect to their variation within a genome[74] [50] and between genomes [96]. Despite these uncertainties, we have re-fined our methods of inference to the point where sites inferred to be underpositive selection or sites constrained in some orthologues or paralogues butnot in others should be experimentally tested.
Polymorphism data is also now available on a genomic level, althoughlimited in form. Large samples from multiple loci are needed to control fordemographic effects and better understand how purifying selection translatesinto functional constraint. The intense focus on functional human polymor-phism will no doubt put to use and require improvements on methods ofinferring selection on amino acid polymorphism. However, the best under-standing of a protein’s evolution no doubt comes from the analysis of bothpolymorphism and divergence data.
With nearly 40 years of protein evolution studies, the next frontier lies inthe study of non-coding sequences and their regulatory functions. Althoughmost regulatory sequences have not been identified, constraint in non-codingregions between two genomes provides a fast method of identifying candidateregulatory sequences once the genomes of closely related species are madeavailable.
Non-coding regions can by analyzed using the same types of methodsapplied to coding regions. From human polymorphism surveys rates of poly-
22

morphism in 5’ UTR, intron and 3’ UTR regions were found to be half therates found at synonymous sites [39] [10]. In contrast, rates of divergenceat 5’ UTR, 3’ UTR and synonymous sites were similar, suggesting no or lit-tle selective constraint [58]. Many explanations are plausible but it shouldbe noted that different approximate methods were used to estimate rates ofvariation. Examination of rates of evolution between human and mouse inknown regulatory sequences revealed substitution rates in transcription fac-tor binding sites are 2/3 the rate of background sequences [14]. However,the substitutions found in binding sites resulted in more than one third ofthe sites being disrupted in one of the two species suggesting transcriptionfactor binding sites may have a high rate of turnover. Further work will nodoubt clarify the strength of selective forces acting on regulatory elementsand their contribution to human genetic diseases and adaptive evolution.
References
[1] Akashi H. 1995. Inferring weak selection from patterns of polymor-phism and divergence at ”silent” sites in Drosophila DNA. Genetics139:1067–1076.
[2] Akashi H. 2001. Gene expression and molecular evolution. Curr. Opin.Genet. Dev. 11:660–666.
[3] Anisimova M, Bielawski J, Yang Z. 2001. Accuracy and power of thelikelihood ratio test in detecting adaptive molecular evolution. Mol.Biol. Evol. 18:1585–1592.
[4] Anisimova M, Bielawski J, Yang Z. 2002. Accuracy and power of bayesprediction of amino acid sites under positive selection. Mol. Biol. Evol.19:950–958.
[5] Bielawski J, Yang Z. 2001. Positive and negative selection in the DAZgene family. Mol. Biol. Evol. 18:523–529.
[6] Blouin C, Boucher Y, Roger A. 2003. Inferring functional constraintsand divergence in protein families using 3D mapping of phylogeneticinformation. Nuclei Acids Res. 31:790–797.
23
[7] Bustamante C, Nielsen R, Hartl D. 2003. Maximum likelihood andbayesian method for estimating the distribution of selective effectsamong classes of mutations using DNA polymorphism data. Theor.Popul. Biol. in press.
[8] Bustamante C, Nielsen R, Sawyer S, Olsen K, Purugganan M, HartlD. 2002. The cost of inbreeding in Arabidopsis. Nature 416:531–534.
[9] Bustamante C, Wakeley J, Sawyer S, Hartl D. 2001. Directional selec-tion and the site-frequency spectrum. Genetics 159:1779–1788.
[10] Cargill M, Altshuler D, Ireland J, Sklar P, Ardlie K, Patil N, Shaw N,Lane C, Lim E, Kalyanaraman N, Nemesh J, Ziaugra L, Friedland L,Rolfe A, Warrington J, Lipshutz R, Daley G, Lander E. 1999. Char-acterization of single-nucleotide polymorphisms in coding regions ofhuman genes. Nat. Genet. 22:231–238.
[11] Chasman D, Adams R. 2001. Predicting the functional consequencesof non-synonymous single nucleotide polymorphisms: structure-basedassessment of amino acid variation. J. Mol. Biol. 307:683–706.
[12] Creevey C, McInerney J. 2002. An algorithm for detecting directionaland non-directional positive selection, neutrality and negative selectionin protein coding DNA sequences. Gene 300:43–51.
[13] Dayhoff M. 1972. Atlas of Protein Sequence and Structure, volume 5.Washington, DC: National Biomedical Research Foundation.
[14] Dermitzakis E, Clark A. 2002. Evolution of transcription factor bindingsites in Mammalian gene regulatory regions: conservation and turnover.Mol. Biol. Evol. 19:1114–1121.
[15] Dunn K, Bielawski J, Yang Z. 2001. Substitution rates in Drosophilanuclear genes: implications for translational selection. Genetics157:295–305.
[16] Endo T, Ikeo K, Gojobori T. 1996. Large-scale search for genes onwhich positive selection may operate. Mol. Biol. Evol. 13:685–690.
[17] Ewens W. 1979. Mathematical Population Genetics. Springer-Verlag.
24
[18] Eyre-Walker A, Keightley P, Smith N, Gaffney D. 2002. Quantifyingthe slightly deleterious mutation model of molecular evolution. Mol.Biol. Evol. 19:2142–2149.
[19] Fay J, Wu C. 2000. Hitchhiking under positive Darwinian selection.Genetics 155:1405–1413.
[20] Fay J, Wu C. 2001. The neutral theory in the genomic era. Curr. Opin.Genet. Dev. 11:642–646.
[21] Fay J, Wyckoff G, Wu C. 2001. Positive and negative selection on thehuman genome. Genetics 158:1227–1234.
[22] Fay J, Wyckoff G, Wu C. 2002. Testing the neutral theory of molecularevolution with genomic data from Drosophila. Nature 415:1024–1026.
[23] Fisher R. 1930. The Genetical Theory of Natural Selection. Oxford:Clarendon Press.
[24] Fitch W, Bush R, Bender C, Cox N. 1997. Long term trends in theevolution of H(3) HA1 human influenza type A. Proc. Natl. Acad. Sci.USA 94:7712–7718.
[25] Fitch W, Leiter J, Li X, Palese P. 1991. Positive Darwinian evolution inhuman influenza A viruses. Proc. Natl. Acad. Sci. USA 88:4270–4274.
[26] Fitch W, Markowitz E. 1970. An improved method for determiningcodon variability in a gene and its application to the rate of fixation ofmutations in evolution. Biochem. Genet. 4:579–593.
[27] Force A, Lynch M, Pickett F, Amores A, Yan Y, Postlethwait J. 1999.Preservation of duplicate genes by complementary, degenerative muta-tions. Genetics 151:1531–1545.
[28] Gabriel S, Schaffner S, Nguyen H, Moore J, Roy J, Blumenstiel B,Higgins J, DeFelice M, Lochner A, Faggart M, Liu-Cordero S, RotimiC, Adeyemo A, Cooper R, Ward R, Lander E, Daly M, Altshuler D.2002. The structure of haplotype blocks in the human genome. Science296:2225–2229.
[29] Galtier N, Tourasse N, Gouy M. 1999. A nonhyperthermophilic com-mon ancestor to extant life forms. Science 283:220–221.
25

[30] Gillespie J. 1989. Lineage effects and the index of dispersion of molec-ular evolution. Mol. Biol. Evol. 6:636–647.
[31] Goldman N, Whelan S. 2000. Statistical tests of gamma-distributedrate heterogeneity in models of sequence evolution in phylogenetics.Mol. Biol. Evol. 17:975–978.
[32] Goldman N, Yang Z. 1994. A codon-based model of nucleotide substi-tution for protein-coding DNA sequences. Mol. Biol. Evol. 11:725–736.
[33] Grantham R. 1974. Amino acid difference formula to help explainprotein evolution. Science 185:862–864.
[34] Graur D. 1985. Amino acid composition and the evolutionary rates ofprotein-coding genes. J. Mol. Evol. 22:53–62.
[35] Gu X. 2001. Maximum-likelihood approach for gene family evolutionunder functional divergence. Mol. Biol. Evol. 18:453–464.
[36] Gu Z, Wang H, Nekrutenko A, Li W. 2000. Densities, length propor-tions, and other distributional features of repetitive sequences in thehuman genome estimated from 430 megabases of genomic sequence.Gene 259:81–88.
[37] Hacia J, Fan J, Ryder O, Jin L, Edgemon K, Ghandour G, Mayer R,Sun B, Hsie L, Robbins C, Brody L, Wang D, Lander E, Lipshutz R,Fodor S, Collins F. 1999. Determination of ancestral alleles for humansingle-nucleotide polymorphisms using high-density oligonucleotide ar-rays. Nat. Genet. 22:164–167.
[38] Haldane J. 1927. The mathematical theory of natural and artificialselection. Part V. Proc. Cambridge Philos. Soc. 23:838–844.
[39] Halushka M, Fan J, Bentley K, Hsie L, Shen N, Weder A, Cooper R,Lipshutz R, Chakravarti A. 1999. Patterns of single-nucleotide poly-morphisms in candidate genes for blood-pressure homeostasis. Nat.Genet. 22:239–247.
[40] Hey J, Kliman R. 2002. Interactions between natural selection, re-combination and gene density in the genes of Drosophila. Genetics160:595–608.
26

[41] Jordan I, Kondrashov F, Rogozin I, Tatusov R, Wolf Y, Koonin E.2001. Constant relative rate of protein evolution and detection of func-tional diversification among bacterial, archaeal and eukaryotic proteins.Genome Biol. 2:RESEARCH0053.
[42] Jordan I, Rogozin I, Wolf Y, Koonin E. 2002. Microevolutionary ge-nomics of bacteria. Theor. Popul. Biol. 61:435–447.
[43] Jukes T, Cantor C. 1969. Evolution of protein molecules, pp. 21–132.New York: Academic Press.
[44] Kimura M. 1957. Some problems of stochastic processes in genetics.Ann. Math Stat. 28:882–901.
[45] Kimura M. 1968. Evolutionary rate at the molecular level. Nature217:624–626.
[46] Kimura M. 1969. The number of heterozygous nucleotide sites main-tained in a finite population due to steady flux of mutations. Genetics61:893–903.
[47] Kimura M. 1983. The Neutral Theory of Molecular Evolution. Cam-bridge: Cambridge University Press.
[48] Kimura M, Ota T. 1969. The average number of generations untilextinction of an individual mutant gene in a finite population. Genetics63:701–709.
[49] King J, Jukes T. 1969. Non-Darwinian evolution. Science 164:788–798.
[50] Kondrashov A. 2003. Direct estimates of human per nucleotide muta-tion rates at 20 loci causing mendelian diseases. Hum. Mutat. 21:12–27.
[51] Kondrashov A, Sunyaev S, Kondrashov F. 2002. Dobzhansky-Mullerincompatibilities in protein evolution. Proc. Natl. Acad. Sci. USA99:14878–14883.
[52] Kondrashov F, Rogozin I, Wolf Y, Koonin E. 2002. Selection in theevolution of gene duplications. Genome Biol. 3:RESEARCH0008.
[53] Kumar S, Hedges S. 1998. A molecular timescale for vertebrate evolu-tion. Nature 392:917–920.
27

[54] Lewontin R, Hubby J. 1966. A molecular approach to the study ofgenic heterozygosity in natural populations. II. Amount of variationand degree of heterozygosity in natural populations of Drosophila pseu-doobscura. Genetics 54:595–609.
[55] Li W. 1997. Molecular Evolution. Sunderland, MA: Sinauer Associates.
[56] Liberles D, Schreiber D, Govindarajan S, Chamberlin S, Benner S.2001. The Adaptive Evolution Database (TAED). Genome Biol.2:PREPRINT0003.
[57] Lynch M, Force A. 2000. The probability of duplicate gene preservationby subfunctionalization. Genetics 154:459–473.
[58] Makalowski W, Boguski M. 1998. Evolutionary parameters of the tran-scribed mammalian genome: an analysis of 2,820 orthologous rodentand human sequences. Proc. Natl. Acad. Sci. USA 95:9407–9412.
[59] McDonald J, Kreitman M. 1991. Adaptive protein evolution at theAdh locus in Drosophila. Nature 351:652–654.
[60] McVean G, Vieira J. 2001. Inferring parameters of mutation, selec-tion and demography from patterns of synonymous site evolution inDrosophila. Genetics 157:245–257.
[61] Messier W, Stewart C. 1997. Episodic adaptive evolution of primatelysozymes. Nature 385:151–154.
[62] Nekrutenko A, Makova K, Li W. 2002. The K(A)/K(S) ratio test forassessing the protein-coding potential of genomic regions: an empiricaland simulation study. Genome Res. 12:198–202.
[63] Ng P, Henikoff S. 2002. Accounting for human polymorphisms pre-dicted to affect protein function. Genome Res. 12:436–446.
[64] Nielsen R, Yang Z. 1998. Likelihood models for detecting positivelyselected amino acid sites and applications to the HIV-1 envelope gene.Genetics 148:929–936.
[65] Ohno S. 1970. Evolution by Gene Duplication. Berlin: Springer-Verlag.
28
[66] Ohta T. 1973. Slightly deleterious mutant substitutions in evolution.Nature 246:96–98.
[67] Ohta T. 1975. Statistical analysis of Drosophila and human proteinpolymorphism. Proc. Natl. Acad. Sci. USA 72:3194–3196.
[68] Ohta T. 1995. Synonymous and nonsynonymous substitutions in mam-malian genes and the nearly neutral theory. J. Mol. Evol. 40:56–63.
[69] Ohta T. 1997. Role of random genetic drift in the evolution of interac-tive systems. J. Mol. Evol. 44 Suppl 1:S9–14.
[70] Piganeau G, Mouchiroud D, Duret L, Gautier C. 2002. Expected re-lationship between the silent substitution rate and the GC content:implications for the evolution of isochores. J. Mol. Evol. 54:129–133.
[71] Pritchard J. 2001. Are rare variants responsible for susceptibility tocomplex diseases? Am. J. Hum. Genet. 69:124–137.
[72] Reich D, Cargill M, Bolk S, Ireland J, Sabeti P, Richter D, LaveryT, Kouyoumjian R, Farhadian S, Ward R, Lander E. 2001. Linkagedisequilibrium in the human genome. Nature 411:199–204.
[73] Sawyer S, Dykhuizen D, Hartl D. 1987. Confidence interval for thenumber of selectively neutral amino acid polymorphisms. Proc. Natl.Acad. Sci. USA 84:6225–6228.
[74] Silva J, Kondrashov A. 2002. Patterns in spontaneous mutation re-vealed by human-baboon sequence comparison. Trends Genet. 18:544–547.
[75] Slatkin M. 2000. Allele age and a test for selection on rare alleles.Philos. Trans. R. Soc. Lond. B Biol. Sci. 355:1663–1668.
[76] Smith N, Eyre-Walker A. 2002. Adaptive protein evolution inDrosophila. Nature 415:1022–1024.
[77] Sunyaev S, Ramensky V, Koch I, Lathe Wr, Kondrashov A, BorkP. 2001. Prediction of deleterious human alleles. Hum. Mol. Genet.10:591–597.
29
[78] Suzuki Y, Gojobori T. 1999. A method for detecting positive selectionat single amino acid sites. Mol. Biol. Evol. 16:1315–1328.
[79] Suzuki Y, Nei M. 2001. Reliabilities of parsimony-based and likelihood-based methods for detecting positive selection at single amino acid sites.Mol. Biol. Evol. 18:2179–2185.
[80] Suzuki Y, Nei M. 2002. Simulation study of the reliability and robust-ness of the statistical methods for detecting positive selection at singleamino Acid sites. Mol. Biol. Evol. 19:1865–1869.
[81] Takahata N. 1991. Statistical models of the overdispersed molecularclock. Theor. Popul. Biol. 39:329–344.
[82] Takahata N, Satta Y, Klein J. 1995. Divergence time and populationsize in the lineage leading to modern humans. Theor. Popul. Biol.48:198–221.
[83] Takano T. 1998. Rate variation of DNA sequence evolution in theDrosophila lineages. Genetics 149:959–970.
[84] Templeton A. 1996. Contingency tests of neutrality using in-tra/interspecific gene trees: the rejection of neutrality for the evolu-tion of the mitochondrial cytochrome oxidase II gene in the hominoidprimates. Genetics 144:1263–1270.
[85] Ting C, Tsaur S, Wu C. 2000. The phylogeny of closely related speciesas revealed by the genealogy of a speciation gene, Odysseus. Proc. Natl.Acad. Sci. USA 97:5313–5316.
[86] Ting C, Tsaur S, Wu M, Wu C. 1998. A rapidly evolving homeobox atthe site of a hybrid sterility gene. Science 282:1501–1504.
[87] Tsaur S, Wu C. 1997. Positive selection and the molecular evolution ofa gene of male reproduction, Acp26Aa of Drosophila. Mol. Biol. Evol.14:544–549.
[88] Urrutia A, Hurst L. 2001. Codon usage bias covaries with expressionbreadth and the rate of synonymous evolution in humans, but this isnot evidence for selection. Genetics 159:1191–1199.
30

[89] Waterston R, et a. 2002. Initial sequencing and comparative analysisof the mouse genome. Nature 420:520–562.
[90] Watterson G. 1987. Estimating the proportion of neutral mutants.Genet. Res. 50:155–163.
[91] Weinreich D, Rand D. 2000. Contrasting patterns of nonneutral evo-lution in proteins encoded in nuclear and mitochondrial genomes. Ge-netics 156:385–399.
[92] Wright S. 1938. The distribution of gene frequencies under irreversiblemutations. Proc. Natl. Acad. Sci. USA 24:253–259.
[93] Wu C, Li W. 1985. Evidence for higher rates of nucleotide substitutionin rodents than in man. Proc. Natl. Acad. Sci. USA 82:1741–1745.
[94] Wu C, Palopoli M. 1994. Genetics of postmating reproductive isolationin animals. Annu. Rev. Genet. 28:283–308.
[95] Wyckoff G, Wang W, Wu C. 2000. Rapid evolution of male reproduc-tive genes in the descent of man. Nature 403:304–309.
[96] Yang H, Tanikawa A, Kondrashov A. 2001. Molecular nature of 11spontaneous de novo mutations in Drosophila melanogaster. Genetics157:1285–1292.
[97] Yang Z. 1998. Likelihood ratio tests for detecting positive selection andapplication to primate lysozyme evolution. Mol. Biol. Evol. 15:568–573.
[98] Yang Z, Bielawski J. 2000. Statistical methods for detecting molecularadaptation. Trends Ecol. Evol. 15:496–503.
[99] Yang Z, Nielsen R. 1998. Synonymous and nonsynonymous rate vari-ation in nuclear genes of mammals. J. Mol. Evol. 46:409–418.
[100] Yang Z, Nielsen R. 2000. Estimating synonymous and nonsynonymoussubstitution rates under realistic evolutionary models. Mol. Biol. Evol.17:32–43.
[101] Yang Z, Nielsen R. 2002. Codon-substitution models for detectingmolecular adaptation at individual sites along specific lineages. Mol.Biol. Evol. 19:908–917.
31
[102] Yang Z, Nielsen R, Goldman N, Pedersen A. 2000. Codon-substitutionmodels for heterogeneous selection pressure at amino acid sites. Ge-netics 155:431–449.
[103] Yu N, Fu Y, Li W. 2002. DNA polymorphism in a worldwide sampleof human x chromosomes. Mol. Biol. Evol. 19:2131–2141.
[104] Zhang J, Rosenberg H, Nei M. 1998. Positive Darwinian selection aftergene duplication in primate ribonuclease genes. Proc. Natl. Acad. Sci.USA 95:3708–3713.
[105] Zuckerlandl E, Pauling L. 1965. Evolutionary divergence and conver-gence in proteins, pp. 97–166. New York: Academic Press.
32
4 2 0 4
12
34
5
4Ns
Rel
ativ
e ra
te
2
Figure 1: Relative rate of selected to neutral substitutions, 4Ns1−e4Ns (solid),
and heterozygosity, 2(4Ns−1+e−4Ns)4Ns(1−e−4Ns)
(dashed) as a function of 4Ns [48].
33

Time of speciation
Ancestral polymorphism
Extant polymorphism
2Nm
mt
Figure 2: Genealogy reflecting the proportion of sequence divergence dueto segregation of ancestral polymorphism, 4Nu, and divergence after spe-ciation, 2µt. The grey lines indicate the split of one species into two andthe black lines represent a single genealogy, consisting of polymorphism inboth the extant species, divergence since the time of speciation and ancestralpolymorphism present at the time of speciation.
34

0.0 0.2 0.4 0.6 0.8 1.0
020
4060
8010
0
Mutant frequency
Segr
egat
ing
site
s
-100-10010100
Figure 3: Frequency spectrum for sites under positive, 4Ns > 1 (green),negative, 4Ns < −1 (red) and no selection 4Ns = 0. The frequency spec-trum or expected number of mutations in a population as a function of theirfrequency is given by φ(x) = 4Nµ
x(1−x)
(1−e4Ns(1−x)
1−e−4Ns
)[23] [92].
35