sequence analysis and characterization of the dihydrodiol
TRANSCRIPT

Clemson UniversityTigerPrints
All Dissertations Dissertations
12-2009
Sequence Analysis and characterization of thedihydrodiol dehydrogenase and aldehydedehydrogenase genes in'' Sphingomonas paucimobilis''EPA505Jaleh JaliliClemson University, [email protected]
Follow this and additional works at: https://tigerprints.clemson.edu/all_dissertations
Part of the Microbiology Commons
This Dissertation is brought to you for free and open access by the Dissertations at TigerPrints. It has been accepted for inclusion in All Dissertations byan authorized administrator of TigerPrints. For more information, please contact [email protected].
Recommended CitationJalili, Jaleh, "Sequence Analysis and characterization of the dihydrodiol dehydrogenase and aldehyde dehydrogenase genes in''Sphingomonas paucimobilis'' EPA505" (2009). All Dissertations. 489.https://tigerprints.clemson.edu/all_dissertations/489

Sequence Analysis and characterization of the dihydrodiol dehydrogenase and aldehyde dehydrogenase genes in Sphingomonas paucimobilis EPA505
A Dissertation Presented to
The Graduate School of Clemson University
In Partial Fulfillment of the Requirements for the Degree
Doctor of Philosophy Microbiology
by Jaleh Esmaeilzadeh Jalili
December 2009 ________________________________________________________________________
Accepted by:
Dr. Thomas A. Hughes, Committee Chair Dr. Harry D. Kurtz, Jr.
Dr. Min Cao Dr. Tzuen-Rong Tzeng

ii
Abstract
A bacterial artificial chromosome (BAC) library was previously constructed from
genomic DNA of Sphingomonas paucimobilis EPA505 at Clemson University Genomic
institute (CUGI). The BAC clones containing corresponding DNA fragments were
transferred to 96 well microtiter plates to facilitate screening of the library. Cloning and
characterization of the genes encoding a novel cis-dihydrodiol dehydrogenase (bphB) and
aldehyde dehydrogenase (phnN) from Sphingomonas paucimobilis EPA505 are described
in this study and the overexpression of both genes was done to demonstrate enzyme
activity and steady-state kinetics.
To isolate and identify the bphB gene from the genome of S. paucimobilis
EPA505, a set of primers was designed based on conserved regions of the bphB gene
encoding dihydrodiol dehydrogenase of Sphingomonas CHY-1 and Sphingomonas
yanoikuyae B1. Routine PCR was performed and a PCR fragment of approximately 500
bp that confirmed the presence of pbhB gene in Sphingomonas paucimobilis EPA505 was
produced. Hybridization of the PCR product with BAC library was performed and one
hundred two positive hits were spotted from the BAC clones. Two positive clones, clones
02C04 and 03C01, were purified and double digested with BamH1 and HindIII for
southern blotting hybridization. The results of the southern hybridization indicated that
the clones contained the dihydrodiol dehydrogenase gene.
A shotgun library was constructed and DNA sequencing was performed on one of
the BAC clones (03C01). The sequence analysis of shotgun clones and sequences
resulted in 27 contigs. At this point it was decided to add another PAH catabolic enzyme

iii
to work within this project because of its close proximity to bphB. This enzyme was
determined to be aldehyde dehydrogenase (phnN). After further analysis of all the
contigs, using Consed software and programming, located the genes of interest, bphB and
phnN, both located on contig 26 next to each other. Sequencing of both genes revealed
that the bphB gene consisted of 801 nucleotides, and encodes the dihydrodiol
dehydrogenase enzyme harboring 266 amino acid and the phnN gene contained 1500
base paires and encodes a polypeptide approximately 499 amino acid.
Protein expression in E. coli was examined by the EK/LIC Cloning system
(Novagen, Madison, WI). For cloning and expression of the dihydrodiol dehydrogenase
gene (bphB) and the aldehyde dehydrogenase gene (phnN), the pET-30 EK/LIC cloning
kit (Novagen, Madison, WI) was used. The insert was prepared by using PCR and the
EK/LIC vector and insert were annealed and transformed into competent E. coli cells.
The pET-30 EK/LIC uses T7 RNA polymerase for transcription of the cloning and
expression site in the expression vector. The coding region lies between the N-terminal
and C-terminal histidine tag sequences which were used to isolate the protein of interest
after expression. The recombinant plasmids were then transformed into the BL21 (DE3)
pLysS expression host strain for target gene expression. Expression of the recombinant
target DNA (pET-30 EK/LIC vector) was induced by addition of 1 mM IPTG to the
OD600=0.5-1.0.
Total cell protein (TCP) analysis was performed for target protein verification on
a SDS-polyacrylamide gel according to the pET system manual (Novagen, Madison, WI).
Substrate Affinity Chromotography was performed to purify cloned proteins. The protein
binds to ligand-bound nickel on the column and his-tag deficient proteins pass through

iv
the column. The His-tag was displaced from the nickel resin by eluting the purified
protein with imidazole. Both the dihydrodiol dehydrogenase (DDH) and aldehyde
dehydrogenase (ALDH) enzymes were purified from the column and kept at -80°C
freezer. Western blot hybridization against the his-tag confirmed the presence of both
proteins. The SDS polyacrylamide gel exhibited a 28 kD protein for DDH and a 55 kD
protein for ALDH.
Enzyme assays were performed for purified proteins to confirm enzyme activity.
The enzyme assay was only accomplished for ALDH, due to unavailability of the
substrate for DDH. Salicylaldehyde was used as the substrate for ALDH which was
commercially available (Sigma, USA). All of the detections were performed
spectrophotometrically, based on reduction of NAD+ at 340 nm. Different concentrations
of enzyme were used for the assay. The lowest amount of enzyme needed to achieve
enzyme activity was 0.1 mM. Optimum temperature and optimum pH were obtained for
ALDH. The enzyme displayed the best activity at 45°C and pH 7.0. Steady-state kinetics
was performed. The Km value was calculated as 1.43 mM while Vmax was measured as
0.07 U mg-1. Kcat and catalytic efficiency were calculated for ALDH as 0.7 (s-1) and
0.489 (M-1 s-1), respectively.
The study proves that ALDH extracted from S. paucimobilis EPA505 is an active
enzyme and can be used in many different aspects such as bioremediation processes and
bioengineering. It is the first example of an enzyme able to oxidize salicylaldehyde to
salicylic acid by reducing NAD+ to NADH in S. paucimobilis EPA505.

v
DEDICATION
I dedicate this work first to my husband, Nader, who was inspired and helped me through
my PhD program. Without his love and support I certainly was not able to finish my
study. Also I dedicate this to my two beautiful children, Paneed and Pouya, who were so
patient all these years. Last but not the least, I dedicate this dissertation to my parents,
Farideh and Jalil, who were so supportive through my whole life.

vi
ACKNOWLEDGEMENTS
I would like to thank my advisor, Dr. Thomas Hughes, for all his support and help
through my study. Also I would like to thank my other advisor committee, Dr. Harry D.
Kurtz, Jr.; Dr. Min Cao; and Dr. Jermey Tzeng for the helpful advices and supports.
I would also want to thank Clemson University Genomic Institute (CUGI) for performing
all the sequencing and hybridization techniques. Special thanks to Ms. Barbara
Blackmon; Dr. Chris Saski for their kind support.
Also I would like to thank Biological Science Department; Dr. Wheeler, Ms. Barbara
Piekutowski, Ms. Diana Harrison, and Ms. Jillian Danson. Special thank to Mr. John
Abbercrombie for all his support and kind help during all these years in both teaching and
research matters.
I would like to thank Dr. Dong, Dr. Rice, Dr. Henson, Dr. McNealy and all the faculties
who helped me during my study either by advising or providing materials from their lab.
At the end I would like to thank all my friends; specially Renuka Persad Miller and
Aaron K. Brown. Their presence as my friends and their kind support and help made it so
much easier to achieve the difficult times throughout this way. Also I would like all my
other friends who were there for me; Dr. Hari Kattouri, Sara Garrett, Sujay Guha, Young
Ouyang, and Jyothi Rangineni.

vii
Table of Contents
Page
Title Page ……………………………………………………………………….. i
Abstract …………………………………………………………………………. ii
Dedication ………………………………………………………………………. v
Acknowledgements ………………………………………………………………. vi
List of Tables ……………………………………………………………………. xi
List of Figures …………………………………………………………………… xv
Chapter 1: Literature Review …………………………………………………….. 1
1.1. Polycyclic aromatic hydrocarbons …………………………………... 1
1.2. Bioremediation ………………………………………………………. 2
1.3. Bacteria involved in PAH degradation ………………………………. 5
1.4. Sphingomonads ……………………………………………………… 6
1.5. PAHs catabolic pathway …………………………………………….. 7
1.6. Dihydrodiol dehydrogenase …………………………………………. 11
1.7. Aldehyde dehydrogenase …………………………………………….. 12
1.8. Genetics of PAH degradation ………………………………………... 12
1.9. Sphingomonas paucimobilis EPA505 ……..………………………... 14
1.10. Bacterial artificial chromosome (BAC) ……….………………… 15
Chapter 2: Materials and Methods ……………………………………………… 16

viii
Page
2.1. Chemicals ……………………………………………………………. 16
2.2. Bacterial strain, plasmids, and culture condition ……………………. 16
2.3. DNA manipulation …………………………………………………... 16
2.4. Constructing of a genomic library …………………………………… 17
2.5. Designing Primers …………………………………………………… 17
2.6. PCR conditions…………………………………………………….. 18
2.7. Preparing PCR product for sequencing ……………………………... 18
2.8. Hybridization of PCR product with BAC library …………………... 18
2.9 Southern hybridization ………………………………………………. 19
2.10. Shotgun cloning and sequencing ………………………………….. 20
2.11. Sequence analysis …………………………………………………... 20
2.12. Protein expression ………………………………………………….. 21
2.13. Induction assays ……………………………………………………. 26
2.14. Total cell protein (TCP) fraction ………………………………… 27
2.15. Purification of dihydrodiol dehydrogenase (DDH)
and aldehyde dehydrogenase (ALDH)…………………………………. 27
2.16. Western blot hybridization … …………………...…………….. 29
2.17. Protein determination ………………………………….…….… 29

ix
Page
2.18. Enzyme assay ……………..………………………………….…. 31
2.19. Evaluating optimum temperature and optimum pH…………… 32
2.20. Kinetic experiment ……………………………………….………. 33
2.21. Constructing phylogenetic tree……………………………………. 34
Chapter 3: Results ………………...……………………………………………. 35
3.1. Preliminary Research …………………………………………….. 35
3.2. Search for dihydrodiol dehydrogenase gene (bphB) in BAC
library of S.paucimobolis EPA505 …………………………………………. 36
3.2.1. Background and Preliminary Results …………………………... 36
3.2.2. Shotgun cloning and sequencing ……………………………….. 41
3.2.3. Sequence analysis ……………………………………………… 41
3.2.4. . Getting ready for Protein expression ………………………… 53
3.2.5. Protein expression using expression host ……………………… 56
3.2.6. Protein purification …………………………………………….. 58
3.2.7. Protein determination …………………………………………. 61
3.2.8. Enzyme assay ………………………………………………….. 54
3.2.9. Determination of specific activity ……………………………... 58
3.2.10. Determination of optimum temperature and optimum pH …... 60
3.2.11. Steady-state kinetics …………………………………………. 83

x
References…………………………………………………………… 84
List of Tables
Table Page
3.1. Summary of ClustalW alignment for DDH ……………………………………. 44
3.2. Presenting accession number and corresponding protein for DDH………… 45
3.3. Summary of ClustalW alignment for ALDH …………………………..... 51
3.4. Presenting accession number and corresponding protein for ALDH………. 52
3.5. Quantitative Protein determination- ALDH…………………………….... 54
3.6. Representing enzyme activity for three different concentrations of ALDH 65
3.7. Presenting specific activity for different temperatures……………………. 68
3.8. Representing specific activity of ALDH at various pHs…………………. 71
3.9. summary of the results of Steady-state kinetics experiments…………….. 72

xi
List of Figures
Figure Page
1.1. Upper catabolic pathway of naphthalene…………………………………... 8
2.1. pET-30 EK/LIC vector map (Novagen; Madison, WI)……………………. 21
2.2. Standard curve presenting three different concentration of elution buffer 31
3.1. Gel electrophoresis of Sphingomonas paucimobilis chromosomal DNA.. 35
3.2. ClustalW software alignment showing conserved regions of bphB…………… 37
3.3. Agarose gel electrophoresis showing PCR product……………………………. 38
3.4. Nucleotide sequences of PCR product for dihydrodiol dehydrogenase
gene (bphB) in Sphingomonas paucimobilis EPA505………………………. 38
3.5. Hybridization of PCR fragment and BAC library ……………………… 39
3.6. Agarose gel electrophoresis display double digestion of BAC clones……. 40
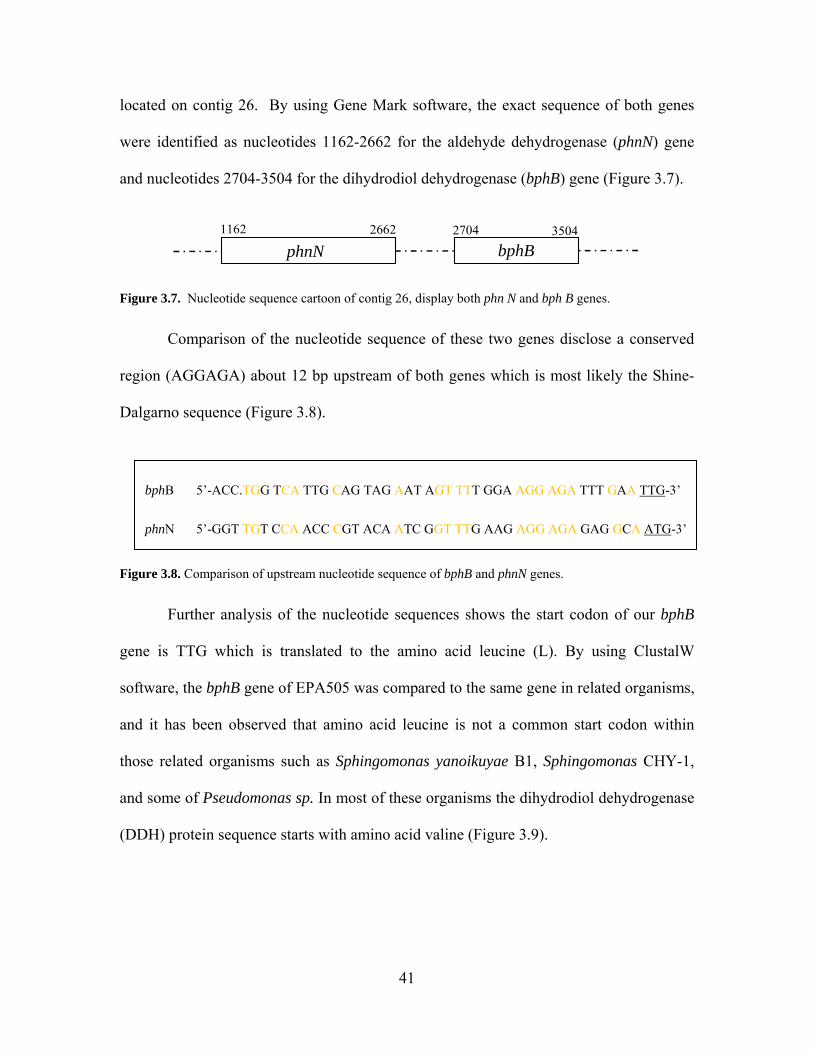
3.7. Schematic of contig 26 nucleotide sequences……………………………. 41
3.8. Comparison of upstream nucleotide sequence of bphB and phnN genes.. 41
3.9. ClustalW alignment compares start codon of dihydrodiol dehydrogenase
protein sequence in eight different related organisms ……………………… 42
3.10. bphB gene sequence and corresponding polypeptide sequence
in S.paucimobilis EPA505……………………………………………………. 43
3.11. ClustalW protein alignment of DDH …………………………………… 46
3.12. Phylogenetic tree of bphB……………………………………………….. 47

xii
Figure Page
3.13. phnN gene sequence and corresponding polypeptide sequence
in S.paucimobilis EPA505…………………………………………………..… 49
3.14. ClustalW protein alignment of phnN………...…………………………… 50
3.15. Phylogenetic tree based on a comparison of 23 bacterial aldehyde
dehydrogenase………………………………………………………………… 53
3.16. Gel electrophoresis showing colony PCR……………………………….. 55
3.17. Gel electrophoresis of DNA plasmid extraction………………………… 56
3.18. Gel electrophoresis of PCR fragment for bphB & phnN Plus T7 RNA
polymerase primers………………………………………………………….. 56
3.19. Gel electrophoresis for colony PCR after transformation of bph B and phn N
containing plasmid into BL21 (DE3) pLysS competent cells……………..… 57
3.20. SDS-PAGE polyacrylamid gel demonstrates the total cell protein fractions as well
as purified protein for DDH……………………………………………….. 59
3.21. SDS gel demonstrates the total cell protein fractions as well as purified
protein for ALDH ………………………………………………………………. 60
3.22. Western blot hybridization……………..………………………………. 61
3.23. Plot representing enzyme assay in three different reactions for 0.005 mg
ALDH………………………………………………………………………….. 63
3.24. Enzyme activity indicating comparison between enzyme concentrations
and specific activity…………………………………………………………… 64

xiii
Figure Page
3.25. Plot representing enzyme concentration vs. OD340…………………… 65
3.26. Plot representing enzyme activity at different temperatures…………... 66
3.27. Plot representing enzyme assay in three different reactions at 45°C……… 67
3.28. Plot representing the optimum Temperature for ALDH………………….. 68
3.29. Plot representing enzyme activity at different pHs……………………….. 69
3.30. Plot representing enzyme assay in three different reactions at pH 7.0……. 69
3.31. Plot representing the optimum pH for ALDH…………………………….. 71

1
Chapter 1: Literature Review
1.1. Polycyclic aromatic hydrocarbons:
Polycyclic aromatic hydrocarbons (PAHS) are a group of hydrophobic organic
compounds composed of two or more fused aromatic rings in their chemical structure.
These rings are organized in linear, angular, or cluster arrangement [1]. PAHs are
classified into two different categories based on their size and shape; 1) low molecular
weight (LMW) PAHs consists of two or three aromatic rings, and 2) high molecular
weight (HMW) PAHs contain four or more rings. Examples of LMW PAHs include, but
are not limited to naphthalene, phenanthrene and anthracene. Fluoranthene, pyrene and
benzo[a]pyrene serve as examples of HWM PAHs. The chemical properties of PAHs are
dependent on both molecular size (the number of aromatic rings) and molecule topology
(pattern of ring linkage) [2]. An increase in the size and angularity of a PAH molecule
results in increased hydrophobicity and stability [3, 4]. The persistence of HMW PAHs
in the environment is due to the molecule stability and hydrophobicity.
PAHs are formed by incomplete combustion of organic matter, automobile
exhausts, coal processing wastes, petroleum sludge, tobacco smoke, wood preservative
wastes [5]. Petroleum refining and transport activities play a major role in localization of
PAHs into the environment [2]. They are widely distributed and relocated through the
natural environment due to human activity and that causing the exposure of ecosystems
to these organic compounds. PAHs are found in air, soil and sediment, surface water,
ground water, and road runoff. They can be dispersed from the atmosphere to vegetation

2
and contaminate foods [2]. This can cause the contamination of the food chain with these
toxic chemicals and therefore result in serious health problems in human [6]. Some
PAHs are also used in the synthesis of other organic compounds in pesticides, fungicides,
detergents, dyes and mothballs [7]. PAHs are highly liposoluable and could be easily
absorbed through the gastrointestinal tract of mammals and can readily localize in body
fat [8].
Many PAHs are toxic, mutagenic and/ or carcinogenic and therefore are known as
environmental pollutants. The HMW PAHs cause environmental concerns because of
their mutagenic and carcinogenic concerns. Localized accumulation of PAHs can be a
result of human activities, such as industrial processes, or can occur as a result of natural
events, such as forest fires and petroleum seeps. Some toxic PAHs are carcinogenic to
marine organisms and can be transferred to human via seafood consumption [9].
Naphthalene, the first member to represent the PAH group, is a common pollutant
in water and soil. The toxicity of this micropollutant is a well known fact [10, 11]. To
enhance its toxicity, naphthalene binds covalently to molecules in liver, kidney and lung
tissues. It is also known as an inhibitor of mitochondrial respiration [12]. Phenanthrene,
another LMW PAHs, is known as a photosensitizer of human skin, a mild allergen and
mutagenic to bacterial systems under specific conditions [11].
1.2. Bioremediation:
Chemical, physical and biological methods have been used to remove PAHs from the
contaminated ecosystem. By definition, the processes for bio-removal of PAHs from the
environment are considered to be microbial transformation and degradation.
Bioremediation, based on certain species of microorganisms, is a cheap and effective way

3
to remove PAHs-wastes from soil [14]. Consequently, the US Environmental Protection
Agency has listed 16 PAHs as priority pollutants for remediation.
It is well known that microorganisms have the ability to degrade a wide range of
organic compounds [15]. Recognizing microorganisms capable of degrading PAHs to
less toxic products could help in the development of processes for remediation of PAH-
contaminated sites [16]. Many microorganisms including some fungi and bacteria are
able to oxidize PAHs. Microorganisms degrade PAHs in three different ways; complete
mineralization, co-metabolic transformation and nonspecific oxidation [17]. It is
important to get complete mineralization of PAHs to avoid accumulation of metabolites
as Clements et al. have reported that biological metabolism of PAHs results in oxidation
products which are potentially more mutagenic and carcinogenic than the original PAHs
[18]. These oxidation products are more water soluble and can readily contaminate
groundwater. It is extremely important to monitor the persistence of PAHs in the
environment because of their harmful effect on the environment and their toxicity
towards animals [19].
Under aerobic condition, the first step in the microbial degradation of PAHs is a
dioxygenase activity which is catalyzed by a multicomponent ring-hydroxylation
dioxygenase [22]. The dioxygenase enzyme catalyzes the interaction between atoms of
an oxygen molecule with two carbon atoms of the benzene ring of PAHs to yield the
corresponding cis-dihydrodiol product. The dihydrodiol goes through rearomatization by
dehydrogenases to form dihydroxylated intermediates. The final reaction is ring cleavage
and produces TCA-cycle intermediates [23].

4
Many studies have shown the relationship between the biodegradation of PAHs and
the number of benzene rings [24]. It has been frequently reported that LMW PAHs are
easily degraded by bacteria; however, HMW PAHs are recalcitrant to biodegradation and
persist in the environment [20, 21]. However, Dingyi et al. have not supported such a
relationship since in their study benzo[a]pyrene (B[a]P) with five aromatic rings and
chrysene with four rings are degraded almost in the same way. These data suggested that
other factors might be affecting the microbial degradation of PAHs. Another factor
influencing the degradation of PAHs is the shape of the molecule. Some data showed
that PAHs, with rings that are more condensed or clustered, are more difficult to be
degraded compared to those which are less clustered.
There appears to be a relationship between water solubility of the PAHs and the
extent of their degradation by some microorganisms. It is believed that the
biodegradation of PAHs is limited by their aqueous solubility and the rate of their
dissolution [25]. Muller et al. [26] demonstrated an increase in the rate of degradation of
some PAHs by Sphingomonas paucimobilis when Tween 80 was added to the medium to
increase the aqueous solubility of the PAHs. In addition to water solubility, steric and
electronic factors contribute to the rate of PAH degradation by microorganisms [16].
Using nonionic surfactants is another approach being considered for PAH bioremediation
[27]. One of the following hypotheses might be the correct reason for using this solution.
The surfactant micelles may either absorb PAHs from the soil matrix, or they may
increase the concentration of the PAHs in the aqueous phase, since the PAH are more
soluble in the micelles [28, 29].

5
1.3. Bacteria involved in PAH degradation:
Some genera of bacteria have been reported to have the ability to utilize PAHs as the sole
carbon and energy sources. They can be divided into the following two major groups:
A. Gram-negative PAH degrading bacteria including: i) Pseudomonas strains, such as
Pseudomonas putida strain OUS82, capable of using naphthalene and phenanthrene
(30); and P.putida T-57, which was isolated from an activated sludge sample after
enrichment, capable of utilizing monocyclic hydrocarbons such as n-butanol, toluene,
styrene, m-xylene [31]; ii) Comamonas teststeroni strain GZ38A, GZ39 and GZ42,
all have the ability to utilize phenanthrene [32]; iii) Ralstonia sp. strain U2, is a
naphthalene-utilizing bacterium and was isolated from oil contaminated soil in
Venezuela [33]; iv) Burkholderia sp. strain RP007, was isolated from a PAH
contaminated site in New Zealand and has the ability to degrade phenanthrene [34,
35]; v) Alcaligenes faecalis strain AFK2 can utilize phenanthrene through o-
phethalene pathway, but not naphthalene [36]; and vi) Sphingomonas sp., are able to
degrade a wide variety of aromatic compounds, including PAHs.
B. Gram-positive PAH degrading bacteria including: i)Rhodococcus sp. strain
NCIMB12038 and UW1, belong to a diverse group of Gram positive soil bacteria and
have the ability to degrade a wide variety of xenobiotics, including aromatic
compounds [37]; ii) Nocardioides sp. strain KP7, has the ability to grow on
phenanthrene at 40◦C [38]; iii) Mycobacterium sp. strain PRY-1, another genus of
Gram positive bacteria, is capable of the mineralization of HMW PAHs such as

6
pyrene, 1-nitropyrene, fluoranthene, phenanthrene, anthracene, and benzo(a)pyrene
[39-42].
1.4. Sphingomonads:
The genus Sphingomonas was first reported by Yabuuchi et al. in 1990 [43] and
describes a genus of bacteria isolated from human clinical specimens and hospital
environments. Sphingomonas strains also have been collected from a variety of
contaminated environments such as subsurface soil [44-53], rhizosphere soil [54],
sediment [55, 56], or aquatic habitats, including wastewater [49, 57, 58], groundwater
[59], freshwater [60-63], and marine water [64]. This genus consists of Gram-negative,
chemoheterotrophic, strictly aerobic, usually yellow pigmented bacteria which have
glycosphingolipid in their outer membrane [65]. This may affect the biodegradability of
PAHs by interacting with or taking up the substrate [66].
It has been shown that Sphingomonas has the ability to degrade a large variety of
pollutants including azo dyes [61], chlorinated phenol [47, 67], dibenzofurans [68, 69],
insecticides [70] and herbicides [71, 72]. However, Sphingomonas strains are more often
isolated from polycyclic aromatic hydrocarbons (PAH) contaminated soils [46, 51, 52,
and 73].
As mentioned earlier, Sphingomonas sp. strain A4 has the ability to utilize
acenaphthene and acenaphthylene as sole carbon and energy sources [74]; however,
degradation of acenaphthene proceeds via different mineralization pathways and
therefore different types of catabolic genes are involved [74]. Sphingobium sp. strain P2
was first isolated from a petroleum contaminated soil sample and is able to utilize
phenanthrene as a sole source of carbon and energy [75]. The phenanthrene-degrading

7
bacterium strain ZX4 was also isolated from an oil-contaminated soil. This bacterium
was identified as Sphingomonas paucimobilis based on 16S rDNA sequence, cellular
fatty acid compounds, mol % G + C, and Biolog GN tests [14]. Strain ZX4 could also
utilize naphthalene, fluorine, and some other aromatic compounds.
Sphingomonas yanoikuyae B1 is able to degrade a wide variety of aromatic
hydrocarbons as carbon and energy sources. This organism was called Beijerinckia
species strain B1 but was reclassified as Sphingomonas yanoikuyae [76]. It was
originally isolated for its ability to utilize biphenyl as a carbon source [77]. This
organism is capable of growing on many different polycyclic aromatic hydrocarbons such
as naphthalene, phenanthrene, and anthracene [77-79] and also many monocyclic
aromatic hydrocarbons like toluene, m-,and p-xylene [80]. Metabolism of polycyclic or
monocyclic aromatic carbohydrates is co-induced by growth on any class of aromatic
hydrocarbons [80-82]. When the catabolic pathways are induced, the organism is able to
degrade a wide variety of aromatic compounds.
1.5. PAHs catabolic pathway
The proposed upper catabolic pathway for the degradation of biphenyl,
naphthalene and phenanthrene by S. yanoikuyae B1 is shown in Figure 1.1 [130]. The
bphB gene which encodes dihydrodiol dehydrogenase, is the second enzyme of the
pathway and converts cis-dihydrodiol to corresponding diol [102]. The complete
catabolic pathways for utilization fluoranthene, phenanthrene, and naphthalene in
EPA505 have been previously reported (14).

8
Figure 1.1. Upper catabolic pathway of naphthalene. Enzymes: (A) naphthalene dioxygenase, (B) cis-naphthalene dihydrodiol dehydrogenase, (C) 1,2-dihydroxynaphthalene dioxygenase, (D) 2-hydroxychromene-2-carboxylate isomerase, (E) trans-o-hydroxybenzylidenepyruvate hydratase aldolase, (F) salicylaldehyde dehydrogenase(130).
A bacterial catabolic pathways for degradation of low molecular weight PAHs such
as naphthalene, phenanthrene, and anthracene have been well demonstrated [83-85].

9
Using recombinant bacteria carrying aromatic genes capable of degrading PAHs helps to
identify intermediate catabolites, gives information about substrate specificity of the
enzymes, and allows identification of PAH catabolic pathways [86-89].
Oxidation or hydroxylation of PAHs as the first step of degradation can occur via the
cytochrome p450- mediated mixed function oxidase system [90]. The results of these
oxidations are epoxides or phenols which are detoxified in reactions to produce
glucoronides, sulfates or glutathione conjugates[10].
Naphthalene is the simplest PAH, consisting of two fused aromatic rings and
relatively water soluble. It is easily degraded by microorganisms and is used as a model
compound to show PAH biodegradation. First, an oxygen molecule is introduced to the
aromatic nucleus at the 1,2-position to produce cis-naphthalene dihydrodiol, which is
catalyzed by naphthalene dioxygenase. This dioxygenase system consists of three
components: a ferredoxin reductase, a ferredoxin, and an iron sulfur protein (ISP). The
electron transport system takes place in a ferredoxin reductase by a single two-electron
transfer from NAD(P)H to FAD that will produce a fully reduced form of the FAD.
These electrons are finally used to facilitate the addition of an oxygen molecule to
naphthalene [1].
cis-Naphthalene dihydrodiol is then dehydrogenated to a dihydroxylated product by
cis-naphthalene dihydrodiol dehydrogenase. The dihydroxylated product is meta-cleaved
by another dioxygenase resulting in a carboxylated product. Enzymatic reactions by an
isomerase and a hydratase- aldolase result in the production of salicylaldehyde, which is
then transformed into salicylate by salicylaldehyde dehydrogenase. Salicylate is further
metabolized to TCA cycle intermediates via catechol or gentisate [1].

10
Phenanthrene is metabolized to 1-hydroxy-2-naphthoic acid initially by a
dioxygenase at the 3,4-position [91, 92] which is then mineralized through two different
pathways. The first pathway undergoes the oxidization process and produce 1,2-
dihydroxynaphthalene which is then metabolized via salicylic acid [91]. The second
pathway undergoes ring-cleavage and is further metabolized via o-phthalic acid and
protocatechuic acid [92]. However, not much information is available about degradation
of phenanthrene at the 1, 2- position.
Catabolic pathways have been suggested for high molecular weight PAHs such as
fluoranthene, but they are not as clearly defined as that of naphthalene and phenanthrene.
Recently, two fluoranthene degradation pathways have been reported. One is used by
Mycobacterium PYR-1 [93, 94] and the other one is Alcaligenes denitrificans WWI [95].
Sphingomonads play a major role in degradation of aromatic compounds [96-100].
Sphingomonas yanoikuae B1 degrades naphthalene, phenanthrene, anthracene, and
benz[a]anthracene and the initial oxidation products catalyzed by a dioxygenase were
identified which were the same as those identified previously for Pseudomonas species
[98]. Sphingomonas paucimobilis strain ZX4 degrades phenanthrene via a salicylate
pathway, while catechol degradation occurs through a meta-cleavage pathway based on
what was revealed from the catechol 2,3-dioxygenase assay [14].
Sphingomonas sp. strain A4 has the ability to utilize acenaphthene and
acenaphthylene as sole carbon and energy sources [74]. The catabolic pathway of
acenaphthene degradation by strain A4 is via acenaphthenol and acenaphthenone which
leads to production of different intermediates [74]. These findings showed that strain A4

11
uses different types of PAH catabolic genes from those in PAH-degrading
sphingomonads.
1.6. Dihydrodiol dehydrogenase:
Mammals and microorganisms both oxidize naphthalene to 1,2-
dihydroxynaphthalene, however the pathways that these two are persuing to get to this
common metabolite are different. Liver microsomes combine one atom of molecular oxygen
with naphthalene to yield 1,2-naphthalene oxide [75]. The latter compound can undergo
several metabolic reactions, one of those is the enzymatic addition of water by the enzyme
epoxide hydrase to form trans-1,2-dihydroxy-1,2-dihydronaphthalene (transnaphthalene
dihydrodiol).
Bacteria, as it was mentioned earlier, oxidize naphthalene by a different pathway.
cis-Dihydrodiols have been described as intermediates in the bacterial oxidation of many
different PAHs. An oxidized nicotinamide adenine dinucleotide- specific oxidoreductase
was demonstrated to catalyze the oxidation of the cis-dihydrodiols to the corresponding
catechol derivatives. The enzymes gained from bacteria are similar with the one from rabbit
liver regard to their specificity for cis-dihydrodiols and their absolute requirement for
NAD+ as an electron acceptor. The diol dehydrogenase from rabbit liver uses NADP+ as an
electron acceptor [75].
The substrate for DDH enzyme is cis-1,2-dihydroxy-1,2-dihydronaphthalene
(DHD), (see Figure 1.1), which is known as an unstable intermediate and is an important
precursor leading to the production of pesticides. DHD is involved in the second step in
the bacterial oxidation of PAHs which is conversion of DHD to 1,2-
dihydroxynaphthalene.

12
1.7. Aldehyde dehydrogenase:
Aldehyde dehydrogenases are known as a group of NAD(P)+-dependent enzymes
that catalyse the oxidation (dehydrogenation) of wide range of exogenous and
endogenous aldehydes. ALDH genes are found in almost every genome analyzed to date,
referring to importance of ALDH in biological functions. According to the Journal of
Chemical and Biological Interactions [76], “The ALDH superfamily consists of 331
distinct genes, of which eight are found in archaea, 165 in eubacteria, and 158 in
eukaryote”. In some species such as E. coli and C. elegans in which their entire genome
has been sequenced, the number of ALDH genes ranges from 10-17.
ALDH is considered as the last enzyme in the upper catabolic pathway of PAH
degradation and also it has an important role which is connecting the upper pathway to
lower catabolic pathway which will lead the pathway to TCA cycle intermediates.
1.8. Genetics of PAH degradation:
The presence of a unique group of genes responsible for degrading the aromatic
compounds has been reported in several different sphingomonads, such as Sphingomonas
yanoikuyae B1 that utilizes naphthalene, phenanthrene, and anthracene [103, 104];
Novosphingobium aromaticivorance strain F199, utilizing naphthalene and fluorine
[105]; Sphingobium sp. strain P2 capable of degrading naphthalene and phenanthrene
[106]; and S. paucimobilis EPA505 that utilizes fluoranthene, naphthalene and
phenanthrene [107]. The aromatic catabolic genes in these sphingomonads are arranged
in a different way and apparently have a distant relationship with those in pseudomonads
and other genera in sequence homology and organization of genes [108]. These genes
are in the genome in several clusters; however, their function, expression, and regulatory

13
systems are still mostly unknown [77]. In Novosphingobium aromaticivorans F199, a
large plasmid reported to have 79 genes, about one third, of genes encoding the PAH
degrading enzymes [109].
It might be expected that the genes for aromatic hydrocarbons degradation in S.
yanoikuyae B1, which are located on a 40 kb DNA region, are arranged into operons
based on catabolic segments similar to related organisms (i.e., Pseudomonas species,
[110-112]). In this DNA fragment, 35 genes on at least six operons have been identified.
One operon may regulate genes responsible for conversion of PAHs to simple aromatic
acids, similar to bph operon [113] or the upper nah operon [111, 114]. Another operon
may contain genes required for conversion of monocyclic aromatic compounds to
aromatic acids like upper xyl operon [110]. A third operon may contain genes required
for conversion of aromatic acids to tricarboxilic acid cycle intermediates, similar to the
lower xyl operon [110].
The catabolic genes participating in the degradation of monoaromatic hydrocarbons
have an unusual arrangement and are interspersed with genes involved in biphenyl or
PAH catabolism. There are multiple copies of genes encoding ring-hydroxylating
dioxygenase terminal components which were identified, but their actual function toward
the catabolic pathway of PAHs is not clear.
In one phenanthrene-degrading Sphingobium strain, three distinct oxygenases had
salicylate hydroxylase activity. This bacterium contains catabolic genes very similar to
those found in strain F199. Genes involved in the salicylate lower pathway and the
protocatechuate lower pathway were shown to be required for PAH degradation [115]
and fluorine degradation [116], respectively. While there is not much information

14
available for the enzymes involved in the initial steps of PAH degradation, some studies
have provided evidence that the initial attack on PAHs is catalyzed by a dioxygenase-
type enzyme [117, 118] which has not been identified in sphingomonads [119].
Bacterial metabolism of biphenyl is initiated by a biphenyl 2,3-dioxygenase (BPO),
encoded by the bphA gene, which adds both atoms of molecular oxygen to biphenyl
[120]. The product, cis-biphenyl-2,3-dihydrodiol, is oxidized to 2,3-dihydroxy biphenyl
by cis-biphenyl dihydrodiol dehydrogenase (BDDH), which is encoded by the bphB gene
[120, 121]. 2,3-Dihydroxybiphenyl is then cleaved by another dioxygenase, 2,3-
dihydroxy biphenyl-1,2-dioxygenase, encoded by the bphC gene. This enzyme is an
extra-diol meta-cleaving dioxygenase and has been well characterized [122, 123].
Three genes, which include two of meta-cleavage operon genes and one of
glutathione S-transferase (GST) were characterized from S. paucimobilis strain ZX4.
The phylogenetic trees based on 16S rDNA sequence and in the meta-pathway gene
pathway both proved that strain ZX4 is related to the genus Sphingomonas [14].
1.9. Sphingomonas paucimobilis EPA505
Sphingomonas paucimobilis EPA505 was first isolated from soil highly
contaminated with coal tar creosote waste site in Gulf Breeze, Florida [51]. S.
paucimobilis EPA505 can use fluoranthene as a carbon and energy source. This
bacterium can grow on 2,3-dimethylnaphthalene, anthracene, phenanthrene, fluoranthene,
and benzo[b]fluorine. It is also able to catalyze the complete degradation of biphenyl,
fluorene, anthraquinone, pyrene, and chrysene. It was recently reported that this strain
could partially degrade other high molecular weight PAHs, such as
benz[a]anthracene(B[a]A), benzo[a]pyrene(B[a]P), benzo[b]fluoranthene(B[b]F), and

15
dibenz[a,h]anthracene (DB[a,h]A), [124]. S. paucimobilis EPA505 can degrade these
PAHs cometabolically [16]. Mueller et al. [51] and Dingyi et al. [16] both agreed that
fluoranthene can induce the enzymes responsible for the microbial degradation of a
variety of PAHs. Catabolic pathways for the degradation of fluoranthene, naphthalene,
phenanthrene, and anthracene were reported by Story et al. [124].
1.10. Bacterial artificial chromosome (BAC):
The bacterial artificial chromosome (BAC) system is a useful tool to analyze the
genomes of target species. The advantage of this system is that it can carry exogenous
inserts that are very large (>100 kilobases, kb). Bacterial artificial chromosomes are
dependent on plasmid vectors, composed of an F-factor origin of replication with a
chloromphenicol resistance gene [125].
BAC libraries have a broad range of applications in modern biology including
isolation of intact genes or gene clusters from regions of interest [127], whole genome
physical mapping [128], and positional cloning [129] in addition to many other genomic
applications.

16
Chapter 2: Materials and Methods
2.1. Chemicals:
NAD+, antibiotics, and most other chemicals were purchased from Sigma-Aldrich
(Sigma, USA). Restriction enzymes and DNA markers were obtained from Promega
(Promega, Madison, WI). Acetone, methanol, and ethyl acetate and some other chemicals
were purchase from Fisher Scientific.
2.2. Bacterial strain, plasmids, and culture conditions:
Sphingomonas paucimobilis strain EPA505 was purified from creosote waste and
was maintained on Luria-Bertani agar (LB agar). E. coli JM109 and E. coli DH5 were
used to make competent cells and were grown and maintained in rich media such as
Luria-Bertani agar (LB agar) or tryptic soy agar (TSA). Plasmid pBluescript was used
for cloning purposes and harboring bacteria were maintained on LB supplemented with
Ampicilin (50 µg/ml). All bacteria with recombinant plasmids were grown in LB plus
appropriate antibiotics and kept in 15% glycerol at -80◦C.
2.3. DNA manipulations:
Restriction enzyme digestion, ligation, and agarose gel electrophoresis were
carried out following standard protocols [12]. Genomic DNA was extracted from
Sphingomonas paucimobilis EPA505 using the Ultraclean DNA isolation kit from
MOBIO (MO BiO, Carlsbad, CA). DNA fragments were purified from agarose gels with
a QIAquick gel extraction kit (QIAGEN, Valencia, CA). Plasmids were isolated using
Wizard plus SV minipreps DNA purification system from promega (Promega, Madison,

17
WI). BAC clones were extracted using the QIAGEN Plasmid Midi kit (QIAGEN,
Valencia, CA).
2.4. Constructing of a genomic library:
A BAC library was constructed from genomic DNA of Sphingomonas
paucimobilis EPA505 by Clemson University Genomic institute (CUGI). Briefly, high
molecular weight genomic DNA of Sphingomonas paucimobilis EPA505 was prepared in
low melting point agarose; subsequent manipulations were done in situ in the agarose to
prevent shearing of the DNA. The genomic DNA was partially digested with restricted
enzymes and size-selected using a series of pulsed-field gel electrophoresis runs, and
ligated to dephosphorylated BAC vector. Ligation products were electroporated into E.
coli using a strain (DH10B, Invitrogen). Subsequent colonies were plated on
chloramphenicol plate and “arrayed” with a robotic picker into individual 384-well
microtiter dishes, incubated overnight and ultimately stored at -80°C in glycerol
containing media. The library was stored in numerous 384-well microtiter dishes, the
number of which is dependent on the genomic “coverage” of the library.
2.5. Designing Primers:
All primers were obtained from Integrated DNA Technologies (IDT, Coralville,
IA). A set of primers was designed based on conserved regions of the pbhB gene
encoding dihydrodiol dehydrogenase of Sphingomonas sp. strain CHY-1 (Accession
number AM230449) and Sphingomonas yanoikuyae strain B1 (Accession number
EF151283). By using ClustalW software (www.ebi.ac.uk/tools/clustalw), conserved
regions of pbhB gene were recognized used to order the primers. The primers were

18
nucleotides 262-283 (5’-GTCGGCAATGTCGGGATCTGGG) and 751-773 (5’-
GAACGGTTCTGCTCAGCGACGG) after Sphingomonas CHY-1 pbhB gene for
forward and reversed primers, respectively.
2.6. PCR conditions:
The primers were shipped as a dried palette. The final concentration of 100 µM
suspension in nuclease free water was made for each primer. Routine PCR was
performed as follows: 0.2 mM forward primer, 0.2 mM reverse primer, 30 ng template
DNA, x μl H2O, and 25 µl Go- taq Green Master Mix (Promega, Madison, WI) in 50 µl
total reaction volume. The amplification reaction was performed using a Genius PCR
machine and the program consisted of an initial denaturation at 95 °C for 2 min, 20 cycles
of denaturation at 95 °C for 45 sec, annealing at 58 °C for 45 sec, extension at 72 °C for
45 sec., and final elongation at 72 °C for 2 min followed by storage at 4 °C.
2.7. Preparing PCR products for sequencing:
PCR reactions were purified using QIAquick PCR purification kit (QIAGEN,
Valencia, CA). Sequencing reactions (one for forward primer and one for reverse
primer) were performed at CUGI (ABI3730xl, applied biosystem). For sequencing
purposes, 1 pmol of each primer and about 30-50 ng of template DNA (approximately 1
kb in size) was required.
2.8. Hybridization of PCR product with BAC library:
Hybridization of the PCR product with BAC library was performed at CUGI
using standard protocols. DECAprimeTM II random DNA labeling Kit from Ambion,

19
Applied biosystems (Ambion, Austin, TX) was used to label the PCR product derived.
For optimizing probe specific-activity, 25 ng of template DNA was recommended.
Template DNA was prepared by diluting DNA in water or TE to 1-2.5 ng/ul, then 2.5 µl
of 10X Decamer Solution was added followed by incubation at 95-100 °C for 3-5 min.
The mixture was snap-frozen to prevent self-annealing of the template DNA and then
was thawed and placed on ice.
For probe synthesis reaction, the Klenow reaction was assembled on ice, mixed
gently, and incubated at 37 °C for 5-10 min. One microliter of 0.5 M EDTA was added
to stop the reaction. Probes are stored at -20 °C at this point or they were prepared for
hybridization by first being diluted 10 fold in 10 mM EDTA followed by incubation at 90
°C for 10 minutes and then added to the prehybridized blot.
2.9. Southern hybridization
Southern-blot analysis was performed using standard protocol
(www.flemintonlab.com). It was consisted of three steps:
Salt Transfer Step; A Magna, Nylon, Transfer Membrane (Osmonics INC., Minnetonka,
MN) was cut to the size of the gel and it was then placed in a tray containing distilled
water. The membrane was transferred to a tray containing 10X SSC and was equilibrated
for at least 15 minutes. The gel was first agitated in a tray containing 0.25 N HCl for 10
minutes, after pouring off the salt, the gel was briefly rinsed with distilled water,
followed by a second agitation in a tray containing 0.4 N NaOH/0.6 M NaCl for 30
minutes. The gel was rinsed with distilled water and was then agitated for the third time

20
in a tray containing 1.5 M Nacl/0.5 M Tris pH 7.5 for 30 minutes. Capillary transfer was
set up, using 10X SSC as transfer solution. The transfer was completed over night.
DNA fixation step; the membrane was removed and incubated for 1 minute in 0.4 N
NaOH to denature membrane-bound DNA. It was then naturalized by incubating in
0.2M Tris-HCl for 1 minute. The membrane was rinsed with 2X SSC and DNA was
fixed to it by UV-crosslinking.
Hybridization Step; The hybridization step was performed at CUGI as described in the
previous section (Hybridization of PCR product with BAC library).
2.10. Shotgun cloning and sequencing
The shotgun library construction and DNA sequencing were performed at CUGI,
by the following method:. After the DNA was isolated using MAXI-prep, it was
randomly fragmented by hydroshear device (Gene machine). Fragments between 3-5 kb
were size selected by gel electrophoresis and then cloned into the high copy number
plasmid vector pBlueskriptII KSII+ followed by electroporation into E. coli DH10B cells.
Transformants were selected on LB plates containing carbenicillan, X-gal and IPTG.
Five hundred and six white recombinant colonies were picked robotically using Genetix
Q-bot and stored as individual clones in Genetix 96-well microtiter plates as glycerol
stocks at -80°C. Sequencing was accomplished by using an ABI 3730xl with the BigDye
v3.1 chemistry.
2.11. Sequence analysis
Analysis of shotgun clones and sequences, using Consed software and
programming, resulted in 27 contigs. After further analysis of all the contigs , the genes

21
of interest, i.e., dihydrodiol dehydrogenase (bphB) and aldehyde dehydrogenase (phnN);
were both located on contig 26. Gene Mark software was used to determine the sequence
of both genes.
2.12. Protein expression
Protein expression in E.coli was examined by the EK/LIC Cloning system
(Novagen, Madison,WI). For cloning and expression of the bphB and the phnN, the pET-
30 EK/LIC cloning kit (Novagen, Madison, WI) was used (Figure 2.1).
Figure 2.1. pET-30 EK/LIC vector map (Novagen; Madison, WI).
The Novagen ligation-independent cloning (LIC) vectors allowed rapid cloning of
genes in the multiple expression system. LIC was designed for directional cloning

22
without the need for restriction enzyme digestion. The EK/LIC vector and insert were
annealed and then transformed into competent E.coli cells. The pET-30 EK/LIC uses T7
RNA polymerase for transcription of clones and subsequence gene expression. The
coding region lies between the N-terminal and/or C-terminal histidine tag sequences
which were used to isolate the protein of interest after expression.
All Ek/LIC vectors have the same EK/LIC cloning site so only the same EK/LIC-
prepared target insert can be annealed into the EK/LIC vectors. Only target genes which
start with nucleotides ATT, ATC, ATA or ATG (ie, sequences starting with either amino
acids methionine or isoleucine) were able to be annealed to the EK/LIC vector. The
oligonucleotides were designed after internal sequences of bphB and phnN genes from
contig 26 of shotgun sequences. The target ORF was amplified by PCR to make an
EK/LIC insert. PCR primers were designed for the genes of interest (i.e., bphB and
phnN), with the addition extensions (overhangs) at the 5’ ends. Detailed procedure for
protein overexpression is as follows:
Insert Preparation:
The target ORF was amplified by PCR to make an EK/LIC insert. PCR primers
were designed for the genes of interest, dihydrodiol dehydrogenase (bphB) and aldehyde
dehydrogenase (phnN), with the addition extensions (overhangs) at the 5’ ends. The
oligonucleotides were designed after internal sequences of bphB and phnN genes from
contig 26 of shotgun sequences. For bphB, the forward primer (5’-
GACGACGACAACATGTCTGCAAGGCTTGAAGGAC) and reverse primer (5’-
GAGGAGAAGCCCGGTCAGGCGTCGGGACGCTTG) corresponded to nucleotides
2704-2726 and 3485-3504, respectively. Also for phnN the forward primer (5’-

23
GACGACGACAAGATGGCTACCCAACTGAAGAGC) and reverse primer (5’-
GAGGAGAAGCCCGGTTACTGGTCGAACATCCCCAC) corresponded to nucleotides
1162-1183 and 2640-2661, respectively. Routine PCR was performed as: 0.2 mM
forward primer, 0.2 mM reverse primer, 30 ng template DNA (BAC clone 03C01), 22 μl
nuclease-free H2O, and 25 µl Go- taq Green Master Mix ( Promega, Madison, WI) in 50
µl of total reaction volume. The amplification reaction was performed as previously
mentioned. The PCR products were purified by QIAquick PCR purification kit
(QIAGEN, Valencia, CA) and examined by agarose gel electrophoresis to check the
correct size. DNA concentrations (A260 ) were measured by Bio photometer, Eppendorf
(Eppendorf North America, Westbury, N.Y.).
T4 DNA polymerase treatment of target insert:
The EK/LIC vector kit requires insert treatment with T4 DNA polymerase to generate
compatible overhangs. By using the following formula the target insert concentration in
pmol/μl was calculated: (DNA concentration μg/ml X 1 ml/1000 μl X 1 pmol/660 pg X
106 pg/1 μg X 1/number bp in insert = DNA conc. pmol/μl). The following components
were assembled in a sterile 1.5 ml Eppendorf tube kept on ice: X μl 0.2 pmole purified
PCR product in TlowE buffer (10 mM Tris HCl, 0.1 mM EDTA, pH 8.0), 2 μl 10X T4
DNA polymerase buffer, 2 μl 25 mM dATP, 1 μl 100 mM DTT, Y μl Nuclease free
water, and 0.4 μl 2.5 U/μl T4 DNA polymerase to get the 20 μl total volume. The
reaction was started by adding enzyme and incubated at 22 ˚C for 30 minutes and then
terminated by inactivation of the enzyme by incubating at 75 ˚C for 20 minutes. At this
point, the insert was ready to anneal to any EK/LIC vector.

24
Annealing the vector and EK/LIC Insert:
Two microliter of T4 DNA polymerase treated PCR product (EK/LIC insert) and
1 μl of pET-30 vector (EK/LIC vector) were added to a sterile eppendorf tube and was
incubated at 22 ˚C for 5 minutes. Then, 1 μl of 25 mM EDTA was added followed by
another 5 min. incubation at 22 ˚C. Because of the compatible overhangs in the vector
and insert, the T4 DNA polymerase treated insert was annealed to the vector.
Transformation:
The NovaBlue competent cells have a high transformation efficiency which is due
to recA- and endA- mutations. There is no source of T7 RNA polymerase which makes
the transformation ideal for the production of recombinant plasmids under nonexpression
condition. For target gene expression, BL21 (DE3) was used which is the most widely
used expression host strain. The pLysS host contains a compatible chloramphenicol-
resistant plasmid that provides a small amount of T7 lysozyme which is a natural
inhibitor of T7 RNA polymerase. The annealed insert and vector were first transformed
into NovaBlue competent cells which are the initial cloning host for pET vectors. For the
first step of transformation; 1 μl of annealing reaction was directly added to the
competent cells followed by incubation on ice for 5 minutes. The next step was to heat-
shock the cells. Tubes were heated at 42 ˚C for 30 seconds and incubated on ice for 2
min. Approximately 80 μl SOC medium at room temperature was added to each tube and
incubated at 37 °C while shaking at 250 rpm for 60 min. The cells were then plated in
triplicates (50 µl per plate) on LB containing appropriate antibiotics; ie., kanamycin (30
µg/ml) for NovaBlue or Kanamycin (30 µg/ml and chloramphenicol (34 µg/ml) for BL21
(DE3) expression host. All plates were incubated overnight at 37 °C.

25
Colony Screening:
By performing direct colony PCR rather than the plasmid extraction, colonies
were screened for plasmids containing the right sized inserts. Novagen vector specific
primers, T7 promoter and T7 terminator, were used to perform colony PCR which then
were analyzed by agarose gel electrophoresis. Two colonies were picked from each
plate. The picked single colony was transferred to a 0.5 ml tube containing 50 µl
nuclease-free water and the same colony was streaked on LB/antibiotic plate to be used
later for stock preparation and plasmid isolation from positive clones. The tubes were
then boiled at 99 °C for 5 min to lyse the cells and denature DNases followed by spinning
at 12,000 x g for 1 min to remove cell debris. Collected supernatant was then used as
template DNA for PCR. Routine PCR was performed as follows: 1 µl forward primer
(T7 promoter), 1 µl reverse primer (T7 terminator), 1 µl template DNA, 22 μl H2O, and
25 µl Go- Taq Green Master Mix (Promega, Madison, WI). The amplification reaction
was performed using the program which consists of an initial denaturation at 95 °C for 2
min, 20 cycles of denaturation at 95 °C for 45 sec., annealing at 58 °C for 45 sec.,
extension at 72 °C for 45 sec., and final elongation at 72 °C for 2 min. followed by
storage at 4 °C.
Plasmid purification:
Recombinant plasmids were purified from the NovaBlue host cells. These cells
were then used for transformation into BL21-(DE3) host cells for gene expression. One
single colony of a positive clone was inoculated into 5 ml of LB broth with antibiotic and
incubated overnight at 37 °C while shaking at 250 rpm. When OD600 reached 0.5-1.0, 0.9
26
ml of the growing culture was transferred to a cryovial plus 0.1 ml of 80% glycerol and
stored at – 80°C. The remainder of growing culture was used for plasmid purification by
using the Promega Wizard plus miniprep DNA purification kit (Promega, Madison, WI)
The purified plasmid was then transformed into BL21 (DE3)pLysS expression host for
gene expression. The transformation was performed as described previously.
2.13. Induction assays
Expression of the recombinant target DNA (pET-30 EK/LIC vector and gene of
interest) was induced by addition of 1 mM isopropyl-β-D-thiogalactopyranoside (IPTG)
to the OD600=0.5-1.0 growing culture. Cells containing recombinant plasmid were
inoculated into LB broth media supplemented with kanamycin (30 µg/µl) and
chloromphenicol (34 µg/µl). IPTG induction was performed by using the induction
protocol in the pET system manual (Novagen, Madison, WI) as follows: one single
colony from a freshly streaked plate was inoculated into 10 ml LB containing antibiotics
in a 50 ml flask and incubated at 37 °C with shaking at 150-200 rpm to get to OD600 of
0.5 (about 3-5 hours). Five mililiter of starter culture was added to 100 ml LB containing
antibiotics. The culture was shaken at 37 °C until the OD600 reached to 0.5-1.0. At this
point before the induction, the 100 ml culture was split into 2 x 50 ml culture. IPTG was
added to one of the 50 ml cultures to get to 1 mM final concentration and labeled as
“Induced” and the other 50 ml was used as un-induced control. Flasks were then
incubated at 30 °C while shaking at 250 rpm to get a full induction of target protein and
preventing the production of inclusion bodies.

27
2.15. Total cell protein (TCP) fraction
One ml samples were taken at time 0, 1, 2, 4, and 6 hours of induction and total
cell protein (TCP) was analyzed on SDS-polyacrylamide gel followed by Coomassie
Blue staining. Prior to IPTG induction and during the induction assay, 1 ml sample was
taken from both un-induced and induced cultures and centrifuged at 10,000 x g for 1 min.
supernatant was removed and discarded and the pellet was completely resuspended in
100 µl 1X phosphate-buffer saline (PBS). Then, 100 µl of 4X sample buffer was added
and passed through a 27- gauge needle three times to reduce the viscosity. The samples
were immediately heated at 85 °C for 3 min. and stored at -20 °C until ready for SDS-
PAGE analysis.
2.16. Purification of dihydrodiol dehydrogenase (DDH) and aldehyde
dehydrogenase (ALDH)
The DDH and ALDH enzymes were purified from the E. coli strain containing the
recombinant plasmid in which these genes were placed under the control of the
isopropyl-β-D-thiogalactopyranoside (IPTG)-inducible lac operator. One single colony
of recombinant E. coli strain was inoculated into 50 ml LB containing antibiotics,
(30µg/µl kanamycin and 34 µg/µl chloromphenicol), and incubated at 37 °C while
shaking for 3-4 hours. After the OD600 reached to 0.5, the 50 ml starter culture was
transferred into 1 liter LB containing antibiotics and incubated at 37 °C while shaking.
When the OD600 reached 0.6-1.0, IPTG was added to the culture to start the induction
assay. The culture was then incubated at 30 °C during the induction procedure to reduce

28
production of inclusion bodies. After 6 hrs of induction, the cells were centrifuged at
8,000 rpm for 20 min. The pellet was kept at -80 °C until ready for purification.
Cell extract was prepared by resuspending the pellet in 10 ml binding buffer (100
mM HEPES, 500 mM NaCl, 10 mM imidazole pH 7.5). The suspension was then
transferred into a clean 50 ml tube and treated by protease inhibitor tablets (Roche
Diagnostics; Indianopolis, IN). The cells were lysed by passage through a French press
(Travenol Laboratories; Silverspring, Maryland) twice followed by centrifugation at
8,000 rpm for 20 min to remove cell debris. The supernatant was removed and transferred
to a clean 15 ml tube. Two mililiter of resin (His LinkTM protein purification resin;
Promega, Madison, WI) were added to the supernatant and then it was incubated with
rotation for 2 hrs at
4 °C.
After the binding step, a clinical centrifuge was used to pellet beads (4500 rpm for
1 min). The supernatant was removed and beads were washed with 10 ml wash buffer
(100 mM Hepes, 500 mM NaCl, 20 mM Imidazole) while rotating at room temperature
for 5 min. The beads were spin down by centrifugation at 4500 rpm for 1 min. The
washing steps were repeated 3 times. The next step was adding 500 µl of each 3 different
elution buffer. The first elution buffer (100 mM HEPES, 100 mM imidazole) was added
and then mixed on a rotator for 5 min. followed by centrifugation. The same procedure
was performed for the second elution buffer (100 mM HEPES, 200 mM imidazole) and
third elution buffer (100 mM HEPES, 500 mM imidazole). Each elution step was done
twice. The collected supernatant was stored as fraction proteins with addition of 15 %
glycerol to each fraction and kept at -80 °C freezer.

29
2.17. Western blot hybridization
To perform Western hybridization, samples were separated using a SDS-PAGE
for 1 hr at 120V. The excess part of the gel was cut off and only sections containing
proteins were left. Proteins were transferred to nitrocellulose using a Trans-Blot SD,
Semi-Dry Transfer cell as follows: First all filters from tray I were placed on blot one by
one by rolling out bubbles with a glass roller stick between each filter. The same was
done for all 10 filters of tray II and then the membrane was placed on top of the filters
with the marked side up. The gel was placed on the membrane and covered with the
remaining filters from tray III. The cells were transferred by Trans- Blot SD at 135
mAmp for 30 min. The membrane was then placed in a tray containing Ponceau S
concentrate. If bands appeared on the membrane, it meant that the transferring step was
successful. The membrane was then incubated overnight in 5% non-fat milk solution in
TBST-buffer plus primary antibody (Histidin-Antibody or His-Ab). The overnight
incubation was accomplished with rotation at 4°C. After the incubation, the membrane
was washed 4 times (5 min each) in TBST buffer with rotation followed by incubation
with 5% non-fat milk plus secondary antibody (goat anti-mouse-Ab) for 1 hr at room
temperature with rotation. The membrane was washed 4 times (5 min each) and then the
substrate was added to it. After the membrane was air-dried, it was ready to be exposed to
film for development.
2.18. Protein determination
Protein concentrations were determined by the method of Bradford. The Bradford
quantitative protein assay is based on the binding a dye, Coomassie brilliant blue, to a

30
protein sample and comparing this binding to a standard curve formed by the reaction of
a known standard protein, usually Bovine serum albumin (BSA). Protein samples were
diluted in the same buffer in which they were dissolved or eluted. In our study, the
elution buffer consisted of three different concentration of imidazole (100 mM, 200 mM,
and 500 mM). Standard curves were prepared separately for all three different
concentration of imidazole.
A 1 mg/ml BSA standard solution was made as stock and was used to prepare a
standard curve by pipetting together with the protein dilution buffer according to Table
2.1. The same buffer was used as that used to dilute the proteins, (i.e., 100, 200, or 500
mM imidazole). Solutions corresponded to 0, 0.05, 0.1, 0.2, 0.3, 0.4, and 0.5 mg/ml
BSA. The total volume of all samples was 200 µl. 20 µl of each BSA dilution was
pipette into a plastic cuvette followed by adding 1 ml diluted Dye reagent ( Bio-Rad
protein Assay Dye reagent Concentrate, diluted 1:5 with distilled water). The samples
were incubated for 5 minutes at room temperature.
Optical density at 595 nm was measured for each sample to plot the standard
curve. The standard curve for three different protein dilution buffers was plotted and
demonstrated in (Figure 2.1). DDH and ALDH concentration were measured the same as
BSA standard by adding 20 ul of the sample protein fraction into 1 ml 1:5 diluted dye
reagent followed by incubation at room temperature for 5 min and read OD595. The
protein concentration mg/ml was then calculated using the corresponding standard curve.
In many cases the OD595 for sample proteins were higher than standard curve. Samples
were diluted accordingly.

31
Figure 2.2. Standard curve presenting three different concentrations of elution buffer (imidazole): (a)500
mM, (b) 200 mM , and (c) 100 mM imidazole.
2.19. Enzyme assay
The activity of the NAD+ dependent dehydrogenases, such as dihydrodiol
dehydrogenase (DDH) and salicylaldehyde dehydrogenase can be measured
spectrophotometrically by the linear increase in A340 produced by the enzyme
preparation.
(a)
(c)
(b)

32
Due to unavailability of substrate for DDH, it was not possible to measure
enzyme activity for DDH. ALDH enzyme activity, on the other hand, was defined
spectrophotometrically observing NADH production as an increase in absorbance in 340
nm at 25 °C. Salicylaldehyde was used as the substrate for ALDH and was commercially
available (Sigma, USA). Enzyme activity for ALDH was performed
spectrophotometrically by measuring the reduction of NAD+ at 340 nm. Enzyme activity
was measured by addition of appropriate amount of enzyme to the reaction mixture and
read at OD340 in 5 min intervals over 30 min.
The standard assay mixture was 0.5 ml total volume and contained 2 mM
salicylaldehyde as a substrate (Sigma Aldrich, USA), 200 µM NAD+ (sigma Aldrich,
USA), and 80 mM sodium phosphate buffer (pH 7.4). All reactions were blanked with
distilled water and started by addition of enzyme solution. The reactions were kept at
25°C water bath after initial reading and the absorption at 340 nm was recorded in 5 min
intervals over 30 min. Three different concentrations of enzyme, 0.1, 0.5, and 1 mM,
were tested in triplicate. The assay was demonstrated by monitoring three different
reactions at the same time and condition. B1) Buffer + Substrate + NAD+ B2) Buffer +
NAD+ + ALDH E) Buffer + Substrate + NAD+ + ALDH. One unit of enzyme was
defined as the amount of enzyme needed reduced 1 µM of NAD+ per min at 25 °C.
Specific activity was expressed as units per mg of protein.
2.20. Evaluating optimum pH and optimum temperature
For determination of optimum temperature; first temperature was varied at 10 °C,
15 °C, 20 °C, 25 °C, 28 °C, 30 °C, 32 °C, 35 °C; 40 °C, 45 °C, 47 °C and 50 °C while pH

33
was constant at 7.4. All assays were performed in triplicate and as it was described
before by using 2 mM salicylaldehyde as the substrate, 200 µM NAD+, and 0.005 mg
ALDH enzyme in 500 µl total reaction volume.
For measuring optimum pH; it was varied at 5.7, 6.0, 6.2, 6.6, 6.8, 7.0, 7.4, and
7.8 while temperature was kept constant at optimum (i.e., 45 °C). All assays were
performed in triplicate and as described above by using 2 mM substrate
(salicylaldehyde), 200 µM NAD+, and 0.005 mg ALDH enzyme.
2.21. Kinetic experiments
The steady-state Kinetic parameters of ALDH were determined by varying the
concentration of salicylaldehyde at 0.5, 1.0, 1.5, 2.0 and 2.5 mM in the presence of
constant concentration of buffer (80 mM), 200 µM NAD+, and 0.005 mg of ALDH. All
assays were performed at 45 °C (optimum temperature) and pH 7.0 (optimum pH) in
triplicate. The Michaelis-Menten equation was fitted to the plots of the initial reaction
rate versus substrate concentration.
In all the assays, salicylaldehyde and NAD+ solutions were freshly made and kept
at 4 °C for up to 10 days. Aldehyde dehydrogenase enzyme was kept frozen at -80 °C for
longer periods of time and at -20 °C while it was being used. Desired concentration of the
enzyme was made by diluting appropriate amount of enzyme in distilled water. The
enzyme dilutions were made fresh for each assay and kept on ice at all times while
performing each assay.

34
2.22. Constructing the phylogenetic tree
Phylogenetic analysis based on an alignment of the BphB and PhnN of S.
paucimobilis EPA505 and related dehydrogenases obtained by the neighbor joining
approach. The tree was constructed with Mega software version 4.0.2.

35
Chapter 3: Results
3.1. Preliminary research
Construction a shotgun library for Sphingomonas paucimobilis EPA505:
A) Isolation of genomic DNA from bacterial culture
Genomic DNA of S. paucimobilis EPA505 was first extracted from an overnight
culture. (Figure 3.1). The extracted DNA confirms a band about 20 kb. The three lanes
show different concentration of isolated DNA. Samples were diluted in TE buffer. Lane
2 is the pure DNA sample (100%), lane 3 shows the 1:2 diluted DNA (50%) and Lane 4
display 1:10 dilution of extracted DNA (10%). OD260 indicated a 160 ng/µl DNA for the
original sample.
Figure 3.1. Gel electrophoresis of Sphingomonas paucimobilis chromosomal DNA. Lane 1 is 1 kb DNA ladder; Lanes 2-4 display a 20 Kb genomic DNA in three different concentration: 10, 5, and 1µl, respectively. DNA samples were diluted in TE buffer.
21,000 bp

36
B) Restriction digest of genomic DNA
Genomic DNA was digested by the restriction enzymes, BamH1, Pst1, and
HindIII and the HindIII digested DNA was used as an insert and was ligated to the
pBluescript (vector) for later experiments.
3.2. Search for dihydrodiol dehydrogenase gene (bphB) in BAC library of S.
paucimobolis EPA505
3.2.1. Background and Preliminary approaches :
The first approach was designing two overgoes (consists of two 24
oligonucleotides, derived from genomic sequence, which share eight base pairs of
complimentary sequence at their 3' ends) by using the bphB gene of Sphingomonas CHY-
1 which were then hybridized to the BAC library of EPA505. No positive clones resulted
from this hybridization.
The second approach was designing a primer using conserved regions of the bphB
gene from related microorganisms such as Sphingomonas sp CHY-1 and Sphingomonas
yanoikuyae B1. By using ClustalW software, the pbhB genes of Sphingomonas sp. strain
CHY-1 and Sphingomonas yanoikuyae strain B1 were aligned and conserved regions
were demonstrated (Figure 3.2). Two primers were obtained from Integrated DNA
Technologies (IDT, Coralville, IA). The primers used were nucleotides 262-283 (5’-
GTCGGCAATGTCGGGATCTGGG) and 751-773 (5’-
GAACGGTTCTGCTCAGCGACGG) after Sphingomonas CHY-1 bphB gene for
representing forward and reversed primers, respectively. Both primers were 22 bp in
length and were rich in GC content (14 GC pairs per primer).

37
Also, the two chosen regions had enough space between them which resulted in
enough overlapped sequences. This overlap helped to construct larger PCR fragment.
10 20 30 40 50 60
| | | | | | S.yanoik VALSARLEGQVALLTGGATGIGAAVVARYIEEGARVGVLVRDDEQAQLVRSRHGDKVAVV S.CHY1 --VTARLEGQVALLTGGATGIGEAVVARFIEEGAKVGVLVRDAXQADLVRTRHGNAVVVI ::****************** *****:*****:******* **:***:***: *.*: 70 80 90 100 110 120 | | | | | | S.yanoik AGDVRSFADNARAVAETVGAFGKLDVFVGNVGIWDFMVPLEQQDPELLEKTFDEIFDVNL S.CHY1 EGDVRNYVDNEKAVVATVAAFGKLDVFVGNVGIWDFMTPLADMEPEKLSETLDEIFGVNV ****.:.** :**. **.******************.** : :** *.:*:****.**: 130 140 150 160 170 180 | | | | | | S.yanoik KGYFFGARAAIPELRKTKGSIVFTASTSSYYTGGGGTLYVASKHAVLGLIRQLAWELTPD S.CHY1x1 KGYFLGARAAIPELRKTKGSIIFTASTSSFYTGGGGTPYVASKHAVLGLIRQLAWELTPD ****:****************:*******:******* ********************** 190 200 210 220 230 240 | | | | | | S.yanoik IRVNGVAPGGTRTPLSGTKTAGFPETKMEEMPGLDGMIAGMTPLARIAEPDDHAGLYALL S.CHY1x1 VRVNGVAPGGTRTPLGGTHAGGTADVHMEDMEGLDAMIAGMTPLARIAEPDDHSGLYALL :**************.**::.* .:.:**:* ***.*****************:****** 250 260 | | S.yanoik ASRRDSAYMTGTVLLSDGGVGIGKRPDA S.CHY1 ASRRDSAYMTGTVLLSDGGIGIGKRPGS *******************:******.:
Figure 3.2. ClustalW alignment (www.ebi.ac.uk/tools/clustalw/) showing the conserved regions of dihydrodiol dehydrogenase gene in Sphingomonas CHY-1 and Sphingomonas yanoikuyae B1.
PCR was performed by using the designed primers and EPA505 chromosomal
DNA as template, and resulted in a PCR product approximately 500 bp (Figure 3.3). The
PCR results showed that the dihydrodiol dehydrogenase gene (bphB) was detectable in
the genome of Sphingomonas paucimobilis EPA505.
Gel electrophoresis demonstrated that the PCR product was about 500 bp while
the bphB gene itself in both microorganisms was about 800 bp. This indicated that the
PCR product was a partial gene. In further studies, the PCR DNA was sequenced using
both forward and reverse primers (Figure 3.4). The length of forward and reverse
sequence of the PCR was approximately 481 bp and 480 bp, respectively.

38
Figure 3.3. Agarose gel electrophoresis. Lane 1, hindIII DNA marker; Lane 2, uncut genomic DNA of Sphingomonas paucimobilis EPA505; Lane 3; PCR fragment for dihydrodiol dehydrogenase gene (1 µl DNA template).
5’ 3’ TTGCAGTCGAGCAGCAGGATCCCAAGATTCTGGAAAGACATTCGACGAAATCTTTGACGTCAACCTGAAGGGGTATTTCTTCGGTGCGCGCGCCGCTCTCCCCGAACTGAGGAAAACCAAAGGCAGCATCGTTTTTACCGCCTCGACGTCGAGCTACTACACTGGCGGCGGCGGGACGCTGTATGTCGCATCGAAGCACGCGGTGCTTGGCCTGATCCGGCAGCTGGCCTGGGAACTGACACCCGATATCAGGGTCAATGGCGTCGCGCCGGGCGGCACCCGAACTCCGTTCAGCGGCACCAAGACTGGCGGGTTTTCCGAAACCAAGATGGAGGAGATGCCTGGCCTGGACGGAATGATCGCGGGCATGACGCCACTGGCGCGGATCGCCGAGCCGGACGATCATGCAGGTCTCTACGCGCTTTTGGCTTCGCGCCGCGATTCCGCATACATGACCGGAACGGTTCTGCTCAGCGACGGAGTTAGCGGACGCGGCGCGAGCCAAAGCGCGTAGAGACCTGCATGATCGTCCGGCTCGGCGATCCGCGCCAGTGGCGTCATGCCCGCGATCATTCCGTCCAGGCCAGGCATCTCCTCCATCTTGGTTTCGGAAAACCCGCCAGTCTTGGTGCCGCTGAACGGAGTTCGGGTGCCGCCCGGCGCGACGCCATTGACCCTGATATCGGGTGTCAGTTCCCAGGCCAGCTGCCGGATCAGGCCAAGCACCGCGTGCTTCGATGCGACATACAGCGTCCCGCCGCCGCCAGTGTAGTAGCTCGACGTCGAGGCGGTAAAAACGATGCTGCCTTTGGTTTTCCTCAGTTCGGGGAGAGCGGCGCGCGCACCGAAGAAATACCCCTTCAGGTTGACGTCAAAGATTTCGTCGAATGTCTTTTCCAGAATCTTGGGATCCTGCTGCTCGAGTGGCACCATGAAATCCCAGATCCCGACATTGCCAACA
Figure 3.4. Nucleotide sequences of PCR product for dihydrodiol dehydrogenase gene (bphB) in Sphingomonas paucimobilis EPA505.
The next step was hybridizing the PCR fragment with S. paucimobilis EPA505
BAC library to find the clones which have bphB gene. One hundred and two positive hits
were spotted from the BAC clones (Figure 3.5). Two of the positive clones (clone 02C04
500 bp

39
and 03C01) were purified using QIAGEN Plasmid Midi kit (QIAGEN, Valencia, CA)
and double digested with BamH1 and HindIII for southern blot hybridization (Figure
3.6). The results of the southern hybridization indicated that the clones contain the
dihydrodiol dehydrogenase (bphB) gene (data not shown). The clones were then Shotgun
cloned and sequenced.
Figure 3.5. Hybridization of PCR fragment and BAC library obtained one hundred two positive hits.

40
Figure 3.6. Agarose gel electrophoresis display double digestion of BAC clones; Lane 1, 1 kb DNA ladder; Lane 2 & 3, BamH1 and HindIII double digestion of clones 02C04 and clone 03C01, respectively.
3.2.2. Shotgun cloning and sequencing
Shotgun cloning and sequencing were performed at Clemson University Genomic
Institute (CUGI) by subcloning the BAC clone into pBluescript followed by selection
using blue-white screening. The white colonies were isolated and digested with BamH1
restriction enzyme. After gel electrophoresis, the larger clones were selected and further
studied.
3.2.3. Sequence analysis
The sequence analysis of shotgun clones and sequences, using Consed software,
resulted in 27 contigs. At this point it was decided to study another PAH catabolic
enzyme because of its close proximity to bphB. This enzyme was determined to be
aldehyde dehydrogenase( ALDH). After further analysis of all the contigs, both genes of
interest, i.e. dihydrodiol dehydrogenase bphB, and aldehyde dehydrogenase phnN; were
41
located on contig 26. By using Gene Mark software, the exact sequence of both genes
were identified as nucleotides 1162-2662 for the aldehyde dehydrogenase (phnN) gene
and nucleotides 2704-3504 for the dihydrodiol dehydrogenase (bphB) gene (Figure 3.7).
phnN
1162 2662
bphB 2704 3504
Figure 3.7. Nucleotide sequence cartoon of contig 26, display both phn N and bph B genes.
Comparison of the nucleotide sequence of these two genes disclose a conserved
region (AGGAGA) about 12 bp upstream of both genes which is most likely the Shine-
Dalgarno sequence (Figure 3.8).
Figure 3.8. Comparison of upstream nucleotide sequence of bphB and phnN genes.
Further analysis of the nucleotide sequences shows the start codon of our bphB
gene is TTG which is translated to the amino acid leucine (L). By using ClustalW
software, the bphB gene of EPA505 was compared to the same gene in related organisms,
and it has been observed that amino acid leucine is not a common start codon within
those related organisms such as Sphingomonas yanoikuyae B1, Sphingomonas CHY-1,
and some of Pseudomonas sp. In most of these organisms the dihydrodiol dehydrogenase
(DDH) protein sequence starts with amino acid valine (Figure 3.9).
bphB 5’-ACC.TGG TCA TTG CAG TAG AAT AGT TTT GGA AGG AGA TTT GAA TTG-3’
phnN 5’-GGT TGT CCA ACC CGT ACA ATC GGT TTG AAG AGG AGA GAG GCA ATG-3’

42
10 20 30 40 50 60 | | | | | | Sphingobium yanoikuyae B1 --------------------VALSARLEGQVALLTGGATGIGAAVVARYIE Pseudomonas putida OU83-----------------------VALSARLEGQVALLTGGATGIGAAVVARYIE Sphingomomas paucimobilis EPA505----------------LSARLEGQVALLTGGATGIGAAVVARYIE Sphingomonas CHY1 ------------------------------VTARLEGQVALLTGGATGIGEAVVARFIE Pseudomonas putida-----------------------GLTIRSL-RMKLTGEVVLITGGASGLGRALVDRFVA P.pseudoalcaligen---------------------------------MKLKGEAVLITGGASGLGRALVDRFVA Pseudomonas sp. ---------------------------------MQLNNEVALVTGGGSGLGRAIVDRFVA Sphingomonas CB3 --------------------------------VPQLDQQSVLITGGASGLGRAIVARFLA :* : .*:***.:*:* *:* *::
Figure 3.9. ClustalW alignment compares start codon of dihydrodiol dehydrogenase protein sequence in eight different related organisms.
The bphB gene of EPA505 consists of 801 bp, features a TTG start codon, and
encodes a polypeptide units of 266 amino acids which has a predicted molecular mass of
approximately 28 kD (Figure 3.10). Expasy proteomics showed that the BphB
polypeptide sequence contained more negatively charged residues (Asp + Glu) than
positively charged ones (Arg + Lys). The extinction coefficients in units of M-1 Cm-1 at
280 nm, was measured in water as 21430. Estimated half-life was measured 2 min in E.
coli, in vivo. The stability index (II) was computed to be 31.64 which classified the
protein as stable.

43
EPA505-bphB sequence
1 TTGTCTGCAAGGCTTGAAGGACAGGTTGCGCTGCTGACCGGCGGCGCAACCGGAATTGGT
L S A R L E G Q V A L L T G G A T G I G
61 GCGGCGGTGGTCGCCCGCTACATCGAAGAAGGGGCCAGGGTCGGCGTGCTCGTCCGCGAC
A A V V A R Y I E E G A R V G V L V R D
121 GACGATCAGGCCCAGCTGGTGCGTTCGCGCCACGGTGACAAGGTCACCGTGGTCGCGGGC
D D Q A Q L V R S R H G D K V T V V A G
181 GACGTCCGTTCCTTTGCAGACAATGCCCGGGCCGTTGCCGAGACTGTCGCGGCATTTGGC
D V R S F A D N A R A V A E T V A A F G
241 AAGCTGGATGTCTTTGTCGGCAATGTCGGGATCTGGGATTTCATGGTGCCACTCGAGCAG
K L D V F V G N V G I W D F M V P L E Q
301 CAGGATCCCAAGATTCTGGAAAAGACATTCGACGAAATCTTTGACGTCAACCTGAAGGGG
Q D P K I L E K T F D E I F D V N L K G
361 TATTTCTTCGGTGCGCGCGCCGCTCTCCCCGAACTGAGGAAAACCAAAGGCAGCATCGTT
Y F F G A R A A L P E L R K T K G S I V
421 TTTACCGCCTCGACGTCGAGCTACTACACTGGCGGCGGCGGGACGCTGTATGTCGCATCG
F T A S T S S Y Y T G G G G T L Y V A S
481 AAGCACGCGGTGCTTGGCCTGATCCGGCAGCTGGCCTGGGAACTGACACCCGATATCAGG
K H A V L G L I R Q L A W E L T P D I R
541 GTCAATGGCGTCGCGCCGGGCGGCACCCGAACTCCGTTCAGCGGCACCAAGACTGGCGGG
V N G V A P G G T R T P F S G T K T G G
601 TTTTCCGAAACCAAGATGGAGGAGATGCCTGGCCTGGACGGAATGATCGCGGGCATGACG
F S E T K M E E M P G L D G M I A G M T
661 CCACTGGCGCGGATCGCCGAGCCGGACGATCATGCAGGTCTCTACGCGCTTTTGGCTTCG
P L A R I A E P D D H A G L Y A L L A S
721 CGCCGCGATTCCGCATACATGACCGGAACGGTCCTGCTCAGCGACGGCGGCGTCGGCATC
R R D S A Y M T G T V L L S D G G V G I
781 GGCAAGCGTCCCGACGCCTGA
G K R P D A Figure 3.10. bphB gene sequence and corresponding polypeptide sequence in S.paucimobilis EPA505. The top line representing the nucleotide sequences while the bottom line shows the polypeptide sequence of DDH protein. The underlined sequences show the possible NAD + binding site and short-chain dehydrogenase/reductase family signature, respectively. Start codon (TTG) is shown in the box and stop codon is underlined.
Possible NAD+ binding site
Short –chain dehydrogenase/reductase family signature

44
By using clustalW software, the DDH polypeptide sequences of EPA505 were
aligned with 12 other related microorganisms. The summary of these alignment results is
presented in Table 3.1. The number of amino acids in those polypeptide sequences
ranged from 259-277. These polypeptide sequences have 18.03% identity and also
display several consensus sequences within all 12 different microorganisms which are
scattered through the BphB polypeptide sequences A short-chain dehydrogenase/
reductase family signature site have been distinguished among all 12 organisms between
polypeptide 155-185. Also there is a possible NAD+ binding site at polypeptide 25-33
(Figure 3.11).
Table 3.1. Summary of ClustalW alignment for DDH. Polypeptide sequence of related microorganisms are compared to S. paucimobilis EPA505.
Microorganism Alignment
Length
# of
residues
Identity
S. paucimobilis EPA505 266 266 266(100%) S. yanoikuyae B1 268 268 257(95.90%) P.putida OU83 268 268 257(95.90%) S. sp. CHY-1 266 266 211(79.32%) S. sp CB3 278 277 111(39.93%) P. putida F1 278 275 123(44.24%) P. putida (1) 266 259 125(46.99%) P. pseudoalcaligenes 280 277 105(37.50%) P. aerugenosa 266 261 123(46.24%) P. stutzeri 266 259 123(46.24%) P. sp. Cam-1 280 277 105(37.50%) P. sp. ND6 279 275 125(44.80%) Burkholderia sp. PS12 278 275 121(43.53%)
These polypeptides have sequence similarities with corresponding gene products
found in sphingomonads, including S. yanoikuae B1 (95.90% identity), Sphingomonas.
CHY-1 (79.32 % identity), and Sphingomonas. sp. CB3 (40 % identity). It also shows
significant similarities with dehydrogenases genetically linked to PAH catabolism in
various bacteria, such as Burkholderia PS12 (43.53 % identity) and many different
species of pseudomonads including Pseudomonas. stutzeri (46.24 % identity),

45
Pseudomonas. ND6 (44.80 % identity), P. putida F1 (44.24% identity), P. aerogenosa
(46.24 % identity), and P. alcaligenes (37.50 % identity). It is worth to note that P. putida
OU83 shows 95.90 % identity with EPA505 which is much higher than some other
Sphingomonads such as Sphingomonas. sp. CHY-1 and Sphingomonas. sp. CB3. The
accession number plus corresponding protein is demonstrated in Table 2.
Table 3.2. Presenting accession number and corresponding protein for DDH by Using Clustal W alignment
for paucimobilis EPA505.
Microorganism
(abbreviated name)
Microorganism
(Full name)
Protein Accession #
S. yanoikuyae B1 Sphingobium yanoikuyae B1 Putative 1,2-dihydrodiol-1,2 dihydroxy dehydrogenase
ABM79802.1
P.putida OU83 Pseudomonas putida OU83 Putative 1,2-dihydrodiol-1,2 dihydroxy dehydrogenase
ABM79802.1
S. sp. CHY-1 Sphingomonas sp. CHY-1 Dihydrodiol dehydrogenase CAJ76313.1 S. sp CB3 Sphingomonas sp. CB3 dihydrogenase AAC38620.1 P. putida F1 Pseudomonas putida F1 2,3 dihydroxy-2,3 dihydrophenyl
propionate YP001268192
P. putida (1) Pseudomonas putida dehydrogenase BAA20393.1 P. pseudoalcaligenes Pseudomonas pseudoalcaligenes dioxygenase AAA25748.1 P. aerugenosa Pseudomonas aerugenosa dehydrogenase BAA12242.1 P. stutzeri Pseudomonas stutzeri cis-dihydrodiol naphthalene
dehydrogenase AAD02138.1
P. sp. Cam-1 Pseudomonas sp. Cam-1 cis-2,3-dihydroxy-2,3-dihydrophenyl dehydrogenase
AAK14786.1
P. sp. ND6 Pseudomonas sp. ND6 2,3-dihydroxy-2,3 dihydrophenylpropionate dehydrogenase
NP943190.1
Burkholderia sp. PS12 Burkholderia sp. PS12 cis-chlorobenzene dihydrodiol dehydrogenase
AAC46395.1

46
10 20 30 40 50 60 | | | | | | Pseudomonas_putida_OU83 -----------VALSARLEGQVALLTGGATGIGAAVVARYIEEGARVGVLVRDDEQAQLV Sphingobium_yanoikuyae_B1 -----------VALSARLEGQVALLTGGATGIGAAVVARYIEEGARVGVLVRDDEQAQLV Sphingomonas_paucimobilis_EPA5 -------------LSARLEGQVALLTGGATGIGAAVVARYIEEGARVGVLVRDDDQAQLV Sphingomonas_sp_CHY_1 -------------MTARLEGQVALLTGGATGIGEAVVARFIEEGAKVGVLVRDAAQADLV Pseudomonas_putida ----------------MGNQQVVSITGAGSGIGLELVRSFKSAGYCVSALVRNEEQEALL Pseudomonas_sp_ND6 MVTATAVTINQRECTCMGNQQVVSITGAGSGIGLELVRSFKSAGYYVSALVRNEEQEALL Pseudomonas_aeruginosa --------------MCMSNQQVVSITGAGSGIGLELVRSFKSAGYCVSALVQNEEQKASL Pseudomonas_stutzeri ----------------MSNQQVVSITGAGSGIGLALVRSFKSAGYCVSALVQNEEQKASL Pseudomonas_pseudoalcaligenes ---------------MKLKGEAVLITGGASGLGRALVDRFVAEGAKVAVLDKSAERLAEL Pseudomonas_sp_Cam_1 ---------------MKLKGEAVLITGGASGLGRALVDRFVAEGAKVAVLDKSAERLAEL Burkholderia_sp_PS12 ---------------MKLKGEVALVTGGGAGLGRAIVDRYVAEGARVAVLDKSAAGLEEI Pseudomonas_putida_F1 ---------------MRLEGEVALVTGGGAGLGRAIVDRYVAEGARVAVLDKSAAGLEAL Sphingomonas_sp_CB3 --------------MPQLDQQSVLITGGASGLGRAIVARFLAEGAHVTILDRNADALAEM . : . :**..:*:* :* : * * * :. : 70 80 90 100 110 120 | | | | | | Pseudomonas_putida_OU83 RSRHGDKVAVVAGDVRSFADNARAVAETVGAFGKLDVFVGNVGIWDFMVPLEQQDPELLE Sphingobium_yanoikuyae_B1 RSRHGDKVAVVAGDVRSFADNARAVAETVGAFGKLDVFVGNVGIWDFMVPLEQQDPELLE Sphingomonas_paucimobilis_EPA5 RSRHGDKVTVVAGDVRSFADNARAVAETVAAFGKLDVFVGNVGIWDFMVPLEQQDPKILE Sphingomonas_sp_CHY_1 RTRHGNAVVVIEGDVRNYVDNEKAVVATVAAFGKLDVFVGNVGIWDFMTPLADMEPEKLS Pseudomonas_putida CNEFKDALEIVVGDVRDHAINEKLIKQTIARFGHLDCFIANAGIWDYMLSIEEP-WEKIS Pseudomonas_sp_ND6 CKEFKDALEIVVGDVRDHATNEKLIKQTIDRFGHLDCFIANAGIWDYMLSIEEP-WEKIS Pseudomonas_aeruginosa CNEFKDALEIVVGDVRDHATNEKLIKQTTDRFGHLDCFIANAGIWDYMLGIEEP-WEKIS Pseudomonas_stutzeri CNEFKDALEIVVGDVRDHATNEKLIKQTTDRFGHLDCFIANAGIWDYMLGIEEP-WEKIS Pseudomonas_pseudoalcaligenes ETDHGDNVLGIVGDVRSLEDQKQAASRCVARFGKIDTLIPNAGIWDYSTALVDLPEESLD Pseudomonas_sp_Cam_1 ETDHGDNVLGIVGDVRSLEDQKQAASRCVARFGKIDTLIPNAGIWDYSTALVDLPEESLD Burkholderia_sp_PS12 RKRHGDAVVGIEGDVRSLDSHREAVARCVETFGKLDCLIGNAGVWDYQTQLADIPDNGIS Pseudomonas_putida_F1 RKLHGDAIVGVEGDVRSLDSHREAVARCVEAFGKLDCLVGNAGVWDYLTQLVDIPDDLIS Sphingomonas_sp_CB3 EREYEGRVAGLIGDVRSLAANEAAVSLACDRFGKLDCLIANAGIWDYDVSLVDLPASAID . . : : ****. : **::* :: *.*:**: : : . :. 130 140 150 160 170 180 | | | | | | Pseudomonas_putida_OU83 KTFDEIFDVNLKGYFFGARAAIPELRKTKGSIVFTASTSSYYTGGGGTLYVASKHAVLGL Sphingobium_yanoikuyae_B1 KTFDEIFDVNLKGYFFGARAAIPELRKTKGSIVFTASTSSYYTGGGGTLYVASKHAVLGL Sphingomonas_paucimobilis_EPA5 KTFDEIFDVNLKGYFFGARAALPELRKTKGSIVFTASTSSYYTGGGGTLYVASKHAVLGL Sphingomonas_sp_CHY_1 ETLDEIFGVNVKGYFLGARAAIPELRKTKGSIIFTASTSSFYTGGGGTPYVASKHAVLGL Pseudomonas_putida SSFDEIFDINVKSYFSGISAALPELKKTNGSVVMTASVSSHAVGGGGSCYIASKHAVLGM Pseudomonas_sp_ND6 SSFDEIFDINVKSYFSGISAALPELKKTNGSVVMTASVSSHAVGGGGSCYIASKHAVLGM Pseudomonas_aeruginosa SSFDEIFNINVKSYFSGIRAALQELKKTSGSVVMTASVSSHAVGAGGSCYIASKHAVLGM Pseudomonas_stutzeri SSFDEIFNINVKSYFSGIRAALQELKKTSGSVVMTASVSSHAVGAGGSCYIASKHAVLGM Pseudomonas_pseudoalcaligenes AAFDEVFHINVKGYIHAVKACLPALVASRGNVIFTISNAGFYPNGGGPLYTAAKHAIVGL Pseudomonas_sp_Cam_1 AAFDEVFHINVKGYIHAVKACLPALVASRGNVIFTISNAGFYPNGGGPLYTAAKHAIVGL Burkholderia_sp_PS12 EAFDEMFAIIVKGYILAAKAALPALYKSKGSAIFTVSNAGFYPGGGGVLYTAGKHAVIGL Pseudomonas_putida_F1 EAFEEMFEVNVKGYILAAKAALPALYQSKGSAIFTVSNAGFYPGGGGVLYTAGKHAVIGL Sphingomonas_sp_CB3 AAFDELFSINTKGSLLAMKAATPALVRATGSIILTLSNAAFYPGGGGMLYTASKHANLGL :::*:* : *. : . *. * : *. ::* * :.. ..** * *.*** :*: 190 200 210 220 230 240 | | | | | | Pseudomonas_putida_OU83 IRQLAWELTPDIRVNGVAPGGTR-TPLSGTKTAGFPETKMEEMPGLDGMIAGMTPLARIA Sphingobium_yanoikuyae_B1 IRQLAWELTPDIRVNGVAPGGTR-TPLSGTKTAGFPETKMEEMPGLDGMIAGMTPLARIA Sphingomonas_paucimobilis_EPA5 IRQLAWELTPDIRVNGVAPGGTR-TPFSGTKTGGFSETKMEEMPGLDGMIAGMTPLARIA Sphingomonas_sp_CHY_1 IRQLAWELTPDVRVNGVAPGGTR-TPLGGTHAGGTADVHMEDMEGLDAMIAGMTPLARIA Pseudomonas_putida VKALAYELAPEIRVNAVSPGGTV-TSLCGPASAGFDKMHMKDMPGIDDMIKGLTPLGFAA Pseudomonas_sp_ND6 VKALAYELAPEVRVNAVSPGGTV-TSLCGPASAGFDKMHMKDMPGIDDMIKGLTPLGFAA Pseudomonas_aeruginosa MKALAYELAPHIRVNAVAPGGTV-TPLSGPASAGFDKTHMENMPGIEDMIKGLTPLGISA Pseudomonas_stutzeri MKALAYELAPHIRVNAVAPGGTV-TSLCGPASAGFDKTHMENMPGIEDMIKGLTPLGFAA Pseudomonas_pseudoalcaligenes VRELAFELAPYVRVNGVGPGGIN-SDMRGPSSLGMGSKAI-STVPLADMLKSVLPIGRMP Pseudomonas_sp_Cam_1 VRELAFELAPYVRVNGVGPGGIN-SDLRGPSSLGMGSKAI-STVPLADMLKSVLPIGRMP Burkholderia_sp_PS12 VKQLAHEWGPRIRVNGIAPGGILGSDIRGLKTLGLQDQTI-ATMPLADMLGPVLPTGRVA Pseudomonas_putida_F1 IKQLAHEWGPRIRVNGIAPGGILGSDLRGLKSLDLQDKSI-STFPLDDMLKSVLPTGRAA Sphingomonas_sp_CB3 MRQAAYELAPSVRVNAVAPGAIA-TNLRGLATLGQDKRAIGSDLPLEEYLKVGVPLARLP :: * * * :***.:.**. : : * : . . : : : * . . 250 260 270 280 290 | | | | | Pseudomonas_putida_OU83 EPDDHAGLYALLASRRDSAYMTGTVLLSDGGVGIGKRPDA-------------- Sphingobium_yanoikuyae_B1 EPDDHAGLYALLASRRDSAYMTGTVLLSDGGVGIGKRPDA-------------- Sphingomonas_paucimobilis_EPA5 EPDDHAGLYALLASRRDSAYMTGTVLLSDGGVGIGKRPDA-------------- Sphingomonas_sp_CHY_1 EPDDHSGLYALLASRRDSAYMTGTVLLSDGGIGIGKRPGS-------------- Pseudomonas_putida KPEDVVEPYLLLASRKQGKFITGTVISIDGGMALGRK----------------- Pseudomonas_sp_ND6 KPEDVVAPYLLLASRKQGKFITGTVISIDGGMALGRK----------------- Pseudomonas_aeruginosa KAEDVVAPYLLLASRDQGKFITGTVINIDGGMALGRK----------------- Pseudomonas_stutzeri KAEDVVAPYLLLASRDQGKFITGTVINIDGGMALGRK----------------- Pseudomonas_pseudoalcaligenes EVEEYTGAYVFFATRGDAAPATGALLNYDGGLGVRGFFSGAGGNDLLEQLNIHP Pseudomonas_sp_Cam_1 EVEEYTGAYVFFATRGDAAPATGALLNYDGGLGVRGFFSGAGGNDLLEQLNIHP Burkholderia_sp_PS12 TAEEYAGAYVFFATRADTVPLTGSVLNIDGGMGVRGLFEASLGAQLDKHFA--- Pseudomonas_putida_F1 TAEEYAGAYVFFATRGDTVPLTGSVLNFDGGMGVRGLFEASLGAQLDKHFG--- Sphingomonas_sp_CB3 DVAEFTGAYVLLASRKDGAVATGAVIQIDGGIGVRGLAGVSGGTSLAERFAE-- : * ::*:* : **::: ***:.:
Figure 3.11. ClustalW protein alignment of DDH. Polypeptide sequence of 12 different microorganisms are compared to S. paucimobilis EPA505 protein sequence. Eight conserved regions among all 13 microorganisms are shown in boxes. Possible NAD+ binding site is labeled at polypeptide 25-33 and a short-chain dehydrogenase/reductase family signature is shown at polypeptide 155-185.
Short-chain dehydrogenase/reductase family signature
Possible NAD binding site

47
Phylogenetic and molecular evolutionary analyses were conducted using MEGA version
4.0.2 (131) and by using neighbor-joining tree. It compares 13 bacterial dihydrodiol
dehydrogenase. It shows a close relationship among three Sphingomanads species. The
Accession numbers for all the organisms used at the tree are classified in Table 2.
Figure 3.12. Phylogenetic analysis based on an alignment of the BphB of S. paucimobilis EPA505 and related dehydrogenases obtained by the neighbor joining approach. The tree was constructed with Mega software version 4.0.2. The scale bars represent 0.1 substitution per site.
The phnN gene of EPA505 consists of 1500 bp, features a ATG start codon,
encodes a polypeptide consist of 499 amino acids (Figure 3.13), and having a predicted
molecular mass of approximately 55 kD. Using Expasy proteomics revealed that the
PhnN similar to BphB enzyme has more negatively charged residues that positive ones
(56 compare to 44). The extinction coefficients was measured 5130 at 280 nm in water.
Estimated half life is 10 hours in E. coli, in vivo. Stability index (II) is computed to be
34.12 which classified the protein as stable.

48
The PhnN of EPA505 was aligned with 22 other related proteins, using ClustalW
software (Figure 3.14), and show 17.18% identity among all of them shown in Table 3.3.
It shows significant similarities with aldehyde dehydrogenase of other genetically related
sphingomonads, such as Sphingomonas yanoikuyae B1 (97.39%), Sphingomonas sp.
14DN-61 (96.99%), Sphingomonas xenophage (91.98%), Nonosphingobium
aromaticivorance (90%), and Sphingomonas chungbukensis (87.62%). This phnN show
less identity with some Sphingomonads such as S. wittichii RW1 (43%) and
Sphingomonas. sp. SKA58 (44%). It also displays the same range of identity (40-47%)
with phnN in other microorganisms such as Psuedomonas putida, P. aerugenosa,
Azotobacter vinelandii. The phylogenetic tree of EPA505 for PhnN is also shown in
Figure 3.15.
Methionine appeared to be the start codon for all of the polypeptide sequences in
phnN gene. The polypeptides ranged from 487-506 amino acids in size while
demonstrating a few consensus regions. One major consensus region appears to be
between amino acids 160 through 200. There are three more minor consensus region
scattered through the whole polypeptide sequence (Figure 3.14). The possible NAD+
binding site along with aldehyde dehydrogenase cystein active site and aldehyde
dehydrogenase glutamic acid active site are remarked on Figure 3.14. It is note worthy
that those mentioned active sites is similar among all 12 different organisms. This proves
that BphB isolated from S. paucimobilis has some homology to other BphB enzymes in
related organisms.

49
ATGGCTACCCAACTGAAGAGCACGGAAAACGAATACGGCATCAAGCCGGAATACGGACAC M A T Q L K S T E N E Y G I K P E Y G H TTCATTGGCGGTGAATGGGTTTCGGGCGACAGCGGCAAGACGATCGACCTGATCAACCCG F I G G E W V S G D S G K T I D L I N P GCGACCGGGGCGGTGCTCACCAAGATCCAGGCCGGCAACGCCAAGGACATCCAGCGCGCG A T G A V L T K I Q A G N A K D I Q R A GTCGCAGCGGCCAAGGCCGCCTTCCCGAAGTGGTCGGAAAGCTCGCCCGCCGAACGTCAG V A A A K A A F P K W S E S S P A E R Q GAAATCCTGATCGAGGTCGCCCGCCGGCTCAAGGCACGCCACCAGCACTACGCCACGCTC E I L I E V A R R L K A R H Q H Y A T L GAAACCCTGAACAACGGCAAGCCGATCCGCGAATCGATGCACTTCGACATGCCGCAGGCG E T L N N G K P I R E S M H F D M P Q A ATCGGCCAGTTCGAAGTGTTCGCCGGCGCGGCCTATGGTCTGCACGGCCAGGCGCTGGAC I G Q F E V F A G A A Y G L H G Q A L D TTTCCCGACGCGATCGGCATCGTTCACCGCGAGCCGCTGGGGGTCTGTGCGCAGATCATT F P D A I G I V H R E P L G V C A Q I I CCGTGGAACGTTCCGATCCTGATGATGGCCTGCAAGATCGCGCCAGCCCTGGCTTCAGGC P W N V P I L M M A C K I A P A L A S G AACACGGTGGTGCTCAAGCCCGCGGAAACCGTCTGCCTTTCGGTTATCGAATTCTTCGTC N T V V L K P A E T V C L S V I E F F V GAAATGGCCGACCTTCTGCCCCCGGGCGTAATCAACGTCGTGACCGGTTACGGCGCCGAC E M A D L L P P G V I N V V T G Y G A D GTCGGTGAAGCGCTGGTGACCCACGAGGATGTCCGCAAGGTCGCGTTCACCGGTTCGGTG V G E A L V T H E D V R K V A F T G S V GCGACGGCTCGCCGGATCATCCAGTATGCTTCCTCGAACATCATTCCCCAGACTCTGGAA A T A R R I I Q Y A S S N I I P Q T L E TTGGGCGGCAAGTCGGCGCACATCGTTTGCGCGGATGCCGATATCGATGCGGCAGTGGAG L G G K S A H I V C A D A D I D A A V E AGCGCCACGATGTCGACGGTGCTGAACAAGGGTGAGGTCTGCCTGGCCGGTTCGCGGCTG S A T M S T V L N K G E V C L A G S R L TTCCTGCACCAATCGATCCAGGACGAGTTCCTCGCCAAGTTCAAGGAAGCTCTTGAAGGC F L H Q S I Q D E F L A K F K E A L E G ATCCGGCAGGGGGATCCGCTCGACTTCGGCACCCAACTCGGCGCGCAGGCTTCGCAGATG I R Q G D P L D F G T Q L G A Q A S Q M CAGATGGACAAGGTCCAGAGCTATCTCCAGCTGGCCACCGAGGAAGGCGCGACCGTCCTT Q M D K V Q S Y L Q L A T E E G A T V L ACCGGCGGCAGCCGGAACGATAGCTTGGCCGACGGGCATTTCATCAAGCCCACGGTCTTC T G G S R N D S L A D G H F I K P T V F ACCAATGTCAGCAACTCGATGCGCATCGCTCGCGAGGAAATCTTCGGCCCTGTCACCAGC T N V S N S M R I A R E E I F G P V T S GTGCTGACCTGGAACGACGAAGACGATATGATGGCGCTGGCGAATGACACGACCTATGGC V L T W N D E D D M M A L A N D T T Y G CTGGCCGGCGGCGTCTGGACCAAGGACATCGCCCGCGCGCACCGGATTGCCCGCAAGCTC L A G G V W T K D I A R A H R I A R K L GAAACCGGAACGGTGTGGATCAACCGTTACTACAACCTCAAGCCCAACATGCCGCTGGGC E T G T V W I N R Y Y N L K P N M P L G GGATACAAGCAGAGCGGTTTCGGTCGTGAATTCAGCCATGAGGTGCTGAACCACTACACG G Y K Q S G F G R E F S H E V L N H Y T CAGACCAAGTCGGTTATCGTCAATCTGCAGGAAGGGCGCGTGGGGATGTTCGACCAGTAA Q T K S V I V N L Q E G R V G M F D Q Figure 3.13. phnN gene sequence and its corresponding polypeptide sequence in S.paucimobilis EPA505. The nucleotides is composed of approximately 1500 bp which encodes 499 amino-acids. NAD+ binding site is marked with one single line, glutamic acid active site is marked with one thick line and cystein active site is marked with double lines. Start codon (ATG) is in a box and the Stop codon is underlined.

50
130 140 150 160 170 180 190 200 210 220 230 240 | | | | | | | | | | | | P.putida KT2440 LNADIPLAVDHFRYFAGCIRAQEGGAAEINEGTVAYHIHEPLGVVGQIIPWNFPILMAAWKLAPALAAGNCVVLKPAEQTPLGITVLLEVIGDL-LPPGVLNVVQGYGREAGEALATSKR P.putidaGB1 LNADIPLAVDHFRYFAGCIRAQEGGAAEINEGTVAYHIHEPLGVVGQIIPWNFPILMAAWKLAPALAAGNCVVLKPAEQTPLGITVLLEVIGDL-LPPGVLNVVQGYGREAGEALATSKR P.putidaF1 LNADIPLAVDHFRYFAGCIRAQEGGAAEINEGTVAYHIHEPLGVVGQIIPWNFPILMAAWKLAPALAAGNCVVLKPAEQTPLGITVLLEVIGDL-LPPGVLNVVQGYGREAGEALATSKR P.putidaW619 LNADIPLAVDHFRYFAGCIRAQEGGAAEINENTVAYHIHEPLGVVGQIIPWNFPILMAAWKLAPALAAGNCVVLKPAEQTPLGITVLVELIGDL-LPPGVLNVVQGYGREAGEALATSKR P.entomophila LNADIPLAVDHFRYFAGCIRAQEGGAAEINENTVAYHIHEPLGVVGQIIPWNFPLLMAAWKLAPALAAGNCVVLKPAEQTPLGITVLLELIGDL-LPKGVLNVVQGYGREAGEALATSKR P.aeruginosa UCBPLNADIPLAADHFRYFAGCIRAQEGSAAEINDSTVAYHIHEPLGVVGQIIPWNFPLLMAAWKLAPALAAGNCVVLKPAEQTPLGICVLLELIGDL-LPPGVLNVVQGFGREAGEALATSKR P.aeruginosa PA7 LNADIPLAADHFRYFAGCIRAQEGSAAEINDSTVAYHIHEPLGVVGQIIPWNFPLLMAAWKLAPALAAGNCVVLKPAEQTPLGICVLLELVGDL-LPPGVLNVVQGFGREAGEALATSKR P.aeruginosa PAO1LNADIPLAADHFRYFAGCIRAQEGSAAEINDSTVAYHIHEPLGVVGQIIPWNFPLLMAAWKLAPALAAGNCVVLKPAEQTPLGICVLLELIGDL-LPPGVLNVVQGFGREAGEALATSKR P.mendocina ymp LNADVPLAADHFRYFAGCIRAQEGSTAEINDGTVAYHFHEPLGVVGQIIPWNFPLLMAAWKLAPALAAGNCIVLKPAEQTPLSITLLVEIIGDL-LPPGVLNIVQGFGREAGEALATSKR S.SKA58-1 THADIPLAIDHFRYFAGCLRAQEGSIAEIDHDTIAYHFHEPLGVVGQIIPWNFPILMAVWKLAPALAAGNCVVLKPAEQTPMSVMVLMEVIGDL-LPSGVLNIVNGFGVEAGKPLASNKR S.wittichii RW1 TAADIPLAIDHFRYFAACARAQEGSIAEIDHDTVAYHFHEPLGVVGQIIPWNFPILMAAWKLAPALAAGNCVVLKPAEQTPMSIMVLMELVGDL-IPEGVLNVVNGFGVEAGKPLASNKR S.SKA58-2 RAADVPLAIDHFRYFAGCIRAEEGGISTIDADTIAYHFREPLGVVGQIIPWNFPLLMAAWKIAPALAAGNCTVIKPASQTPLTLLMFAELTADI-LPPGVLNVVTGPGRTVGQAIAANPR Sphingopyxis ala RTADVPLAIDHFRYFAGCIRAEEGAISTIDADTIAYHFREPLGVVGQIIPWNFPLLMAAWKIAPALAAGNCTVIKPASQTPLTLLMFAELTADI-LPPGVFNVVTGPGRTVGQAIAANPR P.putida KT2440 RSVDIPLAIDHFRYFAGVIRSQSDEAVMLDEQTLSIALSEPLGVVGQVIPWNFPLLMAAWKIAPAIAAGNTVVIKPSELTPVTILELAKIFAKV-LPAGVVNIVTGLGTTVGQALLDHPD Azotobacter vine SSVDIPLAIDHFRYFAGVIRSHSDEAVMLDEQTLSIVLSEPLGVVGQVIPWNFPLLMAAWKIAPAIAIGNTVVIKPSELTPVSILELAKIFAQV-LPAGVVNIVTGTGASAGQALLDHPD Novosphing. aro MYFDMPQTIGQFELFAGAAYGLHGQTLDYPD-AIGIVHREPLGVCAQIIPWNVPMLMMACKIAPALASGNTVVLKPAETVCLSVIEFFVEMADL-LPPGVINVVTGYGADVGEALVTS S.chungbukensis MFFDMTQTIGQFELFAGAAYGLHGQTLDYPD-AIGIVHREPLGVCAQIIPWNVPMLMMACKIAPALASGNTVVLKPAETVCLSVIEFFVEMADL-LPPGVINVVTGYGADVGEALVTSPD S.14DN-61 MYFDMPQAISQFEVFAGAAYGLHGQTLDYPD-AIGIVHREPLGVCAQIIPWNVPILMMACKIAPALASGNTVVLKPAETVCLSVIEFFVEMADL-LPPGVINVVTGYGADVGEALVTHED Sphingobium yano MYFDMPQAISQFEVFAGAAYGLHGQTLDYPD-AIGIVHREPLGVCAQIIPWNVPILMMACKIAPALASGNTVVLKPAETVCLSVIEFFVEMADL-LPPGVINVVTGYGADVGEALVTHED S.pauc.EPA505 MHFDMPQAIGQFEVFAGAAYGLHGQALDFPD-AIGIVHREPLGVCAQIIPWNVPILMMACKIAPALASGNTVVLKPAETVCLSVIEFFVEMADL-LPPGVINVVTGYGADVGEALVTHED S.xenophaga MHFDMPQAIGQFELFAGAAYGLHGQTMDYPD-AVGIVHREPLGVCAQIIPWNVPMLMMACKIAPALASGNTVVLKPAETVCLSVIEFFVEMADL-LPPGVINVVTGYGADVGEALVTHED Sphingwittichi RNFAA-RLSTVFEYYAGWCTKIYGDTYPSSDQHFNYTIREPVGVCGQIIPWNGPMMMAAWKIAPAIACGNTVVLKPAEQTPLTAIRMGELLLEAGLPDGVVNILTGYGRVAGEALVNHPG P.fluorescens RILDVPRTAACFRYFGGIADKIEGKVIPVDAGFLNYVQRKPIGVVGQIVPWNFPLMFTSWKMGPALAAGNTVVLKPSELTPLSTLRIAELMKEVGFPNGVVNIVPGYGHTAGQRLAEHPD *. :.. . . :*:** .*::*** *::: *:.**:* ** *:**:. . : : . :* **.*:: * * .*: : 250 260 270 280 290 300 310 320 330 340 350 360 | | | | | | | | | P.putida KT2440 IAKIAFTGSTPVGSHIMKCAAENIIPSTVELGGKSPNVYFEDIMQAEPSFIEKAAEGMVL AFF-NQGEVCTCPSRALVQESIYPQFMEVVMKKVLQIKRGDPLDTDTMVGAQASQQQFEK P.putida GB1 IAKIAFTGSTPVGSHIMKCAAENIIPSTVELGGKSPNVYFEDIMQAEPSFIEKAAEGMVL AFF-NQGEVCTCPSRALVQESIYPQFMEVVMKKVLQIKRGDPLDTDTMVGAQASQQQFEK P.putida F1 IAKIAFTGSTPVGSHIMKCAAENIIPSTVELGGKSPNVYFEDIMQAEPSFIEKAAEGMVL AFF-NQGEVCTCPSRALVQESIYPQFMEVVMKKVLQIKRGDPLDTDTMVGAQASQQQFEK P.putida W619 IAKIAFTGSTPVGSHIMKCAAENIIPSTVELGGKSPNVYFEDIMQAEPSFIDKAAEGMVL AFF-NQGEVCTCPSRALVQESIYPQFMEVVMKKVLQIKRGDPLDTDTMVGAQASQQQFEK P.entomophila IAKIAFTGSTPVGAHIMKCAAENIIPSTVELGGKSPNVYFEDIMQAEPAFIDKAAEGMVL AFF-NQGEVCTCPSRALVQESIYPQFMEVVMKKVLQIKRGDPLDTDTMVGAQASQQQFEK P.aeruginosa UCBPIAKIAFTGSTPVGSHILKCAAENIIPSTVELGGKSPNIYFEDIMQAEPAFIEKAAEGLVL AFF-NQGEVCTCPSRALVQESIYPAFMEEVLKKVRAIKRGDPLDTETMVGAQASQQQYEK P.aeruginosa PA7 IAKIAFTGSTPVGSHILKCAAENIIPSTVELGGKSPNIYFEDIMQAEPAFIEKAAEGLVL AFF-NQGEVCTCPSRALVQESIYPAFMEEVLKKVRAIKRGDPLDTETMVGAQASQQQYEK P.aeruginosa PAO1IAKIAFTGSTPVGSHILKCAAENIIPSTVELGGKSPNIYFEDIMQAEPAFIEKAAEGLVL AFF-NQGEVCTCPSRALVQESIYPAFMEEVLKKVRAIKRGDPLDTETMVGAQASQQQYEK P.mendocina ymp IAKIAFTGSTPVGSHILKCAAENIIPSTVELGGKSPNIFFADIMNAEPAFIEKAAEGLVL GFF-NQGEVCTCPSRALVQESIYDAFMAEVMKKVKQIKRGNPLDTETMVGAQASQQQFDK S.SKA58-1 ISKIAFTGETTTGRLIMQYASENLIPVTLELGGKSPNIFFEDVMDADDDYFDKCLEGFAM FAL-NQGEVCTCPSRALIQESIYDRFIARAVERVKAIRQGSPLDPATMIGAQASNDQLEK S.wittichii RW1 ISKIAFTGETTTGRLIMQYASENLIPVTLELGGKSPNIFFADVMDADDDYFDKCLEGFAM FAL-NQGEVCTCPSRALVQESIYERFIERAVARVGKIRQGSPLDPATMIGAQASNDQLEK S.SKA58-2 IAKVSFTGETVTGKQIMHAAADHLIPQTMELGGKSPNIFMADVLDEDDAFFDKALEGFTL FAF-NKGEVCTCPSRALIHESIFDRFIERAVARVAAIRQGDPLDPSVQVGAQASEDQLHK Sphingopyxis ala IAKVSFTGETVTGKQIMHAAADHLIPQTMELGGKSPNIFMADVLDEEDAFFDKALEGFTL FAF-NKGEVCTCPSRALIHESIFDRFIERAVARVTAIRQGDPLDPSVQIGAQASEDQLHK P.putida KT2440 LRKLAFTGSTRVGELVANAAAKKIIPATLELGGKSANIVFPDAN------WDKAVEGAVL AILWNQGQVCESGARLFVHESIYERFLAELKHKFEAVRVGDPLNPDTMMGAQVSKTQMER Azotobacter vine VRKLAFTGSTSVGHRVADAAAKKLIPATLELGGKSANIVFPDAN------WDKAVEGAAL AILWNQGQVCESGARLFVHESIYERFLDEVKQKFEAVRVGDPLHPDTMMGAQVSKTQMER Novosphing.aro VAKVAFTGSIATARRIIQYASANIIPQTLELGGKSAHIVCGDAD------IDAAVESATM STVLNKGEVCLAGSRLFLHQSIQDEFLAKFKTALEGIRQGDPLDMATQLGAQASKMQFDK S.chungbukensis VAKVAFTGSIATARRIIQYASANIIPQTLELGGKSAHIVCGDAD------IDAAVESATM STVLNKGEVCLAGSRLFLHQSIQDEFLAKFKTALEGIRQGDPLDMATQLGAQASKMQFDK S.sp.14DN-61 VRKVAFTGSVATARRIIQYASSNIIPQTLELGGKSAHIVCADAD------IDAAVESATM STVFNKGEVCLAGSRLFLHQSIQDEFLAKFKVALEGIRQGDPLDFATQLGAQASQMQMDK Sphingobium yanoiVRKVAFTGSVATARRIIQYASSNIIPQTLELGGKSAHIVCADAD------IDAAVESATM STVLNKGEVCLAGSRLFLHQSIQDEFLAKFKVALEGIRQGDPLDFGTQLGAQASQMQMDK S.pauc.EPA505 VRKVAFTGSVATARRIIQYASSNIIPQTLELGGKSAHIVCADAD------IDAAVESATM STVLNKGEVCLAGSRLFLHQSIQDEFLAKFKEALEGIRQGDPLDFGTQLGAQASQMQMDK S.xenophaga VRKVAFTGSVGTARRIMQYASTNIIPQTLELGGKSAHIVCADAD------IDAAVESATM STVLNKGEVCLAGSRLFLHESIQDEFLAKFKVALEGIRQGDPLDFATQLGAQASQMQMDK S.wittich RW1 VNKIAFTGSTEVGKHILASSARDLKRVTLELGGKSPNIVFDDAD------IDLAVAGAMR AFCTNSGQVCVAGSRLFVQRGIHDEFLEKLSAAVAQHRVGDPFDTATTMGPLVSEAQFTR P.fluorescens VGKIAFTGSTATGRRIVEASQGNLKRVQLELGGKGANIVFEDAN------LEAAVNGAAW AIFHNQGQACIAGSRLLLQESIADEFLERFVSLARSIRLGDPLDGTTEMGPLTSALHRDR : *::***. .. : : .: :*****..:: * : . . *.*:.* . :* :::..* *: : *.*:. . :*. .* : : 490 500 | | | P.putida KT2440 YKKSGVGRETHKMMLDHYQQTKNLLVSYDINPLGFF-- P.putida GB1 YKKSGVGRETHKMMLDHYQQTKNLLVSYDINPLGFF-- P.putida F1 YKKSGVGRETHKMMLDHYQQTKNLLVSYDINPLGFF-- P.putida W619 YKKSGVGRETHKMMLDHYQQTKNLLVSYDINPLGFF-- P.entomophila YKKSGVGRETHKMMLDHYQQTKNLLVSYDINPLGFF-- P.aeruginosa UCB YKKSGVGRETHKMMLDHYQQTKNLLVSYDIDPLGFF-- P.aeruginos PA7 YKKSGVGRETHKMMLDHYQQTKNLLVSYDIDPLGFF-- P.aeruginosa PAO1 YKKSGVGRETHKMMLDHYQQTKNLLVSYDINPLGFF-- P.mendocina ymp YKKSGVGRETHKMMLDHYQQTKNLLVSYDINPLGFF-- S.SKA58-1 YKQSGIGRETHKMMLDHYQQTKNLLVSYSPKALGFF-- S.wittichii RW1 YKQSGIGRENHKMMLDHYQQTKNLLVSYSPKALGFF-- S.SKA58-2 YKASGFGRENHRMMLDHYQQTKNLLVSYDEHALGLF-- Sphingopyxis ala YKASGFGRENHKMMLDHYQQTKNLLVSYDEHALGLF-- P.putida KT2440 YKKSGLGRETHKSMLEAYSQKKNIYVSLNEAPLGLF-- Azotobacter vine YKKSGLGRETHKSILEAYSQKKNIYVSLNEAPLGLF-- Novosphing.aro YKQSGFGREFSHEVLNHYTQTKSVVVNLQEGRTGMFDQ S.chungbukensis YKQNGFGREFSHEVLNHYTQTKSVVVNLQEGRVGMFDQ S.sp.14DN-61 YKQSGFGREFSHEVLHHYTQTKSVVINLQEGRVGMFDQ Sphingobium yanoi YKQSGFGREFSHEVLHHYTQTKSVVINLQEGRVGMFDQ S.pauc.EPA505 YKQSGFGREFSHEVLNHYTQTKSVIVNLQEGRVGMFDQ S.xenophaga YKQSGFGREFSHEVLNHYTQTKSVVVNLQEGRTGMFDQ S.wittichii RW1 YKQSGLGRELGRQSVEAYTESKTIWINTPG-------- P.fluorescens LGQSGYGREMGFDAIHDYTEARSVWVNVDAKILPHYPR .* *** :. * : :.: :.
Figure 3.14. ClustalW protein alignment of PhnN. Comparison of ALDH polypeptide sequence of 23 different related microorganisms. Conserved regions display in boxes. NAD+ binding site, aldehyde dehydrogenase glutamic acid and cystein binding site are marked on the alignment graph.
Aldehyde dehydrogenase glutamic acid active site
Aldehyde dehydrogenase cystein active site
Possible NAD+ binding site

51
Table 3.3. Summary of ClustalW alignment for ALDH. Polypeptide sequence of ALDH in related
microorganisms are compared to S. paucimobilis EPA505.
Microorganism Alignmen
t Length
# of
residues
Identity
S. paucimobilis EPA505 499 499 499(100%)
Novosphingobium 501 501 451(90.02%)
S. xenophage 499 499 459(91.98%)
S. chunbukensis 501 501 439(87.62%)
Sphingobium yanoikuae 499 499 486(97.39%)
S. sp 14DN-61 499 499 484(96.99%)
S. wittichi RW1 (1) 509 506 221(43.42%)
S.wittichii RW1 (2) 509 498 219(43.03%)
S. sp. SKA58 (1) 509 506 227(44.60%)
S. sp. SKA58 (2) 510 506 222(43.53%)
Sphingopyxis alaskensis
RB2256
510 506 227(44.51%)
Azotobacter vinelandii AvOP 502 499 236(47.01%)
Pseudomonas putida
KT2440 (1)
506 492 211(41.70%)
P. putida KT2440 (2) 505 503 237(46.93%)
P. putida F1 509 506 218(42.83%)
P. putida GB-1 509 506 216(42.44%)
P. putida W619 509 506 216(42.44%)
P. aerugenosa PAO1 510 506 216(42.35%)
P. aerugenosa PA7 510 506 218(42.75%)
P. aerugenosa UCBPP-
PA14
510 506 218(42.75%)
P. entomophila L48 510 506 220(43.14%)
P. mendocina ymp 509 506 218(42.83%)
P. fluorescens 503 487 206(40.95%)
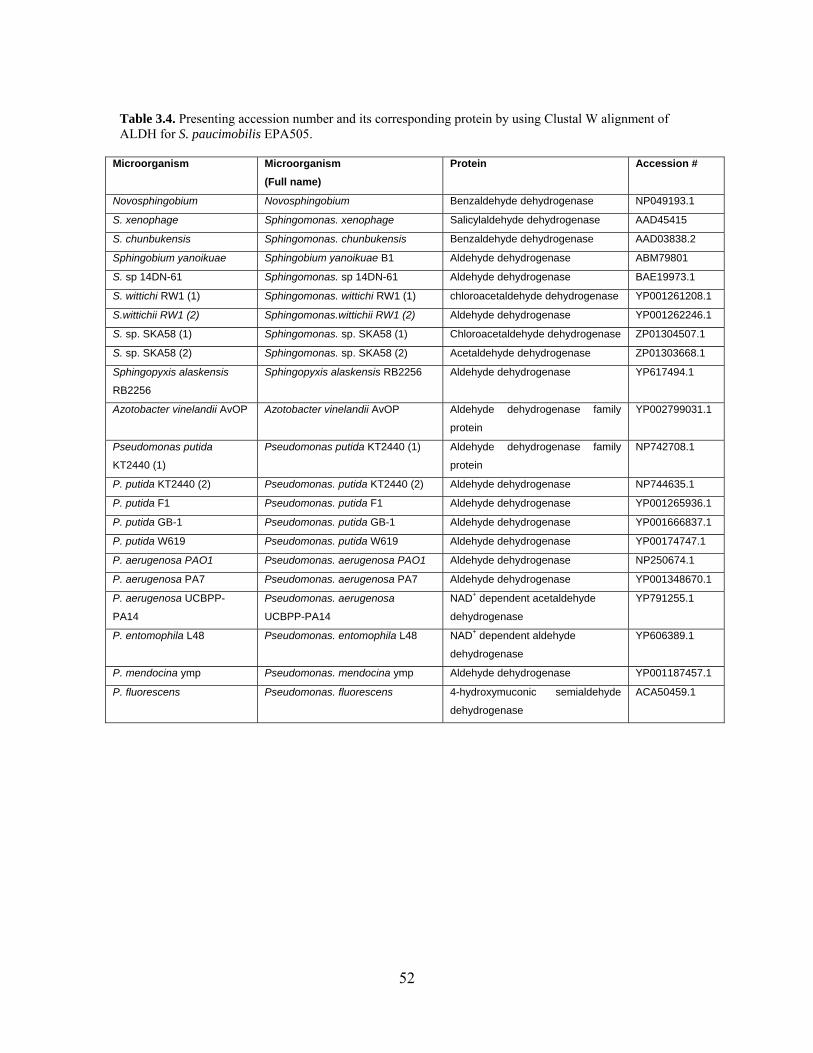
52
Table 3.4. Presenting accession number and its corresponding protein by using Clustal W alignment of ALDH for S. paucimobilis EPA505.
Microorganism Microorganism
(Full name)
Protein Accession #
Novosphingobium Novosphingobium Benzaldehyde dehydrogenase NP049193.1
S. xenophage Sphingomonas. xenophage Salicylaldehyde dehydrogenase AAD45415
S. chunbukensis Sphingomonas. chunbukensis Benzaldehyde dehydrogenase AAD03838.2
Sphingobium yanoikuae Sphingobium yanoikuae B1 Aldehyde dehydrogenase ABM79801
S. sp 14DN-61 Sphingomonas. sp 14DN-61 Aldehyde dehydrogenase BAE19973.1
S. wittichi RW1 (1) Sphingomonas. wittichi RW1 (1) chloroacetaldehyde dehydrogenase YP001261208.1
S.wittichii RW1 (2) Sphingomonas.wittichii RW1 (2) Aldehyde dehydrogenase YP001262246.1
S. sp. SKA58 (1) Sphingomonas. sp. SKA58 (1) Chloroacetaldehyde dehydrogenase ZP01304507.1
S. sp. SKA58 (2) Sphingomonas. sp. SKA58 (2) Acetaldehyde dehydrogenase ZP01303668.1
Sphingopyxis alaskensis
RB2256
Sphingopyxis alaskensis RB2256 Aldehyde dehydrogenase YP617494.1
Azotobacter vinelandii AvOP Azotobacter vinelandii AvOP Aldehyde dehydrogenase family
protein
YP002799031.1
Pseudomonas putida
KT2440 (1)
Pseudomonas putida KT2440 (1) Aldehyde dehydrogenase family
protein
NP742708.1
P. putida KT2440 (2) Pseudomonas. putida KT2440 (2) Aldehyde dehydrogenase NP744635.1
P. putida F1 Pseudomonas. putida F1 Aldehyde dehydrogenase YP001265936.1
P. putida GB-1 Pseudomonas. putida GB-1 Aldehyde dehydrogenase YP001666837.1
P. putida W619 Pseudomonas. putida W619 Aldehyde dehydrogenase YP00174747.1
P. aerugenosa PAO1 Pseudomonas. aerugenosa PAO1 Aldehyde dehydrogenase NP250674.1
P. aerugenosa PA7 Pseudomonas. aerugenosa PA7 Aldehyde dehydrogenase YP001348670.1
P. aerugenosa UCBPP-
PA14
Pseudomonas. aerugenosa
UCBPP-PA14
NAD+ dependent acetaldehyde
dehydrogenase
YP791255.1
P. entomophila L48 Pseudomonas. entomophila L48 NAD+ dependent aldehyde
dehydrogenase
YP606389.1
P. mendocina ymp Pseudomonas. mendocina ymp Aldehyde dehydrogenase YP001187457.1
P. fluorescens Pseudomonas. fluorescens 4-hydroxymuconic semialdehyde
dehydrogenase
ACA50459.1

53
Figure 3.15. Phylogenetic tree of 23 bacterial aldehyde dehydrogenases. The horizontal scale denotes the percentage of identity of the sequences.
3.2.4. Protein expression
As it was mentioned earlier, our bphB starts with TTG which codes for amino
acid Leucine. In order to anneal this gene to EK/LIC vector, we designed a primer in
which the target gene starts with ATG instead of TTG for the forward primer. Routine
PCR was performed for both genes using designed forward and reversed primers for each
gene and the BAC clone 03C01 was used as DNA template. After cleaning the PCR
Pseudomonas putida F1
Pseudomonas putida GB-1
Pseudomonas putida W619
Pseudomonas entomophila L48
Pseudomonas aeruginosa UCBPP-PA14
Pseudomonas aeruginosa PAO1
Pseudomonas aeruginosa PA7
Pseudomonas mendocina ymp
Sphingopyxis alaskensis RB2256
Sphingomonas sp. SKA58
Sphingomonas sp. SKA58(2)
Pseudomonas fluorescens
Sphingomonas wittichii RW1
Sphingomonas wittichii RW1(2)
Pseudomonas putida KT2440
Pseudomonas putida KT2440(2)
Azotobacter vinelandii AvOP
Novosphingobium aromaticivorans
Sphingomonas chungbukensis
Sphingomonas xenophaga
Sphingomonas paucimobilis EPA505
Sphingomonas sp. 14DN-61
Sphingobium yanoikuyae
0.2

54
product, a band about 830 bp for bphB (801 bp target gene plus overhangs) and a band
slightly more than 1500bp for phnN (1500 bp for target gene plus overhangs) were
observed on gel electrophoresis (data not shown). DNA concentration was measured
spectrometrically at A260. The DNA concentration of PCR product for bphB was 174
µg/ml with a 1.8 of A260/280 ratio and for phnN the DNA concentration was 145 µg/ml
with a A260/280 of 1.73.
As it was mentioned earlier in materials and methods, we were using this DNA
concentration to calculate the amount of insert needed for T4 DNA polymerase treatment
of insert. The PCR products of both genes were treated with T4 DNA polymerase to
generate compatible overhangs on the inserts and then used as targets insert to be
annealed to pET-30 EK/LIC vector. The EK/LIC vector contains very specific 13-14-
base single–stranded overhangs which makes cloning very efficient. Only desired
products will form during the annealing process.
These pET vectors also have a ColE1 replicon and contain a kanamycin resistance
marker. The annealed DNA mixture was transformed into NovaBlue Competent Cells as
the initial cloning host followed by plating on LB/Kan plates. Five colonies were picked
for each gene of interest and colony PCR was performed. PCR was carried out by using
T7 promoter and T7 terminator primers. The PCR product was run on gel electrophoresis
and a band about 1200 bp for bphB (800 bp plus 385 bp T7 primer region) and 1900 bp
for phnN (1500 bp plus 385 bp primer region)was observed as it was expected (Figure
3.16). One positive clone was picked for plasmid extraction (Figure 3.17) and stocked on
80% glycerol stock.

55
To make sure the plasmid was ready to be transformed into BL21 (DE3) pLysS
expression host cells, we ran another PCR by using the purified plasmid as template
DNA and T7 primers (Figure 3.18). The PCR fragments were sequenced and forward and
reverse fragments were assembled by using sequencer software to make sure that the start
codon was followed by the His-tag as it is presented in the pET-30 EK/LIC map (Figure
2.1).
(a) (b)
Figure 3.16. Gel electrophoresis shows colony PCR product after initial transformation into Nova blue competent cells. PCR fragments of both bphB and phnN were used as insert and annealed to pET-30 EK/LIC vector and then transformed in Nova blue competent cells. Lane 1, 1 kb DNA ladder, Colony PCR samples present a 1200 bp band for bphB (a, lane 2) and a 1900 bp for phnN (b, lane 2 & 3).
1 2 3 1 2
1000 bp 1900 bp
1000 bp 1200 bp

56
Figure 3.17. Gel electrophoresis of DNA plasmid extraction. Lane 1. One kb DNA ladder, Lane2; bphB insert plus pET30 EK/LIC vector (about 6230 bp), and lane 3. phnN insert plus pET30 EK/LIC vector (6939 bp) after plasmid extraction.
Figure 3.18. Gel electrophoresis of PCR fragment for bphB & phnN Plus T7 RNA polymerase primers (before cleaning the product). This PCR was performed to make sure this plasmid is now ready to be transformed into BL21 (DE3) pLysS expression host cells. Lane 1; 1 kb DNA ladder, Lane 2 and 3 represent bphB & phnN, respectively.
3.2.5. Protein expression using expression host
The first step for protein expression was the plasmid transformation, of the gene
of interest within the pET-30 EK/LIC vector into the expression host (i.e.,
1 2 3
12 3

57
BL21(DE3)pLysS). One problem that may be encountered during protein production and
purification is degradation by proteases. It is possible for the lon protease and the ompT
outer membrane protease to degrade proteins during purification. The BL21 strain is
deficient in both mentioned proteases and therefore the target proteins expressed in them
should be more stable than in host strains harboring those proteases. The host (i.e., BL21
strain) also contains DE3 lysogen which only transcribes the T7 RNA polymerase gene
by the lacUV5 promoter. This lac promoter is inducible by addition of IPTG to the
culture.
After the transformation process, the cells were plated out on LB agar containing
30 mg/ml kanamycin and 34 mg/ml chloromphenicol. Five colonies were picked and
colony PCR was performed. Gel electrophoresis indicated an expected size band about
1200 bp for bphB gene and about 1900 bp for phnN gene (Figure 3.19). One positive
clone was picked and streak on LB plate with antibiotics for single colony isolation.
(a) (b)
Figure 3.19. Gel electrophoresis for colony PCR after transformation of bphB and phnN containing plasmid into BL21 (DE3) pLysS competent cells. Lane 1, 1 Kb DNA marker; (a) Lanes 2-6 shown PCR products for bphB plasmids in expected size (about 1200bp), and (b) Lanes 2-5 show PCR products for phnN plasmids in expected size (about 1900bp).
1 2 3 4 5 6 1 2 3 4 5

58
The isolated colonies were used for making stock culture as well as starting the
induction assay to produce more target protein. Although the induction assay protocol is
mentioned in material and methods section, it is important to mention a few points
regarding that matter. It was noticed that if the OD600 of the starter culture was greater
than 0.5-0.6, it would prevent the induction process. To overcome this problem, 10 ml
LB with antibiotics was inoculated with one single colony of a fresh plate and incubated
at 37 °C while shaking at 150-200 rpm until the OD600 reach to 0.5 (about 3-5 hours). At
this point, 5 ml of the starter culture was added to 100 ml LB supplemented with
antibiotics (30 mg/ml kanamycin and 34 mg/ml chloramphenicol) and grown under the
same condition until the OD reached 0.6. At this point, the cells were induced by adding
1 mM IPTG to the growing culture with incubation at 30 °C. The 100 ml culture was
divided into two 50 ml culture. Two sets of 1ml samples were taken at time 0, 1, 2, 4,
and 6 hours. One set was used for the total cell protein fraction and the other was
analyzed by spectrophotometry at OD600 reading at different time periods.
3.2.6. Protein purification
After the OD600 of culture reached 0.6, 1 mM IPTG was added to the growing
culture and incubated at 30 °C for 6 hours. The cells were then harvested by
centrifugation at 8,000 rpm for 20 minutes. The pellet was kept at -80 °C until ready for
protein isolation. Purified proteins were then run on SDS PAGE gel electrophoresis
(Figure 3.20).
For total cell protein, un-induced and induced samples were collected at time 0.
The other samples collected at times 2, 4, and 6 hours were induced samples. For

59
enzymes purification, the suspended cells in binding buffer were first lysed by using a
French press (twice) followed by centrifugation at 10,000 rpm for 20 minutes. The
supernatant was then incubated with resin and washed in washing buffer. At this point the
proteins were eluted in 100 mM, 200 mM, and 500 mM imidazole. The 500 mM
displayed the highest concentration of protein in comparison to the other two.
Figure 3.20. SDS-PAGE polyacrylamid gel demonstrates the total cell protein fractions as well as purified protein for DDH . Lane 1, protein marker; lane 2, un-induced protein sample; lanes 3-6 show total cell fraction at times 0, 2, 4, and 6 hours; lanes 7-12 represent purified protein eluted in different concentrations of imidazole (7 &8 100 mM, 9 &10 200 mM, and 11 & 12 500 mM imidazole). The band confirmed a 28 kD protein.
As mentioned earlier, the recombinant protein constructed in our study consists of
a polyhistidine-tag (His-tag) in its N- terminus. This amino acid motif is often used for
affinity purification of His-tagged recombinant proteins expressed in E. coli. After being
incubated with affinity media, HisLink protein purification resin, the His-tagged proteins
bound to metal ions in the affinity media (i.e., Ni2+ or Co2+) with micromolar affinity. The
resin was then washed, so the proteins with no Ni2+ or Co2+ interaction were removed.
The next step was to improve the washing efficiency by adding imidazole which has a
side chain for amino acid histidine. Imidazole eluted the tagged proteins bound to the
28 kD
1 2 3 4 5 6 7 8 9 10 11 12
25
100 kD 75
50

60
metal ions, Ni2+ or Co2+, attached to the beads in the chromatography column. As the
amount of imidazole increases while passing through the column, it dispenses more His-
tag from Ni2+ thus freeing the His-tagged proteins.
Results showed that the more imidazole concentration in the elution buffer, the
higher the protein concentration at the end of purifying process. The induced DDH
displayed a band approximately about 28 kD. Aldehyde dehydrogenase (ALDH) was
induced and the purified protein is shown in Figure 3.21. This enzyme consisted of a
polypeptide about 55 kD in size. The concentration of purified protein is higher from the
100 mM imidazole fraction up to 500 mM imidazole. At this point the protein fractions
were ready for further analysis such as protein determination and enzyme assay.
Figure 3.21. SDS gel demonstrates the total cell protein fractions as well as purified protein for ALDH . Lane 1, protein marker; Lane 2, un-induced culture; Lanes 3-6 show total cell fraction at times 0, 2, 4, and 6 hours; lanes 7-12 represent purified protein eluted in different concentrations of imidazole (7 &8 100 mM, 9 &10 200mM, and 11 & 12 500mM imidazole). The band confirmed a 55 kD protein.
Western blot hybridization using anti His-tag antibody as probe, confirmed the
presence and sizes of both DDH and ALDH. Only one band appeared for both enzymes
indicating that both polypeptides contain His-Tag sequence at their N-terminal. As it was
55 KD
1 2 3 4 5 6 7 8 9 10 11 12
100 kD 75
50
25
20

61
described earlier, the His-Tag consists of 6X histidine residues right after the start codon
(N terminal) or right before the stop codon (C terminal). In this study His tag was applied
only at the N terminal, therefore Western blot hybridization with His-tag antibody
indicates that the proteins of interest were purified from the cell during the protein
purification procedure (Figure 3.22).
Figure 3 22. Western Blot Hybridization. Western hybridization demonstrated hybridization of A, ALDH; and B, DDH using his-tag antibody. Both indicated of presence of one band at the right size.
2.7. Protein determination
Protein quantification was performed by using the Bradford method. Bovine serum
albumin was used as a standard. The three different concentration of imidazole (100 mM,
200 mM, and 500 mM) were used as dilution buffer to perform the curve. The standard
curve was constructed separately for each three different concentration of imidazole.
DDH
ALDH
A
B
55 kD
28 kD

62
Protein concentration was determined spectrophometrically by reading OD595 and
calculating the mg/ml, using the standard curve. The protein concentration for each
different fraction for ALDH is shown in Table 3.5.
Table 3.5. Quantitative Protein determination- ALDH
Elution buffer conc. Fraction Dilution factor
OD 595 (nm) Concentration (mg/ml)
100 mM Imidazole 1st 100 0.995 0.8 2nd 10-1 0.622 0.47
200 mM Imidazole 1st 5X10⁻¹ 0.829 0.6 2nd 5X10⁻¹ 0.972 0.7
500 mM Imidazole 1st 10-1 0.6 0.42 2nd 10-1 0.7 0.5
As it was shown earlier on the SDS-PAGE analysis, protein concentration
increased by increasing the concentration of elution buffers. It appears that proteins are
dissolved more readily in imidazole solution when they are exposed to increased
imidazole concentrations. The concentration of the original samples were much higher
than in the standard curve, therefore it had to be diluted to get to the suitable
concentration. Different concentrations of imidazole (100, 200, 500 mM) were being
used to dilute the enzyme. It is note worthy to mention that later on distilled water
replaced imidazole to elute the enzyme samples. It was not clear if the enzyme itself
became active or imidazole effect other factors such as NAD+ molecule.
3.2.8. Enzyme assay
The first step of the upper pathway, i.e., the conversion of Naphthalene to DHD,
has not been done in our laboratory and since DHD is not commercially available,
enzyme activity could not be demonstrated for DDH. ALDH enzyme activity was
measured spectrophotometrically by reading the reduction of NAD+ at 340 nm and using
salicylaldehyde as substrate.

63
For each enzyme activity, two different control reactions and one test reaction
were performed. One control (recorded as B1) contained sodium phosphate buffer (pH
7.4), salicylaldehyde (substrate), NAD+, and no ALDH (enzyme). The second control
(recorded as B2) included only NAD+ and ALDH and no substrate. The test reaction was
contained everything including buffer, substrate, NAD+, and ALDH. These three
reactions were tested for 0.005 mg (0.1 mM), 0.025 mg (0.5 mM), and 0.05 mg (1 mM)
enzyme. All reactions were performed at 25 °C and in triplicate. Figure 3.23 representing
a plot demonstrating an example for the enzyme activity. In all the assays, a flat line for
both substrate and NAD+ controls (B1 and B2 reactions) was observed meaning there was
no enzyme activity persuade unless substrate, NAD+, and Enzyme (E reaction) were
added all together. At this point, elevation of OD were detected which means that enzyme
were activated and NADH was produced to change the OD. All enzyme reactions showed
a linear increase followed by slowing down the slop and remain constant through the end
of the reaction.
Figure 3.23. Plot representing enzyme assays in three different reactions for 0.005 mg ALDH. B1 (substrate control) showed a slightly reduction while B2 (NAD control) demonstrated a slight increase. E (Enzyme) showed significant increase in activity. Specific activity was measured for each assay.
Specific activity 160 U/mg

64
3.2.9. Determination of specific activity
The enzyme activity was calculated from the initial linear portion of the time
course by using an absorption coefficient of 6220 M-1 cm-1 for NADH. One unit of
enzyme activity was defined as the amount of enzyme that reduced 1 µM of NAD+ per
min at 25 °C. First by using the Beer’s law, NADH concentration I is calculated as:
C (Molar) = A340/ (Extinction Coefficient of NADH =6220),
The result ΔC is the amount of enzyme that reduced 1 molar of NAD+, but as it
was mentioned before we can calculate the amount of enzyme that reduced 1 µM of
NAD+. That would give us the concentration of the enzyme in µM. The next step was
calculating specific activity and is as following:
Specific activity (U/mg) = ΔC /Time × mg protein
The comparison results of enzyme activities for three different concentration of
enzymes were summarized in Table 3.6. The enzyme activity vs. enzyme concentration
is demonstrated in Figure 3.24. It is clear that enzyme activity reduces by increasing the
enzyme concentration. The reason might be the availability of substrate. In the low
concentrations of enzyme (e.g. 0.1 mM), the ratio between enzyme and substrate is more,
in comparison to the higher concentration, when the ratio is less to activate the enzyme.
On the other hand, enzyme concentration was shown direct increase with OD340. That
means NADH production increases by increasing the enzyme concentration (Figure
3.25).

65
Table 3.6. Representing enzyme activity for three different concentrations of ALDH. Enzyme conc.(mg) Avg specific activity
(U/mg) 0.005 160 0.025 132 0.05 95.4
Figure 3.24. Enzyme activity indicating comparison between enzyme concentration and specific activity. The specific activity shows reduction by increasing the enzyme concentration.
Figure 3.25. Plot representing enzyme concentration vs. OD. Three different enzyme concentration 0.1, 0.5, and 1 mM were tested for enzyme activity. All assays performed in triplicate and average OD340 for each concentration of enzyme was calculated and plotted against time.
020406080
100120140160180
0 0.02 0.04 0.06
Specific Activity u/m
g
Enzyme Conc. (mg)
Enzyme conc. vs specific activity
0
0.1
0.2
0.3
0.4
0.5
0.6
0.7
0.8
0 10 20 30 40
OD 340
Time (min)
Enzyme conc. vs OD
0.1 mM
0.5 mM
1 mM

66
Figure 3.24 showed that 0.1 mM enzyme presents the highest activity among
other concentrations. Therefore, 0.1 mM enzyme was used for performing the assays for
evaluating the optimum temperature and optimum pH. In addition to the fact that 0.1 mM
enzyme showed significant specific activity, using 0.1 mM enzyme was preferred
because less enzyme was more efficient in performing assays.
3.2.10. Determination of optimum temperature and optimum pH.
To determine optimum temperature for ALDH enzyme, all enzyme assays were
performed by using 80 mM sodium phosphate buffer at pH 7.4, 2 mM salicylaldehyde,
and 200 µM NAD+ , and 0.1 mM ALDH in the final concentration of 500 µl total volume.
All assays were performed in triplicate and carried out in a 1 ml cuvette. The assay was
performed by first adding buffer, substrate and NAD+ to all the reactions; i.e. B1
(substrate control), B2 (NAD+ control) and E (Experiment). OD340 was measured
immediately after adding enzyme to each reaction. The cuvettes were then incubated in
the water bath at the adjusted temperature and OD was measured in 5 minutes intervals
for the total of 30 minutes.
The temperature was elevated starting at 10 °C and was increased before specific
activity was measured. This was done to determine which temperature had the best effect
on activity of the enzyme to determine the optimum temperature. Lower specific activity
was observed at lower temperature. (Figure 3.26)

67
Figure 3.26. Plot representing enzyme activity at different temperatures. Enzyme assay was performed at different temperatures in triplicate. OD340 was recorded in 5 min intervals for up to 30 min. Average OD for each temperature was calculated and plotted against time.
Figure 3.27. Plot representing enzyme assay in three different reactions at 45°C. B1 (substrate control) showed slightly reduction while B2 (NAD control) demonstrated a slight increase. E (Enzyme) showed significant increase or activity. Specific activity was measured for each assay. All assays were performed at pH 7.4.
It was clearly observed that 45 °C is the optimum temperature for the ALDH
enzyme to demonstrate the highest activity (Figure 3.46). At 45 °C, ALDH shows
specific activity of 1720 U/mg compare to 1140 U/mg at 40 °C. The specific activity
0
0.2
0.4
0.6
0.8
1
1.2
0 10 20 30 40
OD 340
Time (min)
Enzyme activity at different temp
10C
20C
25C
30C
40C
45C
50C
0
0.2
0.4
0.6
0.8
1
1.2
0 10 20 30 40
OD 340
Time (min.)
Enzyme assay at 45 °C
B1(subs+NAD)
B2(NAD+Enz)
E(subs+NAD+Enz)
specific activity1720 U/mg

68
dropped down to 1192 U/mg at 50 °C. To make sure that 45 °C is the optimum
temperature for this dehydrogenase enzyme, Enzyme assay was performed at 47°C and
demonstrated a specific activity of 1626 U/mg. The latest result confirmed that enzyme
activity is highest at 45 °C.
Table 3.7. Presenting specific activity for different temperature. Enzyme assay was performed at different temperature and specific activity was measured for each assay.
Temp (°C) Specific Activity
(U/mg) 10 122.4
15 165.7
20 264.9
25 306.6
28 308.23
30 385.5
32 406.86
35 483.86
40 1140
45 1720
47 1626
50 1192

69
Figure 3.28. Plot representing the optimum Temperature for ALDH. Enzyme assays were performed at different temperature and specific activity was measured for each assay. pH was kept constant at 7.4.
For the determination of optimum pH, all assays were performed at 45 °C and
various pH (Figure 3.29). The enzyme concentration was kept constant at 0.005 mg (0.1
mM).
Figure 2.29. Plot representing enzyme activity at different pHs. Enzyme assay was performed at different pHs in triplicate. OD340 was recorded in 5 min intervals for up to 30 min. Average OD for each pH was calculated and plotted against time.
0
0.2
0.4
0.6
0.8
1
1.2
0 10 20 30 40
OD 340 nm
Time (min)
Enzyme activity at different pHs
5.7
6
6.2
6.6
6.8
7

70
Figure 3.30. Plot representing enzyme assay in three different reactions at pH 7.0. B1 (substrate control) showed a slightly reduction while B2 (NAD control) demonstrated a slight increase. E (Enzyme) showed significant increase of activity. Specific activity was measured for each assay. All assays were performed at 45 °C.
ALDH had the highest activity at pH 7.0. Specific activity increased gradually by
increasing pH up to 7.0 which reached the highest point. Activity decreased dramatically
at pH 7.8. This means that ALDH enzyme lost its activity at basic environment. This was
due to the NAD+ activity. By observing data from NAD+ control (B2) through the assays
for optimizing the pH, it is clear that OD340 is slightly increased at acidic pH. This means
NAD+ is more active at acidic condition and can activate ALDH by reducing to NADH
more rapidly. Comparing specific activities at various pHs make this clear that ALDH
shows higher activity at pHs lower than 7.0 (Figure 3.31). Specific activity of ALDH at
pH 7.0 is twice as much as pH 6.6, whereas it is seven times higher than activity at pH
7.8 (Table 3.8). This proves that enzyme activity reduces at basic conditions rather than
pHs lower than neutral.
0
0.1
0.2
0.3
0.4
0.5
0.6
0.7
0.8
0.9
1
0 10 20 30 40
OD340
Time (min)
Enzyme Assay pH 7.0
B1(Subs+NAD)
B2(NAD+Enz)
E(Subs+NAD+Enz)
specific activity3040 U/mg

71
Table 3.8. Representing specific activity of ALDH at various pHs.
pH specific activity
5.7 716
6 919.6
6.2 1200
6.6 1520
6.8 2080
7.0 3040
7.4 1161
7.8 436
Figure 3.31. Plot representing the optimum pH for ALDH. The enzyme assay was performed at different pHs and specific activity was measured for each assay. The temperature was kept constant at 45°C.
3.2.11. Steady-state kinetics
Under the given assay conditions (i.e., 80 mM sodium phosphate buffer pH 7.0,
200 mM NAD+, 0.1 mM ALDH, at 45°C) ALDH presented Michaelis-Menten behavior
when the concentration of salicylaldehyde [S] were varied in the range of 0.5-2.5mM.
The [S] and Vi values are demonstrated in Table 3.9, where [S] is substrate concentration
0
500
1000
1500
2000
2500
3000
3500
4000
5 5.5 6 6.5 7 7.5 8
TSpecific activity ±SE
pH
Optimum pH for ALDH

72
and Vi is initial reaction rate. Because the OD is directly proportional to the concentration
of the products, it could be used as a measure of the rate or velocity of the reaction (Vi).
Therefore the average change in OD340 nm per minutes is measured as Vi.
Table 3.9. summary of the results of Steady-state kinetics experiments. Each substrate concentration was
tested in triplicate at constant concentration.
[S] 2.5 mM 2mM 1.5mM 1mM 0.5mM
1/[S] 0.4 0.5 0.6 1 2
Ѵi 0.0452 0.0474 0.0389 0.0293 0.018
1/Ѵi 22.12 21.09 25.70 34.12 55.0
Making a Lineweaver-Burk plot of the results in Table 3.9. shows that:
1/Vmax = 14, so Vmax = 0.07
−1/Km = − 0.7, so Km = 1.43 mM
In other words, when [S] is 1.43 mM (close enough to 1.5), 1/Vi = 25.70, and Vi =
0.035 (0.04) or one-half of Vmax. measured 0.07 U mg-1.
Kcat = Vmax/ Eт = 0.07/0.1 =0.7 (s-1)
When Eт is defined as enzyme concentration (mM) [Enzyme] = 0.1 mM
Catalitic efficiency = Kcat / Km=0.7/1.43= 0.489 ≈ 0.5 (M-1 s-1 )

73
Chapter 4: Discussion
In this study we isolated and characterized two dehydrogenases , the bphB and phnN
genes, of S. paucimobilis EPA505. Both enzymes have some similarity to BphB and
PhnN of other related organisms. Phylogenetic analysis of amino acid sequence of both
gene products reveals that they fall into the same group as the corresponding genes. To
our knowledge this is the first observation of a bphB and phnN genes which contribute to
a catabolic pathway for S. paucimobilis EPA505. The location and direction of
transcription of these two genes represent an arrangement similar to that of other
aromatic catabolic operons.
The BphB enzyme described in this study appears as one of the first cis-
dihydrodiol dehydrogenases ever reported from S. paucimobilis EPA505. The bphB gene
was isolated from the genomic library of strain EPA505 and showed significant
homology to several dehydrogenase. The bphB gene encodes the second enzyme in the
upper catabolic pathway for PAH degradation which is a dihydrodiol dehydrogenase. The
first dioxygenase enzyme convert PAH compound to corresponding PAH dihydrodiol.
This dihydrodiol is the substrate for the second enzyme, dihydrodiol dehydrogenase
(DDH). Clustal W alignment compare this DDH enzyme to other related organisms and
showed some similarity. It shows 95% identity with DDH of both S. yanoikuyae B1 and
P. putida OU83, while it shows 79% identity with Sphingomonas sp. CHY-1. A short
chain dehydrogenase/reductase family signature site have been implicated in the catalytic
activity of DDH.
The phnN gene encoding salicylaldehyde dehydrogenase (ALDH) was also
isolated from the library of strain EPA505 which showed significant homology toward

74
other ALDH in related organisms. Clustal W alignment of this ALDH showed high
identity with some of the sphingomonads such as, S. yanoikuyae B1 (97%),
Sphingomonas sp.14DN-61 (96%), S. xenophage (91 %), with S. chunbukensis (87 %),
and Novosphingobium (90 %). Some other sphingomonads showed less identity toward
ALDH including S. wittichi RW1 (43 %), Sphingomonas sp. SKA 58 (44 %). Phylogenic
analysis of the ALDH confirm this Data.
ALDHs appear to utilize NAD+ as a cofactor and to prefer short-chain aliphatic
aldehydes (salicylaldehyde) as a substrate and it was found that the members of this
ALDH family contain both the “TLELGGKS” consensus sequence with G260 and the
[KQ]GEVC[LT]AC[GP]SR consensus with C294 . A G-X-G-X3-G was found between
residues 225 and 232 in the ALDH family. This glycine motif involved in NAD+ binding
has been found in ALDHs catalyzing irreversible reactions, whereas the G-X-G-X2-G
coenzyme-binding motif is typically present in ALDHs catalyzing reversible reactions.
ALDH is the last enzyme in the upper catabolic pathway and converting
salicylaldehyde as the substrate to salicylic acid. Salicylic acid is the last product of the
upper pathway, connecting it to the lower pathway via catechol or gentisate. ALDH is a
NAD dependent enzyme and its activity was evaluated by measuring the rate of
production of NADH. It was clearly observed that this enzyme even at a concentration as
low as 0.1 mM is able to oxidize NAD and produce NADH. At low concentration
enzyme showed less production of NADH but the specific activity was showing its
highest amount. Thus enzyme concentration has a proportional effect on OD and by that
means production of NADH. However our data showed that the enzyme concentration
has opposite effect on specific activity.

75
In this study we isolate and characterized a new ALDH for the first time. The
recombinant plasmid harboring the phnN gene can act like a small factory to produce the
enzyme of interest. By manipulating the system we will reach to the goal in future works.

76
References
[1] Habe, H. and T. Omori. 2003. Genetics of Polycyclic Aromatic Hydrocarbon
Metabolism in Diverse Aerobic Bacteria, Biosci. Biotechnol. Biochem. 67: 225-
243.
[2] Kanaly, R. and S. Harayama. 2000. Biodegradation of High-Molecular-Weight
Polycyclic Aromatic Hydrocarbons by Bacteria, J. Bacteriology. 182: 2059–2067.
[3] Harvey, R. G. 1997. Polycyclic aromatic hydrocarbons. Wiley-VCH, New York,
N.Y.
[4] Zander, M. 1983. Physical and chemical properties of polycyclic aromatic
hydrocarbons, p. 1–26. In A. Bjorseth (ed.), Handbook of polycyclic aromatic
hydrocarbons. Marcel Dekker, Inc., New York, N.Y.
[5] Fiala, Z. et al. 1999. Polycyclic aromatic hydrocarbons I. Environmental
contamination and environmental exposure. Acta. Medica, 42: 77–89.
[6] Samanta, S. K., O.V. Singh, and R. K. Jain. 2002. Polycyclic Aromatic
Hydrocarbons: Environmental Pollution and Bioremediation. Trends in
Biotechnology. 20: 243-248.
[7] Shannon, J.L. 1984. Hydrocarbons as substrates in industrial fermentation.
Petroleum Microbiology (Atlas, R.M., ed), 643–683, Macmillan.
[8] Cerniglia, C.E. 1984. Microbial metabolism of polycyclic aromatic hydrocarbons.
Adv. Appl. Microbiol. 30: 31–71.
[9] Geiselbrecht, A. D., B. P. Hedlund, M. A. Tichi and J. T. Staley. 1998. Isolation
of Marine Polycyclic Aromatic Hydrocarbon (PAH)-Degrading Cycloclasticus
Strains from the Gulf of Mexico and Comparison of Their PAH Degradation
Ability with That of Puget Sound Cycloclasticus Strains. Appl. Environ. Microbiol.
64: 4703–4710.
[10] Goldman, R. et al. 2001. Smoking increase carcinogenic polycyclic aromatic
hydrocarbons in human lung tissue. Cancer Res. 61: 6367–6371.

77
[11] Mastrangela, G. et al. 1997. Polycyclic aromatic hydrocarbons and cancer in man.
Environ. Health Perspect. 104: 1166–1170.
[12] Falahatpisheh, M.H. et al. 2001. Antagonistic interactions among nephrotoxic
polycyclic aromatic hydrocarbons. J. Toxicol. Environ. Health. 62: 543–560.
[13] Kaiser, J. 1997. Endocrine disrupters: Synergy paper questioned at Toxicology
meeting. Science. 275: 1879–1880.
[14] Xia, Y. et al. 2005. Isolation and characterization of phenanthrene-degrading
Sphingomonas paucimobilis strain ZX4. Biodegradation. 16: 393–402.
[15] Gibson,D. T., Ed, 1984. .Microbial Degradation of Organic Compounds. Marcel
Dekker, Inc.: New York, 535.
[16] Dingyi, Y.E. et al.1996. Degradation of Polynuclear Aromatic Hydrocarbons by
Sphingomonas paucimobilis. Environ. Sci. Technol. 30: 136-142.
[17] Cerniglia, C. E. 1984. Microbial transformation of aromatic hydrocarbons. In
Petroleum Microbiology, 99-128. Edited by R. M. Atlas. New York: Macmillan.
[18] Clements W., Oris J., Wissing T. 1994. Accumulation and food chain transfer of
fluoranthene and benzo[a]pyrene in Chironomus riparius and Lepomis
macrochrius. Arch. Environ. Contam. Toxico. l26: 261–266.
[19] Story, S. P. et al. 2004. Degradation of Aromatic Hydrocarbons by Sphingomonas
paucimobilis Strain EPA505. Arch. Environ. Contam. Toxicol. 47: 168–176.
[20] Cerniglia, C. E. 1992. Biodegradation of polycyclic aromatic hydrocarbons.
Biodegradation. 3: 351–368.
[21] Wilson, S. C., and K. C. Jones. 1993. Bioremediation of soil contaminated with
polynuclear aromatic hydrocarbons (PAHs): a review. Environ. Pollut. 81:229–
249.
[22] Harayama, S. et al. 1992. Functional and evolutionary relationships among
diverse oxygenases. Annu. Rev. Microbiol. 46: 565-601.

78
[23] Sabate, J. et al. 1999 Isolation and characterization of a 2-methylphenanthrene
utilizing bacterium: identification of ring cleavage metabolites. Appl. Microbiol.
Biotechnol. 52: 704–712.
[24] Bossert, I. D. and R. Bartha, 1986. Bull. Environ. Contam. Toxicol. 37: 490-495.
[25] Tiehrn, A. 1994, Appl. Environ. Microbiol. 60: 258-263.
[26] Mueller, J. G.; Chapman, P. J.; Blattman, B. O.; Pritchard, P. H. 1990. Appl.
Environ. Microbiol. 56: 1079-1086.
[27] Rouse, J. D., D. A. Sabatini, J. M. Suflita, and J. H. Harwell. 1994. Influence of
surfactants on microbial degradation of organic compounds. Crit. Rev. Environ.
Sci. Technol. 24:325–370.
[28] Grimberg, S. J., W. T. Stringfellow, and M. D. Aitken. 1996. Quantifying the
biodegradation of phenanthrene by Pseudomonas stutzeri P16 in the presence of a
nonionic surfactant. Appl. Environ. Microbiol. 62:2387–2392.
[29] Mueller, J. G., P. J. Chapman, and P. H. Pritchard. 1989. Action of a
fluoranthene-utilizing bacterial community on polycyclic aromatic hydrocarbon
components of creosote. Appl. Environ. Microbiol. 55:3085–3090.
[30] Takizawa,N. et al. 1994. Identification and Characterization of Genes Encoding
Polycyclic Aromatic Hydrocarbon Dioxygenase and Polycyclic Aromatic
Hydrocarbon Dihydrodiol Dehydrogenase in Pseudomonas putida OUS82. J.
Bacteriol. 176: 2444-2449.
[31] Faizal I. et al. 2005. Isolation and characterization of solvent-tolerant
Pseudomonas putida strain T-57, and its application to biotransformation of toluene
to cresol in a two-phase (organic-aqueous) system. J Ind Microbiol Biotechnol. 32:
542–547.
[32] Goyal, A. K., et al., 1996, Molecular cloning of novel genes for polycyclic
aromatic hydrocarbon degradation form Camamonas testosterone Gz39, Appl.
Envrion. Microbiol., 62: 230-236.

79
[33] Fuenmayor, S. L. et al., 1998, A gene cluster encoding steps in conversion of
naphthalene to gentisate in Pseudomonas sp. strain U2. J. Bacteriol. 180: 2522-
2530.
[34] Laurie, A. D. et al., 1999, The phn genes of Burkholderia sp. strain RP007
constitute a divergent gene cluster for polycyclic aromatic hydrocarbon catabolism,
J. Bacteriol. 181: 531-540.
[35] Laurie, A. D. et al., 1999, Conversed and hybrid meta-cleavage operons from
Burkholderia RP007, Biochem. Biophys. Res. Commun., 262: 308-314.
[36] Kiyohara, H. 1982. Phenanthrene-degrading phenotype of Alcaligenes faecalis
AFK2, Appl. Environ. Microbiol. 43: 458-461.
[37] Larkin, M. J. 1998. Applied aspects of Rhodococcus genetics. Antonie van
Leeuwenhoek. 74: 133-153.
[38] Iwabuchi, T. et al., 1998, Isolation and characterization of marine Nocardioides
capable of growing and degrading phenanthrene at 42oC. J. Mar. Biotechnol. 6: 68-
90.
[39] Heitkamp, M. A., et al., 1998, Pyrene degradation by a Mycobacterium sp.:
identification of ring oxidation and ring fission products. Appl. Environ. Microbiol.
54:2556-2565.
[40] Walter, U. et al., 1991, Degradation of pyrene by Rhodococcus sp. UW1. Appl.
Microbiol. Biotechnol. 34:671-676.
[41] Heitkamp, M. A., et al., 1989, Polycyclic aromatic hydrocarbon degradation by a
Mycobacterium sp. in microcosms containing sediment and water from a pristine
ecosystem. Appl. Environ. Microbiol. 55:1968-1973.
[42] Yabuuchi, E. et al. 1990. Proposals of Sphingomonas paucimobilis gen. nov. and
comb. nov., Sphingomonas parapaucimobilis sp. nov., Sphingomonasyanoikuyae
sp. nov., Sphingomonas adhaesiva sp. nov., Sphingomonas capsulatacomb. nov.,
and two genospecies of the genus Sphingomonas. Microbiol. Immunol. 34:99–119.

80
[43] Adkins, A. 1999. Degradation of the phenoxy acid herbicide diclofop-methyl by
Sphingomonas paucimobilis isolated from a Canadian prairie soil. J. Ind.Microbiol.
Biotechnol. 23:332–335.
[44] Bastiaens, L. 1998. PH.D. thesis. Catholic University of Leuven, Leuven,
Belgium.
[45] Bastiaens, L., D. Springael, P. Wattiau, H. Harms, R. deWachter, H.
Verachtert, and L. Diels. 2000. Isolation of adherent polycyclic aromatic
hydrocarbon (PAH)-degrading bacteria using PAH-sorbing carriers. Appl.
Environ.Microbiol. 66:1834–1843.
[46] Cassidy, M., H. Lee, J. Trevors, and R. Zablotowicz. 1999. Chlorophenol and
nitrophenol metabolism by Sphingomonas sp UG30. J. Ind. Microbiol. Biotechnol.
23:232–241.
[47] Lloyd-Jones, G., and P. C. K. Lau. 1997. Gluthathione S-transferase-encoding
gene as a potential probe for environmental bacterial isolates capable of degrading
polycyclic aromatic hydrocarbons. Appl. Environ. Microbiol. 63:3286–3290.
[48] Meyer, S., R. Moser, A. Neef, U. Stahl, and P. Ka¨mpfer. 1999. Differential
detection of key enzymes of polyaromatic-hydrocarbon-degrading bacteria using
PCR and gene probes. Microbiology. 145:1731–1740.
[49] Momma, K., W. Hashimoto, O. Miyake, H. Yoon, S. Kawai, Y. Mishima, B.
Mikami, and K. Murata. 1999. Special cell surface structure, and novel
macromolecule transport/depolymerization system of Sphingomonas sp A1. J. Ind.
Microbiol. Biotechnol. 23:425–435.
[50] Mueller, J. G., P. J. Chapman, B. O. Blattmann, and P. H. Pritchard. 1990.
Isolation and characterization of a fluoranthene-utilizing strain of Pseudomonas
paucimobilis. Appl. Environ. Microbiol. 56:1079–1086.
[51] Pinyakong, O., H. Habe, N. Supaka, P. Pinpanichkarn, K. Juntongjin, T.
Yoshida, K. Furihata, H. Nojiri, H. Yamane, and T. Omori. 2000. Identification
of novel metabolites in the degradation of phenanthrene by Sphingomonas sp.
strain P2. FEMS Microbiol. Lett. 191:115–121.

81
[52] Sorensen, S. R., Z. Ronen, and J. Aamand. 2001. Isolation from agricultural soil
and characterization of a Sphingomonas sp. able to mineralize the phenylurea
herbicide isoproturon. Appl. Environ. Microbiol. 67:5403–5409.
[53] Daane, L. L., I. Harjono, G. J. Zylstra, and M. M. Ha¨ggblom. 2001. Isolation
and characterization of polycyclic aromatic hydrocarbon-degrading bacteria
associated with the rhizosphere of salt marsh plants. Appl. Environ. Microbiol.
67:2683–2691.
[54] Fredrickson, J., D. Balkwill, M. Romine, and T. Shi. 1999. Ecology, physiology,
and phylogeny of deep subsurface Sphingomonas sp. J. Ind. Microbiol.Biotechnol.
23:273–283.
[55] Fredrickson, J. K., D. L. Balkwill, G. R. Drake, M. F. Romine, D. B.
Ringelberg, and D. C. White. 1995. Aromatic-degrading Sphingomonas isolates
from the deep subsurface. Appl. Environ. Microbiol. 61:1917–1922.
[56] Coughlin, M., B. Kinkle, and P. Bishop. 1999. Degradation of azo dyes
containing aminonaphthol by Sphingomonas sp strain 1CX. J. Ind.
Microbiol.Biotechnol. 23:341–346.
[57] Fujii, K., N. Urano, H. Ushio, M. Satomi, H. Iida, N. Ushio-Sata, and S.
Kimura. 2000. Profile of a nonylphenol-degrading microflora and its potential for
bioremedial applications. J. Biochem. 128:909–916.
[58] Tiirola, M. A., M. K. Ma¨nnisto¨, J. A. Puhakka, and M. S. Kulomaa. 2002.
Isolation and characterization of Novosphingobium sp. strain MT1, a dominant
polychlorophenol-degrading strain in groundwater bioremediation system. Appl.
Environ. Microbiol. 68:173–180.
[59] Schweitzer, B., I. Huber, R. Amann, W. Ludwig, and M. Simon. 2001. - and
β-Proteobacteria control the consumption and release of amino acids on lake snow
aggregates. Appl. Environ. Microbiol. 67:632–645.
[60] Stolz, A. 1999. Degradation of substituted naphthalenesulfonic acids by
Sphingomonas xenophage BN6. J. Ind. Microbiol. Biotechnol. 23:391–399.

82
[61] Tabata, K., K.-I. Kasuya, H. Abe, K. Masuda, and Y. Doi. 1999. Poly(aspartic
acid) degradation by a Sphingomonas sp. isolated from freshwater. Appl.Environ.
Microbiol. 65:4268–4270.
[62] Wittich, R.-M., H. Wilkes, V. Sinnwell, W. Francke, and P. Fortnagel. 1992.
Metabolism of dibenzo-p-dioxin by Sphingomonas sp. strain RW1. Appl.Environ.
Microbiol. 58:1005–1010.
[63] Gilewicz, M., Ni’matuzahroh, T. Nadalig, H. Budzinski, P. Doumenq, V.
Michotey, and J. C. Bertrand. 1997. Isolation and characterization of a marine
bacterium capable of utilizing 2-methylphenanthrene. Appl. Microbiol.Biotechnol.
48:528–533.
[64] Takeuchi, M., Hamana, K. & Hiraishi, A. 2001. Proposal of the genus
Sphingomonas sense strict and three new genera, Sphingobium, Novosphingobium
and Sphingopyxis, on the basis of phylogenetic and chemotaxonomic analyses. Int.
J. Syst. Evol. Microbiol. 51:1405–1417.
[65] Onruthai P., et al., 2003, The unique aromatic catabolic genes in sphingomonads
degrading polycyclic aromatic hydrocarbons (PAHs), J. Gen. Appl. Microbiol.
49:1-19.
[66] Crawford, R. L., and M. M. Ederer. 1999. Phylogeny of Sphingomonas sp. that
degrade pentachlorophenol. J. Ind. Microbiol. Biotechnol. 23:320–325.
[67] Keim, T., W. Francke, S. K. Schmidt, and P. Fortnagel. 1999. Catabolism of
2,7-dichloro- and 2,4,8-trichlorodibenzofuran by Sphingomonas sp. strain RW1. J.
Ind. Microbiol. Biotechnol. 23:359–363.
[68] Wittich, R. M., C. Strompl, E. R. B. Moore, R. Blasco, and K. N. Timmis.
1999. Interaction of Sphingomonas and Pseudomonas in the degradation of
chlorinated dibenzofurans. J. Ind. Microbiol. Biotechnol. 23:353–358.
[69] Nagata, Y., K. Miyauchi, and M. Takagi. 1999. Complete analysis of genes and
enzymes for g-hexachlorocyclohexane degradation in Sphingomonas paucimobilis
UT26. J. Ind. Microbiol. Biotechnol. 23:380–390.

83
[70] Adkins, A. 1999. Degradation of the phenoxy acid herbicide diclofop-methyl by
Sphingomonas paucimobilis isolated from a Canadian prairie soil. J. Ind.Microbiol.
Biotechnol. 23:332–335.
[71] Kohler, H. P. E. 1999. Sphingomonas herbicidivorans MH: a versatile
phenoxyalkanoic acid herbicide degrader. J. Ind. Microbiol. Biotechnol. 23:336–
340.
[72] Khan, A. A., R.-F. Wang, W.-W. Cao, W. Franklin, and C. E. Cerniglia. 1996.
Reclassification of a polycyclic aromatic hydrocarbon-metabolizing bacterium,
Beijerinckia sp. strain B1, as Sphingomonas yanoikuyae by fatty acid analysis,
protein pattern analysis, DNA-DNA hybridization, and 16S ribosomal DNA
sequencing. Int J. Syst. Bacteriol. 46:466–469.
[73] Komatsu, T., Omori, T. and Kodama, T. 1993. Microbial degradation of the
polycyclic aromatic hydrocarbons acenaphthene and acenaphthylene by a pure
bacterial culture. Biosci. Biotechnol. Biochem. 57:864–865.
[74] Pinyakong, O. et al. 2003. Identification of three novel salicylate 1-hydroxylases
involved in the phenanthrene degradation of Sphingobium sp. strain P2.
Biochemical and Biophysical Research Communications 301:350–357.
[75] Patel TR and DT Gibson. 1974. Purification and Properties of (+)-cis-
Naphthalene Dihydrodiol Dehydrogenase of Pseudomonas putida. J Bacteriol.
119:879-888.
[76] Sophos NA, A Pappa, TA Ziegler, and V. Vasiliou. 2001. Aldehyde
dehydrogenase gene superfamily: the 2000 update. Chemico-Biological
Interactions. 130-132:323-337.
[77] Khan AA, R-F Wang, W-W Cao, W Franklin and CE Cerniglia. 1996.
Reclassification of a polycyclic aromatic hydrocarbon-metabolizing bacterium,
Beijerinckia sp strain B1, as Sphingomonas yanoikuyae by fatty acid analysis,
protein pattern analysis, DNA–DNA hybridization, and 16S ribosomal DNA
sequencing. Int. J. Syst. Bacteriol. 46: 466–490.

84
[78] Gibson DT, RL Roberts, MC Wells and VM Kobal. 1973. Oxidation of biphenyl
by a Beijerinckia species. Biochem. Biophys. Res. Commun. 50: 211–219.
[79] Akhtar MN, DR Boyd, NJ Thompson, M Koreeda, DT Gibson, V Mahadevan
and DM Jerina. 1975. Absolute stereochemistry of the dihydroanthracene-cis- and
-trans-1,2- diols produced from anthracene by mammals and bacteria. J. Chem.
Soc. [Perkin 1] 23:2506–2511.
[80] Jerina DM, H Selander, H Yagi, MC Wells, JF Davey, V Mahadevan and DT
Gibson. 1976. Dihydrodiols from anthracene and phenanthrene. J. Am. Chem. Soc.
98: 5988–5996.
[81] Mondello FJ. 1985. Regulation of aromatic hydrocarbon metabolism in a
Beijerinckia species. Abstracts of the 85th General Meeting of the American
Society for Microbiology 1985, p 199.
[82] Kim E and GJ Zylstra. 1995. Molecular and biochemical characterization of two
meta-cleavage dioxygenases involved in biphenyl and mxylene degradation by
Beijerinckia sp strain B1. J Bacteriol 177:3095–3103.
[83] Mahaffey WR, DT Gibson and CE Cerniglia. 1988. Bacterial oxidation of
chemical carcinogens: formation of polycyclic aromatic acids from
benz[a]anthracene. Appl. Environ. Microbiol. 54: 2415–2423.
[84] Barnsley EA. 1976. Role and regulation of the ortho and meta pathways of
catechol metabolism in pseudomonads metabolizing naphthalene and salicylate. J
Bacteriol 125: 404–408.
[85] Davies JI and WC Evans. 1964. Oxidative metabolism of naphthalene by soil
pseudomonads. Biochem J. 91: 251– 261.
[86] Kiyohara H, K Nagao and R Nami. 1976. Degradation of phenanthrene through
o- phthalate by Aeromonas sp. Agric. Biol. Chem. 40:1075–1082.
[87] Eaton R.W. and P.J. Chapman. 1992. Bacterial metabolism of naphthalene:
construction and use of recombinant bacteria to study the ring cleavage of 1, 2 -
dihydroxynaphthalene and subsequent reactions. J. Bacteriol 174: 7542–7554.

85
[88] Grund, A.D. and I.C. Gunsalus. 1983. Cloning of genes for naphthalene
metabolism in Pseudomonas putida. J. Bacteriol. 156: 89–94.
[89] Haigler, B.E., G.R. Johnson, W-C Suen, and J.C. Spain. 1999. Biochemical and
genetic evidence for meta- ring cleavage of 2,4,5-trihydroxytoluene in
Burkholderia sp. strain DNT. J. Bacteriol. 181:965– 972.
[90] Resnick, S.M. and D.T. Gibson. 1996. Region- and sterospecific oxidation of
fluorene, dibenzofuran and dibenzothiophene by naphthalene dioxygenase from
Pseudomonas sp. strain NCIB 9816- 4. Appl. Environ. Microbiol. 62: 4073– 4080.
[91] Stegeman, J.J. et al. 2001. Cytochrome P450 1A expression in mid water fishes:
potential effects of chemical contaminants in remote oceanic zones. Environ. Sci.
Technol. 35: 54–62.
[92] Evans, W.C., Fernley, H.N. and Griths, E. 1965. Oxidative metabolism of
phenanthrene and anthracene by soil Pseudomonads. Biochem. J. 95: 819-831.
[93] Kiyohara, H., Nagao, K. and Nomi, R. 1976. Degradation of phenanthrene
through o-phthalate by an Aeromonas sp. Agric. Biol.Chem. 40: 1075-1082.
[94] Kelley, I. and C.E. Cerniglia. 1991. Metabolism of fluoranthene by a species of
Mycobacterium. J Ind Microbiol 7: 19– 26.
[95] Kelley, I., J.P. Freeman, F.E. Evans and C.E. Cerniglia. 1991. Identification of
a carboxylic acid metabolite from the catabolism of fluoranthene by a
Mycobacterium sp. Appl. Environ. Microbiol. 57: 636– 641.
[96] Weissenfels, W.D., M. Beyer, J. Klein and H.J. Rehm. 1991. Microbial
metabolism of fluoranthene: isolation and identification of ring fission products.
Appl. Microbiol. Biotechnol. 34: 528–535.
[97] Fredrickson, J.K., F.J. Workman, D.J. Brockman, S.W. Li and T.O. Stevens.
1991. Isolation and characterization of a subsurface bacterium capable of growth on
toluene, naphthalene and other aromatic compounds. Appl. Environ. Microbiol. 57:
796–803.

86
[98] Jackson, M.M., Y. Yang and P.H. Pritchard. 1999. Metabolism of fluoranthene
by Sphingomonas paucimobilis sp. strain CO6 and its proposed pathway. Abstracts
of the American Society for Microbiology 99th Meeting, p. 580.
[99] Jerina, D.M. et al. 1984. Synthesis and absolute configuration of the bacterial cis-
1,2 and cis-10,11 dihydrodiol metabolites of benz[a ]anthracene formed by a strain
of Beijerinkia. J. Org. Chem. 49: 3621–3628.
[100] Kim, E. and G.J. Zylstra. 1999. Functional analysis of genes involved in
biphenyl, naphthalene, phenanthrene and m-xylene degradation by Sphingomonas
yanoikuyae B1. J. Ind. Microbiol. Biotechnol. 23:294–302.
[101] Romine, M.F., J.K. Fredrickson and S.-M.W. Li. 1999. Induction of aromatic
catabolic activity in Sphingomonas aromaticavorans strain F199. J. Ind. Microbiol.
Biotechnol. 23:303–313.
[102] Zylstra, G.J. and Kim, E. 1997. Aromatic hydrocarbon degradation by
Sphingomonas yanoikuyae B1. J. Ind. Microbiol. Biotechnol. 19: 408–414.
[103] Takeuchi, M., Hamana, K. and Hiraishi, A. 2001. Proposal of the genus
Sphingomonas sense strict and three new genera, Sphingobium, Novosphingobium
and Sphingopyxis, on the basis of phylogenetic and chemotaxonomic analyses. Int.
J. Syst. Evol. Microbiol. 51:1405–1417.
[104] Romine, M.F. et al. 1999. Complete sequence of a 184-kilobase catabolic plasmid
from Sphingomonas aromaticivorans F199. J. Bacteriol. 181:1585–1602.
[105] Pinyakong, O., Habe, H., Yoshida, T., Nojiri, H. and Omori, T. 2003.
Identification of three novel salicylate 1-hydroxylases involved in the phenanthrene
degradation of Sphingobium sp. strain P2. Biochem. Biophys. Res. Commun. 301:
350–357.
[106] Story, S.P., Parker, S.H., Kline, J.D., Tzeng, T.J., Mueller, J.G. and Kline,
E.L. 2000. Identification of four structural genes and two putative promoters
necessary for utilization of naphthalene, phenanthrene, and fluoranthene by
Sphingomonas paucimobilis var. EPA505. Gene. 260: 155–169.

87
[107] Pinyakong, O. et al. 2004. Isolation and characterization of genes encoding
polycyclic aromatic hydrocarbon dioxygenase from acenaphthene and
acenaphthylene degrading Sphingomonas sp. strain A4. FEMS. Microbiol. Lett.
238: 297–305.
[108] Romine, M. F. et al. 1999. Complete sequence of a 184-kilobase catabolic plasmid
from Sphingomonas aromaticivorans F199. J. Bacteriol. 181:1585–1602.
[109] Assinder, S.J. and P.A. Williams. 1990. The TOL plasmids: determinants of the
catabolism of toluene and the xylenes. Adv. Microb. Physiol. 31:1–69.
[110] Yen, K.M. and C.M. Serdar. 1988. Genetics of naphthalene catabolism in
Pseudomonads. Crit. Rev. Microbiol. 15: 247–267.
[111] Zylstra, G.J. 1995. Molecular analysis of aromatic hydrocarbon degradation. In:
Molecular Environmental Biology (Garte SJ, ed), pp 83–115, Lewis Publishers,
Boca Raton, FL.
[112] Furukawa K. 1995. Molecular genetics and evolutionary relationship of PCB-
degrading bacteria. Biodegradation 5:289–300.
[113] Denome, S.A., D.C. Stanley, E.S. Olson and K.D. Young. 1993. Metabolism of
dibenzothiopHene and naphthalene in Pseudomonas strains: complete DNA
sequence of an upper naphthalene catabolic pathway. J. Bacteriol. 175: 6890–6901.
[114] Pinyakong, O., H. Habe, T. Yoshida, H. Nojiri, and T. Omori. 2003.
Identification of three novel salicylate 1-hydroxylases involved in the phenanthrene
degradation of Sphingobium sp. strain P2. Appl. Environ. Microbiol. 301:350–357.
[115] Wattiau, P., L. Bastiaens, R. van Herwijnen, L. Daal, J. R. Parsons, M. E.
Renard, D. Springael, and G. R. Cornelis. 2001. Fluorene degradation by
Sphingomonas sp. LB126 proceeds through protocatechuic acid: a genetic analysis.
Res. Microbiol. 152:861–872.
[116] Gibson, D. T., V. Mahadevan, D. M. Jerina, H. Yogi, and H. J. Yeh. 1975.
Oxidation of the carcinogens benzo[a]pyrene and benzo[a]anthracene to
dihydrodiols by a bacterium. Science. 189:295–297.

88
[117] Zylstra, G. J., and E. Kim. 1997. Aromatic hydrocarbon degradation by
Sphingomonas yanoikuyae B1. J. Ind. Microbiol. Biotechnol. 19:408–414.
[118] Pinyakong, O., H. Habe, and T. Omori. 2003. The unique aromatic catabolic
genes in sphingomonads degrading polycyclic aromatic hydrocarbons (PAHs). J.
Gen. Appl. Microbiol. 49:1–19.
[119] Furukawa, K. and Miyazaki, T. 1986. Cloning of gene cluster encoding biphenyl
and chlorobiphenyl degradation of Pseudomonas pseudoalcaligenes. J.
Bacteriology. 172:1160-1164.
[120] Sylvestre, M. et al. 1996. Characterization of active recombinant 2,3-dihydro-2,3-
dihydroxybipHenyl dehydrogenase from Comamonas testosteroni B-365 and
sequence of encoding gene (bphB). Appl. Environ. Microbiol. 62:2710-2715.
[121] Khan, A.A. et al. 1996. Purification of 2,3-dihydroxybipHenyl 1,2-dioxygenase
from Pseudomonas putida OU83 and characterization of the gene (bphC). Appl.
Environ. Microbiol. 62:1825-1830.
[122] Furukawa, K. and Arimura, N. 1987. Purification and properties of 2,3-
dihydroxybiphenyl dioxygenase from chlorinated biphenyl-degrading
Pseudomonas pseudoalcaligenes and Pseudomonas aeruginosa carrying the cloned
bphC gene. J. Bacteriol. 169:924-927.
[123] Ye, D. et al 1996. Degradation of polynuclear aromatic hydrocarbons by
Sphingomonas paucimobilis. Environ. Sci. Technol. 30:136–142.
[124] Story, S.P., S.H. Parker, S.S. Hayasaka, M.B. Riley, and E.L. Kline. 2001.
Convergent and divergent points in catabolic pathways involved in utilization of
fluoranthene, naphthalene, anthracene, and phenanthrene by Sphingomonas
paucimobilis var. EPA505. Journal of Industrial Microbiology & Biotechnology.
26: 369 –382.
[125] Shizuya, H., UG Kim, V., Mancino, T. Slepak, , Y. Tachiiri, M Simon. 1992.
Cloning and stable maintenance of 300-kilobase-pair fragments of human DNA in
Escherichia coli using an F-factor-based vector. Proc. Natl. Acad. Sci. U. S. A.
89:8794–8797.

89
[126] Amemiya C.T., T.P. Zhong, G.A. Silverman, M.C Fishman, and L.I. Zon.
1999. Zebrafish YAC, BAC, and PAC genomic libraries. Methods. Cell. Biol.
60:235– 258.
[127] Kim C.B., C. Amemiya, W. Bailey, K. Kawasaki, J. Mezey, and W.
Miller.2000. Hox cluster genomics in the horn shark, Heterodontus francisci. Proc.
Natl. Acad. Sci. U. S. A. 97: 1655– 1660.
[128] Chen R., E. Sodergren, G.M. Weinstock, R.A. Gibbs. 2004. Dynamic building
of a BAC clone tiling path for the Rat Genome Sequencing. Project. Genome Res.
14: 679–684.
[129] Brownlie A., A. Donovan, S.J. Pratt, B.H.Paw, and A.C. Oates, 1998. Positional
cloning of the zebrafish sauternes gene: a model for congenital sideroblastic
anemia. Nat. Genet. 20: 244–250.
[130] Brown A. Sequencing, sub-cloning, expression and purification of 2-hydroxy
chromene-2-carboxylate isomerase from Sphingomonas paucimobilis EPA505.
2008. MS Thesis. Department of Biological Sciences. Clemson University.
[131] Tamura K, Dudley J, Nei M & Kumar S. 2007. MEGA4: Molecular
Evolutionary Genetics Analysis (MEGA) software version 4.0. Mol. Biol. Evol.
24:1596-1599.