september - november 2011 session 2 – valuation september-november 2011 markokes-voysey
TRANSCRIPT

September - November 2011
Session 2 – Valuation
September-November 2011
MarkOkes-Voysey

September - November 2011Slide 2
Course outline 2nd week
1. Strategic overview – why deals?
2. Pricing and negotiating a deal – valuation methods and other key terms
3. Dealing with risk and the role of due diligence + integration planning
4. Tax – risks and planning aspects
5. Legal documents (+ presentation of team game)
6. Team game; your presentations
7. Test
September - November 2011Slide 3
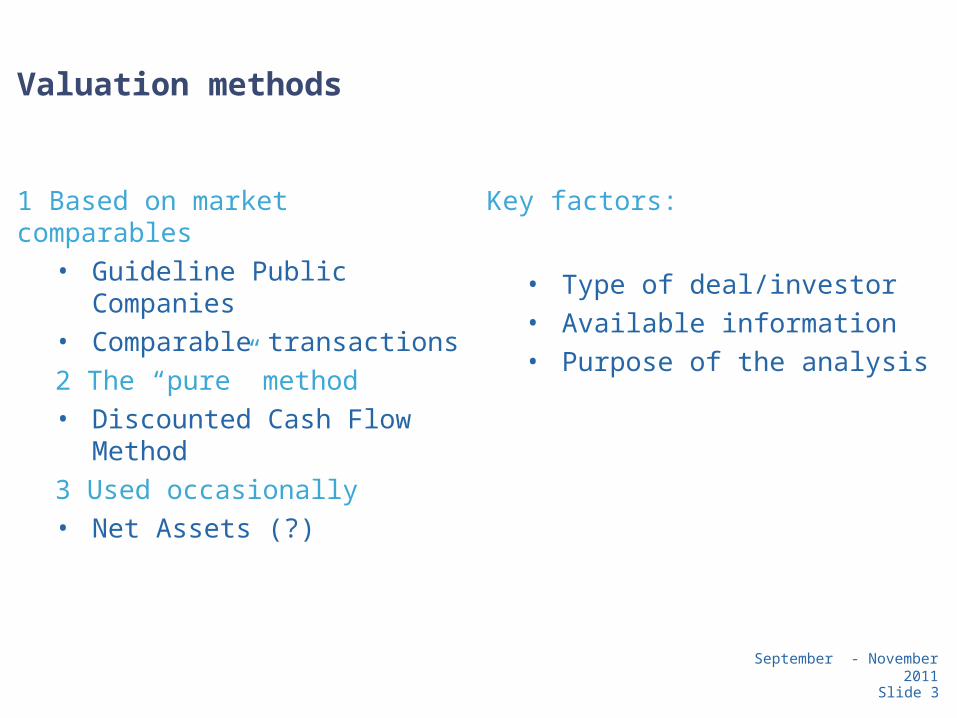
Valuation methods
1 Based on market comparables• Guideline Public Companies• Comparable transactions
2 The “pure” method• Discounted Cash Flow Method
3 Used occasionally• Net Assets (?)
Key factors:
• Type of deal/investor• Available information• Purpose of the analysis

September - November 2011
Reminder what is value?
We said last week it was the net present value of future cash flows:
For non-financial people remember the example. How much would you get in a years time if you invest 10 rubles at an interest rate of 10%. The answer is 11. In this simple example 10 is the NPV of 11.
Cash flow year 1+ Cash flow year 2 …….Cash flow yearn
NPV = (1+i) (1+i)2 (1+i)n
Slide 4

September - November 2011Slide 5
Cash Flow Methods
Key parameters:• Length of the forecast period• Terminal value: Gordon’s growth model vs exit multiples• Cash flow on equity/invested capital• Discount rate• Final adjustments (control, marketability, liquidity)

September - November 2011
Illustrative example
• A-Mart is a successful business company with financial results as shown opposite.
• Historically it has grown with the market. The market is expected to grow by 5% a year into the foreseeable future. The new general director at the target however believes the target will outperform market growth by 20 %.
• Salaries comprise 20% of the total costs but the company has historically paid at the lower end of the market (10%) below competitors. Management believes this is sustainable even though there is tension with the trade unions over the issue.
• The company sold last year its last plot of land that it did not need for the business for a profit of £50.
• The company has not paid taxes on its profits because of brought forward losses. There are £100 of losses still to be used in the future. Management is seeking advice as to how to legally reduce its future tax charge.
• The company has borrowed heavily and has bank debt at a reasonable interest rate of £500.
• In a recent deal another retailer in a similar market was sold for 5 times EBITDA which represented 2x sales. Similar quoted companies are trading at EBITDA multiples of 4 to 6 times.
2008 2009 2010
Sales 1000 1080 1200
Cost of materials (500) (540) (600)
Depreciation (100) (100) (110)
Salary costs (150) (160) (180)
Other expenses (30) (35) (40)
Profit on sale of land - - 50
Operating profit 220 245 320
Interest on loan (50) (50) (50)
Profit before taxation
170 195 270
Tax at 24% - - -
Profit after tax 170 195 270
EBITDA 320 345 430
Cash flow 270 295 540
Slide 6

September - November 2011
So we need to build a cash flow model. We agree with the sellers that 5 years is a reasonable period. We both agree that beyond the 5th year the business will be very stable.
Slide 7
2011 2012 2013 2014 2015 Comments
Sales 1260 1323 1389 1458 1531 Market
Cost of materials (630) (662) (695) (729) (766) Constant %
Depreciation - - - - - Not cash
Salary costs (189) (203) (219) (235) (253) Increasing gradually (15% of sales to 16.5%)
Other expenses (45) (50) (55) (60) (65) Increasing gradually
Profit on sale of land - - - - - Not sustainable
Interest on loan (50) (50) (50) (50) (50) Simple assumption
EBITDA* 346 358 370 384 397
Taxation (remember the losses & depreciation!)
(33) (59) (62) (66) (69)
Cash flow 313 299 308 318 328
* In reality there would normally be adjustments between EBITDA and cash flow for items such as working capital movements.
September - November 2011
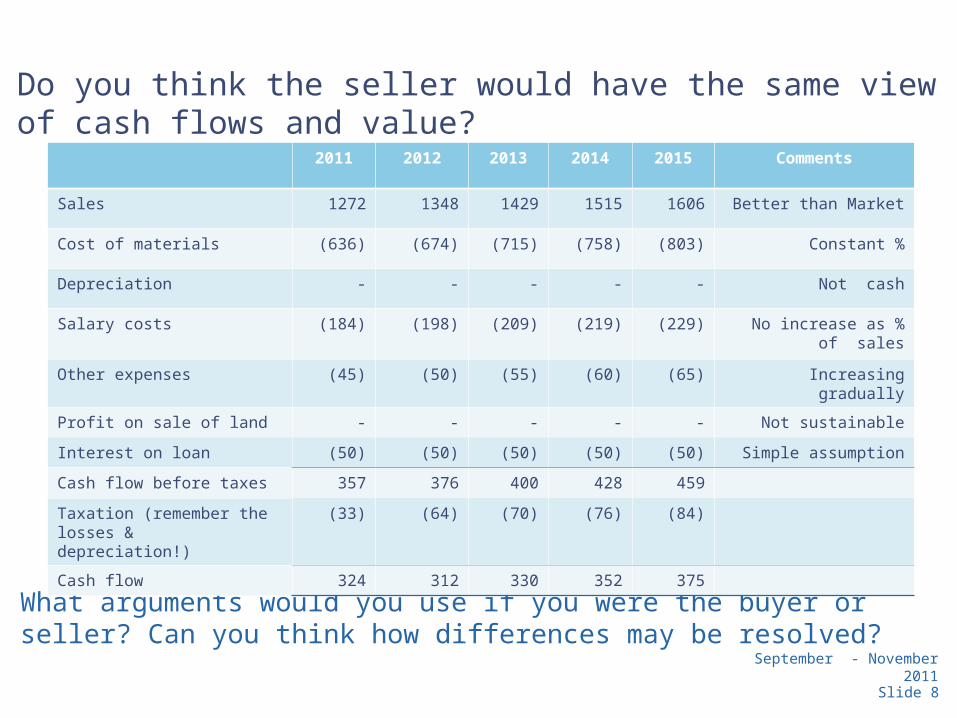
Do you think the seller would have the same view of cash flows and value?
Slide 8
What arguments would you use if you were the buyer or seller? Can you think how differences may be resolved?
2011 2012 2013 2014 2015 Comments
Sales 1272 1348 1429 1515 1606 Better than Market
Cost of materials (636) (674) (715) (758) (803) Constant %
Depreciation - - - - - Not cash
Salary costs (184) (198) (209) (219) (229) No increase as % of sales
Other expenses (45) (50) (55) (60) (65) Increasing gradually
Profit on sale of land - - - - - Not sustainable
Interest on loan (50) (50) (50) (50) (50) Simple assumption
Cash flow before taxes 357 376 400 428 459
Taxation (remember the losses & depreciation!)
(33) (64) (70) (76) (84)
Cash flow 324 312 330 352 375

September - November 2011
Calculating value (assuming a 15% discount rate)
Buyer
NPV =313 + 299 + 308 + 318 + 328 + 328/0∙15
1∙15 1∙15 2 1∙15 3 1∙15 4 1∙15 5 1∙15 5
Share Value = 2139 – 500 = 1639
Seller
NPV =324 + 312 + 330 + 352 + 375 + 375/0∙15
1∙15 1∙15 2 1∙15 3 1∙15 4 1∙15 5 1∙15 5
NPV = 2374
Share Value = 2374 – 500 = 1874
Slide 9

September - November 2011
Using multiples based on comparables
Sales 1200 x 2 = 2400
EBITDA 4 to 6 x 430 = 1720 to 2580
or 4 to 6 x 380 (exclude land!) = 1520 to 2280
What would you argue if you were selling / buying?
Slide 10

September - November 2011Slide 11
Final conclusion and adjustments to the result
• Scenario analysis• Sensitivity test• Discounts and premiums for control/marketability
September - November 2011Slide 12
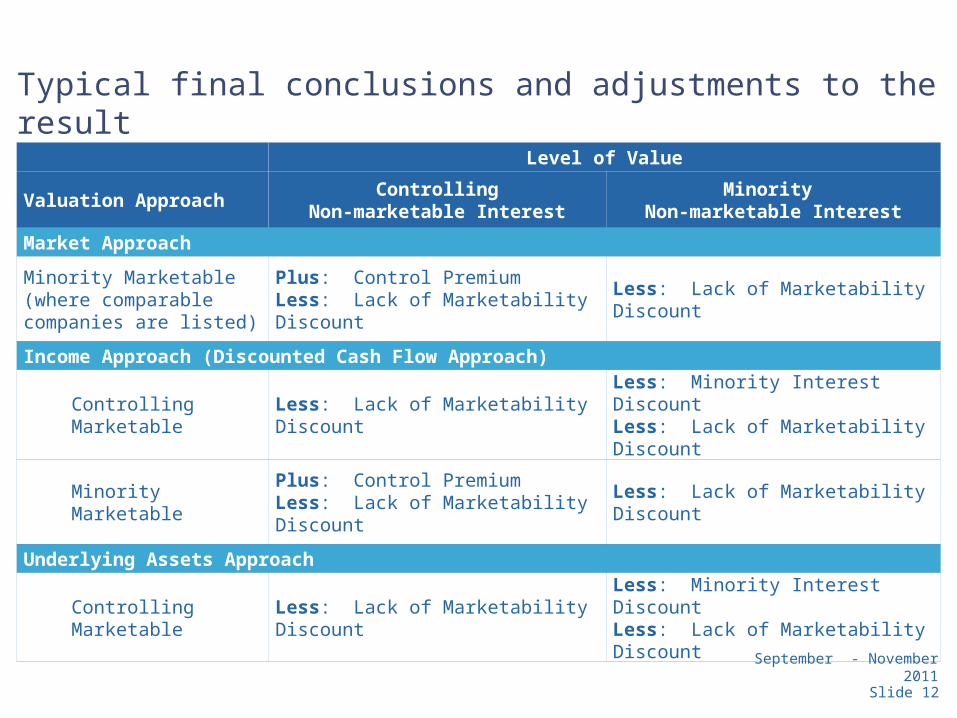
Typical final conclusions and adjustments to the result
Level of Value
Valuation ApproachControlling
Non-marketable InterestMinority
Non-marketable Interest
Market Approach
Minority Marketable (where comparable companies are listed)
Plus: Control PremiumLess: Lack of Marketability Discount
Less: Lack of Marketability Discount
Income Approach (Discounted Cash Flow Approach)
Controlling Marketable Less: Lack of Marketability DiscountLess: Minority Interest DiscountLess: Lack of Marketability Discount
Minority MarketablePlus: Control PremiumLess: Lack of Marketability Discount
Less: Lack of Marketability Discount
Underlying Assets Approach
Controlling Marketable Less: Lack of Marketability Discount Less: Minority Interest DiscountLess: Lack of Marketability Discount

September - November 2011
Thank you!
Slide 13