september 26, 2011 steps to continuous improvement using a “systems approach”
TRANSCRIPT

September 26, 2011
Steps to Continuous Improvement
Using a “Systems Approach”

Examine Data Identify Trend Identify Gap Identify Root Cause Modify Goals (depending upon last years outcome)
Align Staff Development Develop Measurement Tools
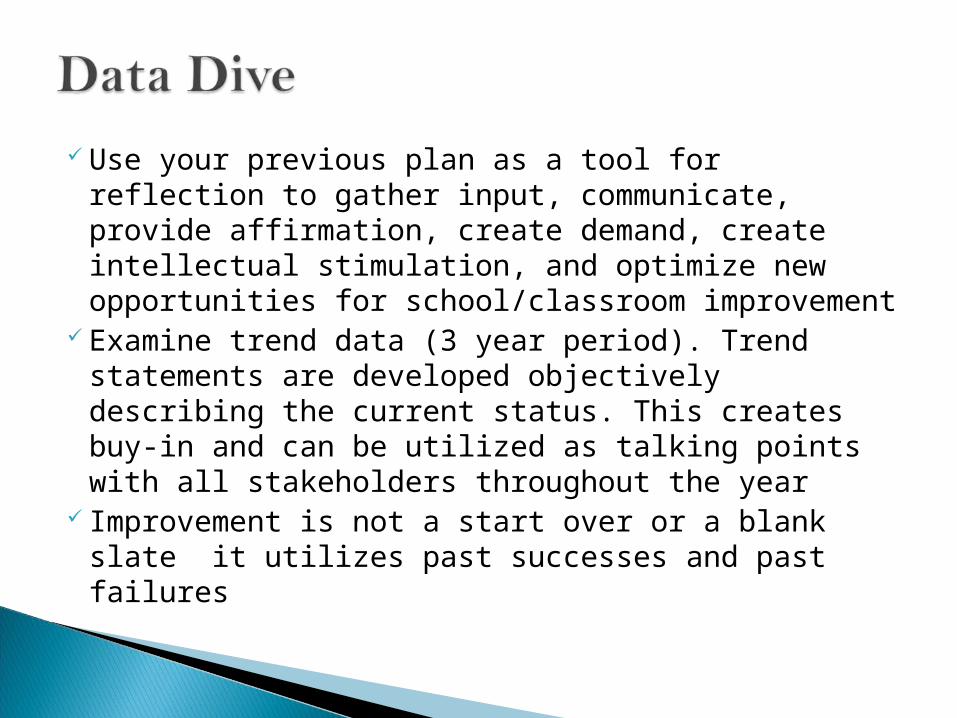
Use your previous plan as a tool for reflection to gather input, communicate, provide affirmation, create demand, create intellectual stimulation, and optimize new opportunities for school/classroom improvement
Examine trend data (3 year period). Trend statements are developed objectively describing the current status. This creates buy-in and can be utilized as talking points with all stakeholders throughout the year
Improvement is not a start over or a blank slate it utilizes past successes and past failures

Exceeds (86.4%)*
Meets (65.2%)*
Approach 43.9%)*
FFB (0.0%)* Ex Meets App FFB Ex Meets App FFB
NC DVUSD
Fall 3 12 40 35 3% 13% 44% 39% 4% 12% 34% 50%Feb 5 35 42 15 5% 36% 43% 15% 6% 35% 43% 15%Q4 18 32 34 11 19% 34% 36% 12% 12% 34% 38% 16% 93% 91%
39 43 13 6 39% 43% 13% 6% 32% 46% 17% 6%Fall 3 12 23 51 3% 13% 26% 57% 2% 15% 24% 59%Feb 0 28 35 26 0% 31% 39% 29% 6% 30% 37% 28%Q4 7 27 21 17 10% 38% 29% 24% 15% 35% 25% 25% 64% 77%
33 53 13 6 30% 48% 15% 7% 36% 39% 17% 8%Fall 1 23 37 20 1% 28% 46% 25% 2% 27% 38% 32%Feb 11 29 33 13 13% 34% 38% 15% 14% 28% 33% 24%Q4 7 35 24 21 8% 40% 28% 24% 7% 29% 27% 37% 95% 90%
33 40 13 3 37% 45% 15% 3% 28% 45% 18% 10%Fall 7 24 25 27 8% 29% 30% 33% 8% 25% 29% 37%Feb 7 21 26 32 8% 24% 30% 37% 8% 25% 27% 40%Q4 10 33 27 25 11% 35% 28% 26% 16% 27% 26% 31% 92% 80%
47 32 15 6 47% 32% 15% 6% 35% 35% 18% 12%Fall 0 0 0 1 0% 0% 0% 100% 2% 25% 27% 46%
Spring 4 15 41 38 4% 15% 42% 39% 6% 24% 36% 34% 99% 78%27 43 17 14 27% 43% 17% 14% 30% 40% 17% 14%
Fall 4 29 21 45 4% 29% 21% 45% 13% 41% 23% 23%Spring 25 33 17 26 25% 33% 17% 26% 24% 34% 15% 27% 98% 82%
18 46 18 21 17% 45% 17% 20% 25% 43% 13% 19%* % indicates minimum cut score for FAME category (3rd grade example)
Blue font indicates new information.
Participation Rate
8th grade
DVR Math Performance
Number Percent DVUSD Percent
7th grade
3rd Grade
4th Grade
5th Grde
6th Grade
AIMS 2011
AIMS 2011
AIMS 2011
AIMS 2011
AIMS 2011
AIMS 2011

The gap is the difference between the current status and the goal
The root cause is the hypothesis of why there is a gap
The root cause is something we own – we recognize what areas we don’t control but select root causes we own

Continue to ask why until you no longer need to ask why…
Select an instructional strategy that you believe will address the root cause.

How will the specific instructional strategy be repeatable and predictable in every classroom?
Results - achievement that will improve because we have bridged the root cause of the identified gap
Transfer - implementation of the strategy using quality, fidelity, consistency, intensity
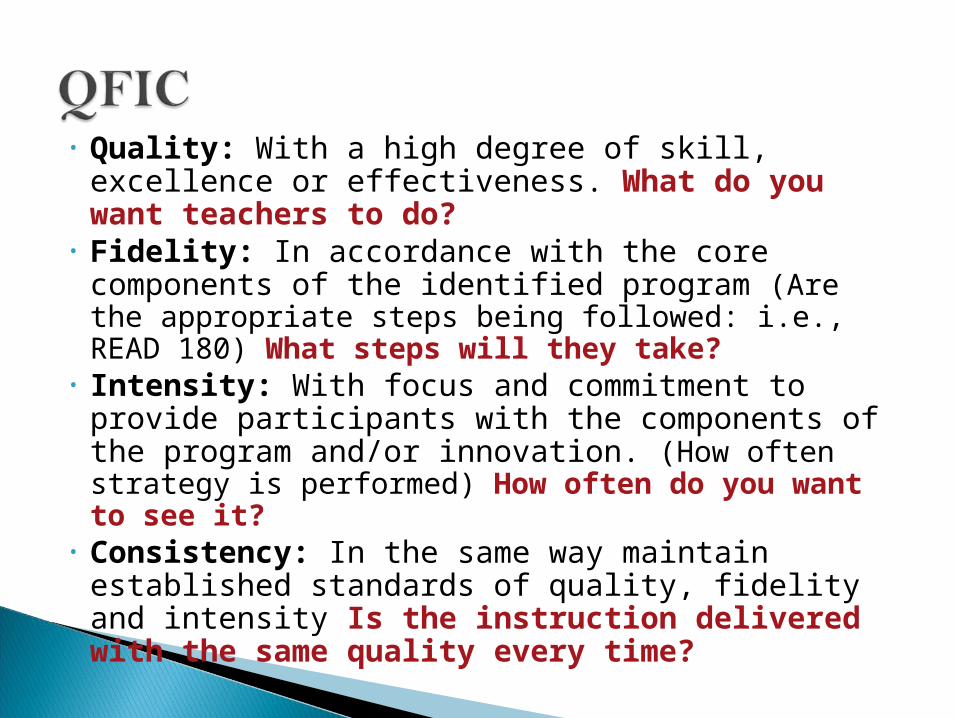
• Quality: With a high degree of skill, excellence or effectiveness. What do you want teachers to do?
• Fidelity: In accordance with the core components of the identified program (Are the appropriate steps being followed: i.e., READ 180) What steps will they take?
• Intensity: With focus and commitment to provide participants with the components of the program and/or innovation. (How often strategy is performed) How often do you want to see it?
• Consistency: In the same way maintain established standards of quality, fidelity and intensity Is the instruction delivered with the same quality every time?


Twice a year with 100% consistency we will complete a vacation that engages us in activities away from home that will result in total relaxation and rejuvenation as measured by the following:
Making reservations at a four star or better hotel with views of water.
The hotel should maintain a full treatment spa and gym.
There should be multiple dining experiences with a variety of menus and styles.
The visiting venue should have near by activities that are of high interest to both of us.

Each teacher during a unit of study will use small group instruction a minimum of two times. Students will be grouped based on unit pre and formative assessments and instruction will be tailored to the needs of the students at the appropriate level of difficulty. Post assessments will include whole group instruction as well as content from small group instruction. Instruction must include all of these components:
Instruction begins with a set and advance organizers providing students with needed learning
Instruction includes all five steps of modeling or talk aloud
Instruction includes multiple checks for understanding and student closure
Professional development is about improvement
Professional development is aligned to the root cause and instructional strategy must be measurable (pd focuses on researched based strategies that improve learning)

Visual Thinking Strategies Guided Reading
Small Group Instruction Skill Focused Work Curriculum Compacting Tiered Assignments Flexible Grouping HOT and Inquiry Vocabulary and Word Play Re-
teaching/Re-testingStudent Goal Setting
Specific/Timely Feedback

Advance Organizers for Texts Summary Frames
Rule Based Summarization Reciprocal Reading
Model Fluent Reading Repeated Readings In Class
Promote Phrased Reading In Class Reader's Theater
Small Group Instruction Skill Focused Work
Curriculum Compacting Tiered Assignments
Flexible Grouping High-Level Thinking and Inquiry
Re-teaching/Re-testing Student Goal Setting
Specific and Timely Feedback Skimming and Pre-reading

Plan Be strategic and aligned in your planning Define expectations including what is considered quality, fidelity,
intensity, and consistency Communicate goals repetitively and in a multitude of ways Determine measures and time frames for checking: CWT, lesson
plans, etc.,
Do Implement with a focus on quality, fidelity, intensity, and consistency
Study Strategies require short cycles, data should be collected in results
and check for transfer Using the short cycle data, the plan should be updated and
communicated Make changes and go at it again
ACT Just Do it!

Use either the word or excel CIP document to support your work (don’t spend more time on completing the document than the work itself)
Schools participate in the school to school buddy system: November / April - THIS IS OPTIONAL
Schools submit a quarterly PDSA for the identified school wide focus strategy implemented along with a QFIC analysis regarding the strategy (in one content area)
Determine how to measure and report Quality, Fidelity, Intensity and Consistency as it relates to the instruction strategy implemented which aligns to the root cause
Schools will submit end of year CIP with a reflection
Thank you for your active participation in our continuous learning process.
http://noteacherleftbehinddvusd.wikispaces.com/