september 2018 - eb.momentum.co.za · this portfolio replaced the trustee choice portfolio from 1...
TRANSCRIPT
december 2018

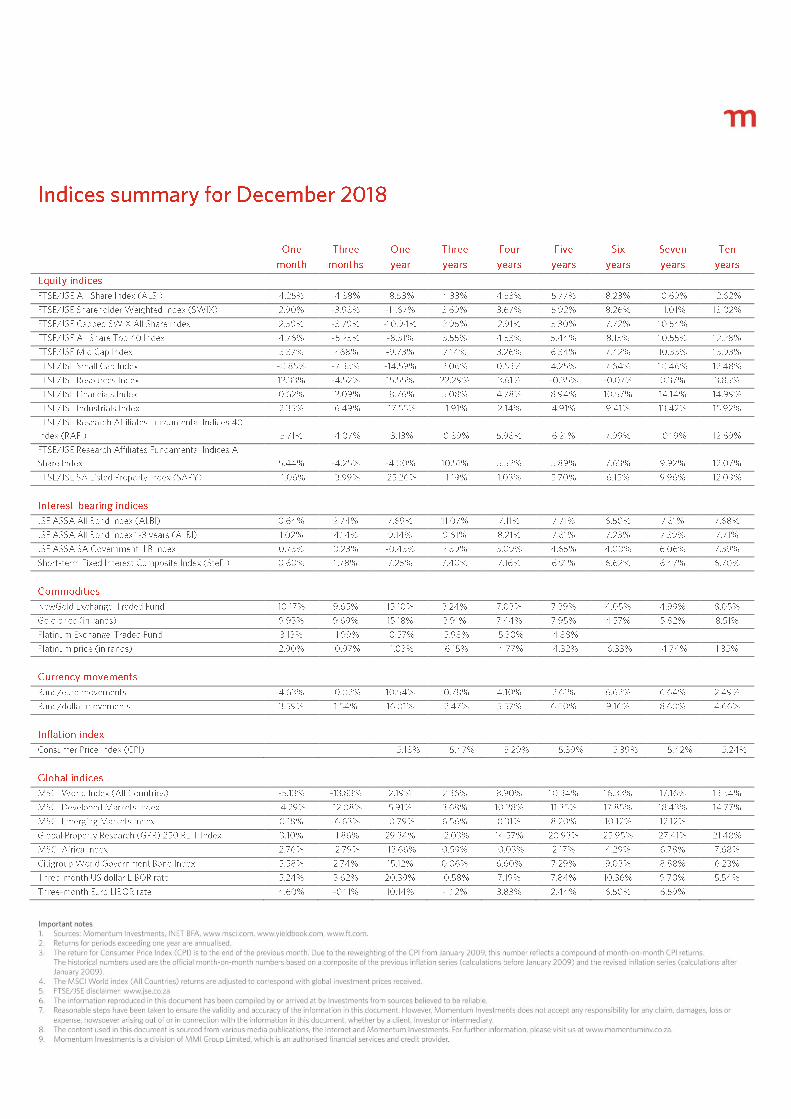
1.5
2
2.5
3
Dec-17 Apr-18 Jul-18 Nov-18
%
US 2018 GDP US 2019 GDP
US core PCE 2018 US core PCE 2019

1
1.5
2
2.5
Dec-17 Apr-18 Jul-18 Nov-18
%
Eurozone 2018 GDP Eurozone 2019 GDP
Eurozone CPI 2018 Eurozone CPI 2019
1
1.5
2
2.5
3
Dec-17 Apr-18 Jul-18 Nov-18
%
UK GDP 2018 UK GDP 2019
UK CPI 2018 UK CPI 2019

2
3
4
5
6
7
Dec-17 Apr-18 Jul-18 Nov-18
%
China GDP 2018 China GDP 2019
China CPI 2018 China CPI 2019

0
1
2
3
4
5
6
Dec-17 Apr-18 Jul-18 Nov-18
%
SA GDP 2018 SA GDP 2019
SA CPI 2018 SA CPI 2019

96
98
100
102
104
106
30 Nov 18 07 Dec 18 14 Dec 18 21 Dec 18 28 Dec 18
Indexed to 100
ALSI ALBI
Listed property Cash
ILBI

Momentum default lifestage portfolio range
returns for december 2018
Lifestage progression
The portfolio range has a lifestage model, which allows a member of a retirement fund to switch from a more aggressive investment portfolio with longer
terms to retirement to more conservative and, ultimately, defensive portfolios as a member approaches retirement. The lifestage model uses a
combination of asset classes, managed by multiple investment managers with different investment strategies to achieve its objectives. The lifestage
philosophy uses ‘term to retirement’ as a proxy for the risk a member is able to adopt. This means, for example, the asset classes in which members of
a retirement fund would invest in more than 7 years from retirement will have a different emphasis from those closer to retirement. It stands to reason
that when a member of a retirement fund has a long-term investment horizon, the member should be invested in growth asset classes, which would
include a significant allocation to higher yielding asset classes and strategies also characterised by a higher level of risk (such as local equities and
property as well as global equities). Although these asset classes are volatile, they provide returns above inflation over the long term. However, as a
member moves to a medium-term investment horizon, the exposure to volatile asset classes should be gradually reduced to protect members in a
retirement fund from being exposed to unnecessary volatility.
Momentum’s purpose is to enhance the lifetime financial wellness of people, their communities and their businesses, building a reputation for innovation
and trustworthiness. In this way, we aim to become the preferred lifetime financial wellness partners to our clients. In keeping with the financial wellness
framework, we have developed an investment philosophy that maximises the probability of you achieving your unique investment goals. We call this
investment approach Momentum Investments’ outcome-based investing. In response to the ever-evolving investment landscape, we manage our
portfolios in such a way that they set their sights beyond mere benchmarks and instead focus on the things that matter the most to you – ensuring we
maximise the probability of you achieving your investment goals. This portfolio range is managed using the outcome-based investment philosophy.
The below new fee scale is effective 1 July 2018. The asset management fees exclude performance fees where applicable, as well as investment
management fees recovered by the underlying investment managers within the portfolio.

Investment portfolio allocation Portfolio Building block Term to retirement
Momentum Default Lifestage Accumulator Momentum Enhanced Factor 7 Portfolio More than seven years to retirement
Momentum Default Lifestage Builder Momentum Enhanced Factor 6 Portfolio Five to seven years to retirement
Momentum Default Lifestage Consolidator Momentum Enhanced Factor 5 Portfolio Three to five years to retirement
Momentum Default Lifestage Defender Momentum Enhanced Factor 3 Portfolio Less than three years to retirement
Investment returns summary Portfolio returns
1 One Three One Three Five Since
month months year years years inception
Momentum Default Lifestage Accumulator 0.03% -6.18% -5.73% 4.06% 7.02% 13.85%
Benchmark -0.15% -5.83% -7.85% 3.44% 7.16% 13.90%
CPI+7 0.74% 2.76% 12.19% 12.47% 12.40% 12.87%
Momentum Default Lifestage Builder 0.10% -5.54% -4.15% 4.30% 7.07% 13.14%
Benchmark -0.03% -5.13% -6.24% 3.81% 7.27% 13.03%
CPI+6 0.66% 2.53% 11.19% 11.47% 11.40% 11.87%
Momentum Default Lifestage Consolidator 0.48% -4.07% -2.94% 4.65% 7.07% 10.18%
Benchmark 0.41% -3.60% -4.35% 4.50% 7.14% 10.39%
CPI+5 0.58% 2.30% 10.18% 10.47% 10.40% 10.87%
Momentum Default Lifestage Defender 0.64% -1.68% 0.32% 4.97% 6.62% 10.29%
Benchmark 0.42% -1.26% -0.64% 5.31% 6.78% 9.47%
CPI+3 0.42% 1.83% 8.18% 8.47% 8.40% 8.86%
Key:
1. The first investment from FundsAtWork in this portfolio was 1 March 2012. The inception date of the portfolios is 1 July 2011 and actual portfolio and benchmark returns have been used since then.
Portfolio and benchmark returns for longer periods are based on mappings from certain old portfolios to the new portfolios and details of these old portfolios are on the individual fund fact sheets.

Momentum Default Lifestage Portfolio Range
Momentum Default Lifestage Accumulator
December 2018
Investment strategy Investment portfolio mandate
This investment portfolio is aimed at members of a retirement fund who are in the accumulation phase of investing. These members would have a long-term investment horizon and should be invested in growth asset classes. To achieve this growth, the portfolio is benchmarked against an 85% allocation to local equities and property as well as global equities. Although these asset classes are volatile, they provide returns above inflation over the long term. The portfolio incorporates all opportunities identified and performance fees may be paid within investment mandates, should they sufficiently enhance investment returns after fees.
The long-term return objective of this portfolio is inflation plus 7% a year over seven-year rolling periods. All combinations of asset classes are considered and an optimum allocation is selected to achieve this objective with a high degree of certainty. Alternative asset-class opportunities are continually investigated. The risk of exposure to losses in the short term is continually managed by maximising diversification to predominantly active strategies within specialist investment mandates within each asset classes. This portfolio is managed in accordance with the investment limitations set out in Regulation 28 of the Pension Funds Act.
Benchmark allocation
Asset Class Allocation BenchmarkLocal equities 46.50% FTSE/JSE Shareholder Weighted Capped IndexLocal property 15.00% FTSE/JSE SA Listed Property IndexLocal bonds 4.00% JSE ASSA All Bond IndexLocal ILB 3.00% JSE ASSA Inflation-linked Government Bond IndexLocal cash 1.50% Short-term Fixed Interest Composite IndexGlobal 30.00% Composite benchmark
Investment returns
One Month
Three Months
OneYear
Three Years
Five Years
Since Inception
Portfolio 0.03% -6.18% -5.73% 4.06% 7.02% 13.85%Benchmark -0.15% -5.83% -7.85% 3.44% 7.16% 13.90%
Risk analysis
(Calculation based on five-year period) Portfolio Benchmark Volatility 8.2% 8.0%Maximum drawdown -8.9% -9.0%Worst month -4.0% -3.7%Best month 6.1% 6.4%
Portfolio Benchmark
Asset allocation
The benchmark for the local equity component was changed on 1 November 2017 from the FTSE/JSE Shareholder Weighted Index to the FTSE/JSE Shareholder Weighted Capped Index. The asset management fees exclude performance fees where applicable, as well as investment-management fees recovered by the underlying investment managers within the portfolioChanges were made to the strategic asset allocations on 30 May 2014 and the benchmark returns were changed from 1 June 2014.
Comments
Investment portfolio informationInception DateInvestment Horizon
Risk Profile
July 2018Long term
Portfolio Category New fee scale effective 1 July 2018
One Month One Year WeightingLocal equity managersMomentum Capped SWIX Index 2.60% 4.7%BlueAlpha 1.81% -9.65% 4.4%Prudential 2.42% -9.19% 6.5%Foord 2.26% -12.30% 5.8%SIM 2.68% -16.91% 5.0%Fairtree 4.90% -5.16% 6.4%Truffle 2.73% -2.91% 6.1%Perpetua 2.50% -10.13% 4.7%Local property managersMomentum Property -1.10% -22.82% 9.8%Eris 1.91% 3.1%Local cash managersALUWANI 0.72% 9.25% 0.2%Taquanta 0.71% 9.10% 0.2%Global equity managersMomentum Global Investment Management -4.71% 4.14% 24.0%Global bond managersAmundi 5.52% 14.57% 1.6%Local fixed income managersMomentum Special Opportunities 0.97% 8.91% 2.3%Momentum Flexible Bond 0.39% 7.23% 0.1%ALUWANI (ILB) 0.66% 0.84% 0.3%Prescient 0.72% 0.54% 2.4%Local alternative managersMomentum Alternative Inv. (private equity) 1.59% -8.20% 0.1%Momentum Alternative Inv. (private equity BB) 1.02% 1.73% 1.8%Momentum Moderate FoHF 0.68% 5.29% 2.1%Momentum Aggressive FoHF 0.74% -1.41% 2.4%Momentum Portable Alpha FoHF -1.08% -11.59% 2.6%Global Property managersMomentum Global Property -1.96% 3.4%Total 100%
Investment manager allocation and returns
This portfolio replaced the Trustee Choice Portfolio from 1 July 2018. The inception date of the Momentum Enhanced Factor 7 Portfolio, which is the underlying building block of the Momentum Default Lifestage Accumulator, is 1 July 2011 and portfolio and benchmark returns for the Momentum Enhanced Factor 7 Portfolio have been used since then. Portfolio and benchmark returns for Momentum High Equity Portfolio have been used from April 1999.
Notes

Momentum Default Lifestage Portfolio Range
Momentum Default Lifestage Builder
December 2018
Investment strategy Investment portfolio mandate
This investment portfolio is aimed at members of a retirement fund who are beginning to exit the accumulation phase of investing. These members would have a long-term investment horizon and should still have a significant allocation to growth asset classes. However, a small allocation to defensive asset classes is included in the portfolio. The portfolio is benchmarked against a 77.5% allocation to local equities and property as well as global equities. Although these asset classes are volatile, they provide returns above inflation over the long term. The portfolio incorporates all opportunities identified and performance fees may be paid within investment mandates, should they sufficiently enhance investment returns after fees.
The long-term return objective of this portfolio is inflation plus 6% a year over six-year rolling periods. All combinations of asset classes are considered and an optimum allocation is selected to achieve this objective with a high degree of certainty. Alternative asset-class opportunities are continually investigated. The risk of exposure to losses in the short term is continually managed by maximising diversification to predominantly active strategies within specialist investment mandates within each asset classes. This portfolio is managed in accordance with the investment limitations set out in Regulation 28 of the Pension Funds Act.
Benchmark allocation
Asset Class Allocation BenchmarkLocal equities 45.00% FTSE/JSE Shareholder Weighted Capped IndexLocal property 13.50% FTSE/JSE SA Listed Property IndexLocal bonds 7.00% JSE ASSA All Bond IndexLocal cash 2.50% Short-term Fixed Interest Composite IndexLocal ILB 3.50% JSE ASSA Inflation-linked Government Bond IndexGlobal 28.50% Composite benchmark
Investment returns
One Month
Three Months
OneYear
Three Years
Five Years
Since Inception
Portfolio 0.10% -5.54% -4.15% 4.30% 7.07% 13.14%Benchmark -0.03% -5.13% -6.24% 3.81% 7.27% 13.03%
Risk analysis
(Calculation based on five-year period) Portfolio Benchmark Volatility 7.4% 7.3%Maximum drawdown -8.1% -8.0%Worst month -3.5% -3.3%Best month 5.7% 5.9%
Portfolio Benchmark
Asset allocation
The benchmark for the local equity component was changed on 1 November 2017 from the FTSE/JSE Shareholder Weighted Index to the FTSE/JSE Shareholder Weighted Capped Index. The asset management fees exclude performance fees where applicable, as well as investment-management fees recovered by the underlying investment managers within the portfolio.Changes were made to the strategic asset allocations on 30 May 2014 and the benchmark returns were changed from 1 June 2014.
Comments
Investment portfolio informationInception DateInvestment Horizon
Risk Profile
July 2018Medium to long term
Portfolio Category New fee scale effective 1 July 2018
One Month One Year WeightingLocal equity managersMomentum Capped SWIX Index 2.60% 4.3%BlueAlpha 1.81% -9.65% 4.0%Prudential 2.42% -9.19% 5.9%Foord 2.26% -12.30% 5.3%SIM 2.68% -16.91% 4.5%Fairtree 4.90% -5.16% 5.8%Truffle 2.73% -2.91% 5.6%Perpetua 2.50% -10.13% 4.3%Local property managersMomentum Property -1.10% -22.82% 9.1%Eris 1.91% 3.2%Local cash managersALUWANI 0.72% 9.25% 0.3%Taquanta 0.71% 9.10% 0.2%Global equity managersMomentum Global Investment Management -4.71% 4.14% 22.4%Global bond managersAmundi 5.52% 14.57% 2.2%Local fixed income managersMomentum Special Opportunities 0.97% 8.91% 2.2%Momentum Flexible Bond 0.39% 7.23% 3.1%Prescient 0.72% 0.54% 4.1%Local alternative managersMomentum Alternative Inv. (private equity) 1.59% -8.20% 0.1%Momentum Alternative Inv. (private equity BB) 1.02% 1.73% 2.0%Momentum Moderate FoHF 0.68% 5.29% 1.3%Momentum Aggressive FoHF 0.74% -1.41% 3.4%Miton Optimal (Commodity) 3.01% 7.78% 1.0%Momentum Portable Alpha FoHF -1.08% -11.59% 2.7%Global Property managersMomentum Global Property -1.96% 3.0%Total 100%
Investment manager allocation and returns
This portfolio replaced the Trustee Choice Portfolio from 1 July 2018. The inception date of the Momentum Enhanced Factor 6 Portfolio, which is the underlying building block of the Momentum Default Lifestage Builder Portfolio, is 1 July 2011 and portfolio and benchmark returns for the Momentum Enhanced Factor 6 Portfolio have been used since then. Portfolio and benchmark returns for Momentum Balanced Portfolio have been used from April 1999.
Notes

Momentum Default Lifestage Portfolio Range
Momentum Default Lifestage Consolidator
December 2018
Investment strategy Investment portfolio mandate
This investment portfolio is aimed at members of a retirement fund who are in the consolidation phase of investing. These members would have a medium-to long-term investment horizon and should be invested in a balance of growth and defensive asset classes. This is achieved by the portfolio being benchmarked against a 62.5% benchmark allocation to local equities and property as well as global equities to achieve growth. The remaining 37.5% is benchmarked against investments that should preserve the purchasing power of the capital accumulated. The portfolio incorporates all opportunities identified and performance fees may be paid within investment mandates, should they sufficiently enhance investment returns after fees.
The long-term return objective of this portfolio is inflation plus 5% a year over five-year rolling periods. All combinations of asset classes are considered and an optimum allocation is selected to achieve this objective with a high degree of certainty. Alternative asset-class opportunities are continually investigated. The risk of exposure to losses in the short term is continually managed by maximising diversification to predominantly active strategies within specialist investment mandates within each asset classes. This portfolio is managed in accordance with the investment limitations set out in Regulation 28 of the Pension Funds Act.
Benchmark allocation
Asset Class Allocation BenchmarkLocal equities 40.00% FTSE/JSE Shareholder Weighted Capped IndexLocal property 12.00% FTSE/JSE SA Listed Property IndexLocal bonds 10.00% JSE ASSA All Bond IndexLocal cash 7.50% Short-term Fixed Interest Composite IndexLocal ILB 10.00% JSE ASSA Inflation-linked Government Bond IndexGlobal 20.50% Composite benchmark
Investment returns
One Month
Three Months
OneYear
Three Years
Five Years
Since Inception
Portfolio 0.48% -4.07% -2.94% 4.65% 7.07% 10.18%Benchmark 0.41% -3.60% -4.35% 4.50% 7.14% 10.39%
Risk analysis
(Calculation based on five-year period) Portfolio Benchmark Volatility 6.1% 5.9%Maximum drawdown -6.7% -6.3%Worst month -2.9% -2.6%Best month 4.8% 4.8%
Portfolio Benchmark
Asset allocation
The benchmark for the local equity component was changed on 1 November 2017 from the FTSE/JSE Shareholder Weighted Index to the FTSE/JSE Shareholder Weighted Capped Index. Changes were made to the strategic asset allocations on 30 May 2014 and the benchmark returns were changed from 1 June 2014. The inception date of the Momentum Enhanced Factor 5 Portfolio, which is the underlying building block of the Momentum Default Lifestage Consolidator Portfolio, is 1 July 2011 and portfolio and benchmark returns for the Momentum Enhanced Factor 5 Portfolio have been used since then. Portfolio and benchmark returns for Momentum Moderate Lifestage Portfolio have been used from June 2010.
Comments
Investment portfolio informationInception DateInvestment Horizon
Risk Profile
July 2018Medium term
Portfolio Category New fee scale effective 1 July 2018
One Month One Year WeightingLocal equity managersMomentum Capped SWIX Index 2.60% 3.3%BlueAlpha 1.81% -9.65% 3.1%Prudential 2.42% -9.19% 4.6%Foord 2.26% -12.30% 4.1%SIM 2.68% -16.91% 3.5%Fairtree 4.90% -5.16% 4.5%Truffle 2.73% -2.91% 4.4%Perpetua 2.50% -10.13% 3.3%Local property managersMomentum Property -1.10% -22.82% 9.2%Eris 1.91% 3.6%Local cash managersALUWANI 0.72% 9.25% 0.5%Taquanta 0.71% 9.10% 0.5%Global equity managersMomentum Global Investment Management -4.71% 4.14% 14.5%Global bond managersAmundi 5.52% 14.57% 2.6%Local fixed income managersFuturegrowth 0.55% 9.10% 1.3%ALUWANI (ILB) 0.66% 0.84% 2.6%Momentum Special Opportunities 0.97% 8.91% 2.1%Momentum Flexible Bond 0.39% 7.23% 3.0%Prescient 0.72% 0.54% 6.1%Local absolute-return managersPrescient 1.33% 3.16% 2.5%Absa 0.76% 7.86% 2.5%Prudential 1.56% -5.64% 2.0%Sentio 1.42% -4.30% 1.7%Tantalum 1.83% -2.49% 1.8%Local alternative managersMomentum Alternative Inv. (private equity BB) 1.02% 1.73% 1.6%Momentum Moderate FoHF 0.68% 5.29% 2.4%Momentum Aggressive FoHF 0.74% -1.41% 3.1%Momentum Portable Alpha FoHF -1.08% -11.59% 1.7%Miton Optimal (Commodity) 3.01% 7.78% 1.0%Global Property managersMomentum Global Property -1.96% 2.8%Total 100%
Investment manager allocation and returns
This portfolio replaced the Trustee Choice Portfolio from 1 July 2018. The asset management fees exclude performance fees where applicable, as well as investment-management fees recovered by the underlying investment managers within the portfolio.
Notes

Momentum Default Lifestage Portfolio Range
Momentum Default Lifestage Defender
December 2018
Investment strategy Investment portfolio mandate
This investment portfolio is aimed at members of a retirement fund who are close to retirement. These members would have a short- to medium-term investment horizon and should be invested in predominantly defensive asset classes. This is achieved by having a 67.5% benchmark allocation to investments that should preserve the purchasing power of the capital accumulated. The portfolio incorporates all opportunities identified and performance fees may be paid within investment mandates, should they sufficiently enhance investment returns after fees.
The long-term return objective of this portfolio is inflation plus 3% a year over three-year rolling periods. All combinations of asset classes are considered and an optimum allocation is selected to achieve this objective with a high degree of certainty. Alternative asset-class opportunities are continually investigated. The risk of exposure to losses in the short term is continually managed by maximising diversification to predominantly active strategies within specialist investment mandates within each asset classes. This portfolio is managed in accordance with the investment limitations set out in Regulation 28 of the Pension Funds Act.
Benchmark allocation
Asset Class Allocation BenchmarkLocal equities 15.00% FTSE/JSE Shareholder Weighted Capped IndexLocal property 8.00% FTSE/JSE SA Listed Property IndexLocal bonds 15.00% JSE ASSA All Bond IndexLocal cash 25.00% Short-term Fixed Interest Composite IndexLocal ILB 20.00% JSE ASSA Inflation-linked Government Bond IndexGlobal 17.00% Composite benchmark
Investment returns
One Month
Three Months
OneYear
Three Years
Five Years
Since Inception
Portfolio 0.64% -1.68% 0.32% 4.97% 6.62% 10.29%Benchmark 0.42% -1.26% -0.64% 5.31% 6.78% 9.47%
Risk analysis
(Calculation based on five-year period) Portfolio Benchmark Volatility 3.7% 3.6%Maximum drawdown -3.5% -2.8%Worst month -1.7% -1.6%Best month 3.1% 2.8%
Portfolio Benchmark
Asset allocation
The benchmark for the local equity component was changed on 1 November 2017 from the FTSE/JSE Shareholder Weighted Index to the FTSE/JSE Shareholder Weighted Capped Index. Changes were made to the strategic asset allocations on 30 May 2014 and the benchmark returns were changed from 1 June 2014. The inception date of the Momentum Enhanced Factor 3 Portfolio, which is the underlying building block of the Momentum Default Lifestage Defender Portfolio, is 1 July 2011 and portfolio and benchmark returns for the Momentum Enhanced Factor 3 Portfolio have been used since then. Portfolio and benchmark returns for Momentum Absolute Strategies Portfolio have been used from January 2004.
Comments
Investment portfolio informationInception DateInvestment Horizon
Risk Profile
July 2018Short term
Portfolio Category New fee scale effective 1 July 2018
One Month One Year WeightingLocal equity managersMomentum Capped SWIX Index 2.60% 0.7%BlueAlpha 1.81% -9.65% 0.7%Prudential 2.42% -9.19% 1.0%Foord 2.26% -12.30% 0.9%SIM 2.68% -16.91% 0.7%Fairtree 4.90% -5.16% 0.9%Truffle 2.73% -2.91% 0.9%Perpetua 2.50% -10.13% 0.7%Local property managersMomentum Property -1.10% -22.82% 5.2%Eris 1.91% 3.1%Local cash managersALUWANI 0.72% 9.25% 1.8%Taquanta 0.71% 9.10% 1.8%Atlantic 0.70% 8.26% 1.9%Prescient SRI 0.70% 8.68% 2.9%Global equity managersMomentum Global Investment Management -4.71% 4.14% 9.7%Global bond managersAmundi 5.52% 14.57% 5.1%Local fixed income managersMomentum Special Opportunities 0.97% 8.91% 2.0%Momentum Flexible Bond 0.39% 7.23% 5.3%ALUWANI (ILB) 0.66% 0.84% 6.2%Prescient 0.72% 0.54% 11.1%ALUWANI 0.78% 9.19% 1.4%Local absolute-return managersPrescient 1.33% 3.16% 4.7%Absa 0.76% 7.86% 4.7%Prudential 1.56% -5.64% 3.8%Sentio 1.42% -4.30% 3.2%Tantalum 1.83% -2.49% 3.4%Local alternative managersMomentum Alternative Inv. (private equity BB) 1.02% 1.73% 1.6%Momentum Moderate FoHF 0.68% 5.29% 4.5%Momentum Aggressive FoHF 0.74% -1.41% 2.8%Miton Optimal (Commodity) 3.01% 7.78% 5.3%Global Property managersMomentum Global Property -1.96% 1.9%Total 100%
Investment manager allocation and returns
This portfolio replaced the Trustee Choice Portfolio from 1 July 2018. The asset management fees exclude performance fees where applicable, as well as investment-management fees recovered by the underlying investment managers within the portfolio.
Notes

registration number 2004/023064/07268 West Avenue Centurion 0157 PO Box 7400 Centurion 0046
Telephone +27 (12) 671 8911 Facsimile +27 (12) [email protected] www.momentuminv.co.za/MomentumOutcome-basedSolutions
Disclaimer:Momentum Outcome-based Solutions (Pty) Ltd, registration number 2004/023064/07, is an authorised financial services provider in terms of Section 8 of the Financial Advisory and Intermediary Services Act, 37 of 2002 (FAIS Act), as amended, FSP licence number 19840. This information is not advice as defined and contemplated in the FAIS Act. The company is also registered as an administrator in terms of Section 13B of the Pension Funds Act, registration number 24/401. Momentum Outcome-based Solutions (Pty) Ltd is a division of MMI Group Limited, which is an authorised financial services and credit provider.
Given that past returns may not be indicative of future returns and the value of investments will fluctuate over time, independent professional advice should always be sought before making an investment decision. MMI Group Limited�s responsibility in connection with the information in this document is limited to its assumed liability in terms of the retirement fund policy. Published promotional material, the application form, its appendices and any other administration forms containing details of the portfolio(s) and underlying investments should all be read in conjunction with the policy as they form part of the policy contract between MMI Group Limited and the retirement fund. Full terms and conditions on the portfolio are set out in the MMI Group Limited policy. Transactions such as investments in, disinvestment from, switching from and the provision of policy benefits and payment of consideration are subject to the terms and conditions of the policy and in the event of any conflict between the terms and conditions of this document and the policy, the terms and conditions of the policy will prevail. The asset allocation of the portfolio is managed in accordance with the investment limitations set out in Regulation 28 of the Pension Funds Act, 24 of 1956, as amended, and the limits of the type of investments in which the portfolio may be invested may be amended from time to time. The policy fee includes investment-management fees earned by investment managers appointed by Momentum Outcome-based Solutions (Pty) Ltd to manage the investments in respect of the portfolio. The retirement fund agrees Momentum Outcome-based Solutions (Pty) Ltd and the investment managers are paid out of the policy fee. However, in certain instances (such as the private equity, commodity and fund-of-hedge-fund components), a portfolio may include underlying Investments where fees are deducted from the investment return and not paid out of the policy fee. The policy fee excludes a performance-based fee, except where the retirement fund has specifically agreed that a performance-based fee be included in the policy fee. Such a performance-based fee will be paid by Momentum Outcome-based Solutions (Pty) Ltd on behalf of MMI Group Limited, in its sole discretion, to the underlying investment managers or to Momentum Outcome-based Solutions (Pty) Ltd itself if agreed to by the retirement fund. Momentum Outcome-based Solutions (Pty) Ltd will disclose the performance-based fee paid as well as the basis of its calculation to the retirement fund on request.
The information reproduced in this document has been compiled by or arrived at by Momentum Outcome-based Solutions (Pty) Ltd from sources believed to be reliable. Although reasonable steps have been taken to ensure the validity and accuracy of the information in this document, Momentum Outcome-based Solutions (Pty) Ltd does not accept any responsibility for any claim, damages, loss or expense, howsoever arising, out of or in connection with the information in this document, whether by a client, investor or intermediary. The information and any view or opinion contained in this report is proprietary to Momentum Outcome-based Solutions (Pty) Ltd and is protected by copyright under the Berne Convention. In terms of the Copyright Act, 98 of 1978, as amended, this report or any part thereof may not be reproduced or transmitted in any form or by any means, electronic or mechanical, including photocopying, recording or by any information storage and retrieval system, without prior permission in writing from Momentum Outcome-based Solutions (Pty) Ltd. The illegal and unlawful or attempted illegal and unlawful copying or use of this information or views may result in criminal or civil legal liability.
FTSE/JSE disclaimer: www.jse.co.za.
Momentum Outcome-based Solutions
investments