september 2016 ceri commodity report — natural gas report_september_2016... · soal gas itygate,...
TRANSCRIPT

Relevant • Independent • Objective
Figure 1: Henry Hub Natural Gas Spot Prices (US$ per MMBtu)
Source: EIA7
Figure 2 illustrates various monthly bid-week spot natural gas prices for October 1. Market centers illustrated include Henry Hub, AECO-C (Alberta), PG&E Malin, Chicago Citygate, Dawn (Ontario), Texas East M-3, SoCal Gas Citygate, CIG Rockies, El Paso San Juan and Leidy Hub. While Henry Hub is the benchmark price North American natural gas, the higher price of natural gas is mirrored in major trading points across the US and Canada. With the exception of the Leidy Hub (Pennsylvania) and Texas Eastern M-3 (New York), natural gas prices in the remaining market centers are up from January 2016. The natural gas prices in these two trading points generally trade lower than the Henry Hub price in Louisiana. Production from the prolific Marcellus Shale and the growing underlying Utica Shale, located in Pennsylvania, West Virginia and Ohio, often results in oversupply in the region, highlighting the region’s lack of pipeline infrastructure, connecting production to the nation’s largest consuming markets along the US East Coast.
September 2016
CERI Commodity Report — Natural Gas
Natural Gas Prices Paul Kralovic The Commodity Report – Natural Gas article, Turm-oil in the Natural Gas Markets, released in February 2016, explored the low natural gas price environment at the end of 2015 and beginning of 2016. On December 23, 2015 the daily spot price at Henry Hub dropped to US$1.63 per MMBtu, its lowest point since December 11, 1998.1 And while prices fluctuated in the early part of 2016, increasing to a high of US$2.54 per MMBtu on January 11, 2016, the price of natural gas plummeted once again,2 reaching a 2016 low of US$1.49 per MMBtu on March 4, 2016.3 A great deal, however, has happened since, with prices rebounding steadily. The Henry Hub daily spot price reached US$3.21 per MMBtu on October 17, 2016.4 This is the highest daily price point since natural gas reached US$3.27 per MMBtu on March 5, 2015.5 Figure 1 illustrates the monthly average Henry Hub price of natural gas from September 2014 to present. The monthly average price at Henry Hub in December 2015 was US$1.93 per MMBtu, the lowest since March 1999.6 As of September 2016 the monthly average Henry Hub price is US$2.99 per MMBtu, the highest since December 2014, when the price was US$3.48 per MMBtu.
CERI Commodity Report – Natural Gas Editorial Committee: Paul Kralovic, Dinara Millington, Megan Murphy, Allan Fogwill About CERI The Canadian Energy Research Institute is an independent, not-for-profit research establishment created through a partnership of industry, academia, and government in 1975. Our mission is to provide relevant, independent, objective economic research in energy and related environmental issues. For more information about CERI, please visit our website at www.ceri.ca or contact us at [email protected].

Relevant • Independent • Objective
Page 2
Figure 2: Natural Gas Spot Prices in Various Trading Points8 (US$ per MMBtu9)
Source: Platt’s Gas Daily Price Guide,10 CERI & Yellow Maps11
Why are Natural Gas Prices Rebounding? From the supply-side perspective, major factors affecting prices include the amount of natural gas produced, as well as the amount of natural gas in storage. The US Energy Information Administration (EIA) expects marketable natural gas production to average 77.5 billion cubic feet per day (Bcfpd) in 2016 – the first annual production decline, albeit slight, since 2005.12 In September 2016, total US production averaged 76.5 Bcfpd, down from an all-time high of 79.7 Bcfpd in September 2015.13 US marketed production has decreased seven months consecutively since February’s total of 79.4 Bcfpd. The decline in US total marketable gas production is caused by a decline in the US shale gas production, decreasing from a record-high of 44 Bcfpd in February 2016 to 42.4 Bcfpd in September 2016.14 As of September 2016, the Marcellus Shale and the Utica Shale produced 16.7 Bcfpd and 3.7 Bcfpd, respectively. This is down from record-high production levels of 17.1 Bcfpd and 3.8 Bcfpd in February 2016.15 However, between the two shale plays, they account for approximately 48 percent of the total shale gas production in the US.16 A similar production decline between February and September is present for all major shale plays in the US, including the Bakken Shale, Woodford, Barnett Shale, Eagle Ford and the Haynesville Shale. Working gas storage levels in the US are at near record levels. Following a mild winter in 2015/16 and lower-than-expected demand, combined with record natural gas production, inventories reached record-levels.
According to the EIA, US working natural gas totaled about 2,584 Bcf as of the week ending February 19, 2016,17 approximately 577 Bcf above the five-year average of 2,007 Bcf and 615 Bcf above last year’s total of 1,969 Bcf for the same period.18 This is 31.2 percent higher than the same time a year ago and 28.7 percent higher than the 5-year average.19 Combined with a decrease in US marketed gas production, storage injections this past summer were weaker-than-expected. According to the EIA, US working natural gas totaled about 3,680 Bcf as of the week ending September 30, 2016,20 approximately 243 Bcf above the five-year average and 267 Bcf above last year’s total for the same period.21 The current natural gas storage levels in the Lower-48 are converging with the 5-year average and 2015 levels, illustrated in Figure 3. Figure 3: US Lower-48 Working Natural Gas Storage (Bcf, Month-end)
Source: EIA & CERI22
From the demand-side, the main factor is variations in winter and summer weather. Warmer weather is creating a downward pressure in natural gas prices, at least in the short term, delaying the beginning of the winter heating season. As of the week ending October 13, 2016, there have been 34 heating degree days (HDDs)23 in the US, down 23 HDDs from the norm.24 Most of the US is experiencing warmer-than-average temperatures. For example, New England, East North Central, and the Middle Atlantic regions have been warmer-than-expected, down 53 HDDs, 36 HDDs and 29 HDDs, respectively, from the norm.25 For the week ending October 19, 2016, US consumption is down from 62.6 Bcfpd last mid-October 2015 to 56.5 Bcfpd in mid-October 2016.26 While residential/
Relevant • Independent • Objective
Page 3
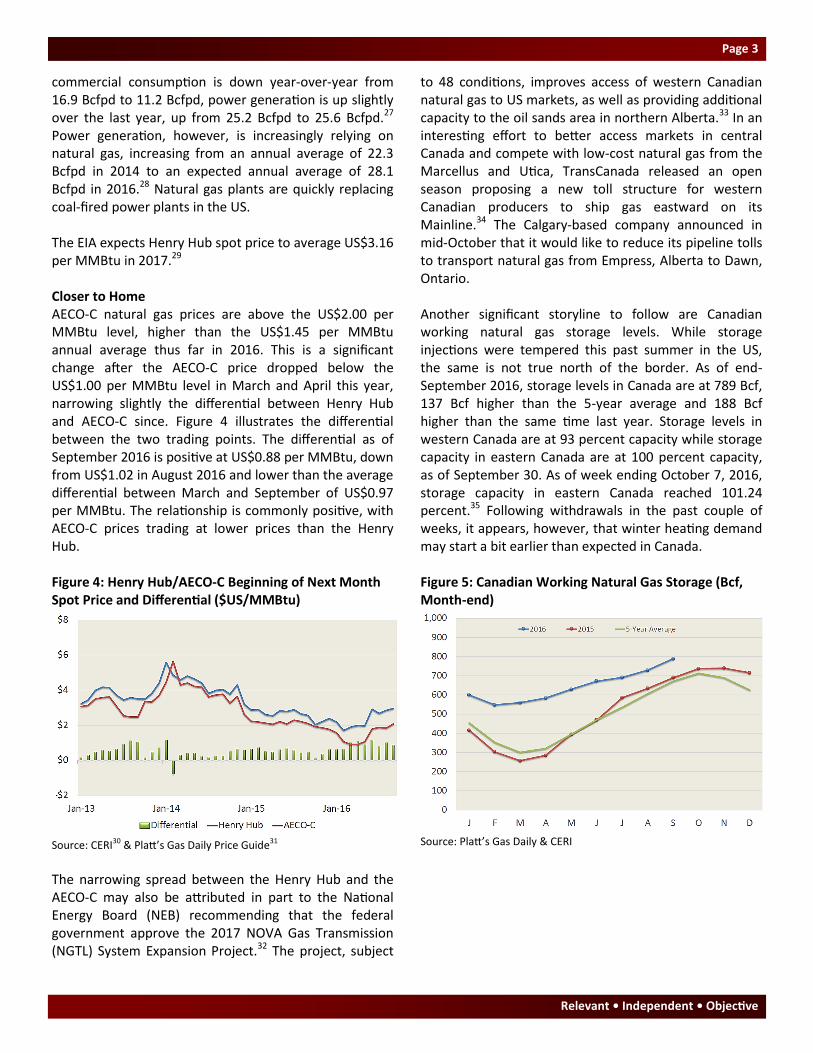
commercial consumption is down year-over-year from 16.9 Bcfpd to 11.2 Bcfpd, power generation is up slightly over the last year, up from 25.2 Bcfpd to 25.6 Bcfpd.27 Power generation, however, is increasingly relying on natural gas, increasing from an annual average of 22.3 Bcfpd in 2014 to an expected annual average of 28.1 Bcfpd in 2016.28 Natural gas plants are quickly replacing coal-fired power plants in the US. The EIA expects Henry Hub spot price to average US$3.16 per MMBtu in 2017.29 Closer to Home AECO-C natural gas prices are above the US$2.00 per MMBtu level, higher than the US$1.45 per MMBtu annual average thus far in 2016. This is a significant change after the AECO-C price dropped below the US$1.00 per MMBtu level in March and April this year, narrowing slightly the differential between Henry Hub and AECO-C since. Figure 4 illustrates the differential between the two trading points. The differential as of September 2016 is positive at US$0.88 per MMBtu, down from US$1.02 in August 2016 and lower than the average differential between March and September of US$0.97 per MMBtu. The relationship is commonly positive, with AECO-C prices trading at lower prices than the Henry Hub. Figure 4: Henry Hub/AECO-C Beginning of Next Month Spot Price and Differential ($US/MMBtu)
Source: CERI30 & Platt’s Gas Daily Price Guide31
The narrowing spread between the Henry Hub and the AECO-C may also be attributed in part to the National Energy Board (NEB) recommending that the federal government approve the 2017 NOVA Gas Transmission (NGTL) System Expansion Project.32 The project, subject
to 48 conditions, improves access of western Canadian natural gas to US markets, as well as providing additional capacity to the oil sands area in northern Alberta.33 In an interesting effort to better access markets in central Canada and compete with low-cost natural gas from the Marcellus and Utica, TransCanada released an open season proposing a new toll structure for western Canadian producers to ship gas eastward on its Mainline.34 The Calgary-based company announced in mid-October that it would like to reduce its pipeline tolls to transport natural gas from Empress, Alberta to Dawn, Ontario. Another significant storyline to follow are Canadian working natural gas storage levels. While storage injections were tempered this past summer in the US, the same is not true north of the border. As of end-September 2016, storage levels in Canada are at 789 Bcf, 137 Bcf higher than the 5-year average and 188 Bcf higher than the same time last year. Storage levels in western Canada are at 93 percent capacity while storage capacity in eastern Canada are at 100 percent capacity, as of September 30. As of week ending October 7, 2016, storage capacity in eastern Canada reached 101.24 percent.35 Following withdrawals in the past couple of weeks, it appears, however, that winter heating demand may start a bit earlier than expected in Canada. Figure 5: Canadian Working Natural Gas Storage (Bcf, Month-end)
Source: Platt’s Gas Daily & CERI

Relevant • Independent • Objective
Page 4
Endnotes 1US Energy Information Administration, Natural Gas, Henry Hub Natural Gas Spot Price, Daily, https://www.eia.gov/dnav/ng/hist/rngwhhdd.htm 2ibid 3InvestmentMine, Historical Natural Gas Prices and Price Chart, http://www.infomine.com/investment/metal-prices/natural-gas/all/ 4US Energy Information Administration, Natural Gas, Henry Hub Natural Gas Spot Price, Daily, http://www.eia.gov/dnav/ng/hist/rngwhhdD.htm 5ibid 6US Energy Information Administration, Natural Gas, Henry Hub Natural Gas Spot Price, Monthly, http://www.eia.gov/dnav/ng/hist/rngwhhdM.htm 7ibid 8Monthly Bid-week Spot Gas Prices, October 1 (US$ per MMBtu) 9It is important to note that all prices are in US$ per MMBtu, with the exception of AECO-C, quoted in C$ per GJ; for the purpose of this figure, AECO-C is converted. 10Platt’s Gas Daily Price Guide, October 2016 11Yellow Maps, United States map, http://www.yellowmaps.com/map/united-states-blank-map-57.htm 12ibid 13US Energy Information Administration, Short-Term Energy and Winter Fuels Outlook, October 13, 2016, https://www.eia.gov/forecasts/steo/report/natgas.cfm 14US Energy Information Administration, Natural Gas, Natural Gas Weekly Update (for week ending October 20, 2016), http://www.eia.gov/naturalgas/weekly/#tabs-supply-1 15ibid 16ibid 17US Energy Information Administration, Weekly Working Gas in Underground Storage (for week ending February 19, 2016), http://www.eia.gov/dnav/ng/ng_stor_wkly_s1_w.htm 18ibid 19US Energy Information Administration, Weekly Natural Gas Storage Report (for week ending February 19, 2016), http://ir.eia.gov/ngs/ngs.html
20US Energy Information Administration, Weekly Working Gas in Underground Storage (for week ending February 19, 2016), http://www.eia.gov/dnav/ng/ng_stor_wkly_s1_w.htm 21ibid 22US Energy Information Administration, Natural Gas, Natural Gas Weekly Update (for week ending February 17, 2016), http://www.eia.gov/naturalgas/weekly/#tabs-storage-1 23Heating Degree Days are a measure of how cold a location is, the daily average temperature falls below 65° F (18.3 °C). 24US Energy Information Administration, Natural Gas, Natural Gas Weekly Update (for week ending October 20, 2016), http://www.eia.gov/naturalgas/weekly/#tabs-rigs-1 25ibid 26US Energy Information Administration, Natural Gas Weekly Update, for week ending October 19, 2016, http://www.eia.gov/naturalgas/weekly/#tabs-supply-2 27ibid 28US Energy Information Administration, Short-term Energy and Winter Fuels Outlook, October 13, 2016, https://www.eia.gov/forecasts/steo/report/natgas.cfm 29ibid 30Differentials calculated by CERI, Presented on CERI’s monthly Natural Gas Commodity Report 31Platt’s website, Gas Daily Price Guide (January 2008 – Present) (Accessed on February 15, 2016) 32National Energy Board website, 2017 NGTL System Expansion Project, June1, 2016, http://www.neb-one.gc.ca/pplctnflng/mjrpp/2017nvgsxpnsn/index-eng.html 33ibid 34The Globe and Mail website, TransCanada offers Alberta gas shippers lower price along Canadian Mainline, October 13, 2016, http://www.theglobeandmail.com/report-on-business/industry-news/energy-and-resources/transcanada-offers-alberta-gas-shippers-lower-price-along-canadian-mainline/article32347443/ 35Platt’s Gas Daily, October 10, 2016.
Relevant • Independent • Objective
Page 5
SOU
RC
E: C
ERI,
Pla
tts
Gas
Dai
ly P
rice
Gu
ide.
SO
UR
CE:
CER
I, P
latt
s G
as D
aily
Pri
ce G
uid
e.
SOU
RC
E: C
ERI,
Pla
tts
Gas
Dai
ly P
rice
Gu
ide.
SO
UR
CE:
CER
I, P
latt
s G
as D
aily
Pri
ce G
uid
e.
-202468
10
12
14 Ja
n-0
5J
ul-
06
Jan
-08
Ju
l-0
9J
an
-11
Ju
l-1
2J
an
-14
Ju
l-1
5
Dif
fere
nti
al
He
nry
Hu
bA
EC
O-C
He
nry H
ub
/AE
CO
-CB
egin
nin
g o
f N
ext M
onth S
pot P
ric
e (
US
$/M
MB
tu)
-7-5-3-113579
11
13
15 Jan
-05
Ju
l-06
Jan
-08
Ju
l-09
Jan
-11
Ju
l-12
Jan
-14
Ju
l-15
Dif
fere
nti
al
Hen
ry H
ub
Ch
icag
o
He
nry H
ub
/Ch
ica
go
Be
gin
nin
g o
f N
ex
t M
on
th
Sp
ot P
ric
e (
US
$/M
MB
tu
)
-113579
11
13
15 Ja
n-0
5J
ul-
06
Jan
-08
Ju
l-0
9J
an
-11
Ju
l-1
2J
an
-14
Ju
l-1
5
Dif
fere
nti
al
Hen
ry H
ub
Ro
ckie
s
He
nry H
ub
/Ro
ck
ies
Be
gin
nin
g o
f N
ex
t M
on
th
Sp
ot P
ric
e (
US
$/M
MB
tu
)
-113579
11
13
15 Jan
-05
Ju
l-0
6J
an
-08
Ju
l-0
9J
an
-11
Ju
l-1
2J
an
-14
Ju
l-1
5
Chart
Title
Dif
fere
nti
al
Hen
ry H
ub
So
uth
ern
Ca
lifo
rnia
He
nry H
ub
/So
uth
ern
Ca
lifo
rn
iaB
egin
nin
g o
f N
ext M
onth S
pot P
ric
e (
US
$/M
MB
tu)

CERI Commodity Report - Natural Gas
Page 6
SOU
RC
E: C
anad
ian
Gas
Ass
oci
atio
n.
SOU
RC
E: C
ERI,
Can
adia
n G
as A
sso
ciati
on
, Sta
tisti
cs C
anad
a.
SOU
RC
E: N
OA
A.
SOU
RC
E: C
ERI,
NO
AA
, EIA
.
0
100
200
300
400
500
600
700
800
JF
MA
MJ
JA
SO
ND
5-Y
ear
Avg
.2015
20
16
Ca
na
dia
n H
ea
tin
g D
eg
re
e D
ays
01234567
0
200
40
0
600
800
1,0
00
1,2
00 J
an
-09
Jan
-10
Jan
-11
Jan
-12
Jan
-13
Jan
-14
Jan
-15
Jan
-16
Deg
ree D
ay
sC
on
su
mp
tio
n
Ca
na
dia
n H
eati
ng
De
gre
e D
ays v
s R
esid
en
tia
l a
nd
Co
mm
erc
ial C
on
su
mptio
n
De
gre
e D
ay
sB
CF
PD
0
100
200
300
400
500
600
700
800
900
JF
MA
MJ
JA
SO
ND
5-Y
ear
Avg
.2015
2016
US
He
atin
g D
eg
re
e D
ays
010
20
30
40
50
60
0
200
400
600
800
1,0
00
1,2
00 J
an
-09
Jan
-10
Jan
-11
Jan
-12
Jan
-13
Jan
-14
Jan
-15
Jan
-16
De
gre
e D
ay
sC
on
su
mp
tio
n
US
He
atin
g D
eg
re
e D
ays v
s
Re
sid
en
tia
l a
nd
Co
mm
erc
ial C
on
su
mp
tio
n
De
gre
e D
ay
sB
CF
PD

Relevant • Independent • Objective
Page 7
SOU
RC
E: E
nvi
ron
men
t C
anad
a.
SOU
RC
E: E
nvi
ron
men
t C
anad
a.
SOU
RC
E: N
OA
A.
SOU
RC
E: N
OA
A.

CERI Commodity Report - Natural Gas
Page 8
SOU
RC
E: N
OA
A.
SOU
RC
E: E
nvi
ron
men
t C
anad
a.
SOU
RC
E: N
OA
A.

Relevant • Independent • Objective
Page 9
NO
TE:
As
of
Jan
uar
y 2
01
6, S
tats
Can
ch
ange
d t
he
con
ten
t an
d m
eth
od
olo
gy o
f C
anad
ian
nat
ura
l ga
s co
nsu
mp
tio
n.
Use
rs s
ho
uld
use
cau
tio
n c
om
par
ing
curr
ent
dat
a w
ith
his
tori
cal d
ata
SO
UR
CE:
Sta
tisti
cs C
anad
a.
SOU
RC
E: S
tati
stics
Can
ada,
NEB
.
SOU
RC
E: E
IA.
SOU
RC
E: E
IA.
02468
10
12
14
16 J
an
-09
Ja
n-1
0J
an
-11
Ja
n-1
2J
an
-13
Ja
n-1
4J
an
-15
Ja
n-1
6
Ind
us
tria
l &
Po
wer
Co
mm
erc
ial
Resid
en
tial
Ca
na
dia
n C
on
su
mp
tio
nB
y S
ector (B
cfp
d)
02468
10
12
14
16
18
20 J
an
-09
Jan
-10
Jan
-11
Ja
n-1
2J
an
-13
Ja
n-1
4J
an
-15
Jan
-16
BC
, Y
uko
n, N
WT
AB
SK
E. C
oast
Ca
na
dia
n M
arke
ta
ble
Pro
du
ctio
n
By P
ro
vin
ce/R
eg
ion (B
cfp
d)
0
20
40
60
80
100
120
140 J
an
-09
Ja
n-1
0J
an
-11
Ja
n-1
2J
an
-13
Ja
n-1
4J
an
-15
Ja
n-1
6
Ind
ustr
ial
Ele
ctr
ic P
ow
er
Co
mm
erc
ial
Resid
en
tial
US
Co
nsu
mp
tio
n
By S
ec
tor (B
cfp
d)
0
10
20
30
40
50
60
70
80
90 J
an
-09
Ja
n-1
0J
an
-11
Ja
n-1
2J
an
-13
Jan
-14
Ja
n-1
5J
an
-16
US
To
tal
Lo
uis
ian
aG
OM
Fed
era
l W
ate
rsT
exas
US
Ma
rk
eta
ble
Pro
du
ctio
n (
Bc
fpd
)

CERI Commodity Report - Natural Gas
Page 10
SOU
RC
E: S
tati
stics
Can
ada,
NEB
. SO
UR
CE:
Sta
tisti
cs C
anad
a, N
EB.
SOU
RC
E: S
tati
stics
Can
ada,
NEB
. SO
UR
CE:
Sta
tisti
cs C
anad
a, N
EB.
0.0
1.0
2.0
3.0
4.0
5.0
JF
MA
MJ
JA
SO
ND
20
14
2015
2016
BC
, Y
uk
on
, N
WT
Ma
rk
eta
ble
Pro
du
ctio
n (
Bc
fpd
)
02468
10
12
14
16
JF
MA
MJ
JA
SO
ND
2014
2015
2016
Alb
erta
Ma
rk
eta
ble
Pro
du
ctio
n (
Bc
fpd
)
0.0
0.5
1.0
JF
MA
MJ
JA
SO
ND
20
14
2015
2016
Sa
sk
atc
he
wa
n M
ark
eta
ble
Pro
du
ctio
n (
Bc
fpd
)
0.0
0
0.2
5
0.5
0
JF
MA
MJ
JA
SO
ND
20
14
2015
20
16
Ea
st C
oa
st M
ark
eta
ble
Pro
du
ctio
n (
Bc
fpd
)

Relevant • Independent • Objective
Page 11
SOU
RC
E: C
ERI,
TC
PL,
Wes
tco
ast
Ener
gy.
No
te:
Alli
ance
del
iver
ies
wer
e n
ot
avai
lab
le b
etw
een
Dec
. 1/1
5 a
nd
Jan
. 16
/16
.
SOU
RC
E: C
ERI,
TC
PL,
Alli
ance
Pip
elin
e.
SOU
RC
E: N
EB.
SOU
RC
E: N
EB.
02468
10
12
14
16
JF
MA
MJ
JA
SO
ND
2014
2015
20
16
Syste
m F
ield
Re
ce
ipts
Tra
nsC
an
ad
a +
Westc
oast; M
on
thly
Ave
ra
ge
(B
cfp
d)
01234
Au
g-1
5O
ct-
15
De
c-1
5F
eb
-16
Ap
r-1
6J
un
-16
Au
g-1
6
Em
ers
on
Iro
qu
ois
Oth
ers
Nia
ga
ra
Ca
na
dia
n G
as E
xp
orts t
o t
he
US
By E
xp
ort P
oin
t -
Ea
st (B
cfp
d)
02468
10
12
14
Se
p-1
5N
ov-1
5J
an
-16
Ma
r-1
6M
ay
-16
Ju
l-1
6S
ep
-16
Em
pre
ss
McN
eill
AB
-BC
Allia
nce
Alb
erta
Syste
m D
elive
rie
s (
Bc
fpd
)
0123456789
Au
g-1
5O
ct-
15
Dec-1
5F
eb
-16
Ap
r-1
6J
un
-16
Au
g-1
6
Kin
gs
ga
teM
on
ch
yE
lmo
reH
un
tin
gd
on
Ca
na
dia
n G
as E
xp
orts t
o t
he
US
By E
xp
ort P
oin
t -
We
st (
Bc
fpd
)
CERI Commodity Report - Natural Gas
Page 12
SOU
RC
E: N
EB.
SOU
RC
E: N
EB.
SOU
RC
E: N
EB, E
IA.
SOU
RC
E: N
EB.
02468
10
12
Au
g-1
5O
ct-
15
Dec-1
5F
eb
-16
Ap
r-16
Ju
n-1
6A
ug
-16
We
st
Mid
we
st
Ea
st
US
Im
po
rts o
f C
an
ad
ian
Ga
sB
y U
S R
eg
ion
(B
cfp
d)
02468
Au
g-1
5O
ct-
15
Dec-1
5F
eb
-16
Ap
r-16
Ju
n-1
6A
ug
-16
We
st
Mid
we
st
Ea
st
Ave
ra
ge
Ca
na
dia
n E
xp
ort P
ric
eB
y U
S R
eg
ion (
C$
/GJ
)
02468
10
12 Ju
l-1
5S
ep
-15
No
v-1
5J
an
-16
Ma
r-1
6M
ay
-16
Ju
l-1
6
Ca
na
da
Me
xic
o
To
ta
l U
S P
ipe
lin
e G
as I
mp
orts (
Bc
fpd
)
01234
Au
g-1
5O
ct-
15
De
c-1
5F
eb
-16
Ap
r-1
6J
un
-16
Au
g-1
6
Co
urt
rig
ht
Sa
rnia
St.
Cla
irO
the
r
Ca
na
dia
n G
as I
mp
orts
By I
mpo
rt P
oin
t (
Bcfp
d)

Relevant • Independent • Objective
Page 13
SOU
RC
E: U
S. D
OE.
SOU
RC
E: U
S D
OE.
SOU
RC
E: U
S D
OE.
No
te:
Ther
e w
ere
no
LN
G im
po
rts
for
the
mo
nth
of
No
vem
ber
20
14
.
SOU
RC
E: U
S D
OE.
02468
10
12
14
16
Au
g-1
4N
ov-1
4F
eb
-15
Ma
y-1
5A
ug
-15
No
v-1
5F
eb
-16
Ma
y-1
6A
ug
-16
Co
ve P
oin
tE
lba Isla
nd
Evere
ttN
E G
ate
way
Nep
tun
e
Ea
ste
rn
US
LN
G I
mp
orts B
y F
ac
ilit
y (
Bc
f)
02468
Au
g-1
4N
ov-1
4F
eb
-15
Ma
y-1
5A
ug
-15
No
v-1
5F
eb
-16
Ma
y-1
6A
ug
-16
Fre
ep
ort
Lake C
harl
es
Sab
ine P
ass
Cam
ero
nG
old
en
Pass
Gu
lf L
NG
US
Go
M L
NG
Im
po
rts B
y F
ac
ilit
y (
Bc
f)
05
10
15
20
Au
g-1
4N
ov-1
4F
eb
-15
May-1
5A
ug
-15
No
v-1
5F
eb
-16
May-1
6A
ug
-16
Nig
eri
aT
rin
idad
No
rway
Yem
en
US
LN
G I
mp
orts B
y O
rig
in (
Bc
f)
02468
10
12
14
16
18
JF
MA
MJ
JA
SO
ND
2014
2015
2016
Volu
me-W
eig
hted A
verage L
NG
Pric
e (
US
$/M
MB
tu)

CERI Commodity Report - Natural Gas
Page 14
SOU
RC
E: U
S D
OE,
NEB
.
SOU
RC
E: U
S D
OE.
SOU
RC
E: E
IA, U
S D
OE.
SO
UR
CE:
US
DO
E.
01234567
Au
g-1
4N
ov-1
4F
eb
-15
Ma
y-1
5A
ug
-15
No
v-1
5F
eb
-16
May-1
6A
ug
-16
Tu
rkey
Bra
zil
Eg
yp
tIn
dia
Arg
en
tin
a
US
LN
G R
e-E
xp
orts
By D
estin
atio
n (B
cf)
05
10
15
20
25 A
ug
-14
No
v-1
4F
eb
-15
Ma
y-1
5A
ug
-15
No
v-1
5F
eb
-16
Ma
y-1
6A
ug
-16
Chart
Title
Mexic
o
Do
min
ican
Rep
.
Ch
ina
Jo
rdan
Sp
ain
Ch
ile
Ku
wait
Arg
en
tin
a
Po
rtu
gal
UA
E
Ind
ia
Bra
zil
Taiw
an
Jap
an
US
LN
G E
xp
orts b
y D
estin
atio
n (
Bc
f)

Relevant • Independent • Objective
Page 15
SOU
RC
E: C
ERI,
CA
OD
C, B
aker
Hu
ghes
. SO
UR
CE:
CER
I, C
AO
DC
.
SOU
RC
E: C
ERI,
CA
OD
C.
0
500
1,0
00
1,5
00
2,0
00
2,5
00
3,0
00 Ja
n-0
6J
ul-
07
Jan
-09
Ju
l-1
0J
an
-12
Ju
l-1
3J
an
-15
Ju
l-1
6
US
WC
SB
No
rth
Am
eric
an
Ac
tiv
e R
igs
0
100
200
300
400
500
600
700
800
900
1,0
00 Jan
-06
Ju
l-07
Jan
-09
Ju
l-10
Jan
-12
Ju
l-13
Jan
-15
Ju
l-16
Acti
ve R
igs
To
tal R
ig D
rillin
g F
leet
Ca
na
dia
n R
ig F
lee
t U
tiliz
atio
nW
ee
kly
Ave
ra
ge
Ac
tiv
e R
igs
0
100
20
0
300
400
50
0
600
700 Jan
-09
Jan
-10
Jan
-11
Jan
-12
Jan
-13
Jan
-14
Jan
-15
Jan
-16
SK
AB
BC
WC
SB
Ac
tiv
e R
igs b
y P
ro
vin
ce
We
ek
ly A
ve
ra
ge
-
100
200
300
400
500
600
700
800
15
913
17
21
25
29
33
37
41
45
49
5-Y
ear
Av
g.
2015
20
16
We
ste
rn
Ca
na
da
Ac
tiv
e R
igs
We
ek
ly A
ve
ra
ge
Week N
um
ber
SOU
RC
E: C
ERI,
CA
OD
C.

CERI Commodity Report - Natural Gas
Page 16
SOU
RC
E: C
ERI,
Bak
er H
ugh
es.
SO
UR
CE:
CER
I, B
aker
Hu
ghe
s.
SOU
RC
E: C
ERI,
Bak
er H
ugh
es.
0%
10
%
20%
30%
40%
50%
60%
70
%
80
%
90
%
10
0%
0
20
0
400
600
800
1,0
00
1,2
00
1,4
00
1,6
00
1,8
00
2,0
00
2,2
00
2,4
00 Ja
n-0
6J
ul-
07
Jan
-09
Ju
l-1
0J
an
-12
Ju
l-1
3J
an
-15
Ju
l-1
6
Oil-d
irecte
dG
as-d
irecte
dG
as-d
irecte
d %
US
To
ta
l O
il-
an
d G
as-d
ire
cte
d A
ctiv
e R
igs
0
500
1,0
00
1,5
00
2,0
00
2,5
00 Jan
-06
Ju
l-07
Jan
-09
Ju
l-10
Jan
-12
Ju
l-13
Jan
-15
Ju
l-16
To
tal O
il-d
ire
cte
dG
oM
Gas-d
irecte
dO
nsh
ore
Ga
s-d
ire
cte
d
US
To
ta
l A
ctiv
e R
igs
0
20
40
60
80
100
120 J
an
-06
Ju
l-0
7J
an
-09
Ju
l-1
0J
an
-12
Ju
l-1
3J
an
-15
Ju
l-1
6
Oil-d
irecte
dG
as-d
irecte
d
US
Gu
lf o
f M
ex
ico
Ac
tiv
e R
igs

Relevant • Independent • Objective
Page 17
SOU
RC
E: C
ERI,
Pla
tt’s
Gas
Dai
ly.
SOU
RC
E: C
ERI,
Pla
tt’s
Gas
Dai
ly.
SOU
RC
E: C
ERI,
Pla
tt’s
Gas
Dai
ly.
SOU
RC
E: C
ERI,
Pla
tt’s
Gas
Dai
ly.
0
10
0
200
300
40
0
500
600
70
0
800
900
1,0
00
JF
MA
MJ
JA
SO
ND
5-Y
ea
r A
vg
.2015
2016
Ca
na
dia
n W
ork
ing
Ga
s S
to
ra
ge
(Bc
f, M
on
th
-en
d)
0
100
200
300
400
500
600
700
800
900
Sep
-15
No
v-1
5Jan
-16
Mar-
16
May-1
6Ju
l-16
Sep
-16
West
Ea
st
Ca
na
dia
n S
to
ra
ge
by R
eg
ion
(B
cf,
Mo
nth
-en
d)
0
500
1,0
00
1,5
00
2,0
00
2,5
00
3,0
00
3,5
00
4,0
00
4,5
00
5,0
00
JF
MA
MJ
JA
SO
ND
5-Y
ear
Avg
.2015
2016
US
Lo
we
r-4
8 W
ork
ing
Ga
s S
to
ra
ge
(B
cf,
Mo
nth
-en
d)
0
500
1,0
00
1,5
00
2,0
00
2,5
00
3,0
00
3,5
00
4,0
00
4,5
00
Se
p-1
5N
ov-1
5J
an
-16
Ma
r-1
6M
ay
-16
Ju
l-1
6S
ep
-16
East
Mid
we
st
Mo
un
tain
Pac
ific
So
uth
Ce
ntr
al
US
Sto
ra
ge
by R
eg
ion
(B
cf,
Mo
nth
-en
d)
CERI Commodity Report - Natural Gas
Page 18
SOU
RC
E: C
ERI,
Pla
tt’s
Gas
Dai
ly.
SOU
RC
E: C
ERI,
Pla
tt’s
Gas
Dai
ly.
SOU
RC
E: C
ERI,
Pla
tt’s
Gas
Dai
ly.
-140
-100
-60
-20
20
60
10
0
JF
MA
MJ
JA
SO
ND
WC
_IJ
_W
D
5-Y
ea
r A
vg
.2
01
52016
We
ste
rn
Ca
na
dia
n S
to
ra
ge
In
jec
tio
ns/W
ith
dra
wa
ls(B
cf,
Mo
nth
-en
d)
-100
-80
-60
-40
-200
20
40
60
80
JF
MA
MJ
JA
SO
ND
5-Y
ear
Avg
.2015
2016
Ea
ste
rn
Ca
na
dia
n S
to
ra
ge
In
jec
tio
ns/W
ith
dra
wa
ls
(Bc
f, M
on
th
-en
d)
-200
-150
-100
-500
50
100
150
JF
MA
MJ
JA
SO
ND
5-Y
ear
Av
g.
20
15
20
16
Ca
na
dia
n S
to
ra
ge
In
jec
tio
ns/W
ith
dra
wa
ls
(Bc
f, M
on
th
-en
d)
Relevant • Independent • Objective
Page 19
SOU
RC
E: C
ERI,
EIA
. SO
UR
CE:
CER
I, E
IA.
SOU
RC
E: C
ERI,
EIA
.
-250
-200
-150
-100
-500
50
100
150
200
JF
MA
MJ
JA
SO
ND
5-Y
ear
Avg
.2015
20
16
US
Ea
st S
to
ra
ge
In
jec
tio
ns/W
ith
dra
wa
ls(B
cf,
Mo
nth
-en
d)
-30
0
-200
-1000
10
0
200
300
JF
MA
MJ
JA
SO
ND
5-Y
ear
Av
g.
20
15
20
16
US
Mid
we
st R
eg
ion
Sto
ra
ge
Inje
ctio
ns/W
ith
dra
wa
ls
-40
-30
-20
-100
10
20
30
JF
MA
MJ
JA
SO
ND
5-Y
ear
Av
g.
2015
20
16
US
Mo
un
ta
in R
eg
ion
Sto
ra
ge
Inje
ctio
ns/W
ith
dra
wa
ls
(Bc
f, M
on
th
-en
d)
-80
-60
-40
-200
20
40
60
JF
MA
MJ
JA
SO
ND
5-Y
ear
Av
g.
2015
2016
US
Pa
cif
ic R
eg
ion
Sto
ra
ge
In
jec
tio
ns/W
ith
dra
wa
ls(B
cf,
Mo
nth
-en
d)
SOU
RC
E: C
ERI,
EIA
.
CERI Commodity Report - Natural Gas
Page 20
SOU
RC
E: C
ERI,
EIA
. SO
UR
CE:
CER
I, E
IA.
-300
-200
-1000
100
200
300
JF
MA
MJ
JA
SO
ND
5-Y
ear
Av
g.
2015
20
16
US
So
uth
Ce
ntra
l R
eg
ion
Sto
ra
ge
Inje
ctio
ns/W
ith
dra
wa
ls
(Bc
f, M
on
th
-en
d)
-10
00
-80
0
-60
0
-40
0
-20
00
200
400
600
800
JF
MA
MJ
JA
SO
ND
5-Y
ear
Av
g.
2015
2016
US
Sto
ra
ge
In
jec
tio
ns/W
ith
dra
wa
ls
(Bcf,
Mo
nth
-en
d)