september 2010 troubled asset relief program bank stress
TRANSCRIPT

GAO United States Government Accountability Office
Report to Congressional Committees
TROUBLED ASSET RELIEF PROGRAM
Bank Stress Test Offers Lessons as Regulators Take Further Actions to Strengthen Supervisory Oversight
September 2010
GAO-10-861
What GAO Found
United States Government Accountability Office
Why GAO Did This Study
HighlightsAccountability Integrity Reliability
September 2010 TROUBLED ASSET RELIEF PROGRAM
Bank Stress Test Offers Lessons as Regulators Take Further Actions to Strengthen Supervisory Oversight
Highlights of GAO-10-861, a report to congressional committees
The Supervisory Capital Assessment Program (SCAP) was established under the Capital Assistance Program (CAP)—a component of the Troubled Asset Relief Program (TARP)—to assess whether the 19 largest U.S. bank holding companies (BHC) had enough capital to withstand a severe economic downturn. Led by the Board of Governors of the Federal Reserve System (Federal Reserve), federal bank regulators conducted a stress test to determine if these banks needed to raise additional capital, either privately or through CAP. This report (1) describes the SCAP process and participants’ views of the process, (2) assesses SCAP’s goals and results and BHCs’ performance, and (3) identifies how regulators and the BHCs are applying lessons learned from SCAP. To do this work, GAO reviewed SCAP documents, analyzed financial data, and interviewed regulatory, industry, and BHC officials.
What GAO Recommends
This report recommends that the Federal Reserve complete a final 2-year SCAP analysis, and apply lessons learned from SCAP to improve transparency of bank supervision, examiner guidance, risk identification and assessment, and regulatory coordination. The Federal Reserve agreed with our five recommendations and noted current actions that it has underway to address them. Treasury agreed with the report’s findings.
The SCAP process appeared to have been mostly successful in promoting coordination, transparency, and capital adequacy. The process utilized an organizational structure that facilitated coordination and communication among regulatory staff from multiple disciplines and organizations and with the BHCs. Because SCAP was designed to help restore confidence in the banking industry, regulators took unusual steps to increase transparency by releasing details of their methodology and sensitive BHC-specific results. However, several participants criticized aspects of the SCAP process. For example, some supervisory and bank industry officials stated that the Federal Reserve was not transparent about the linkages between some of the test’s assumptions and results. But most of the participants in SCAP agreed that despite these views, coordination and communication were effective and could serve as a model for future supervisory efforts. According to regulators, the process resulted in a methodology that yielded credible results. By design, the process helped to ensure that BHCs would be capitalized for a potentially more severe downturn in economic conditions from 2009 through 2010. SCAP largely met its goals of increasing the level and quality of capital held by the 19 largest U.S. BHCs and, more broadly, strengthening market confidence in the banking system. The stress test identified 9 BHCs that met the capital requirements under the more adverse scenario and 10 that needed to raise additional capital. Nine of the 10 BHCs were able to raise capital in the private market, with the exception of GMAC LLC, which received additional capital from the U.S. Department of the Treasury (Treasury). The resulting capital adequacy of the 19 BHCs has generally exceeded SCAP’s requirements, and two-thirds of the BHCs have either fully repaid or begun to repay their TARP investments. Officials from the BHCs, credit rating agencies, and federal banking agencies indicated that the Federal Reserve’s public release of the stress test methodology and results in the spring of 2009 helped strengthen market confidence. During the first year of SCAP (2009), overall actual losses for these 19 BHCs have generally been below GAO’s 1-year pro rata loss estimates under the more adverse economic scenario. Collectively, the BHCs experienced gains in their securities and trading and counterparty portfolios. However, some BHCs exceeded the GAO 1-year pro rata estimated 2009 losses in certain areas, such as consumer and commercial lending. Most notably, in 2009, GMAC LLC exceeded the loss estimates in multiple categories for the full 2-year SCAP period. More losses in the residential and commercial real estate markets and further deterioration in economic conditions could challenge the BHCs, even though they have been deemed to have adequate capital levels under SCAP.
View GAO-10-861or key components. For more information, contact Orice Williams Brown at (202) 512-8678 or [email protected].
United States Government Accountability Office
Highlights of GAO-10-861 (continued)
SCAP provided a number of important lessons for regulators about the benefits of increased transparency, the need for regulators to strengthen bank supervision, the need for regulators and BHCs to improve their risk identification and assessment practices, and the need for regulators to improve coordination and communication. First, SCAP underscored the potential benefits that increased transparency about the financial health of the nation’s largest BHCs can provide. Many experts have said that the lack of transparency about potential losses from certain assets contributed significantly to the instability in financial markets during the current crisis. But transparency in the banking supervisory process is a controversial issue. Some observers say that publicly disclosing sensitive bank information without a federal capital backstop could have unintended negative effects, such as runs on banks, that would disproportionately affect weaker banks. However, other observers believe that more transparency about banks’ asset valuations and losses could help the public better understand the risk exposures of BHCs, increase market discipline, and improve the oversight of these institutions. A final analysis by the Federal Reserve of BHCs’ performance during the full 2-year SCAP period can help in this regard. The Federal Reserve and other banking regulators could benefit from developing a plan to improve the transparency of bank supervision. Second,
SCAP showed that more robust regulatory oversight of bank stress tests was necessary to better understand banks’ capacity to withstand downturns in the economy. Regulators and BHC officials commented that internal bank stress tests prior to SCAP did not comprehensively stress their portfolios. The Federal Reserve is finalizing examiner guidance for assessing capital adequacy, including stress testing, but it has not established criteria for assessing the rigor of the BHCs’ stress test assumptions. Without more robust guidance, ensuring that stress tests are being evaluated thoroughly and consistently is difficult. Third, the SCAP exercise highlighted opportunities to enhance both the process and data inputs for conducting future stress tests. The Federal Reserve has started to build a plan to enhance its risk identification and assessment infrastructure in response to the financial crisis, but further planning is needed to reflect recent changes under the Dodd-Frank Wall Street Reform and Consumer Protection Act of 2010. Finally, SCAP demonstrated the need for robust coordination and communication among regulators in examining complex institutions. While SCAP promoted coordination and communication, further efforts are needed to ensure the participation of relevant regulators in multiagency examinations of banks.
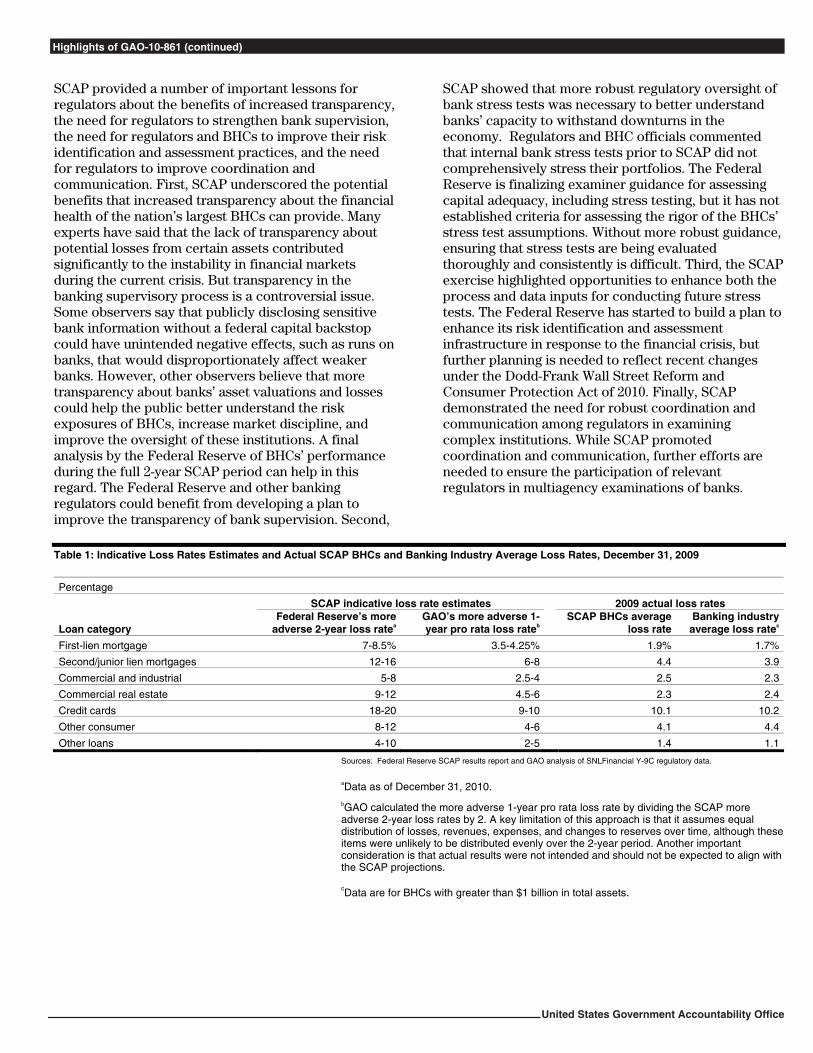
Table 1: Indicative Loss Rates Estimates and Actual SCAP BHCs and Banking Industry Average Loss Rates, December 31, 2009 Percentage
SCAP indicative loss rate estimates 2009 actual loss rates
Loan category Federal Reserve’s more
adverse 2-year loss ratea GAO’s more adverse 1-year pro rata loss rateb
SCAP BHCs average loss rate
Banking industry average loss ratec
First-lien mortgage 7-8.5% 3.5-4.25% 1.9% 1.7%
Second/junior lien mortgages 12-16 6-8 4.4 3.9
Commercial and industrial 5-8 2.5-4 2.5 2.3
Commercial real estate 9-12 4.5-6 2.3 2.4
Credit cards 18-20 9-10 10.1 10.2
Other consumer 8-12 4-6 4.1 4.4
Other loans 4-10 2-5 1.4 1.1
Sources: Federal Reserve SCAP results report and GAO analysis of SNLFinancial Y-9C regulatory data.
aData as of December 31, 2010. bGAO calculated the more adverse 1-year pro rata loss rate by dividing the SCAP more adverse 2-year loss rates by 2. A key limitation of this approach is that it assumes equal distribution of losses, revenues, expenses, and changes to reserves over time, although these items were unlikely to be distributed evenly over the 2-year period. Another important consideration is that actual results were not intended and should not be expected to align with the SCAP projections. cData are for BHCs with greater than $1 billion in total assets.
Page i GAO-10-861
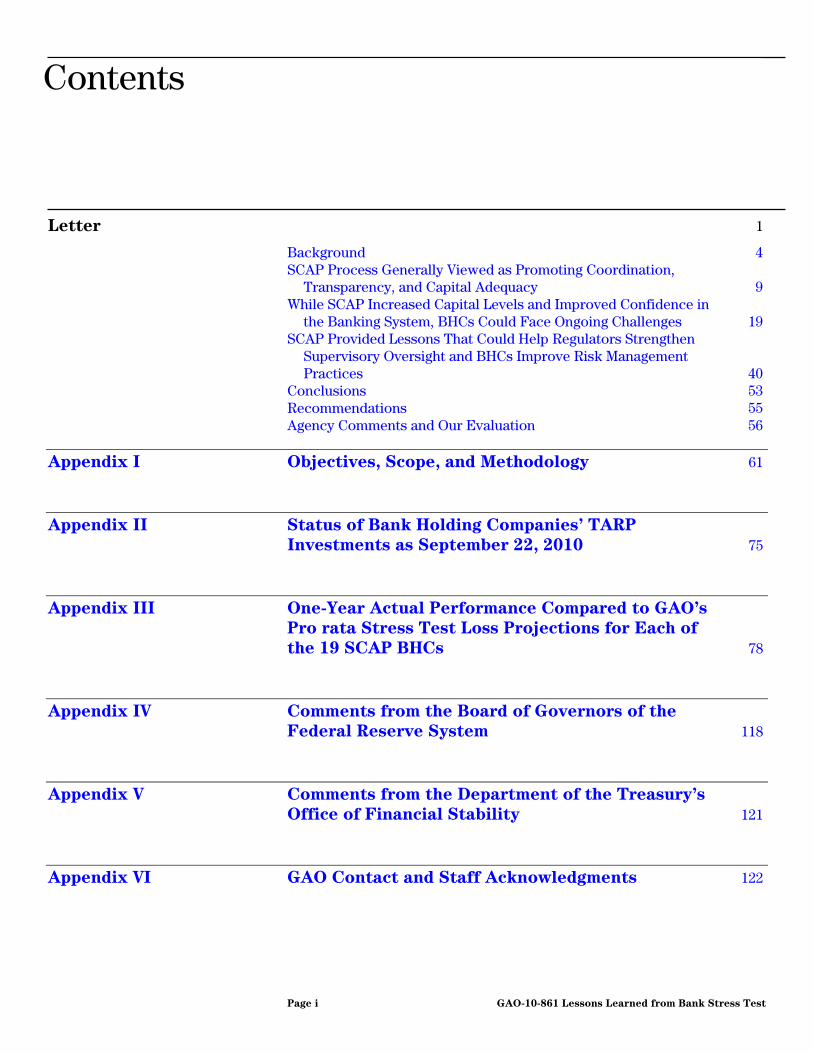
Contents
Letter 1
Background 4 SCAP Process Generally Viewed as Promoting Coordination,
Transparency, and Capital Adequacy 9 While SCAP Increased Capital Levels and Improved Confidence in
the Banking System, BHCs Could Face Ongoing Challenges 19 SCAP Provided Lessons That Could Help Regulators Strengthen
Supervisory Oversight and BHCs Improve Risk Management Practices 40
Conclusions 53 Recommendations 55 Agency Comments and Our Evaluation 56
Appendix I Objectives, Scope, and Methodology 61
Appendix II Status of Bank Holding Companies’ TARP
Investments as September 22, 2010 75
Appendix III One-Year Actual Performance Compared to GAO’s
Pro rata Stress Test Loss Projections for Each of
the 19 SCAP BHCs 78
Appendix IV Comments from the Board of Governors of the
Federal Reserve System 118
Appendix V Comments from the Department of the Treasury’s
Office of Financial Stability 121
Appendix VI GAO Contact and Staff Acknowledgments 122
Lessons Learned from Bank Stress Test

Tables
Table 1: Indicative Loss Rates Estimates and Actual SCAP BHCs and Banking Industry Average Loss Rates, December 31, 2009 17
Table 2: Summary of Capital Raised by 10 BHCs to Meet Their SCAP Capital Buffer Amount, as of November 9, 2009 20
Table 3: Capital Measures for SCAP BHCs, December 31, 2008 and December 31, 2009 21
Table 4: Percentage Change in Tier I Capital Ratios, December 31, 2008, and December 31, 2009 22
Table 5: Actual and GAO Pro Rata Estimates of Aggregate Losses and Changes in Resources Other than Capital to Absorb Losses across the 19 SCAP BHCs, December 31, 2009 27
Table 6: Items Used to Calculate Tier 1 Capital, Asset Losses, PPNR, and ALLL 66
Table 7: Tier 1 Common Capital Calculation 67 Table 8: Crosswalk of Y-9C Net Charge-Offs and Asset
Classifications to Classifications Used by SCAP 68 Table 9: Crosswalk of Y-9C Loans and Lease Financing Receivables
to and Classifications used by SCAP 72 Table 10: Status of TARP Investments for the 19 BHCs
Participating in SCAP, as of September 22, 2010 76 Table 11: Identification of 19 BHCs Subject to the Stress Test 78 Table 12: American Express Company 80 Table 13: Bank of America Corporation 82 Table 14: BB&T Corporation 84 Table 15: The Bank of New York Mellon Corporation 86 Table 16: Capital One Financial Corporation 88 Table 17: Citigroup Inc. 90 Table 18: Fifth Third Bancorp 92 Table 19: GMAC LLC 94 Table 20: The Goldman Sachs Group, Inc. 96 Table 21: JPMorgan Chase & Co. 98 Table 22: KeyCorp 100 Table 23: MetLife, Inc. 102 Table 24: Morgan Stanley 104 Table 25: PNC Financial Services Group, Inc. 106 Table 26: Regions Financial Corporation 108 Table 27: State Street Corporation 110 Table 28: SunTrust Banks, Inc. 112 Table 29: U.S. Bancorp 114 Table 30: Wells Fargo & Company 116
Page ii GAO-10-861 Lessons Learned from Bank Stress Test
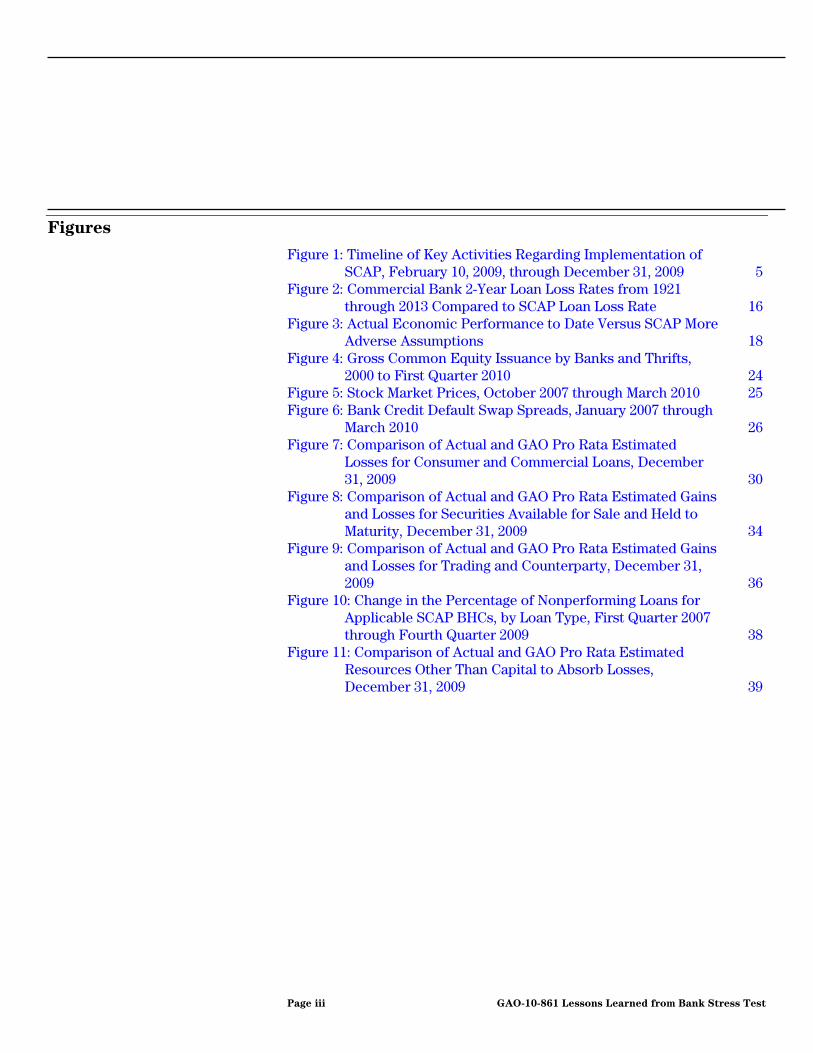
Figures
Figure 1: Timeline of Key Activities Regarding Implementation of SCAP, February 10, 2009, through December 31, 2009 5
Figure 2: Commercial Bank 2-Year Loan Loss Rates from 1921 through 2013 Compared to SCAP Loan Loss Rate 16
Figure 3: Actual Economic Performance to Date Versus SCAP More Adverse Assumptions 18
Figure 4: Gross Common Equity Issuance by Banks and Thrifts, 2000 to First Quarter 2010 24
Figure 5: Stock Market Prices, October 2007 through March 2010 25 Figure 6: Bank Credit Default Swap Spreads, January 2007 through
March 2010 26 Figure 7: Comparison of Actual and GAO Pro Rata Estimated
Losses for Consumer and Commercial Loans, December 31, 2009 30
Figure 8: Comparison of Actual and GAO Pro Rata Estimated Gains and Losses for Securities Available for Sale and Held to Maturity, December 31, 2009 34
Figure 9: Comparison of Actual and GAO Pro Rata Estimated Gains and Losses for Trading and Counterparty, December 31, 2009 36
Figure 10: Change in the Percentage of Nonperforming Loans for Applicable SCAP BHCs, by Loan Type, First Quarter 2007 through Fourth Quarter 2009 38
Figure 11: Comparison of Actual and GAO Pro Rata Estimated Resources Other Than Capital to Absorb Losses, December 31, 2009 39
Page iii GAO-10-861 Lessons Learned from Bank Stress Test
Abbreviations
ALLL allowance for loan and lease losses BHC bank holding company BB&T BB&T Corporation CAP Capital Assistance Program CES common equivalent securities CPP Capital Purchase Program DTA deferred tax asset EESA Emergency Economic Stabilization Act of 2008 ESOP Employee Stock Ownership Plan FDIC Federal Deposit Insurance Corporation FSP Financial Stability Plan GDP gross domestic product GMAC GMAC LLC ICAAP internal capital adequacy assessment process OCC Office of the Comptroller of the Currency PPNR preprovision net revenue SCAP Supervisory Capital Assessment Program TARP Troubled Asset Relief Program TIP Targeted Investment Program Y-9C Consolidated Financial Statements for Bank Holding Companies–FR Y-9C
This is a work of the U.S. government and is not subject to copyright protection in the United States. The published product may be reproduced and distributed in its entirety without further permission from GAO. However, because this work may contain copyrighted images or other material, permission from the copyright holder may be necessary if you wish to reproduce this material separately.
Page iv GAO-10-861 Lessons Learned from Bank Stress Test
Page 1 GAO-10-861
United States Government Accountability Office
Washington, DC 20548
September 29, 2010
Congressional Committees
The recent financial crisis seriously undermined confidence in the nation’s financial system and institutions. In February 2009, to help restore confidence, the U.S. Department of the Treasury (Treasury) announced the Financial Stability Plan, which established the Supervisory Capital Assessment Program (SCAP).1 SCAP, as implemented by the Board of Governors of the Federal Reserve System (Federal Reserve) and other federal banking regulators,2 was to determine through a stress test whether the largest 19 U.S. bank holding companies (BHC)3 had enough capital for the next 2 years (2009-2010) to support their lending activities and survive a second similar economic shock.4 As of December 31, 2008, the largest 19 BHCs accounted for approximately 67 percent of the assets and more than 50 percent of loans in the U.S. banking system. BHCs that were found to need additional capital would be allowed, and were encouraged, to raise the funds privately, but if they could not, Treasury would provide capital infusions using funding available under the Troubled Asset Relief Program’s (TARP) Capital Assistance Program
1Treasury, Financial Stability Plan (Feb. 10, 2009). SCAP was a key component of the Capital Assistance Program.
2The other federal banking regulators involved in SCAP were the Federal Deposit Insurance Corporation and the Office of the Comptroller of the Currency. The Office of Thrift Supervision did not participate. The Federal Reserve led the SCAP stress test since it is the primary federal bank regulator for bank holding companies.
3The 19 BHCs each had at least $100 billion in risk-weighted assets as of December 31, 2008, meeting the established threshold for required participation in the SCAP stress test. Risk-weighted assets are the total assets and off-balance sheet items, adjusted for risks that institutions hold. A BHC is a company that owns or controls one or more banks or one that owns or controls one or more BHCs. See 12 U.S.C. § 1841(a). Since a BHC may also own another BHC, which in turn owns or controls a bank, the company at the top of the ownership chain is commonly called the top holder. The Federal Reserve is responsible for regulating and supervising BHCs, even if the bank owned by the holding company is under the primary supervision of a different federal banking agency. For example, the Federal Reserve is responsible for regulating and supervising Citigroup Inc. (the BHC) and the Office of the Comptroller of the Currency is responsible for regulating and supervising Citibank N.A. (the main bank in the holding company structure).
4Capital is a source of long-term funding, contributed largely by a bank’s equity stockholders and its own returns in the form of retained earnings that provides banks with a cushion to absorb unexpected losses. A stress test is a “what-if” scenario that is not a prediction or expected outcome of the economy.
Lessons Learned from Bank Stress Test
(CAP).5 However, Treasury made no investments under CAP and terminated the program in November 2009. When SCAP was first announced in February 2009, and again around the time the Federal Reserve released the results of the stress test in May 2009, some academics, market participants, and others raised concerns about the test, noting that the assumptions used in the more adverse economic scenario were not severe enough and that the test did not account for differences in institutions’ business models.
As part of GAO’s continued analysis and monitoring of Treasury’s process for implementing the Emergency Economic Stabilization Act of 2008,6 this report on the stress test expands on SCAP activities that we reported on in June 2009.7 Specifically, this report (1) describes the process used to design and conduct the stress test and participants’ views on the process, (2) describes the extent to which the stress test achieved its goals and compares its estimates with the BHCs’ actual results, and (3) identifies the lessons regulators and BHCs learned from SCAP and examines how each are using those lessons to enhance their risk identification and assessment practices.
To meet the report’s objectives, we reviewed the Federal Reserve’s The
Supervisory Capital Assessment Program: Design and Implementation (SCAP design and implementation document) dated April 24, 2009, and The Supervisory Capital Assessment Program: Overview of Results
(SCAP results document) dated May 7, 2009. In addition to the publicly released BHC-level loss estimates, we analyzed the initial stress test results that the Federal Reserve provided to each BHC, the subsequent adjustments the Federal Reserve made to these results, and its reasons for making them. We also reviewed the BHCs’ quarterly regulatory filings, such as the Federal Reserve’s 2009 Consolidated Financial Statements for
5GAO is required to report at least every 60 days on TARP activities and performance. TARP was authorized under the Emergency Economic Stabilization Act of 2008 (EESA), Pub. L. No. 110-343, 122 Stat. 3765 (2008), codified at 12 U.S.C. §§ 5201 et seq. EESA originally authorized Treasury to purchase or guarantee up to $700 billion in troubled assets. The Helping Families Save Their Homes Act of 2009, Pub. L. No. 111-22, Div. A, 123 Stat. 1632 (2009), codified at 12 U.S.C. § 5225(a)(3), amended ESSA to reduce the maximum allowable amount of outstanding troubled assets under ESSA by almost $1.3 billion, from $700 billion to $698.741 billion.
612 U.S.C. § 5226.
7GAO, Troubled Asset Relief Program: June 2009 Status of Efforts to Address
Transparency and Accountability Issues, GAO-09-658 (Washington, D.C.: June 2009).
Page 2 GAO-10-861 Lessons Learned from Bank Stress Test
Bank Holding Companies—FR Y-9C (Y-9C); form 10-Qs and annual form 10-Ks; speeches, testimonies, and articles regarding SCAP and stress testing; and BHC presentations to shareholders and earnings reports. To more completely understand the execution of SCAP, we completed a literature search of stress tests that other entities have conducted, such as the Committee of European Banking Supervisors and the International Monetary Fund. We also reviewed the Congressional Oversight Panel’s analysis of SCAP. In addition, we reviewed the capital plans of the 10 BHCs that were required to raise capital to satisfy their SCAP capital requirement. We collected and analyzed data on the BHCs’ actual performance from a private financial database of public information and compared it with the 2-year SCAP estimates and with GAO’s 1-year pro rata loss estimates for the more adverse scenario (pro rata loss estimate). GAO calculated the pro rata loss estimates by dividing the SCAP more adverse 2-year loss estimates by 2. This pro rata estimate methodology has some limitations, because losses, expenses, revenues, and changes to reserves are historically unevenly distributed and loss rates over a 2-year period in an uncertain economic environment can follow an inconsistent path. However, the Federal Reserve, the Office of the Comptroller of the Currency (OCC), credit rating agencies, an SNL Financial analyst, and all of the BHCs we interviewed that are tracking performance relative to SCAP estimates are also using the same methodology. We obtained Federal Reserve and BHCs comments on our performance comparison. Further, we interviewed regulatory and BHC officials to get their views on the SCAP stress test. Regulatory officials included bank examiners, economists, and attorneys from the Federal Reserve; the Federal Reserve district banks; the OCC; the Federal Deposit Insurance Corporation (FDIC); the Office of Thrift Supervision; and BHC senior officials, including chief financial officers and chief risk officers, who participated in the SCAP stress test and were responsible for coordinating and discussing the results with regulators. These officials represented several types of BHCs, including traditional, custodial, investment, auto finance, and credit card institutions. Finally, we met with credit rating agency officials to get their views on SCAP and understand their own stress testing practices for banks. For additional information on the scope and methodology for this engagement, see appendix I.
We conducted this performance audit from August 2009 to September 2010 in accordance with generally accepted government auditing standards. Those standards require that we plan and perform the audit to obtain sufficient, appropriate evidence to provide a reasonable basis for our findings and conclusions based on our audit objectives. We believe that
Page 3 GAO-10-861 Lessons Learned from Bank Stress Test
the evidence obtained provides a reasonable basis for our findings and conclusions based on our audit objectives.
Despite efforts undertaken by TARP to bolster capital of the largest financial institutions, market conditions in the beginning of 2009 were deteriorating and public confidence in the ability of financial institutions to withstand losses and to continue lending were further declining. On February 10, 2009, Treasury announced the Financial Stability Plan, which outlined measures to address the financial crisis and restore confidence in the U.S. financial and housing markets. The goals of the plan were to (1) restart the flow of credit to consumers and businesses, (2) strengthen financial institutions, and (3) provide aid to homeowners and small businesses. Under SCAP, the stress test would assess the ability of the largest 19 BHCs to absorb losses if economic conditions deteriorated further in a hypothetical “more adverse” scenario, characterized by a sharper and more protracted decline in gross domestic product (GDP) growth,8 a steeper drop in home prices, and a larger rise in the unemployment rate than in a baseline consensus scenario. BHCs that were found not to meet the SCAP capital buffer requirement under the “more adverse” scenario would need to provide a satisfactory capital plan to address any shortfall by raising funds, privately if possible. CAP, which was a key part of the plan, would provide backup capital to financial institutions unable to raise funds from private investors. Any of the 19 BHCs that participated in the stress test and had a capital shortfall could apply for capital from CAP immediately if necessary.9 The timeline in figure 1 provides some highlights of key developments in the implementation of SCAP.
Background
8Percent change in the annual average of real GDP. GDP is defined as the total market value of goods and services produced domestically during a given period (i.e., one year).
9Financial institutions that were not subject to the stress test could, after supervisory review, also apply for capital from CAP if they were in need of additional capital.
Page 4 GAO-10-861 Lessons Learned from Bank Stress Test

Figure 1: Timeline of Key Activities Regarding Implementation of SCAP, February 10, 2009, through December 31, 2009
2009
May 8: Wells Fargo & Company issues $8.6 billion and Morgan Stanley Inc. issues $8 billion in equity and debt to meet SCAP capital requirements and/or pay back taxpayer money.
Sept. 30: All BHCs but GMAC Inc. have met or exceeded the capital requirements of the more adverse scenario.
Dec. 30: GMAC Inc. is given $3.8 billion in taxpayer money under TARP’s Automotive Industry Financing Program to meet the level of capital required by the stress test.
Source: GAO.
Feb.
April 24: The Federal Reserve releases information regarding the design and implementation of the stress test.
May 7: The Federal
Reserve announces the
results of the stress test and 10
of the 19 BHCs are found to need
capital.
Feb. 10: Treasury announces the Financial Stability Plan (FSP) to stabilize and repair the financial system and support the flow of credit. A key component of FSP is CAP and a key part of CAP is SCAP.
Feb. 23: Treasury announces SCAP or stress test of the largest 19 U.S. BHCs.
Feb. 25: Treasury announces the terms and conditions for CAP.
June 8: The 10 BHCs that required capital under SCAP submit plans to raise capital.
May 21: Treasury announces a $3.5 billion investment in GMAC LLC to help meet its stress test capital needs.
June 17:Nine of the 19 SCAP BHCs repurchased their preferred stock from Treasury.
June 30:GMAC LLC, a Delaware limited liability company, was converted into a Delaware corpora-tion and renamed GMAC Inc.
Nov. 9:Deadline for raising capital. GMAC Inc. is the only BHC unable to raise the capital as required by SCAP. Also, Treasury closes CAP with no investments having been made.
April May June Sept. Nov. Dec.
Note: On May 10, 2010, GMAC Inc. changed its name to Ally Financial Inc.
In a joint statement issued on February 10, 2009, Treasury, along with the Federal Reserve, FDIC, and OCC (collectively referred to as the SCAP regulators), committed to design and implement the stress test. According to a Treasury official, the department generally did not participate in the design or implementation of SCAP, but was kept informed by the Federal Reserve during the stress test. The SCAP regulators developed economic assumptions to estimate the potential impact of further losses on BHCs’ capital under two scenarios. The baseline scenario reflected the consensus view about the depth and duration of the recession, and the more adverse scenario reflected a plausible but deeper and longer recession than the consensus view. Regulators then calculated how much capital, if any, was required for each BHC to achieve the required SCAP buffer at the end of 2010 under the more adverse scenario.
The SCAP assessment examined tier 1 capital and tier 1 common capital, and the BHCs were required to raise capital to meet any identified capital shortfall (either tier 1 capital or tier 1 common capital). Tier 1 risk-based capital is considered core capital—the most stable and readily available
Page 5 GAO-10-861 Lessons Learned from Bank Stress Test

for supporting a bank’s operations and includes elements such as common stock and noncumulative perpetual preferred stock.10 SCAP’s focus on tier 1 common capital, a subset of tier 1 capital, reflects the recent regulatory push for BHCs to hold a higher quality of capital.11 The focus on common equity reflected both the long held view by bank supervisors that common equity should be the dominant component of tier 1 capital and increased market scrutiny of common equity ratios, driven in part by deterioration in common equity during the financial crisis. Common equity offers protection to more senior parts of the capital structure because it is the first to absorb losses in the capital structure. Common equity also gives a BHC greater permanent loss absorption capacity and greater ability to conserve resources under stress by changing the amount and timing of dividends and other distributions.
To protect against risks, financial regulators set minimum standards for the capital that firms are to hold.12 However, SCAP set a one-time minimum capital buffer target for BHCs to hold to protect against losses and preprovision net revenue (PPNR) that were worse than anticipated during the 2009 to 2010 period.13 For the purposes of SCAP, the one-time target capital adequacy ratios are at least 6 percent of risk-weighted assets in tier 1 capital and at least 4 percent in tier 1 common capital projected as of December 31, 2010. For the purposes of the projection, the regulators assumed that BHCs would suffer the estimated losses and earned revenues in 2009 and 2010 in the more adverse scenario. SCAP regulators conducted the stress test strictly on the BHCs’ assets as of December 31, 2008,14 and—with the exception of off-balance sheet positions subject to
10Common stock is a security that represents ownership in a company and gives the stockholder the right to vote for the company’s board of directors and benefit from its financial success. Noncumulative perpetual preferred stock is a security that has no fixed maturity date and pays its stated dividend forever or “in perpetuity,” but any unpaid dividends do not accumulate or accrue to stockholders.
11In general, tier 1 common capital is voting common equity subject to certain deductions from capital.
12For example, to be well-capitalized under Federal Reserve definitions, on a consolidated basis, a BHC must have a tier 1 risk-based capital ratio of at least 6 percent of total risk-weighted assets, among other things, 12 C.F.R. § 225.2(r)(1)(ii).
13PPNR is defined as net interest income plus noninterest income minus noninterest expense.
14Trading book positions and counterparty exposures were stress tested as of February 20, 2009.
Page 6 GAO-10-861 Lessons Learned from Bank Stress Test
Financial Accounting Statements No. 166 and 167, which assumed in the analysis to come on balance sheet as of January 1, 2010—did not take intaccount any changes in the composition of their balance sheets over theyear time fram
o 2-
e.15
Stress testing is one of many risk management tools used by both BHCs and regulators. Complex financial institutions need management information systems that can help firms to identify, assess, and manage a full range of risks across the whole organization arising from both internal and external sources and from assets and obligations that are found both on and off the BHC’s balance sheet. This approach is intended to help ensure that a firmwide approach to managing risk has been viewed as being crucial for responding to rapid and unanticipated changes in financial markets. Risk management also depends on an effective corporate governance system that addresses risk across the institution and also within specific areas, such as subprime mortgage lending.16 The board of directors, senior management, audit committee, internal auditors, external auditors, and others play important roles in effectively operating a risk management system. The different roles of each of these groups represent critical checks and balances in the overall risk management system. However, the management information systems at many financial institutions have been called into question since the financial crisis began in 2007. Identified shortcomings, such as lack of firmwide stress testing, have led banking organizations and their regulators to reassess capital
15These statements became effective on January 1, 2010, and require banking organizations to bring onto their balance sheets off-balance sheet positions. However, for regulatory purposes, the BHCs and other institutions may defer bringing such positions onto their balance sheets until the end of 2010.
16Subprime mortgages are mortgages granted to borrowers whose credit history includes significant impairments resulting in lower credit scores.
Page 7 GAO-10-861 Lessons Learned from Bank Stress Test

requirements, risk management practices, and other aspects of bank regulation and supervision.17
Stress testing has been used throughout the financial industry for more than 10 years, but has recently evolved as a risk management tool in response to the urgency of the financial crisis. The main evolution is towards the use of comprehensive firmwide stress testing as an integral and critical part of firms’ internal capital adequacy assessment processes. In the case of SCAP, the intent of the stress test was to help ensure that the capital held by a BHC is sufficient to withstand a plausible adverse economic environment over the 2-year time frame ending December 31, 2010. The Basel Committee on Banking Supervision (Basel Committee) issued a document in May 2009 outlining several principles for sound stress testing practices and supervision.18 The Basel Committee document endorses stress testing by banks as a part of their internal risk management to assess the following:
• Credit risk. The potential for financial losses resulting from the failure of a borrower or counterparty to perform on an obligation.
• Market risk. The potential for financial losses due to an increase or decrease in the value of an asset or liability resulting from broad price movements; for example, in interest rates, commodity prices, stock prices, or the relative value of currencies (foreign exchange).
17For a more detailed discussion about risk management practices in place during the market turmoil, see the following reports: Senior Supervisors Group, Observations on Risk
Management Practices during the Recent Market Turbulence (New York, Mar. 6, 2008); The President’s Working Group on Financial Markets, Policy Statement on Financial
Market Developments (March 2008); International Monetary Fund, Global Financial
Stability Report: Containing Systemic Risk and Restoring Financial Soundness
(Washington, D.C., April 2008); Financial Stability Forum, Report of the Financial Stability
Forum on Enhancing Market and Institutional Resilience (April 2008); Institute of International Finance, Final Report of the IIF Committee on Market Best Practices:
Principles of Conduct and Best Practice Recommendations (July 2008); Credit Risk Management Policy Group III, Containing Systemic Risk: The Road to Reform (August 2008); and Senior Supervisors Group, Risk Management Lessons from the Global Banking
Crisis of 2008 (Oct. 21, 2009).
18The Basel Committee seeks to improve the quality of banking supervision worldwide, in part by developing broad supervisory standards. The Basel Committee consists of central bank and regulatory officials from 27 member countries. The Basel Committee’s supervisory standards are also often adopted by nonmember countries. See Basel Committee on Banking Supervision, Principles for Sound Stress Testing Practices and
Supervision. (Basel, Switzerland, May 2009).
Page 8 GAO-10-861 Lessons Learned from Bank Stress Test
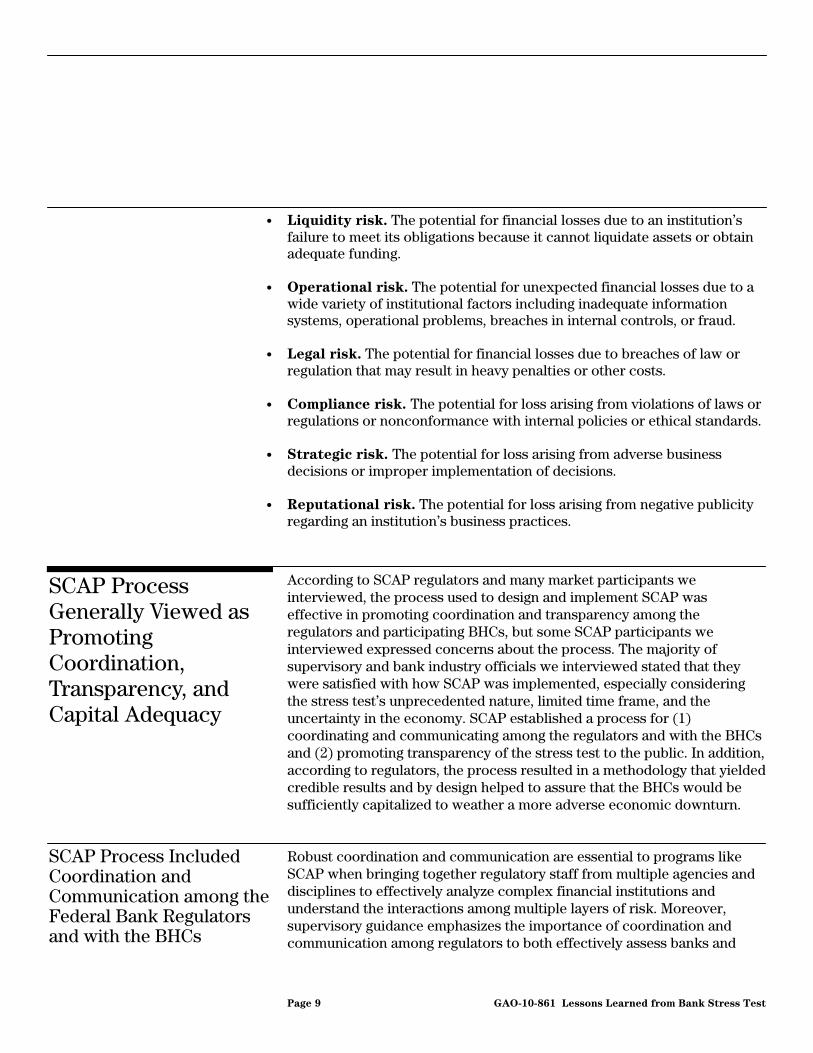
• Liquidity risk. The potential for financial losses due to an institution’s failure to meet its obligations because it cannot liquidate assets or obtain adequate funding.
• Operational risk. The potential for unexpected financial losses due to a wide variety of institutional factors including inadequate information systems, operational problems, breaches in internal controls, or fraud.
• Legal risk. The potential for financial losses due to breaches of law or regulation that may result in heavy penalties or other costs.
• Compliance risk. The potential for loss arising from violations of laws or regulations or nonconformance with internal policies or ethical standards.
• Strategic risk. The potential for loss arising from adverse business
decisions or improper implementation of decisions. • Reputational risk. The potential for loss arising from negative publicity
regarding an institution’s business practices.
According to SCAP regulators and many market participants we interviewed, the process used to design and implement SCAP was effective in promoting coordination and transparency among the regulators and participating BHCs, but some SCAP participants we interviewed expressed concerns about the process. The majority of supervisory and bank industry officials we interviewed stated that they were satisfied with how SCAP was implemented, especially considering the stress test’s unprecedented nature, limited time frame, and the uncertainty in the economy. SCAP established a process for (1) coordinating and communicating among the regulators and with the BHCs and (2) promoting transparency of the stress test to the public. In addition, according to regulators, the process resulted in a methodology that yielded credible results and by design helped to assure that the BHCs would be sufficiently capitalized to weather a more adverse economic downturn.
SCAP Process Generally Viewed as Promoting Coordination, Transparency, and Capital Adequacy
SCAP Process Included Coordination and Communication among the Federal Bank Regulators and with the BHCs
Robust coordination and communication are essential to programs like SCAP when bringing together regulatory staff from multiple agencies and disciplines to effectively analyze complex financial institutions and understand the interactions among multiple layers of risk. Moreover, supervisory guidance emphasizes the importance of coordination and communication among regulators to both effectively assess banks and
Page 9 GAO-10-861 Lessons Learned from Bank Stress Test

conduct coordinated supervisory reviews across a group of peer institutions, referred to as “horizontal examinations.”
The regulators implemented each phase of SCAP in a coordinated interagency fashion. Also, while some disagreed, most regulators and market participants we interviewed were satisfied with the level of coordination and communication. They also thought that the SCAP process could serve as a model for future supervisory efforts. The regulators executed the SCAP process in three broad phases:
• In the first phase, the Analytical Group, comprising interagency economists and supervisors, generated two sets of economic conditions—a baseline scenario and a more adverse scenario with a worse-than-expected economic outcome—and then used these scenarios to aid in estimating industrywide indicative loan loss rates. To develop these scenarios, the Analytical Group used three primary indicators of economic health: the U.S. GDP, housing prices in 10 key U.S. cities,19 and the annual average U.S. unemployment rate.20 The baseline scenario reflected the consensus view of the course for the economy as of February 2009, according to well-known professional economic forecasters.21 The Federal Reserve developed the more adverse scenario from the baseline scenario by taking into account the historical accuracy of the forecasts for unemployment and the GDP and the uncertainty of the economic outlook at that time by professional forecasters. The Federal Reserve also used regulators’ judgment about the appropriate severity of assumed additional stresses against which BHCs would be required to hold a capital buffer, given that the economy was already in a recession at the initiation of SCAP.
• In the second phase, several Supervisory Analytical and Advisory Teams—comprising interagency senior examiners, economists, accountants, lawyers, financial analysts, and other professionals from the SCAP regulators—collected, verified, and analyzed each BHC’s estimates for
19Regulators used the Case-Shiller 10-City Composite index to forecast changes in housing prices.
20The unemployment rate is the number of jobless people who are available for work but not currently employed and are actively seeking jobs, expressed as a percentage of the labor force.
21According to the Federal Reserve’s SCAP design and implementation document, the professionals are the Consensus Forecasts, Blue Chip survey, and Survey of Professional Forecasters.
Page 10 GAO-10-861 Lessons Learned from Bank Stress Test
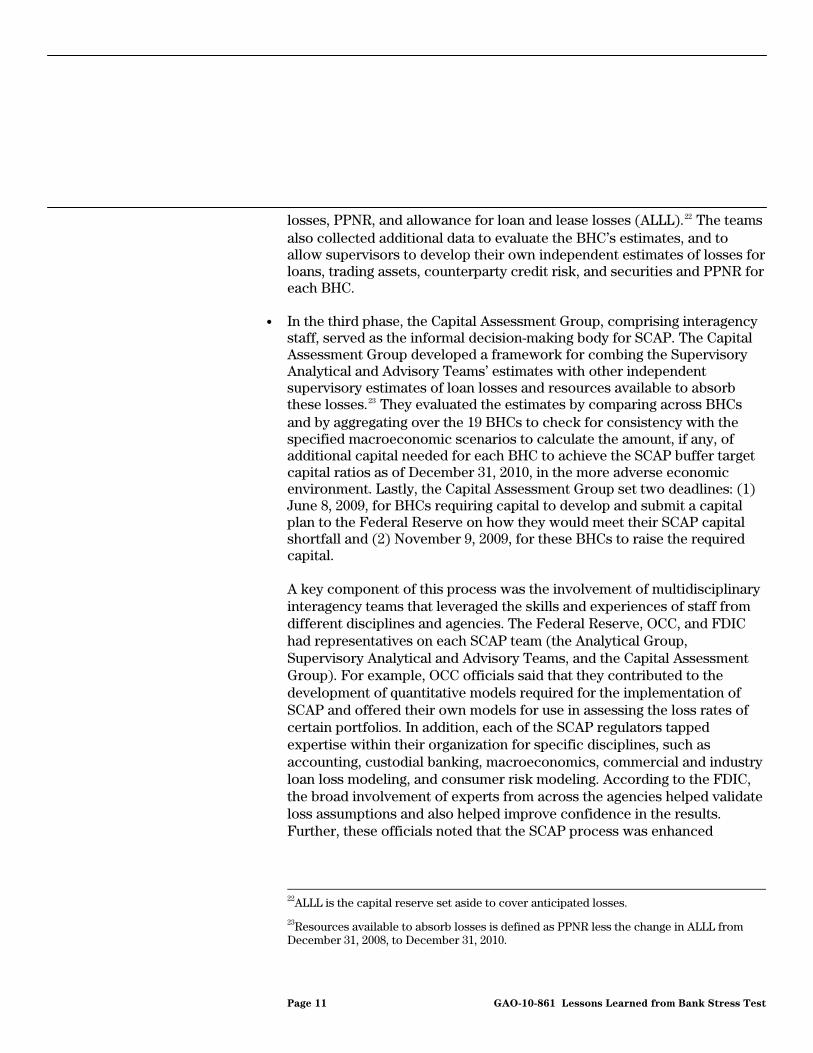
losses, PPNR, and allowance for loan and lease losses (ALLL).22 The teams also collected additional data to evaluate the BHC’s estimates, and to allow supervisors to develop their own independent estimates of losses for loans, trading assets, counterparty credit risk, and securities and PPNR for each BHC.
• In the third phase, the Capital Assessment Group, comprising interagency
staff, served as the informal decision-making body for SCAP. The Capital Assessment Group developed a framework for combing the Supervisory Analytical and Advisory Teams’ estimates with other independent supervisory estimates of loan losses and resources available to absorb these losses.23 They evaluated the estimates by comparing across BHCs and by aggregating over the 19 BHCs to check for consistency with the specified macroeconomic scenarios to calculate the amount, if any, of additional capital needed for each BHC to achieve the SCAP buffer target capital ratios as of December 31, 2010, in the more adverse economic environment. Lastly, the Capital Assessment Group set two deadlines: (1) June 8, 2009, for BHCs requiring capital to develop and submit a capital plan to the Federal Reserve on how they would meet their SCAP capital shortfall and (2) November 9, 2009, for these BHCs to raise the required capital. A key component of this process was the involvement of multidisciplinary interagency teams that leveraged the skills and experiences of staff from different disciplines and agencies. The Federal Reserve, OCC, and FDIC had representatives on each SCAP team (the Analytical Group, Supervisory Analytical and Advisory Teams, and the Capital Assessment Group). For example, OCC officials said that they contributed to the development of quantitative models required for the implementation of SCAP and offered their own models for use in assessing the loss rates of certain portfolios. In addition, each of the SCAP regulators tapped expertise within their organization for specific disciplines, such as accounting, custodial banking, macroeconomics, commercial and industry loan loss modeling, and consumer risk modeling. According to the FDIC, the broad involvement of experts from across the agencies helped validate loss assumptions and also helped improve confidence in the results. Further, these officials noted that the SCAP process was enhanced
22ALLL is the capital reserve set aside to cover anticipated losses.
23Resources available to absorb losses is defined as PPNR less the change in ALLL from December 31, 2008, to December 31, 2010.
Page 11 GAO-10-861 Lessons Learned from Bank Stress Test

because productive debate became a common event as team members from different regulatory agencies and disciplines brought their own perspectives and ideas to the process. For example, some SCAP staff argued for a more moderate treatment of securities in BHCs’ available for sale portfolios, which would have been consistent with generally accepted accounting principles under a new change in accounting standards.24 They maintained that the modified accounting standard for declines in market value (and discounting the impact of liquidity premia) that had been implemented after the stress test was announced and before the numbers had been finalized was in some ways more reflective of the realized credit loss expectations for the affected securities. After significant discussion, the regulators decided to allow for the accounting change in the baseline loss estimates, but not in the more adverse scenario estimates. They believed that under the more adverse scenario there was a heightened possibility of increased liquidity demands on banks and that many distressed securities would need to be liquidated at distressed levels. Consequently, for securities found to be other than temporarily impaired in the more adverse scenario, they assumed the firm would have to realize all unrealized losses (i.e., write down the value of the security to market value as of year end 2008).25 Similarly, some staff argued against adopting other changes in accounting standards that were expected to impact BHCs’ balance sheets, including their capital adequacy. Primary among these was the inclusion of previously off-balance sheet items.26 As noted above, ultimately, the more conservative approach prevailed and the expected inclusion of these assets was addressed in SCAP.
To facilitate coordination, the Federal Reserve instituted a voting system to resolve any contentious issues, but in practice differences among regulators were generally resolved through consensus. When SCAP regulators met, the Federal Reserve led the discussions and solicited input from other regulators. For example, officials from OCC and FDIC both told us that they felt that they were adequately involved in tailoring the
24Financial Accounting Standards Board position numbers 115-2 and 124-2 focus on whether firms with debt securities held in the available for sale and held to maturity accounts intended or would be required to sell securities at a lower price than its cost basis. Generally accepted accounting principles are a widely accepted set of rules, conventions, standards, and procedures for reporting financial information established by the Financial Accounting Standards Board.
25Other than temporarily impaired write down is measured as the difference between a security’s book value and market value.
26See Financial Accounting Statements No. 166 and 167.
Page 12 GAO-10-861 Lessons Learned from Bank Stress Test

aggregate loss estimates to each BHC as part of the determination of each BHC’s SCAP capital requirement. SCAP regulators were also involved in drafting the design and results documents, which were publicly released by the Federal Reserve.
Representatives from most of the BHCs were satisfied with the SCAP regulators’ coordination and communication. Many of the BHC officials stated that they were generally impressed with the onsite SCAP teams and said that these teams improved the BHCs’ coordination and communication with the regulators. BHC officials said that they usually received answers to their questions in a timely manner, either during conference calls held three times a week, through the distribution of answers to frequently asked questions, or from onsite SCAP examiners. Collecting and aggregating data were among the most difficult and time-consuming tasks for BHCs, but most of them stated that the nature of the SCAP’s requests were clear. At the conclusion of SCAP, the regulators presented the results to each of the institutions showing the final numbers that they planned to publish.
Market Participants Generally Agreed that the SCAP Process Was Transparent
The SCAP process included steps to promote transparency, such as the release of key program information to SCAP BHCs and the public. According to SCAP regulators, BHCs, and credit rating agency officials we interviewed, the release of the results provided specific information on the financial health and viability of the 19 largest BHCs regarding their ability to withstand additional losses during a time of significant uncertainty. Many experts have said that the lack of transparency about potential losses from certain assets contributed significantly to the instability in financial markets during the current crisis. Such officials also stated that publicly releasing the methodology and results of the stress test helped strengthen market confidence. Further, many market observers have commented that the Federal Reserve’s unprecedented disclosure of sensitive supervisory information for each BHC helped European bank regulators decide to publicly release detailed results of their own stress tests in July 2010.
Not all SCAP participants agreed that the SCAP process was fully transparent. For example, some participants questioned the transparency of certain assumptions used in developing the stress test. According to BHC officials and one regulator, the Federal Reserve could have shared
Page 13 GAO-10-861 Lessons Learned from Bank Stress Test
more detailed information about SCAP loss assumptions and calculations with BHCs.27 According to several BHC officials, the Federal Reserve did not fully explain the methodology for estimating losses but expected BHC officials to fully document and provide supporting data for all of their assumptions. Without knowing the details of the methodology, according to some BHC officials, they could not efficiently provide all relevant information to SCAP examiners.
SCAP Was Designed to Help Ensure That BHCs Were Adequately Capitalized Under the More Adverse Economic Scenario
SCAP regulators aimed to ensure that SCAP sufficiently stressed BHCs’ risk exposures and potential PPNR under the more adverse scenario. To accomplish this, the regulators made what they viewed to be conservative assumptions and decisions in the following areas. First, the regulators decided to stress only assets that were on the BHCs’ balance sheets as of December 31, 2008, (i.e., a static approach) without accounting for new business activity. According to BHC officials, new loans were thought to have generally been of better quality than legacy loans because BHCs had significantly tightened their underwriting standards since the onset of the financial crisis.28 As a result, BHCs would have been less likely to charge-off these loans within the SCAP time period ending December 31, 2010, resulting in the potential for greater reported revenue estimates for the period. By excluding earnings from new business, risk-weighted assets were understated, charge-off rates were overstated, and projected capital levels were understated.
Second, SCAP regulators generally did not allow the BHCs to cut expenses to address the anticipated drop in revenues under the more adverse scenario. However, some BHC officials told us that they would likely cut expenses, including initiating rounds of layoffs, if the economy performed in accordance with the more adverse economic scenario, especially if they were not generating any new business. Federal Reserve officials noted that BHCs were given credit in the stress test for cost cuts made in the first quarter of 2009.
27In its June 2009 SCAP analysis report, the Congressional Oversight Panel also noted that there was a lack of transparency about the linkage between the loan losses and the three macroeconomic assumptions.
28According to the Federal Reserve, legacy loans refer to those bank loans made during the 2005 to 2007 period. Underwriting standards refer to guidelines used by lenders to ensure that loans meet credit standards and that the terms and conditions of a loan are appropriate to its risk and maturity.
Page 14 GAO-10-861 Lessons Learned from Bank Stress Test

Third, some BHCs were required to assume an increase in their ALLL as of the end of 2010, if necessary, to ensure adequate reserves relative to their year end 2010 portfolio. Some BHC officials believed that this requirement resulted in the BHCs having to raise additional capital because the required ALLL increases were subtracted from the revenue estimates in calculating the resources available to absorb losses. This meant that some BHCs judged to have insufficient year end 2010 reserve adequacy had to account for this shortcoming in the calculation of capital needed to meet the SCAP targeted capital requirements as of the end of 2010 while maintaining a sufficient ALLL for 2011 losses under the more adverse economic scenario. According to some BHCs, the size of the 2010 ALLL was severe given the extent of losses are already included in the 2009 and 2010 loss estimates and effectively stressed BHCs for a third year.
Finally, according to many BHC officials and others, the calculations used to derive the loan loss rates and other assumptions to stress the BHCs were conservative (i.e., more severe). For example, the total loan loss rate estimated by the SCAP regulators was 9.1 percent, which was greater than the historical 2-year loan loss rates at all commercial banks from 1921 until 2008, including the worst levels seen during the Great Depression (see figure 2). However, the macroeconomic assumptions of the more adverse scenario, which we will discuss later in the report, did not meet the definition of a depression. Specifically, a 25 percent unemployment rate coupled with economic contraction is indicative of a depression. In contrast, the more adverse scenario estimated approximately a 10 percent unemployment rate with some economic growth in late 2010.
Page 15 GAO-10-861 Lessons Learned from Bank Stress Test
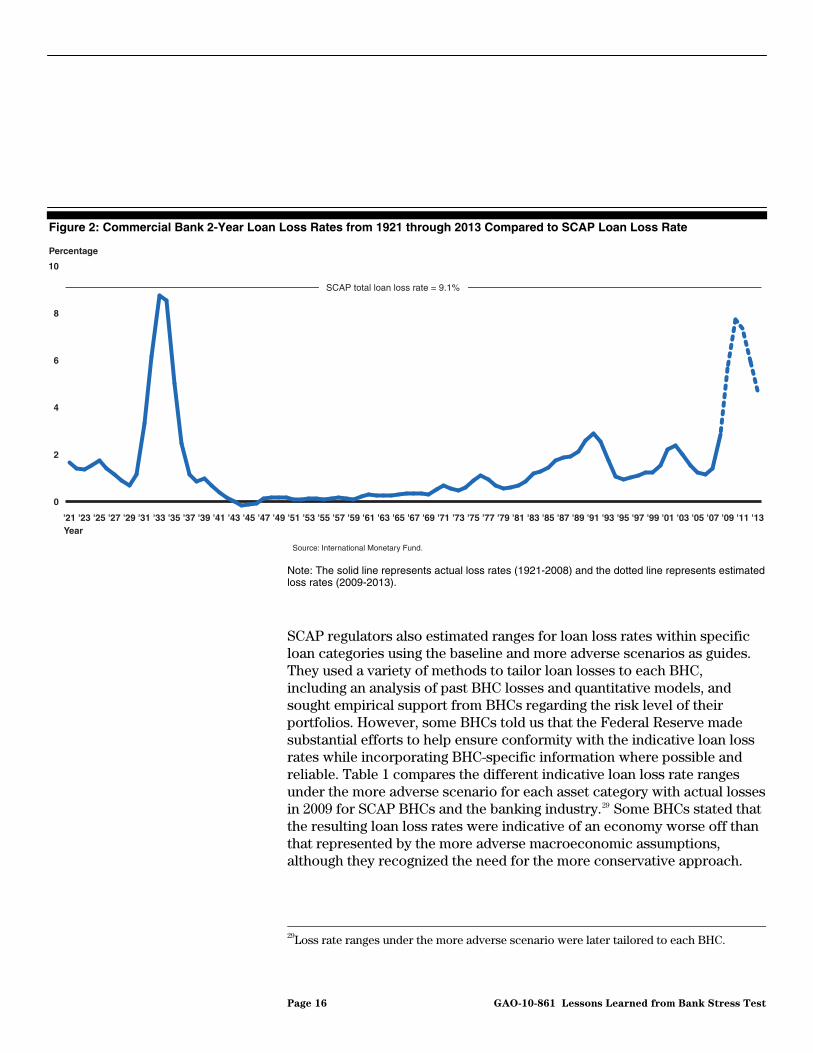
Figure 2: Commercial Bank 2-Year Loan Loss Rates from 1921 through 2013 Compared to SCAP Loan Loss Rate
Source: International Monetary Fund.
Percentage
0
2
4
6
8
10
'13'11'09'07'05'03'01'99'97'95'93'91'89'87'85'83'81'79'77'75'73'71'69'67'65'63'61'59'57'55'53'51'49'47'45'43'41'39'37'35'33'31'29'27'25'23'21Year
SCAP total loan loss rate = 9.1%
Note: The solid line represents actual loss rates (1921-2008) and the dotted line represents estimated loss rates (2009-2013).
SCAP regulators also estimated ranges for loan loss rates within specific loan categories using the baseline and more adverse scenarios as guides. They used a variety of methods to tailor loan losses to each BHC, including an analysis of past BHC losses and quantitative models, and sought empirical support from BHCs regarding the risk level of their portfolios. However, some BHCs told us that the Federal Reserve made substantial efforts to help ensure conformity with the indicative loan loss rates while incorporating BHC-specific information where possible and reliable. Table 1 compares the different indicative loan loss rate ranges under the more adverse scenario for each asset category with actual losses in 2009 for SCAP BHCs and the banking industry.29 Some BHCs stated that the resulting loan loss rates were indicative of an economy worse off than that represented by the more adverse macroeconomic assumptions, although they recognized the need for the more conservative approach.
29Loss rate ranges under the more adverse scenario were later tailored to each BHC.
Page 16 GAO-10-861 Lessons Learned from Bank Stress Test
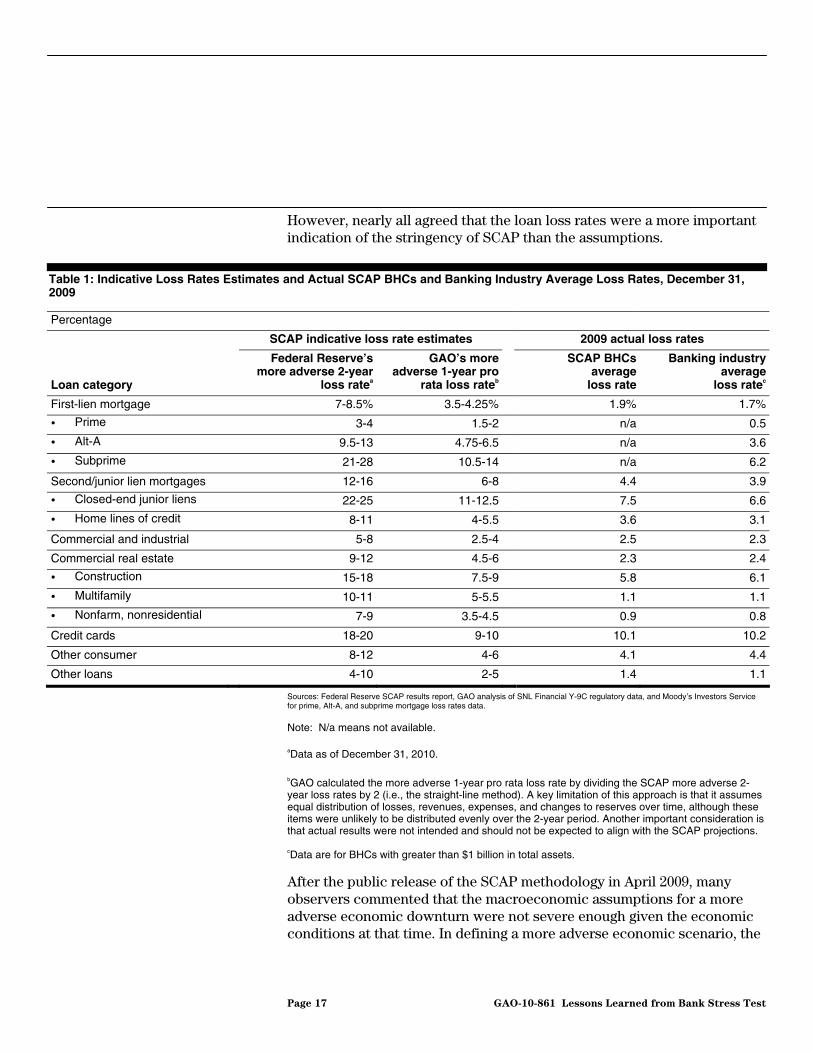
However, nearly all agreed that the loan loss rates were a more important indication of the stringency of SCAP than the assumptions.
Table 1: Indicative Loss Rates Estimates and Actual SCAP BHCs and Banking Industry Average Loss Rates, December 31, 2009
Percentage
SCAP indicative loss rate estimates 2009 actual loss rates
Loan category
Federal Reserve’s more adverse 2-year
loss ratea
GAO’s more adverse 1-year pro
rata loss rateb
SCAP BHCs average loss rate
Banking industry average
loss ratec
First-lien mortgage 7-8.5% 3.5-4.25% 1.9% 1.7%
• Prime 3-4 1.5-2 n/a 0.5
• Alt-A 9.5-13 4.75-6.5 n/a 3.6
• Subprime 21-28 10.5-14 n/a 6.2
Second/junior lien mortgages 12-16 6-8 4.4 3.9
• Closed-end junior liens 22-25 11-12.5 7.5 6.6
• Home lines of credit 8-11 4-5.5 3.6 3.1
Commercial and industrial 5-8 2.5-4 2.5 2.3
Commercial real estate 9-12 4.5-6 2.3 2.4
• Construction 15-18 7.5-9 5.8 6.1
• Multifamily 10-11 5-5.5 1.1 1.1
• Nonfarm, nonresidential 7-9 3.5-4.5 0.9 0.8
Credit cards 18-20 9-10 10.1 10.2
Other consumer 8-12 4-6 4.1 4.4
Other loans 4-10 2-5 1.4 1.1
Sources: Federal Reserve SCAP results report, GAO analysis of SNL Financial Y-9C regulatory data, and Moody’s Investors Service for prime, Alt-A, and subprime mortgage loss rates data.
Note: N/a means not available. aData as of December 31, 2010. bGAO calculated the more adverse 1-year pro rata loss rate by dividing the SCAP more adverse 2-year loss rates by 2 (i.e., the straight-line method). A key limitation of this approach is that it assumes equal distribution of losses, revenues, expenses, and changes to reserves over time, although these items were unlikely to be distributed evenly over the 2-year period. Another important consideration is that actual results were not intended and should not be expected to align with the SCAP projections. cData are for BHCs with greater than $1 billion in total assets.
After the public release of the SCAP methodology in April 2009, many observers commented that the macroeconomic assumptions for a more adverse economic downturn were not severe enough given the economic conditions at that time. In defining a more adverse economic scenario, the
Page 17 GAO-10-861 Lessons Learned from Bank Stress Test
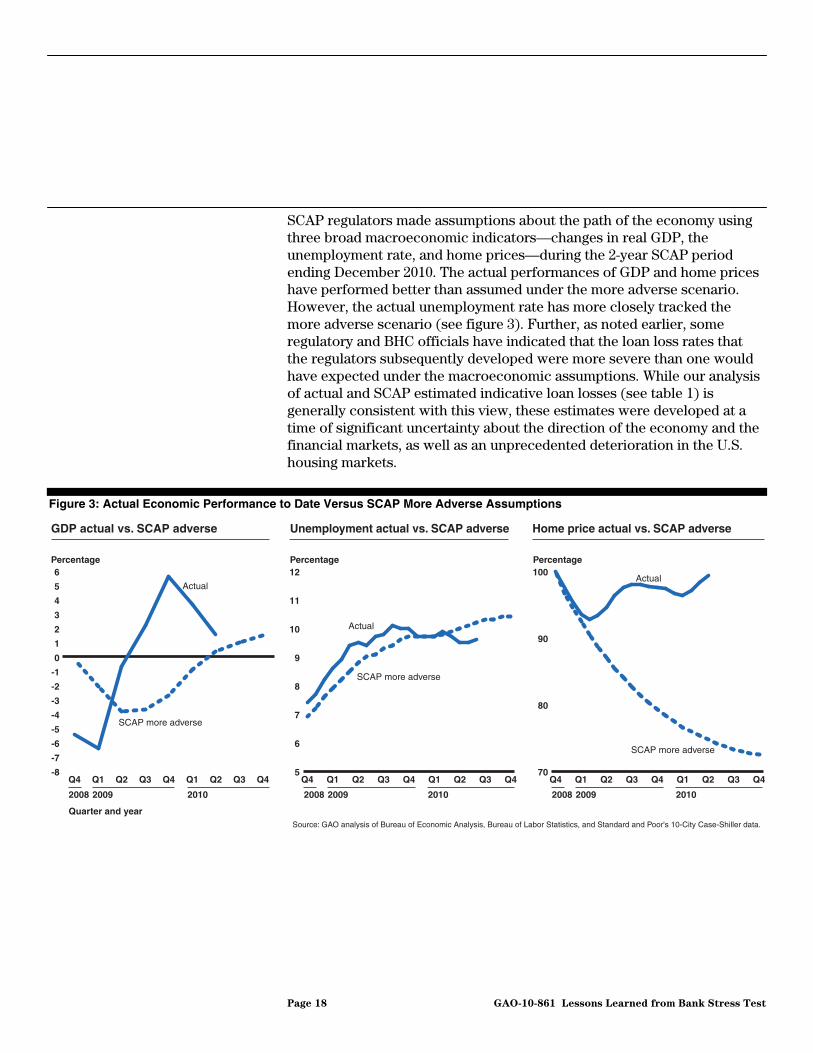
SCAP regulators made assumptions about the path of the economy using three broad macroeconomic indicators—changes in real GDP, the unemployment rate, and home prices—during the 2-year SCAP period ending December 2010. The actual performances of GDP and home prices have performed better than assumed under the more adverse scenario. However, the actual unemployment rate has more closely tracked the more adverse scenario (see figure 3). Further, as noted earlier, some regulatory and BHC officials have indicated that the loan loss rates that the regulators subsequently developed were more severe than one would have expected under the macroeconomic assumptions. While our analysis of actual and SCAP estimated indicative loan losses (see table 1) is generally consistent with this view, these estimates were developed at a time of significant uncertainty about the direction of the economy and the financial markets, as well as an unprecedented deterioration in the U.S. housing markets.
Figure 3: Actual Economic Performance to Date Versus SCAP More Adverse Assumptions
Source: GAO analysis of Bureau of Economic Analysis, Bureau of Labor Statistics, and Standard and Poor's 10-City Case-Shiller data.
Actual
SCAP more adverse
-8
-7
-6
-5
-4
-3
-2
-1
0
1
2
3
4
5
6
Q4Q3Q2Q1Q4Q3Q2Q1Q4
Percentage
GDP actual vs. SCAP adverse
2008
Quarter and year
2009 2010 2008 2009 2010 2008 2009 2010
Actual
SCAP more adverse
5
6
7
8
9
10
11
12
Q4Q3Q2Q1Q4Q3Q2Q1Q4
Percentage
Unemployment actual vs. SCAP adverse
Actual
SCAP more adverse
70
80
90
100
Q4Q3Q2Q1Q4Q3Q2Q1Q4
Percentage
Home price actual vs. SCAP adverse
Page 18 GAO-10-861 Lessons Learned from Bank Stress Test
SCAP largely met its goals of increasing the level and quality of capital held by the 19 largest BHCs and, more broadly, of strengthening market confidence in the banking system. The stress test identified 10 of the 19 BHCs as needing to raise a total of about $75 billion in additional capital. The Federal Reserve encouraged the BHCs to raise common equity via private sources—for example, through new common equity issuances, conversion of existing preferred equity to common equity, and sales of businesses or portfolios of assets. Nine of the 10 BHCs were able to raise the required SCAP amount of new common equity in the private markets by the November 9, 2009, deadline (see table 2). Some of these BHCs also raised capital internally from other sources.30 GMAC LLC (GMAC) was the only BHC that was not able to raise sufficient private capital by the November 9, 2009, deadline.31 On December 30, 2009, Treasury provided GMAC with a capital investment of $3.8 billion to help fulfill its SCAP capital buffer requirement, drawing funds from TARP’s Automotive Industry Financing Program.32 A unique and additional element of the estimated losses for GMAC included the unknown impact of possible bankruptcy filings by General Motors Corporation (GM) and Chrysler LLC (Chrysler). Thus, a conservative estimate of GMAC’s capital buffer was developed in response to this possibility. The Federal Reserve, in consultation with Treasury, subsequently reduced GMAC’s SCAP required capital buffer by $1.8 billion—$5.6 billion to $3.8 billion—primarily to reflect the lower-than-estimated actual losses from the bankruptcy
While SCAP Increased Capital Levels and Improved Confidence in the Banking System, BHCs Could Face Ongoing Challenges
30Other forms of raising capital included the use of deferred tax assets (DTA), employee stock option awards, and restriction on dividend payments. A DTA represents the amount by which taxes can be reduced in future years as a result of temporary tax differences for financial reporting and tax reporting purposes. DTAs are includable as tier 1 capital up to no more than 10 percent of a BHC’s tier 1 capital.
31The SCAP results required GMAC to raise a total of $1l.5 billion in capital, of which $9.1 billion had to be in new equity capital. On May 21, 2009, Treasury made a capital investment of $3.5 billion in GMAC via the TARP Automotive Industry Financing Program to be applied as a down payment towards GMAC’s SCAP capital buffer of $9.1 billion in new equity capital. GMAC had to raise the remaining amount of $5.6 billion by the November 9, 2009, deadline from either the private markets or through further Treasury assistance. In December 2009, Treasury converted its existing $5.25 billion of preferred stock into mandatorily convertible preferred stock and converted $3 billion of existing GMAC mandatorily convertible preferred securities into common equity that allowed GMAC to meet its total SCAP capital requirement of $11.5 billion.
32The Automotive Industry Financing Program was created in December 2008 by Treasury under TARP to prevent a significant disruption of the American automotive industry. Treasury determined that such a disruption would pose a systemic risk to financial market stability and have a negative effect on the U.S. economy.
Page 19 GAO-10-861 Lessons Learned from Bank Stress Test
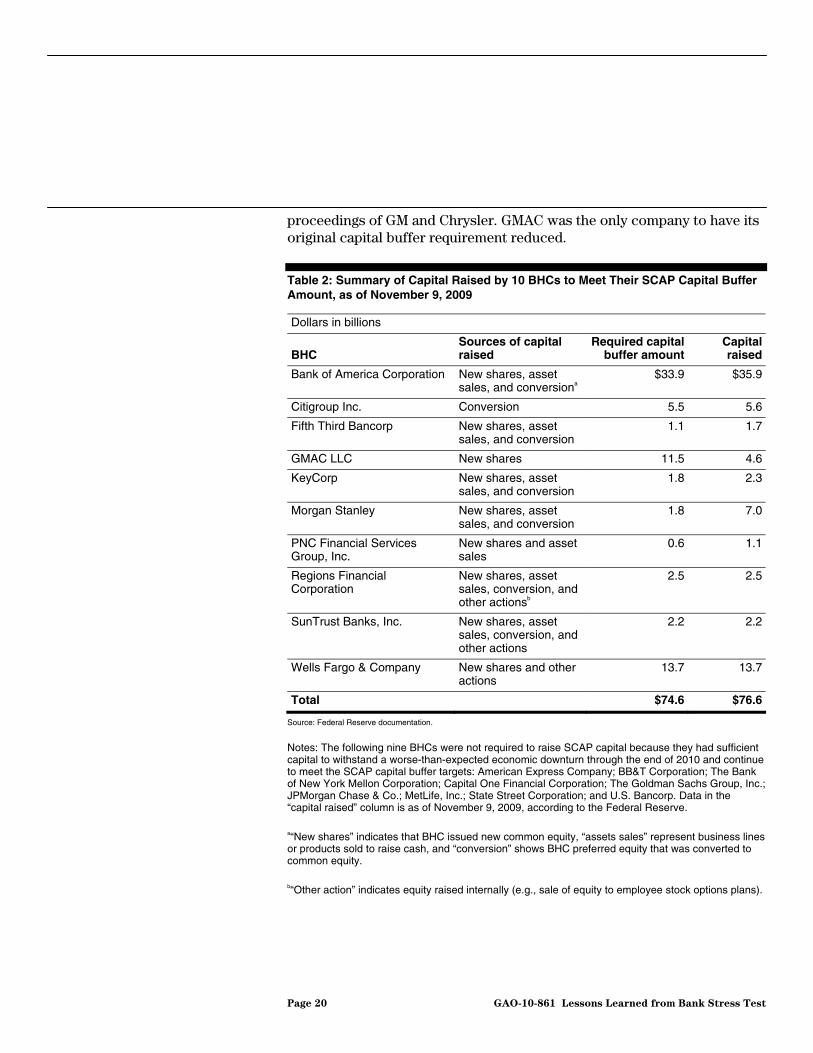
proceedings of GM and Chrysler. GMAC was the only company to have its original capital buffer requirement reduced.
Table 2: Summary of Capital Raised by 10 BHCs to Meet Their SCAP Capital Buffer Amount, as of November 9, 2009
Dollars in billions
BHC Sources of capital raised
Required capital buffer amount
Capital raised
Bank of America Corporation New shares, asset sales, and conversiona
$33.9 $35.9
Citigroup Inc. Conversion 5.5 5.6
Fifth Third Bancorp New shares, asset sales, and conversion
1.1 1.7
GMAC LLC New shares 11.5 4.6
KeyCorp New shares, asset sales, and conversion
1.8 2.3
Morgan Stanley New shares, asset sales, and conversion
1.8 7.0
PNC Financial Services Group, Inc.
New shares and asset sales
0.6 1.1
Regions Financial Corporation
New shares, asset sales, conversion, and other actionsb
2.5 2.5
SunTrust Banks, Inc. New shares, asset sales, conversion, and other actions
2.2 2.2
Wells Fargo & Company New shares and other actions
13.7 13.7
Total $74.6 $76.6
Source: Federal Reserve documentation.
Notes: The following nine BHCs were not required to raise SCAP capital because they had sufficient capital to withstand a worse-than-expected economic downturn through the end of 2010 and continue to meet the SCAP capital buffer targets: American Express Company; BB&T Corporation; The Bank of New York Mellon Corporation; Capital One Financial Corporation; The Goldman Sachs Group, Inc.; JPMorgan Chase & Co.; MetLife, Inc.; State Street Corporation; and U.S. Bancorp. Data in the “capital raised” column is as of November 9, 2009, according to the Federal Reserve. a“New shares” indicates that BHC issued new common equity, “assets sales” represent business lines or products sold to raise cash, and “conversion” shows BHC preferred equity that was converted to common equity. b“Other action” indicates equity raised internally (e.g., sale of equity to employee stock options plans).
Page 20 GAO-10-861 Lessons Learned from Bank Stress Test
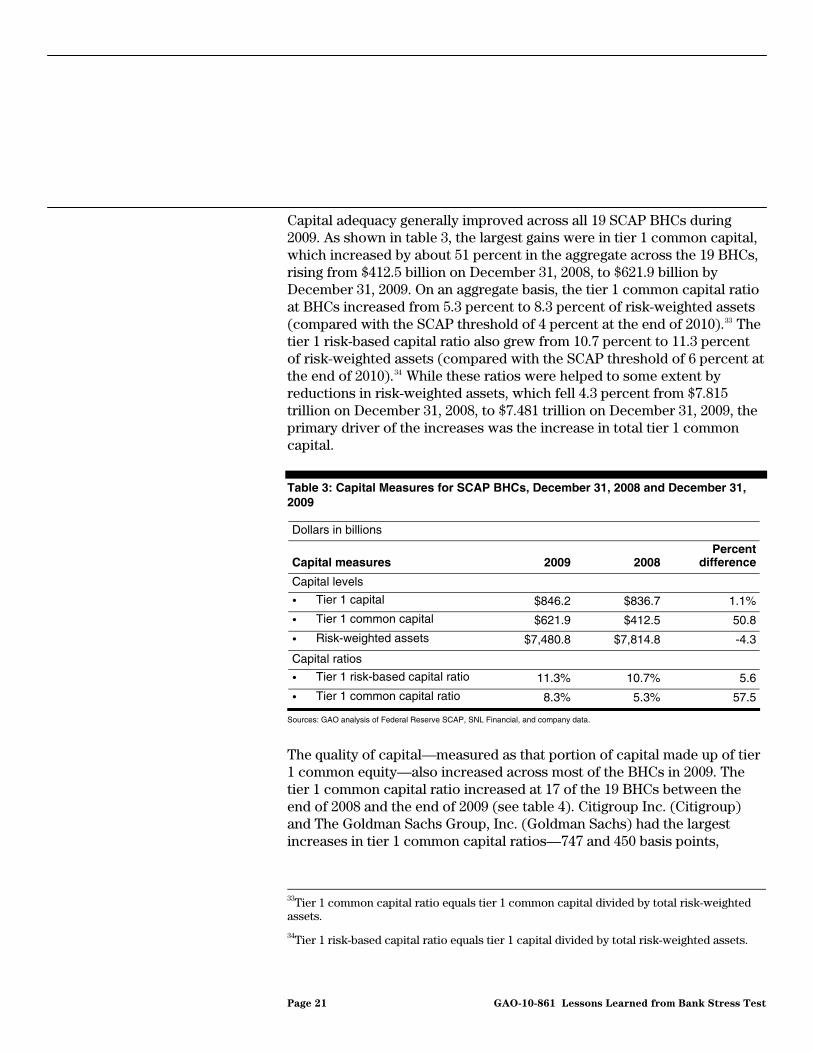
Capital adequacy generally improved across all 19 SCAP BHCs during 2009. As shown in table 3, the largest gains were in tier 1 common capital, which increased by about 51 percent in the aggregate across the 19 BHCs, rising from $412.5 billion on December 31, 2008, to $621.9 billion by December 31, 2009. On an aggregate basis, the tier 1 common capital ratio at BHCs increased from 5.3 percent to 8.3 percent of risk-weighted assets (compared with the SCAP threshold of 4 percent at the end of 2010).33 The tier 1 risk-based capital ratio also grew from 10.7 percent to 11.3 percent of risk-weighted assets (compared with the SCAP threshold of 6 percent at the end of 2010).34 While these ratios were helped to some extent by reductions in risk-weighted assets, which fell 4.3 percent from $7.815 trillion on December 31, 2008, to $7.481 trillion on December 31, 2009, the primary driver of the increases was the increase in total tier 1 common capital.
Table 3: Capital Measures for SCAP BHCs, December 31, 2008 and December 31, 2009
Dollars in billions
Capital measures 2009 2008Percent
difference
Capital levels
• Tier 1 capital $846.2 $836.7 1.1%
• Tier 1 common capital $621.9 $412.5 50.8
• Risk-weighted assets $7,480.8 $7,814.8 -4.3
Capital ratios
• Tier 1 risk-based capital ratio 11.3% 10.7% 5.6
• Tier 1 common capital ratio 8.3% 5.3% 57.5
Sources: GAO analysis of Federal Reserve SCAP, SNL Financial, and company data.
The quality of capital—measured as that portion of capital made up of tier 1 common equity—also increased across most of the BHCs in 2009. The tier 1 common capital ratio increased at 17 of the 19 BHCs between the end of 2008 and the end of 2009 (see table 4). Citigroup Inc. (Citigroup) and The Goldman Sachs Group, Inc. (Goldman Sachs) had the largest increases in tier 1 common capital ratios—747 and 450 basis points,
33Tier 1 common capital ratio equals tier 1 common capital divided by total risk-weighted assets.
34Tier 1 risk-based capital ratio equals tier 1 capital divided by total risk-weighted assets.
Page 21 GAO-10-861 Lessons Learned from Bank Stress Test
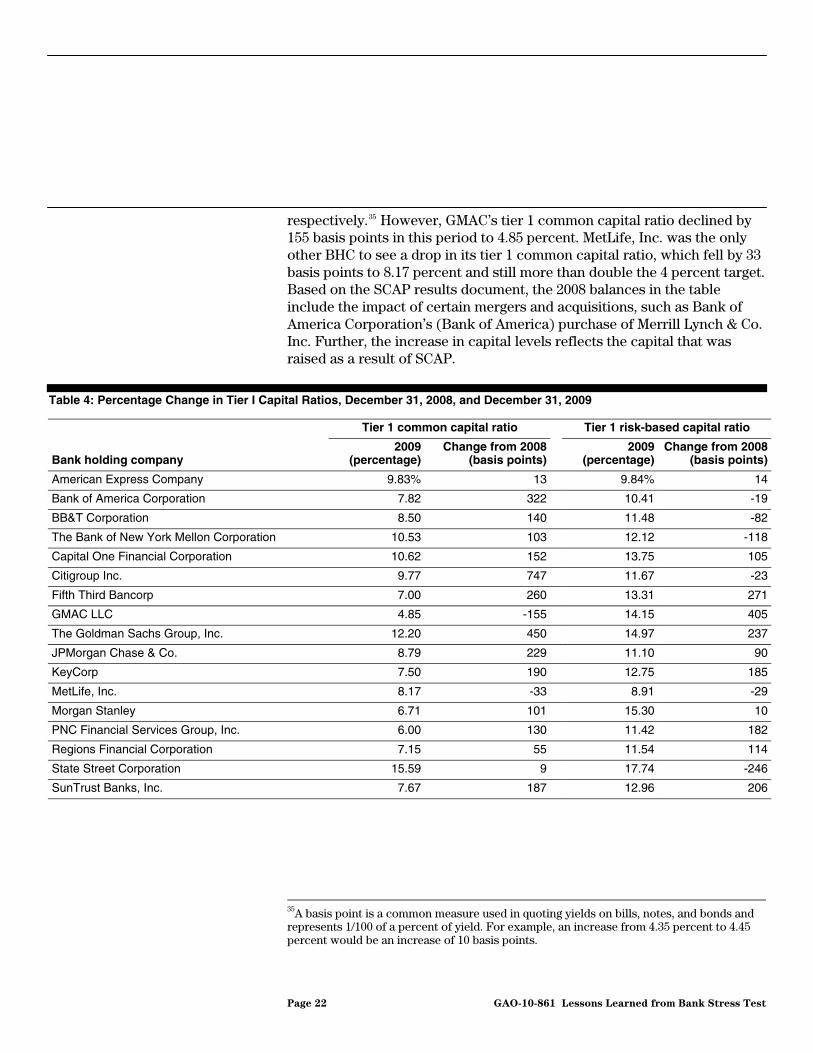
respectively.35 However, GMAC’s tier 1 common capital ratio declined by 155 basis points in this period to 4.85 percent. MetLife, Inc. was the only other BHC to see a drop in its tier 1 common capital ratio, which fell by 33 basis points to 8.17 percent and still more than double the 4 percent target. Based on the SCAP results document, the 2008 balances in the table include the impact of certain mergers and acquisitions, such as Bank of America Corporation’s (Bank of America) purchase of Merrill Lynch & Co. Inc. Further, the increase in capital levels reflects the capital that was raised as a result of SCAP.
Table 4: Percentage Change in Tier I Capital Ratios, December 31, 2008, and December 31, 2009
Tier 1 common capital ratio Tier 1 risk-based capital ratio
Bank holding company 2009
(percentage)Change from 2008
(basis points) 2009
(percentage)Change from 2008
(basis points)
American Express Company 9.83% 13 9.84% 14
Bank of America Corporation 7.82 322 10.41 -19
BB&T Corporation 8.50 140 11.48 -82
The Bank of New York Mellon Corporation 10.53 103 12.12 -118
Capital One Financial Corporation 10.62 152 13.75 105
Citigroup Inc. 9.77 747 11.67 -23
Fifth Third Bancorp 7.00 260 13.31 271
GMAC LLC 4.85 -155 14.15 405
The Goldman Sachs Group, Inc. 12.20 450 14.97 237
JPMorgan Chase & Co. 8.79 229 11.10 90
KeyCorp 7.50 190 12.75 185
MetLife, Inc. 8.17 -33 8.91 -29
Morgan Stanley 6.71 101 15.30 10
PNC Financial Services Group, Inc. 6.00 130 11.42 182
Regions Financial Corporation 7.15 55 11.54 114
State Street Corporation 15.59 9 17.74 -246
SunTrust Banks, Inc. 7.67 187 12.96 206
35A basis point is a common measure used in quoting yields on bills, notes, and bonds and represents 1/100 of a percent of yield. For example, an increase from 4.35 percent to 4.45 percent would be an increase of 10 basis points.
Page 22 GAO-10-861 Lessons Learned from Bank Stress Test
Tier 1 common capital ratio Tier 1 risk-based capital ratio
Bank holding company 2009
(percentage)Change from 2008
(basis points) 2009
(percentage)Change from 2008
(basis points)
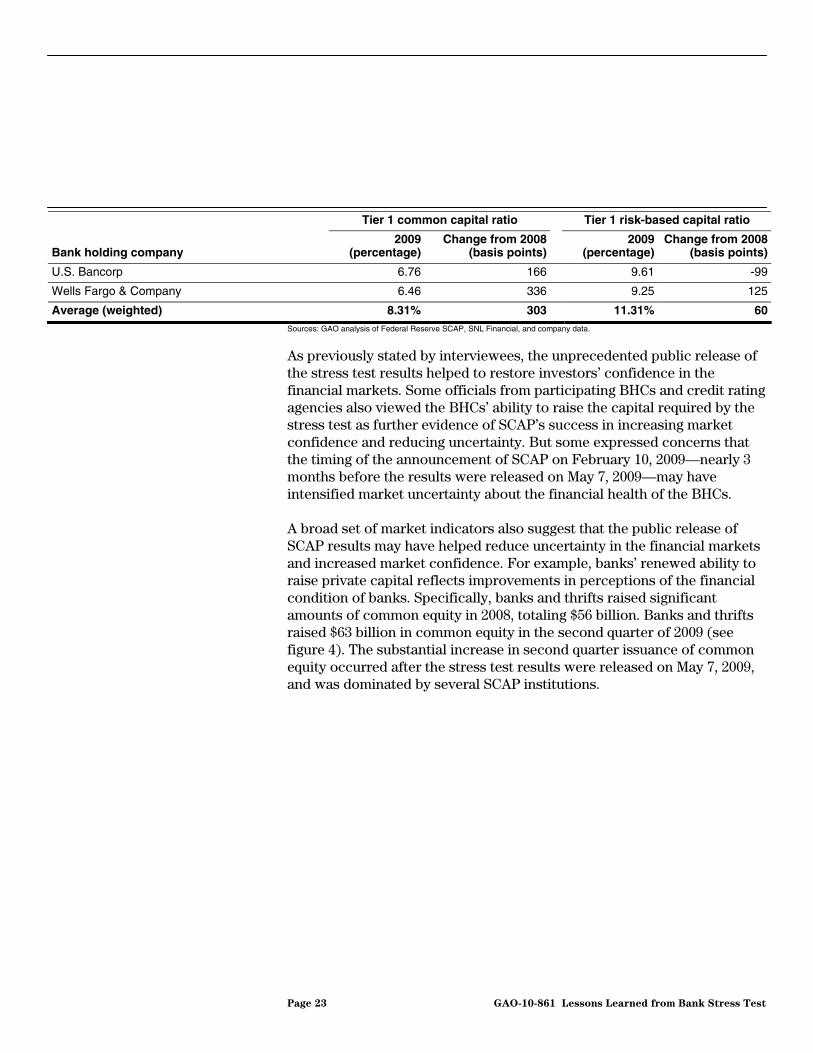
U.S. Bancorp 6.76 166 9.61 -99
Wells Fargo & Company 6.46 336 9.25 125
Average (weighted) 8.31% 303 11.31% 60Sources: GAO analysis of Federal Reserve SCAP, SNL Financial, and company data.
As previously stated by interviewees, the unprecedented public release of the stress test results helped to restore investors’ confidence in the financial markets. Some officials from participating BHCs and credit rating agencies also viewed the BHCs’ ability to raise the capital required by the stress test as further evidence of SCAP’s success in increasing market confidence and reducing uncertainty. But some expressed concerns that the timing of the announcement of SCAP on February 10, 2009—nearly 3 months before the results were released on May 7, 2009—may have intensified market uncertainty about the financial health of the BHCs.
A broad set of market indicators also suggest that the public release of SCAP results may have helped reduce uncertainty in the financial markets and increased market confidence. For example, banks’ renewed ability to raise private capital reflects improvements in perceptions of the financial condition of banks. Specifically, banks and thrifts raised significant amounts of common equity in 2008, totaling $56 billion. Banks and thrifts raised $63 billion in common equity in the second quarter of 2009 (see figure 4). The substantial increase in second quarter issuance of common equity occurred after the stress test results were released on May 7, 2009, and was dominated by several SCAP institutions.
Page 23 GAO-10-861 Lessons Learned from Bank Stress Test
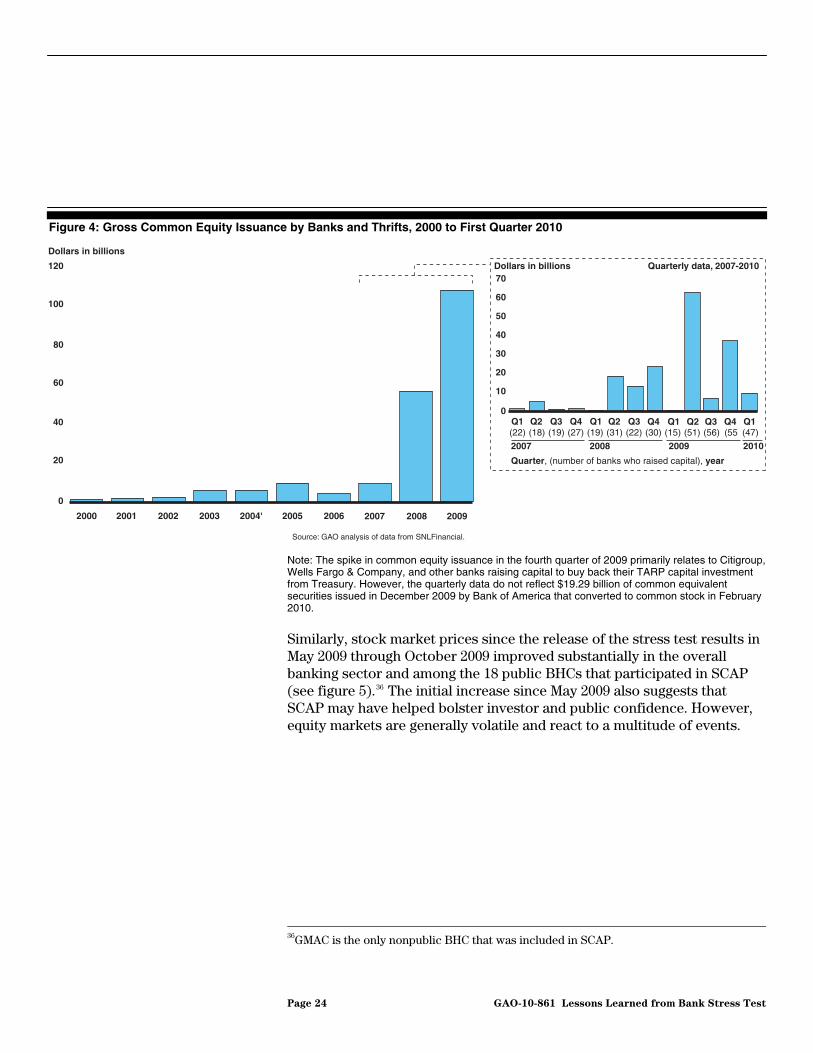
Figure 4: Gross Common Equity Issuance by Banks and Thrifts, 2000 to First Quarter 2010
0
20
40
60
80
100
120
200920082007200620052004'2003200220012000
0
10
20
30
40
50
60
70
Q1Q4Q3Q2Q1Q4Q3Q2Q1Q4Q3Q2Q1
Dollars in billions
Dollars in billions
Quarterly data, 2007-2010
Source: GAO analysis of data from SNLFinancial.
2007
Quarter, (number of banks who raised capital), year
(22) (55(56)(51)(15)(30)(22)(31)(19)(27)(19)(18) (47)
2008 2009 2010
Note: The spike in common equity issuance in the fourth quarter of 2009 primarily relates to Citigroup, Wells Fargo & Company, and other banks raising capital to buy back their TARP capital investment from Treasury. However, the quarterly data do not reflect $19.29 billion of common equivalent securities issued in December 2009 by Bank of America that converted to common stock in February 2010. Similarly, stock market prices since the release of the stress test results in May 2009 through October 2009 improved substantially in the overall banking sector and among the 18 public BHCs that participated in SCAP (see figure 5).36 The initial increase since May 2009 also suggests that SCAP may have helped bolster investor and public confidence. However, equity markets are generally volatile and react to a multitude of events.
36GMAC is the only nonpublic BHC that was included in SCAP.
Page 24 GAO-10-861 Lessons Learned from Bank Stress Test

Figure 5: Stock Market Prices, October 2007 through March 2010
Announcement ofstress test aspart of FSP
(Feb. 10)
Source: GAO analysis of Yahoo! Finance data.
2007
-90
-80
-70
-60
-50
-40
-30
-20
-10
0
10
Mar.Feb.Jan.Dec.Nov.Oct.Sept.Aug.JulyJuneMayAprilMar.Feb.Jan.Dec.Nov.Oct.Sept.Aug.JulyJuneMayAprilMar.Feb.Jan.Dec.NovOct.
Percent change
20102008 2009
S&P 500
Simple average of 18 public BHCs
Financial industry measure
October 2007 stock price
Release ofstress test
results(May 7)
Credit default swap spreads, another measure of confidence in the banking sector, also improved. A credit default swap is an agreement in which a buyer pays a periodic fee to a seller in exchange for protection from certain credit events such as bankruptcy, failure to pay debt obligations, or a restructuring related to a specific debt issuer or issues known as the reference entity. Therefore, the credit default swap spread, or market price, is a measure of the credit risk of the reference entity, with a higher spread indicating a greater amount of credit risk. When the markets’ perception of the reference entity’s credit risk deteriorates or improves, the spread generally will widen or tighten, respectively. Following the SCAP results release in May 2009, the credit default swap spreads continued to see improvements (see figure 6). While many forces interact to influence investors’ actions, these declining spreads suggest that the market’s perception of the risk of banking sector defaults was falling. Further, the redemption of TARP investments by some banking institutions demonstrated that regulators believed these firms could continue to serve as a source of financial and managerial strength, as well as fulfill their roles as intermediaries that facilitate lending, while both
Page 25 GAO-10-861 Lessons Learned from Bank Stress Test

reducing reliance on government funding and maintaining adequate capital levels. This positive view of the regulators may also have helped increase market confidence in the banking system (see appendix II for details on the status of TARP investments in the institutions participating in SCAP).
Figure 6: Bank Credit Default Swap Spreads, January 2007 through March 2010
Source: GAO analysis of Thomson Reuters Datastream.
2007
0
300
600
900
1,200
1,500
Mar.Jan.Nov.Sept.JulyMayMar.Jan.Nov.Sept.JulyMayMar.Jan.Nov.Sept.JulyMayMar.Jan.
Credit default swap spread in basis points
GMAC
20102008 2009
2007 20102008 2009
Bank index
Average of 12 of the 19 SCAP BHCs
Release ofstress test
results(May 7)
Release ofstress test
results(May 7)
Announcement ofstress test
as partof FSP
(Feb. 10)
Announcementof stress test
as part of FSP(Feb. 10)
0
2,000
4,000
6,000
8,000
10,000
The 19 Tested BHCs Experienced Better Performance Than a Pro Rata Estimate under the More Adverse Scenario
As of the end of 2009, while the SCAP BHCs generally had not experienced the level of losses that were estimated on a pro rata basis under the stress test’s more adverse economic scenario, concerns remain that some banks could absorb potentially significant losses in certain asset categories that would erode capital levels. Collectively, the BHCs’ total loan losses of $141.2 billion were approximately 38 percent less than the GAO-calculated $229.4 billion in pro rata losses under the more adverse scenario for 2009
Page 26 GAO-10-861 Lessons Learned from Bank Stress Test

(see table 5).37 The BHCs also experienced significant gains in securities and trading and counterparty credit risk portfolios compared with estimated pro rata losses under SCAP. Total resources other than capital to absorb losses (resources) were relatively close to the pro rata amount, exceeding it by 4 percent.
Table 5: Actual and GAO Pro Rata Estimates of Aggregate Losses and Changes in Resources Other than Capital to Absorb Losses across the 19 SCAP BHCs, December 31, 2009
Dollars in billions
Asset category Actual
GAOpro rata
estimatea Percent
difference
Consumer and commercial loan losses
• First-lien mortgages $19.2 $51.2 -62%
• Second/junior lien mortgages 26.1 41.6 -37
• Commercial and industrial loans 21.2 30.1 -29
• Commercial real estate loans 13.5 26.5 -49
• Credit card loans 31.6 41.2 -23
• Otherb 29.5 38.9 -24
Total consumer and commercial loans losses $141.2 $229.4 -38%
Securities—available for sale and held to maturity—losses (gains)
(3.5) 17.6 -120
Trading and counterparty losses (gains) (56.9) 49.7 -215
Total asset losses $80.8 $296.7 -73%
Resources other than capital to absorb losses $188.4 $181.5 4%
Sources: GAO analysis of Federal Reserve SCAP and SNL Financial data.
Notes: A parenthetical number indicates a gain.
37The asset categories are first-lien mortgages consisting of prime, Alt-A, and subprime residential mortgages; second/junior lien mortgages consisting of closed-end junior liens and home equity line of credit residential mortgages; commercial and industrial loans consisting of large corporate and middle market, small business, and asset-based lending loans; commercial real estate loans consisting of construction and land development, multifamily, and nonfarm nonresidential loans; credit card loans, consisting of credit cards; other loans consisting of auto, personal, and student loans, and farmland lending, loans to depository institutions, loans to governments, and other categories; securities (available for sale and held to maturity) consisting of a majority of Treasury securities, government agency securities, sovereign debt, and high-grade municipal securities and corporate bonds, equities, asset-backed securities, commercial mortgage-backed securities, and nonagency residential mortgage-backed securities; and trading and counterparty, or trading book positions (e.g., securities such as common stock and derivatives).
Page 27 GAO-10-861 Lessons Learned from Bank Stress Test
The trading and counterparty data in the Y-9C includes both customer derived revenue from transactions for BHCs that operate as broker-dealers, as well as gains and losses from proprietary trading and associated expenses. These items are presented on a net basis in the Y-9C. For the five BHCs that had their trading portfolios stressed (Goldman Sachs, Morgan Stanley, Citigroup, JPMorgan Chase & Co., and Bank of America), the trading and counterparty line item is based on projections of gains or losses from proprietary trading, but preprovision net revenue (specifically noninterest revenue) included projections of gains or losses from customer derived revenue from transactions due to operations as a broker-dealer. These items cannot be segregated based on the Y-9C data and therefore are included in the net amount in both the trading and counterparty and noninterest income line items above. As a result of this limitation, the net amount of the trading gains or losses and preprovision net revenue in the table may be overstated or understated. aGAO calculated 1-year pro rata loss estimates by dividing the SCAP more adverse 2-year loss estimates by 2 (e., the straight-line method). A key limitation of this approach is that it assumes equal distribution of losses, revenues, expenses, and changes to reserves over time, although these items were unlikely to be distributed evenly over the 2-year period. Another important consideration is that actual results were not intended and should not be expected to align with the SCAP projections. bFor “Other” we excluded about $6 billion in losses for State Street Corporation realized in 2009. Since this was a one-time charge that was realized in 2009, this effect was segregated from more typical loss amounts for our tracking purposes.
In tracking BHCs’ losses and resources against the SCAP estimates, we compared the actual results with those estimated under the more adverse scenario. We used the 2-year estimates of the more adverse scenario from the SCAP results and annualized those amounts by dividing them in half (the “straight line” method) to get pro rata loss estimates for 2009 because the SCAP regulators did not develop estimates on a quarterly or annual basis. A key limitation of this approach is that it assumes equal distribution of losses, revenues, expenses, and changes to reserves over time, although these items were unlikely to be distributed evenly over the 2-year period. Another important consideration is that actual results were not intended and should not be expected to align with the SCAP projections. Actual economic performance in 2009 differed from the SCAP macroeconomic variable inputs, which were based on a scenario that was more adverse than was anticipated or than occurred, and other forces in the business and regulatory environment could have influenced the timing and level of losses. Appendix I contains additional details on our methodology, including our data sources and calculations, for tracking BHCs’ financial performance data.
Page 28 GAO-10-861 Lessons Learned from Bank Stress Test

Losses Varied by Individual BHCs
Although the 19 BHCs’ actual combined losses were less than the 2009 pro rata loss estimates for the more adverse scenario, the loss rates varied significantly by individual BHCs. For example, most of the BHCs had consumer and commercial loan losses that were below the pro rata loss estimates, but three BHCs—GMAC, Citigroup, and SunTrust Banks Inc. (SunTrust)—exceeded these estimates in at least one portfolio (see figure 7). GMAC was the only one with 2009 loan losses on certain portfolios that exceeded SCAP’s full 2-year estimate. Specifically, GMAC exceeded the SCAP 2-year estimated losses in the first-lien, second/junior lien, and commercial real estate portfolios and the 1-year pro rata losses in the “Other” portfolio; Citigroup exceeded the 1-year pro rata estimated losses in the commercial and industrial loan portfolio; and SunTrust exceeded the 1-year estimated losses in the first-lien and credit card portfolios. Appendix III provides detailed data on the individual performance of each of the BHCs.
Page 29 GAO-10-861 Lessons Learned from Bank Stress Test

Figure 7: Comparison of Actual and GAO Pro Rata Estimated Losses for Consumer and Commercial Loans, December 31, 2009
Source: GAO analysis of Federal Reserve and SNLFinancial data.
Percentage
Other
Commercial and industrial loans
Second/junior lien mortgages
Commercial real estate
First-lien mortgages
Credit cards
Total losses for 19 BHCs
Wells Fargo & Co.
U.S. Bancorp
SunTrust Banks. Inc.
State Street Corp.
Regions Financial Corp.
PNC Financial Services Group Inc.
Morgan Stanley
MetLife, Inc.
KeyCorp
JPMorgan Chase & Co.
GMAC LLC
Fifth Third Bancorp
Citigroup Inc.
Capital One Financial Corp.
Bank of America Corp.
The Bank of New York Mellon Corp.
BB&T Corp.
American Express Co.
Full 2-yearSCAP estimate
GAO’s 1-yearpro rata estimate
0 25 50 75 100 125 200 225 250 275 300
Notes: Figure shows only those loan loss categories that were applicable under SCAP and that showed losses in 2009. In addition, Goldman Sachs was not included in the figure because it had no losses or recoveries for these loan categories in 2009. The “Other” category for State Street Corporation does not include one-time items in the actual or estimated amounts. See table 27 in appendix III for additional details.
Page 30 GAO-10-861 Lessons Learned from Bank Stress Test

GAO calculated 1-year pro rata loss estimates by dividing the SCAP more adverse 2-year loss estimates by 2 (i.e., the straight-line method). A key limitation of this approach is that it assumes equal distribution of losses, revenues, expenses, and changes to reserves over time, although these items were unlikely to be distributed evenly over the 2-year period. Another important consideration is that actual results were not intended and should not be expected to align with the SCAP projections.
GMAC faced particular challenges in the first year of the assessment period and posed some risk to the federal government, a majority equity stakeholder.38 GMAC’s loan losses in its first-lien portfolio were $2.4 billion, compared with the $2 billion projected for the full 2-year period. In the second/junior lien portfolio, GMAC saw losses of $1.6 billion, compared with the $1.1 billion estimated losses for the 2 years. GMAC experienced losses of $710 million in its commercial real estate portfolio, compared with $600 million projected for the full 2-year period. Further, in its “Other” portfolio (which is comprised of auto leases and consumer auto loans), GMAC’s losses were $2.1 billion, exceeding the 1-year pro rata $2 billion loss estimate. With a tier 1 common capital ratio of 4.85 percent—just more than the SCAP threshold of 4 percent—at the end of 2009, GMAC has a relatively small buffer in the face of potential losses.
GMAC’s position should be placed in context, however, because it is relatively unique among the SCAP participants. It was the only nonpublicly traded participant, and the federal government owns a majority equity stake in the company as a result of capital investments made through the Automotive Industry Financing Program under TARP. Further, GMAC’s core business line—financing for automobiles—is dependent on the success of efforts to restructure, stabilize, and grow General Motors Company and Chrysler Group LLC.39 Finally, the Federal Reserve told us that because GMAC only recently became a BHC and had not previously been subject to banking regulations, it would take some time before GMAC was fully assimilated into a regulated banking environment.40 To improve its future operating performance and better position itself to become a public company in the future, GMAC officials stated that the company posted large losses in the fourth quarter of 2009 as result of accelerating its recognition of lifetime losses on loans.41 In addition, the
38As of September 22, 2010, Treasury has a 56.3 percent ownership stake in GMAC.
39General Motors Company and Chrysler Group LLC are the new names that the former GM and Chrysler adopted, respectively, after emerging from bankruptcy.
40The Federal Reserve approved GMAC’s application to become a BHC on December 24, 2008.
41Lifetime losses are those losses which occur from origination to the life-end of the loans.
Page 31 GAO-10-861 Lessons Learned from Bank Stress Test
company has been restructuring its operations and recently sold off some nonperforming assets.42 However, the credit rating agencies we met with generally believed that there could still be further losses at GMAC, although the agencies were less certain about the pace and level of those losses. Two of the agencies identified GMAC’s Residential Capital, LLC mortgage operation as the key source of potential continued losses.
BHCs Are Generally Not Experiencing the Level of Securities and Trading Losses That Were Estimated under the Pro Rata More Adverse Scenario, and Some Have Recorded Gains
Given that market conditions have generally improved, the BHCs’ investments in securities and trading account assets performed considerably better in 2009 than had been estimated under the pro rata more adverse scenario.43 The SCAP assessment of the securities portfolio consisted of an evaluation for possible impairment of the portfolio’s assets, including Treasury securities, government agency securities, sovereign debt, and private sector securities. In the aggregate, the securities portfolio has experienced a gain of $3.5 billion in 2009, compared with a pro rata estimated loss of $17.6 billion under the stress test’s more adverse scenario. As figure 8 shows, 5 of the 19 BHCs recorded securities losses in 2009,44 13 recorded gains, and 1 (Morgan Stanley) recorded no gain or loss. Losses were projected at 17 of the BHCs under the pro rata more adverse scenario, and SCAP regulators did not consider the remaining 2 BHCs (American Express Company and Morgan Stanley) to be applicable for this category. In the securities portfolio, The Bank of New York Mellon Corporation had losses greater than estimated under
42According to an April 12, 2010, GMAC press release, GMAC’s mortgage subsidiary—Residential Capital, LLC—agreed to sell its European mortgage assets and businesses to Fortress Investment Group LLC. These transactions represent approximately 10 percent of Residential Capital, LLC’s December 31, 2009, total assets and approximately 40 percent of total assets on a pro forma basis, adjusted for the required accounting treatment for certain off-balance sheet securitizations that are recorded on-balance sheet effective January 1, 2010, (see Financial Accounting Statement No. 167). The assets in the transactions are valued at approximately the levels established in the fourth quarter of 2009, and there is no material gain or loss expected. GMAC reported positive earnings for the first and second quarters of 2010, although it continued to show losses in certain portfolios. These were its first profits since the fourth quarter of 2008. GMAC’s tier 1 common capital ratio also improved to 5 percent and 5.2 percent, respectively.
43Trading account assets are assets held to hedge risks or speculate on price changes for the bank or its customers. Because the more adverse scenario was plausible but unlikely to occur, the actual results were not intended and should not be expected to align with such scenario.
44The five BHCs are The Bank of New York Mellon Corporation; Citigroup; MetLife, Inc.; SunTrust; and U.S. Bancorp.
Page 32 GAO-10-861 Lessons Learned from Bank Stress Test

SCAP for the full 2-year period.45 The variances could be due to a number of factors, including the extent to which a BHC decides to deleverage, how their positions react to changing market values, and other factors.
45Based on discussion with The Bank of New York Mellon Corporation officials and as stated in a October 20, 2009, company press release, the BHC’s securities portfolio underwent a significant restructuring in the third quarter of 2009 in order to reduce its balance sheet risk, causing it to recognize significant losses in that period. The officials noted that the BHC sold off many of its riskiest holdings in that period, including many Alt-A residential mortgage-backed securities, so that they expect to see gains in this portfolio in the future, keeping the final 2-year loss under the SCAP projected amount. As of the second quarter of 2010 year to date, the BHC experienced a gain of $20 million in this portfolio.
Page 33 GAO-10-861 Lessons Learned from Bank Stress Test
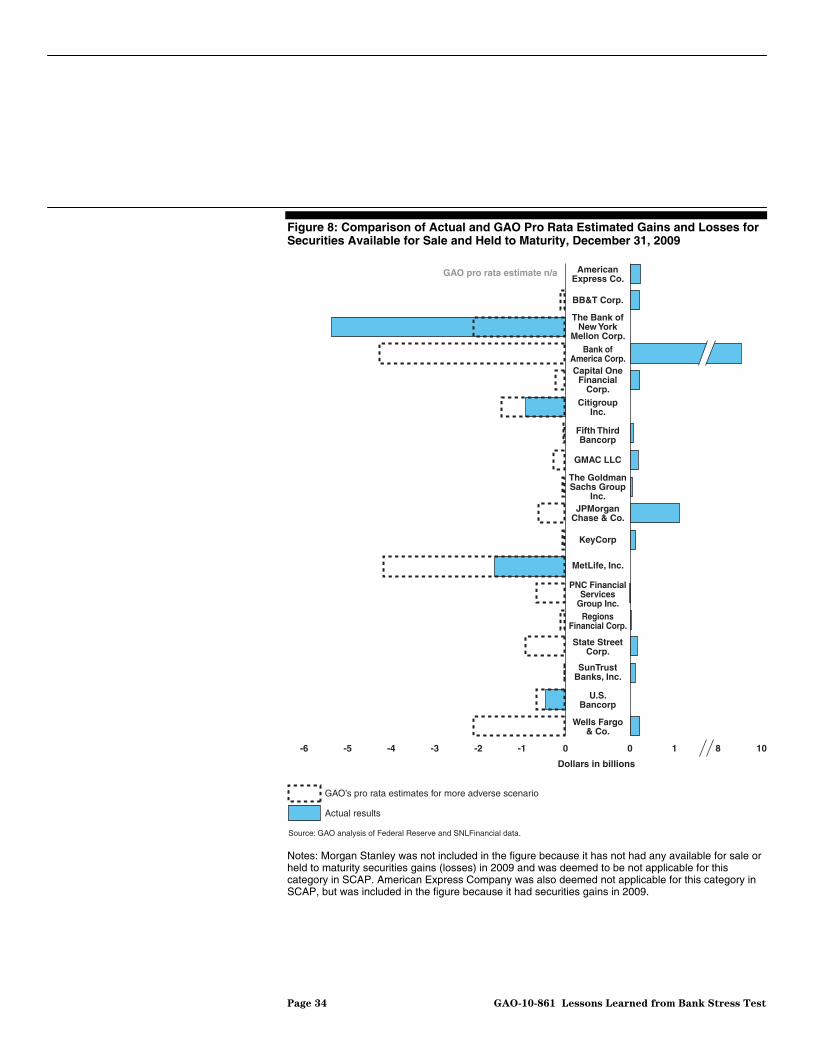
Figure 8: Comparison of Actual and GAO Pro Rata Estimated Gains and Losses for Securities Available for Sale and Held to Maturity, December 31, 2009
Source: GAO analysis of Federal Reserve and SNLFinancial data.
Dollars in billions
-6 -5 -4 -3 -2 -1 0 0 1 8 10
Wells Fargo& Co.
U.S.Bancorp
SunTrustBanks, Inc.
State StreetCorp.
RegionsFinancial Corp.
PNC FinancialServices
Group Inc.
MetLife, Inc.
KeyCorp
JPMorganChase & Co.
GMAC LLC
The GoldmanSachs Group
Inc.
Fifth ThirdBancorp
CitigroupInc.
Bank ofAmerica Corp.
The Bank ofNew York
Mellon Corp.
BB&T Corp.
AmericanExpress Co.
GAO’s pro rata estimates for more adverse scenario
Actual results
GAO pro rata estimate n/a
Capital OneFinancial
Corp.
Notes: Morgan Stanley was not included in the figure because it has not had any available for sale or held to maturity securities gains (losses) in 2009 and was deemed to be not applicable for this category in SCAP. American Express Company was also deemed not applicable for this category in SCAP, but was included in the figure because it had securities gains in 2009.
Page 34 GAO-10-861 Lessons Learned from Bank Stress Test

GAO calculated 1-year pro rata loss estimates by dividing the SCAP more adverse 2-year loss estimates by 2 (i.e., the straight-line method). A key limitation of this approach is that it assumes equal distribution of losses, revenues, expenses, and changes to reserves over time, although these items were unlikely to be distributed evenly over the 2-year period. Another important consideration is that actual results were not intended and should not be expected to align with the SCAP projections.
To estimate trading and counterparty losses, SCAP regulators assumed that these investments would be subject to the change in value of a proportional level as experienced in the last half of 2008.46 The trading portfolio shows an even greater difference between the 1-year pro rata estimates and the actual performance—a gain of $56.9 billion in 2009 rather than the pro rata $49.7 billion estimated loss under the more adverse scenario (see table 5). The stress test only calculated trading and counterparty credit loss estimates for the five BHCs with trading assets that exceeded $100 billion.47 All five had trading gains as opposed to losses, based on the publicly available data from the Y-9C.48 These gains were the result of a number of particular circumstances. First, the extreme spreads and risk premium resulting from the lack of liquidity during the financial crisis—especially in the second half of 2008—reversed in 2009, improving the pricing of many risky trading assets that remained on BHCs’ balance sheets. Because the trading portfolio is valued at fair value, it had been written down for the declines in value that occurred throughout 2008 and the first quarter of 2009 and saw significant gains when the market rebounded through the remainder of 2009. Second, the crisis led to the failure or absorption of several large investment banks, reducing the number of competitors and, according to our analysis of Thomson Reuters
46A counterparty loss is a loss resulting from a counterparty to a transaction failing to fulfill its financial obligation in a timely manner or from a credit valuation adjustment.
47These BHCs include Bank of America, Citigroup, Goldman Sachs, JPMorgan Chase & Co., and Morgan Stanley were stress tested in SCAP.
48Limitations of the Y-9C make it difficult to compare the actual results to the projections of SCAP. The trading and counterparty data in the Y-9C includes both customer derived revenue from transactions for BHCs that operate as broker-dealers, as well as gains and losses from proprietary trading and associated expenses. These items are presented on a net basis in the Y-9C. For the five BHCs that had their trading portfolios stressed (Goldman Sachs, Morgan Stanley, Citigroup, JPMorgan Chase & Co., and Bank of America), the trading and counterparty line item is based on projections of gains or losses from proprietary trading, but preprovision net revenue (specifically noninterest revenue) included projections of gains or losses from customer derived revenue from transactions due to operations as a broker-dealer. These items cannot be segregated based on the Y-9C data and therefore are included in the net amount in both the trading and counterparty and noninterest income line items above. As a result of this limitation, the net amount of the trading gains or losses and preprovision net revenue in the table may be over- or understated.
Page 35 GAO-10-861 Lessons Learned from Bank Stress Test
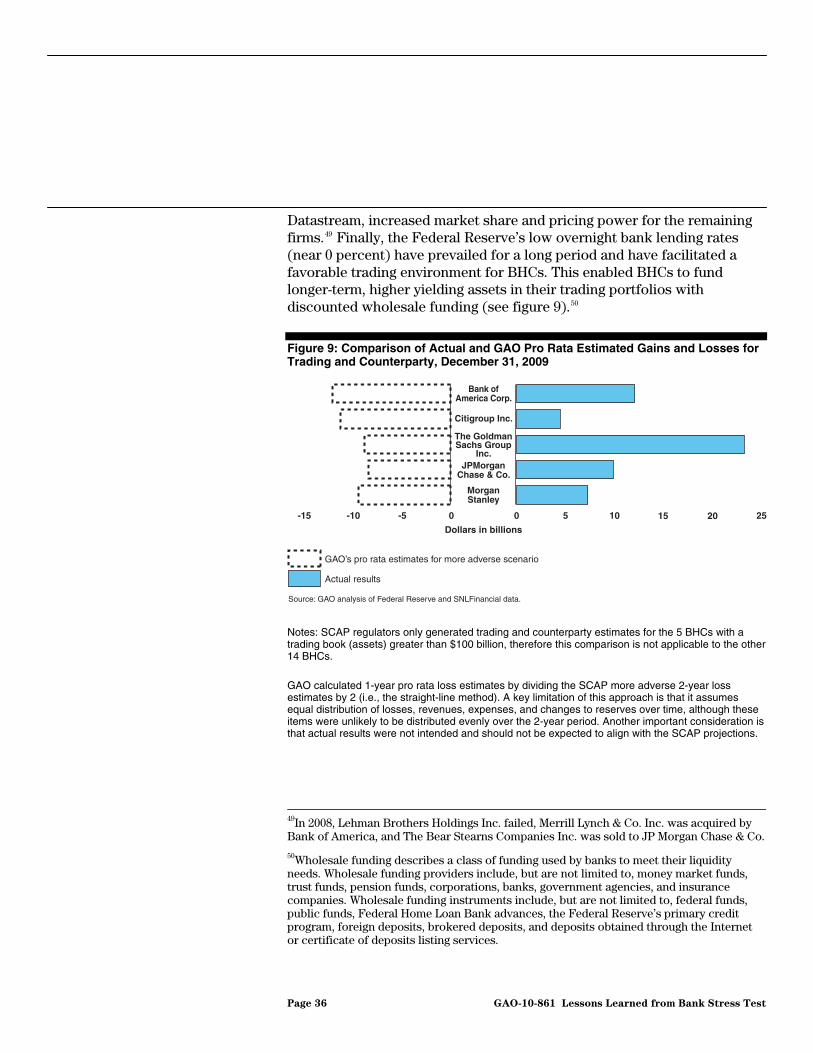
Datastream, increased market share and pricing power for the remaining firms.49 Finally, the Federal Reserve’s low overnight bank lending rates (near 0 percent) have prevailed for a long period and have facilitated a favorable trading environment for BHCs. This enabled BHCs to fund longer-term, higher yielding assets in their trading portfolios with discounted wholesale funding (see figure 9).50
Figure 9: Comparison of Actual and GAO Pro Rata Estimated Gains and Losses for Trading and Counterparty, December 31, 2009
Source: GAO analysis of Federal Reserve and SNLFinancial data.
Dollars in billions
0-15 -10 -5 0 5 10 15 20 25
GAO’s pro rata estimates for more adverse scenario
Actual results
MorganStanley
JPMorganChase & Co.
The GoldmanSachs Group
Inc.
Citigroup Inc.
Bank ofAmerica Corp.
Notes: SCAP regulators only generated trading and counterparty estimates for the 5 BHCs with a trading book (assets) greater than $100 billion, therefore this comparison is not applicable to the other 14 BHCs.
GAO calculated 1-year pro rata loss estimates by dividing the SCAP more adverse 2-year loss estimates by 2 (i.e., the straight-line method). A key limitation of this approach is that it assumes equal distribution of losses, revenues, expenses, and changes to reserves over time, although these items were unlikely to be distributed evenly over the 2-year period. Another important consideration is that actual results were not intended and should not be expected to align with the SCAP projections.
49In 2008, Lehman Brothers Holdings Inc. failed, Merrill Lynch & Co. Inc. was acquired by Bank of America, and The Bear Stearns Companies Inc. was sold to JP Morgan Chase & Co.
50Wholesale funding describes a class of funding used by banks to meet their liquidity needs. Wholesale funding providers include, but are not limited to, money market funds, trust funds, pension funds, corporations, banks, government agencies, and insurance companies. Wholesale funding instruments include, but are not limited to, federal funds, public funds, Federal Home Loan Bank advances, the Federal Reserve’s primary credit program, foreign deposits, brokered deposits, and deposits obtained through the Internet or certificate of deposits listing services.
Page 36 GAO-10-861 Lessons Learned from Bank Stress Test
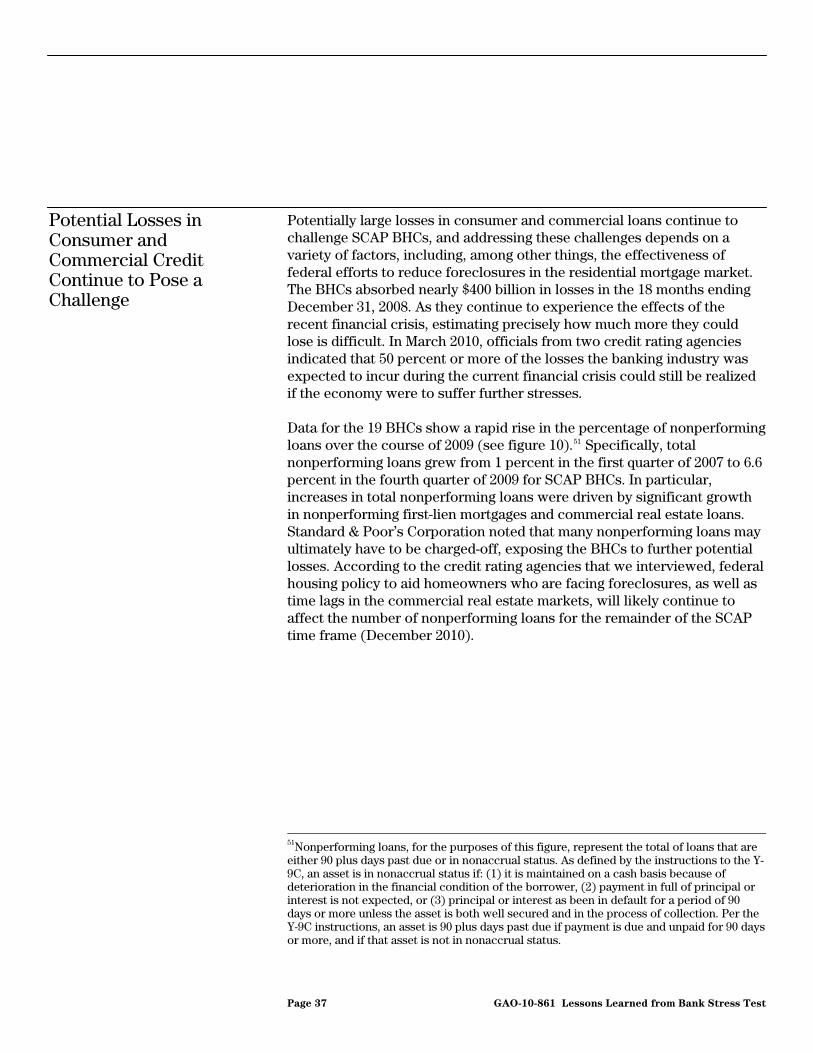
Potentially large losses in consumer and commercial loans continue to challenge SCAP BHCs, and addressing these challenges depends on a variety of factors, including, among other things, the effectiveness of federal efforts to reduce foreclosures in the residential mortgage market. The BHCs absorbed nearly $400 billion in losses in the 18 months ending December 31, 2008. As they continue to experience the effects of the recent financial crisis, estimating precisely how much more they could lose is difficult. In March 2010, officials from two credit rating agencies indicated that 50 percent or more of the losses the banking industry was expected to incur during the current financial crisis could still be realized if the economy were to suffer further stresses.
Potential Losses in Consumer and Commercial Credit Continue to Pose a Challenge
Data for the 19 BHCs show a rapid rise in the percentage of nonperforming loans over the course of 2009 (see figure 10).51 Specifically, total nonperforming loans grew from 1 percent in the first quarter of 2007 to 6.6 percent in the fourth quarter of 2009 for SCAP BHCs. In particular, increases in total nonperforming loans were driven by significant growth in nonperforming first-lien mortgages and commercial real estate loans. Standard & Poor’s Corporation noted that many nonperforming loans may ultimately have to be charged-off, exposing the BHCs to further potential losses. According to the credit rating agencies that we interviewed, federal housing policy to aid homeowners who are facing foreclosures, as well as time lags in the commercial real estate markets, will likely continue to affect the number of nonperforming loans for the remainder of the SCAP time frame (December 2010).
51Nonperforming loans, for the purposes of this figure, represent the total of loans that are either 90 plus days past due or in nonaccrual status. As defined by the instructions to the Y-9C, an asset is in nonaccrual status if: (1) it is maintained on a cash basis because of deterioration in the financial condition of the borrower, (2) payment in full of principal or interest is not expected, or (3) principal or interest as been in default for a period of 90 days or more unless the asset is both well secured and in the process of collection. Per the Y-9C instructions, an asset is 90 plus days past due if payment is due and unpaid for 90 days or more, and if that asset is not in nonaccrual status.
Page 37 GAO-10-861 Lessons Learned from Bank Stress Test
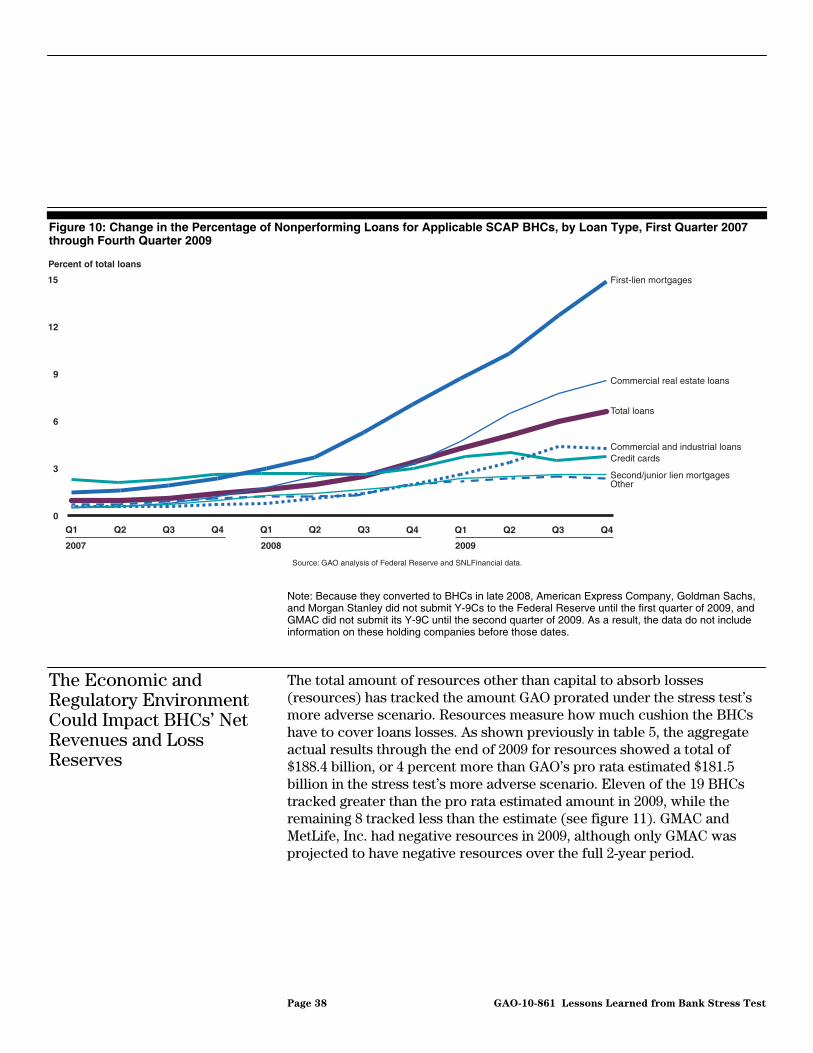
Figure 10: Change in the Percentage of Nonperforming Loans for Applicable SCAP BHCs, by Loan Type, First Quarter 2007 through Fourth Quarter 2009
0
3
6
9
12
15
Q4Q3Q2Q1Q4Q3Q2Q1Q4Q3Q2Q1
Percent of total loans
Source: GAO analysis of Federal Reserve and SNLFinancial data.
2007 2008 2009
First-lien mortgages
Commercial real estate loans
Total loans
Commercial and industrial loansCredit cards
Second/junior lien mortgagesOther
Note: Because they converted to BHCs in late 2008, American Express Company, Goldman Sachs, and Morgan Stanley did not submit Y-9Cs to the Federal Reserve until the first quarter of 2009, and GMAC did not submit its Y-9C until the second quarter of 2009. As a result, the data do not include information on these holding companies before those dates.
The Economic and Regulatory Environment Could Impact BHCs’ Net Revenues and Loss Reserves
The total amount of resources other than capital to absorb losses (resources) has tracked the amount GAO prorated under the stress test’s more adverse scenario. Resources measure how much cushion the BHCs have to cover loans losses. As shown previously in table 5, the aggregate actual results through the end of 2009 for resources showed a total of $188.4 billion, or 4 percent more than GAO’s pro rata estimated $181.5 billion in the stress test’s more adverse scenario. Eleven of the 19 BHCs tracked greater than the pro rata estimated amount in 2009, while the remaining 8 tracked less than the estimate (see figure 11). GMAC and MetLife, Inc. had negative resources in 2009, although only GMAC was projected to have negative resources over the full 2-year period.
Page 38 GAO-10-861 Lessons Learned from Bank Stress Test

Figure 11: Comparison of Actual and GAO Pro Rata Estimated Resources Other Than Capital to Absorb Losses, December 31, 2009
Source: GAO analysis of Federal Reserve and SNLFinancial data.
Dollars in billions
Wells Fargo & Co.
U.S. Bancorp
SunTrust Banks, Inc.
State Street Corp.
Regions Financial Corp.
PNC FinancialServices Group, Inc.
Morgan Stanley
MetLife, Inc.
KeyCorp
JPMorgan Chase & Co.
The GoldmanSachs Group Inc.
GMAC LLC
Fifth Third Bancorp
Citigroup Inc.
Capital One Financial Corp.
Bank of America Corp.
The Bank of NewYork Mellon Corp.
BB&T Corp.
American Express Co.
-5 0 5 10 15 20 25 30 35 40
GAO’s pro rata estimates for more adverse scenario
Actual results
Notes: Resources other than capital to absorb losses are calculated as preprovision net revenue less the change in allowance for loan and lease losses.
GAO calculated 1-year pro rata loss estimates by dividing the SCAP more adverse 2-year loss estimates by 2 (i.e., the straight-line method). A key limitation of this approach is that it assumes equal distribution of losses, revenues, expenses, and changes to reserves over time, although these items were unlikely to be distributed evenly over the 2-year period. Another important consideration is that actual results were not intended and should not be expected to align with the SCAP projections.
Page 39 GAO-10-861 Lessons Learned from Bank Stress Test

Our calculation considers increases in ALLL during 2009 to be a drain on resources in order to mirror the regulators’ calculation for the full 2-year projection. However, the ALLL may ultimately be used as a resource in 2010, causing available resources to be higher than they currently appear in our tracking. PPNR is based on numerous factors, including interest income, trading revenues, and expenses. The future course of this resource will be affected by factors such as the performance of the general economy, the BHCs’ business strategies, and regulatory changes, including the Dodd-Frank Wall Street Reform and Consumer Protection Act of 2010 (Dodd-Frank Act) and the Credit Card Accountability, Responsibility, and Disclosure Act of 2009.52 Such regulatory changes could impose additional costs or reduce future profitability, either of which would impact future PPNR.
The SCAP stress test provided lessons in a number of areas that can be incorporated in the bank supervision process and used to improve BHCs’ risk management practices. First, the transparency that was part of SCAP helped bolster market confidence, but the Federal Reserve has not yet developed a plan that incorporates transparency into the supervisory process. Second, the SCAP experience highlighted that BHCs’ stress tests in the past were not sufficiently comprehensive and we found that regulators’ oversight of these tests has been generally weak. Third, we identified opportunities to enhance both the process and data inputs for conducting stress testing in the future. Finally, SCAP demonstrated the importance of robust coordination and communication among the different regulators as an integral part of any effective supervisory process. By incorporating these lessons going forward, regulators will be able to enhance their ability to efficiently and effectively oversee the risk-taking in the banking industry.
SCAP Provided Lessons That Could Help Regulators Strengthen Supervisory Oversight and BHCs Improve Risk Management Practices
52Pub. L. No. 111-203, 124 Stat. 1376 (2010); Pub. L. No. 111-24, 123 Stat. 1734 (2009).
Page 40 GAO-10-861 Lessons Learned from Bank Stress Test
As stated earlier and as agreed generally by market participants, the public release of the SCAP design and results helped restore confidence in the financial system during a period of severe turmoil. Some agency officials stated that their experience in implementing SCAP suggested that greater transparency would also be beneficial in the supervisory process. In recent statements, the chairman and a governor of the Federal Reserve have both stated that, while protecting the confidentiality of firm-specific proprietary information is imperative, greater transparency about the methods and conclusions of future stress tests could benefit from greater scrutiny by the public.53 The Federal Reserve governor also noted that feedback from the public could help to improve the methodologies and assumptions used in the supervisory process. In addition, they noted that more transparency about the central bank’s activities overall would ultimately enhance market discipline and that the Federal Reserve is looking at ways to enhance its disclosure policies.54
SCAP’s Transparency Helped Bolster Market Confidence, but the Federal Reserve Has Yet to Implement a Plan to Incorporate Greater Transparency into the Supervisory Process
Consistent with the goal of greater transparency, we previously recommended that the Federal Reserve consider periodically disclosing to the public the aggregate performance of the 19 BHCs against the SCAP estimates for the 2-year forecast period.55 Subsequently, the chairman and a governor of the Federal Reserve have publicly disclosed 2009 aggregate information about the performance of the 19 BHCs based on the Federal Reserve’s internal tracking. As the 2-year SCAP period comes to a close at the end of 2010, completing a final analysis that compares the performance of BHCs with the estimated performance under the more adverse economic scenario would be useful; however, at the time of the review, Federal Reserve officials told us that they have not decided whether to conduct and publicly release any type of analysis. Given that the chairman and a governor of the Federal Reserve have already publicly disclosed some aggregate BHC performance against the more adverse scenario for 2009, providing the
53Ben S. Bernanke, “The Supervisory Capital Assessment Program—One Year Later,” speech delivered at the Federal Reserve Bank of Chicago 2010 46th Annual Conference on Bank Structure and Competition (Chicago, Illinois, May 6, 2010). Daniel K. Tarullo, “Lessons from the Crisis Stress Tests,” speech delivered at the Federal Reserve Board 2010 International Research Forum on Monetary Policy (Washington, D.C., Mar. 26, 2010).
54Daniel K. Tarullo, “Involving Markets and the Public in Financial Regulation,” speech delivered at the Council of Institutional Investors Meeting (Washington, D.C., Apr. 13, 2010). Bernanke “The Supervisory Capital Assessment Program—One Year Later” (2010).
55GAO, Troubled Asset Relief Program: June 2009 Status of Efforts to Address
Transparency and Accountability Issues, GAO-09-658 (Washington, D.C.: June 17, 2009).
Page 41 GAO-10-861 Lessons Learned from Bank Stress Test
2-year results would provide the public with consistent and reliable information from the chief architect of the stress test that could be used to further establish the importance of understanding such tests and consider lessons learned about the rigor of the stress test estimates.
Increasing transparency in the bank supervisory process is a more controversial issue to address. Supervisory officials from OCC (including the then Comptroller) and the Federal Reserve question the extent to which greater transparency would improve day-to-day bank supervision. And, some BHCs we interviewed also were against public disclosure of future stress tests results. They noted that SCAP was a one-time stress test conducted under unique circumstances. Specifically, during the financial crisis, Treasury had provided a capital backstop for BHCs that were unable to raise funds privately. They expressed concern that public disclosure of certain unfavorable information about individual banks in a normal market environment could cause depositors to withdraw funds en masse creating a “run” on the bank. In addition, banks that appear weaker than their peers could be placed at a competitive disadvantage and may encourage them to offer more aggressive rates and terms for new depositors, thereby increasing their riskiness and further affecting their financial stability. While these concerns are valid and deserve further consideration, they have to be weighed against the potential benefits of greater transparency about the financial health of financial institutions and the banking system in general to investors, creditors, and counterparties.
The Dodd-Frank Act takes significant steps toward greater transparency. For example, the act requires the Federal Reserve to perform annual stress tests on systematically significant institutions and publicly release a summary of results. Also, the act requires each of the systematically significant institutions to publicly report the summary of internal stress tests semiannually.56 Given comments by its senior leadership, the Federal Reserve is willing to engage in a constructive dialogue about creating a plan for greater transparency that could benefit the entire financial sector. The other federal bank regulators—FDIC, OCC, and the Office of the Thrift Supervision—are also critical stakeholders in developing such a plan. While Federal Reserve officials have discussed possible options for increasing transparency, the regulators have yet to engage in a formal dialogue about these issues and have not formalized a plan for the public
56The act also establishes the Financial Stability Oversight Council and Treasury’s Office of Financial Research in order to further the goals of effective systemic risk measurement.
Page 42 GAO-10-861 Lessons Learned from Bank Stress Test
disclosure of regulatory banking information or developed a plan for integrating public disclosures into the ongoing supervisory process. Without a plan for reconciling these divergent views and for incorporating steps to enhance transparency into the supervisory process and practices, including the public disclosure of certain information, bank regulators may miss a significant opportunity to enhance market discipline by providing investors, creditors, and counterparties with information such as bank asset valuations.
Limited Use and Weak Oversight of BHCs’ Stress Tests Prior to SCAP Highlights the Need for More Rigorous Testing and Better Monitoring of Tests
SCAP highlighted that the development and utilization of BHCs’ stress tests were limited. Further, BHC officials noted that they failed to adequately stress test for the effects of a severe economic downturn scenario and did not test on a firmwide basis or test frequently enough. We also found that the regulator’s oversight of these tests were weak, reinforcing the need for more rigorous and firmwide stress testing, better risk governance processes by BHCs, and more vigorous oversight of BHCs’ stress tests by regulators. Going forward, as stress tests become a fundamental part of oversights of individual banks and the financial system, more specific guidance needs to be developed for examiners. BHCs and regulators stated that they are taking steps to address these shortcomings.
Prior to SCAP, many BHCs generally performed stress tests on individual portfolios, such as commercial real estate or proprietary trading, rather than on a firmwide basis. SCAP led some institutions to look at their businesses in the aggregate to determine how losses would affect the holding company’s capital base rather than individual portfolios’ capital levels. As a result, some BHC officials indicated that they had begun making detailed assessments of their capital adequacy and risk management processes and are making improvements. Officials from one BHC noted that before SCAP their financial and risk control teams had run separate stress tests, but had not communicate or coordinate with each other about their stress testing activities. Officials from another BHC noted that their senior management and board of directors were not actively involved in the oversight of the stress testing process. These officials said that since participating in SCAP, they have improved in these areas by institutionalizing the internal communication and coordination procedures between the financial risk and control teams, and by increasing communication with senior management and board of directors about the need for active involvement in risk management oversight, respectively. These improvements can enhance the quality of the stress testing process. Moreover, officials of BHCs that were involved in ongoing
BHCs Generally Did Not Perform Firmwide Stress Tests Prior to SCAP
Page 43 GAO-10-861 Lessons Learned from Bank Stress Test
bank mergers during the SCAP process credited SCAP with speeding up of the conversion process of the two institutions’ financial systems since the BHCs’ staff had to work together to be able to quickly provide, among other things, the aggregate asset valuations and losses of the combined firm’s balance sheets to the regulators.
BHC officials also stated that their stress tests would take a firmwide view, that is, taking into account all business units and risks within the holding company structure and would include updates of the economic inputs used to determine potential losses and capital needs in adverse scenarios. One BHC noted that it had developed several severe stress scenarios for liquidity because the recent financial crisis had shown that liquidity could deteriorate more quickly than capital, endangering a company’s prospects for survival. This danger became evident in the failures of major financial institutions during the recent financial crisis—for example, IndyMac Bank, Lehman Brothers, and Bear Stearns.
Officials from many SCAP BHCs and the Federal Reserve noted that internal bank stress test models generally did not use macroeconomic assumptions and loss rates inputs as conservative as those used in the SCAP stress test. According to Federal Reserve officials, using the SCAP macroeconomic assumptions, most of the 19 BHCs that took part in SCAP initially determined that they would not need additional capital to weather the more adverse scenario. However, the SCAP test results subsequently showed that more than half of them (10 of 19) did need to raise capital to meet the SCAP capital buffer requirements. Some BHCs indicated that future stress tests would be more comprehensive than SCAP. BHCs can tailor their stress test assumptions to match their specific business models, while SCAP generally used a one-size-fits-all assumptions approach. For example, some BHCs noted that they use macroeconomic inputs (such as disability claims, prolonged stagflation, or consumer confidence) that were not found in the SCAP stress test.
BHCs Did Not Sufficiently Stress Their Portfolios for Unexpected Losses Prior to SCAP
Although the Federal Reserve has required BHCs to conduct stress tests since 1998, officials from several BHCs noted that their institutions had not conducted rigorous stress tests in the years prior to SCAP, a statement that is consistent with regulatory findings during the same period. To some degree, this lack of rigorous testing reflected the relatively good economic times that preceded the financial crisis. According to one credit rating agency and a BHC, stress test assumptions generally tend to be more optimistic in good economic times and more pessimistic in bad economic times. In addition, one BHC noted that it had conducted stress tests on and off for about 20 years, but usually only as the economy deteriorated. To
Page 44 GAO-10-861 Lessons Learned from Bank Stress Test
address this issue, many BHC officials said that they have incorporated or are planning to incorporate more conservative inputs into their stress test models and are conducting more rigorous, firmwide stress testing more frequently.
Although regulators’ guidelines have required for over 10 years that financial institutions use stress tests to assess their capacity to withstand losses, we found that regulators’ oversight of these tests had been limited. Horizontal examinations by the regulators from 2006 through 2008 identified multiple weaknesses in institutions’ risk management systems, including deficiencies in stress testing. Areas of weaknesses found during examination included that the BHCs’ stress testing of their balance sheets lacked severity, were not performed frequently enough, and were not done on a firmwide basis. Also, it was found that BHCs’ risk governance process lacked the active and effective involvement of BHC senior management and board of directors. The SCAP stress test and the financial crisis revealed the same shortcomings in BHCs’ risk management and stress testing practices.
Regulators Required Stress Tests Prior to SCAP, but Oversight Was Limited
However, we previously found that regulators did not always effectively address these weaknesses or in some cases fully appreciate their magnitude.57 Specifically, regulators did not take measures to push forcefully for institutions to better understand and manage risks in a timely and effective manner. In addition, according to our discussions with some SCAP participants, oversight of these tests through routine examinations was limited in scope and tended to be discretionary. For example, regulators would review firms’ internal bank stress tests of counterparty risk and would make some suggestions, but reviews of these tests were done at the discretion of the individual supervisory team and were not consistently performed across teams. Even though BHCs have for many years performed stress tests to one degree or another, they have not been required to report the results of their testing to the Federal Reserve unless it specifically requested the information.
The Federal Reserve recently issued a letter to the largest banking organizations outlining its view on good practices with respect to the use of stress testing in the context of internal capital adequacy assessment
57GAO, Financial Regulation: Review of Regulators’ Oversight of Risk Management
System at a Limited Number of Large, Complex Financial Institutions, GAO-09-499T (Washington, D.C.: Mar. 18, 2009).
Page 45 GAO-10-861 Lessons Learned from Bank Stress Test
practices (ICAAP). For example, some areas highlighted in the letter include how frequent a stress test should be performed, the minimum time frame that the test should cover, documentation of the process, involvement of senior management and board of directors, and types of scenarios and risks to include in such tests. Some BHC officials believed that stress testing would become an integral part of future risk management practices and noted that SCAP helped them see how bank examiners would want them to stress their portfolios in the future. In anticipation of future action by regulators, many BHCs were designing at least part of their stress tests along the lines of SCAP. However, a few BHC officials hoped that future stress tests would not be performed in the same manner as SCAP, with the largest institutions tested simultaneously in a largely public setting, but rather as part of the confidential supervisory review process.
Federal Reserve officials stated that going forward, stress tests will become a fundamental part of the agency’s oversight of individual banks and the financial system. As a result of SCAP, Federal Reserve officials stated that they are placing greater emphasis on the BHCs’ internal capital adequacy planning through their ICAAP. This initiative is intended to improve the measurement of firmwide risk and the incorporation of all risks into firms’ capital planning assessment and planning processes. In addition to enhanced supervisory focus on these practices across BHCs, stress testing is also a key component of the Basel II capital framework (Pillar 2).58 Under Pillar 2, supervisory review is intended to help ensure that banks have adequate capital to support all risks and to encourage that banks develop and use better risk management practices. All BHCs, including those adopting Basel II, must have a rigorous process of assessing capital adequacy that includes strong board and senior management oversight, comprehensive assessment of risks, rigorous stress testing and scenario analyses, validation programs, and independent review and oversight. In addition, Pillar 2 requires supervisors to review and evaluate banks’ internal capital adequacy assessments and monitor compliance with regulatory capital requirements. The Federal Reserve
Regulatory Oversight Is to Focus on More Rigorous Stress Testing, but Examiners Need More Specific Guidance
58Basel II is an international risk-based capital framework that aims to align minimum capital requirements with enhanced risk measurement techniques and to encourage banks to develop a more disciplined approach to risk management. It was organized with three main principles of capital known as pillars: Pillar 1 relates to minimum capital requirements. Pillar 2 relates to the supervisory review of an institution’s internal assessment process and capital adequacy relative to the institution’s overall risk profile. Pillar 3 relates to the effective use of disclosure to strengthen market discipline as a complement to supervisory efforts.
Page 46 GAO-10-861 Lessons Learned from Bank Stress Test
wants the large banks to conduct this work for themselves and report their findings to their senior management and boards of directors. According to Federal Reserve officials, for BHCs to satisfy the totality of expectations for ICAAP it may take 18 to 24 months, partly because the BHCs are taking actions to enhance practices where needed—including with respect to the use of stress testing and scenario analyses in internal capital assessments—and the Federal Reserve then needs to evaluate these actions across a relatively large number of BHCs.
In addition, the Federal Reserve is finalizing guidance for examiners to assess the capital adequacy process, including stress testing, for BHCs. Examiners are expected to evaluate how BHCs’ stress tests inform the process for identifying and measuring risk and decisions about capital adequacy. Federal Reserve officials stated that examiners are expected to look closely at BHCs’ internal stress test methodologies and results. In a letter to BHCs, the Federal Reserve also emphasized that institutions should look at time frames of 2 or more years and considers losses firmwide. It also suggested that BHCs develop their own stress test scenarios and then review these scenarios and the results for appropriate rigor and quantification of risk.
While these are positive steps, examiners do not have specific criteria for assessing the quality of these tests. For example, the Federal Reserve has not established criteria for assessing the severity of the assumptions used to stress BHCs’ balance sheets. The Federal Reserve officials stated that they intend to have technical teams determine the type of criteria that will be needed to evaluate these assumptions, but they are in the early planning stages. Development of such criteria will be particularly helpful in ensuring the effective implementation of the stress test requirements under the Dodd-Frank Act. Without specific criteria, Federal Reserve examiners will not be able to ensure the rigor of BHCs’ stress tests—an important part of the capital adequacy planning. Furthermore, the absence of such guidance could lead to variations in the intensity of these assessments by individual examiners and across regional districts.
Risk Identification and Assessment Infrastructure Needs to be Upgraded to Improve Oversight
Following SCAP, regulatory and BHC officials we met with identified opportunities to enhance both the process and data inputs for conducting stress testing in the future. This would include processes for obtaining, analyzing, and sharing data and capabilities for data modeling and forecasting, which potentially could increase the Federal Reserve’s abilities to assess risks in the banking system. According to the Federal Reserve, an essential component of this new system will be a quantitative
Page 47 GAO-10-861 Lessons Learned from Bank Stress Test

surveillance mechanism for large, complex financial institutions that will combine a more firmwide and multidisciplinary approach for bank supervision. This quantitative surveillance mechanism will use supervisory information, firm-specific data analysis, and market-based indicators to identify developing strains and imbalances that may affect multiple institutions, as well as emerging risks within specific institutions. This effort by the Federal Reserve may also improve other areas of supervision which rely on data and quantitative analysis, such as assessing the process used by BHC’s to determine their capital adequacy, forecasting revenue, and assessing and measuring risk, which is critical to supervising large, complex banks. Officials at the Federal Reserve told us that examiners should be analyzing BHC performances versus their stress test projections to provide insight into the agency’s loss forecasting approach. Moreover, Federal Reserve officials stated that they are always looking to increase their analytical capabilities, and they have recently implemented a new governance structure to address some of their management information infrastructure challenges. However, not enough time has passed to determine the extent to which such measures will improve banking supervision.
In addition, some other deficiencies were found in the data reported to the Federal Reserve by BHCs using the Y-9C, as well as the Federal Reserve’s ability to analyze the risk of losses pertaining to certain portfolios that were identified during the SCAP stress test. This led the Federal Reserve to develop a more robust risk identification and assessment infrastructure including internally developed models or purchased analytical software and tools from data vendors. Going forward, such models and analytics would facilitate improved risk identification and assessment capabilities and oversight, including the oversight of systemic risk. Moreover, a risk identification and assessment system that can gauge risk in the banking sector by collecting data on a timelier basis is necessary to better ensure the safety and soundness of the banking industry. Specific areas in which data collection and risk identification and assessment could be enhanced include mortgage default modeling to include more analysis of nontraditional mortgage products, counterparty level exposures, country and currency exposures, and commodity exposures. An example of where the Federal Reserve used SCAP to significantly upgrade its ability to assess risks across large BHCs is the development of a system that allowed BHCs to submit their securities positions and market values at a fixed date and apply price shocks. This process was enhanced during
Page 48 GAO-10-861 Lessons Learned from Bank Stress Test
SCAP to facilitate the stress analysis of securities portfolios held by SCAP BHCs.59 This system allowed the Federal Reserve to analyze approximately 100,000 securities in a relatively short time period. The Federal Reserve intends to continue using this database to receive and analyze updated positions from BHCs. With other portfolios, the Federal Reserve contracted with outside data and analytical systems providers. For multifamily loan portfolios, nonfarm loans, and nonresidential loans with a maturity beyond 2 years, all of which are subsets of commercial and industrial loans or commercial real estate portfolios, the Federal Reserve used internal models and purchased an outside vendor service that allowed it to estimate losses for these portfolios. For the remaining commercial portfolios, the Federal Reserve used different existing models found at both the Federal Reserve and Federal Reserve district banks and new models developed to meet the needs of SCAP. When analyzing BHCs’ mortgage portfolios, the consumer loans Supervisory Analytical and Advisory Team provided templates to the BHCs to collect granular data for such analysis, allowing the system to separate BHCs’ mortgage portfolios into much more granular tranches than would be possible using data from regulatory filings. The Federal Reserve further used data from various sources, including a large comprehensive loan-level database of most mortgages that have been securitized in the United States to assist in developing its own loss estimates to benchmark against the BHCs’ proprietary estimates.
These examples point to enhancements in the ability to assess risks to individual firms and across the banking sector that resulted from the SCAP stress test. The Federal Reserve has made clear that it views many of these innovations in its ability to assess and model risks and potential losses as permanent additions to its toolkit, and has also recognized the need for more timely and granular information to improve its supervision of BHCs and other institutions. However, the extent to which these models and tools will be distributed across the Federal Reserve district banks and other federal banking regulators is unclear. In addition, as the stress test applied to trading positions was limited to those BHCs that held trading positions of at least $100 billion as of February 20, 2009, the Federal Reserve has not indicated that it will roll out its new system to BHCs with
59These portfolios were the only ones tested under the SCAP for which the positions were taken as of a different date than December 31, 2008. Positions were taken as of February 20, 2009, as it was both more relevant to the actual risk exposure of the BHCs at the time of SCAP and easier for the BHCs to provide.
Page 49 GAO-10-861 Lessons Learned from Bank Stress Test
smaller trading positions. The Federal Reserve has taken steps to maintain and enhance the tools and data used during SCAP. Further, improving the Federal Reserve’s financial data collection and supervisory tools will require additional resources, training for bank examiners, coordination in the dissemination of new infrastructure across all U.S. financial regulators, and, according to a Federal Reserve governor, would benefit from relief from the Paperwork Reduction Act of 1980 as well.
The Federal Reserve lacks a complete plan on how it will achieve permanent improvements in its risk identification and assessment infrastructure, but according to officials, such a plan is in development. The Federal Reserve has finalized a plan that describes a governance structure for overseeing large, complex financial organizations. The plan defines the roles and responsibilities of various committees and teams within the Federal Reserve that will carry out its supervisory responsibilities over these organizations. However, further planning is needed to incorporate lessons learned from SCAP for addressing data and modeling gaps that existed prior to the crisis and a structure for disseminating improvements to risk identification and assessment. Specifically, this plan will also be critical to addressing improvements to data and modeling infrastructure in supervising not only large financial holding companies but also smaller institutions. A fully developed plan would also consider how to disseminate data, models, and other infrastructure to the entire Federal Reserve System and bank regulatory agencies, as well as the newly established Financial Stability Oversight Council and Treasury’s Office of Financial Research. Without such a plan, the agency runs the risk of not optimizing its oversight responsibilities, especially in light of its new duties as the systemic risk regulator under the Dodd-Frank Act.
More Coordination and Communication across Regulators Is Critical for Understanding Risks to Individual Institutions and Financial Markets
Another critical lesson from SCAP was the need for robust coordination and communication among the regulators in examining large, complex financial institutions. Officials from the regulatory agencies and BHCs stated that the degree of cooperation among the SCAP regulators was unprecedented and improved the understanding of the risks facing the individual BHCs and the financial market. Such coordination and communication will become increasingly important as banking regulators increase their oversight role. Even with recent major reform to the financial regulatory structure, multiple regulatory agencies continue to oversee the banking industry, and regulators will need to prioritize efforts to promote coordination and communication among staff from these
Page 50 GAO-10-861 Lessons Learned from Bank Stress Test
agencies so that emerging problematic issues affecting the financial industry are identified in a timely manner and effectively addressed.
Going forward, based on our discussions with various SCAP participants and statements by Federal Reserve officials, including the chairman, the regulators’ experience with SCAP is anticipated to lead to the expanded use of horizontal examinations and multidisciplinary staff that will require extensive interagency coordination. Horizontal examinations may involve multiple regulators and underscore the importance of effective coordination and communication.
Currently, regulators are conducting horizontal examinations of internal processes that evaluate the capital adequacy at the 28 largest U.S. BHCs. Their focus is on the use of stress testing and scenario analyses in ICAAP, as well as how shortcomings in fundamental risk management practices and governance and oversight by the board of directors for these processes could impair firms’ abilities to estimate their capital needs. Regulators recently completed the initial phase of horizontal examinations of incentive compensation practices at 25 large U.S. BHCs. As part of this review, each organization was required to submit an analysis of shortcomings or “gaps” in its existing practices relative to the principles contained in the proposed supervisory guidance issued by the Federal Reserve in the fall of 2009 as well as plans—including timetables—for addressing any weaknesses in the firm’s incentive compensation arrangements and related risk-management and corporate governance practices. In May 2010, regulators provided the banking organizations feedback on the firms’ analyses and plans. These organizations recently submitted revised plans to the Federal Reserve for addressing areas of deficiencies in their incentive compensation programs. In a June 2010 press release, the Federal Reserve noted that to monitor and encourage improvements in compensation practices by banking organizations, its staff will prepare a report after 2010 on trends and developments in such practices at banking organizations.
Our prior work has found that coordination and communication among regulatory agencies is an ongoing challenge.60 For example, in 2007, OCC onsite examiners, as well as officials in headquarters, told us that
60GAO, Financial Market Regulation: Agencies Engaged in Consolidated Supervision
Can Strengthen Performance Measurement and Collaboration, GAO-07-154 (Washington, D.C.: Mar. 15, 2007).
Page 51 GAO-10-861 Lessons Learned from Bank Stress Test
coordination issues hampered the Federal Reserve’s horizontal examinations. Also, in 2007, a bank told us that it had initially received conflicting information from the Federal Reserve, its consolidated supervisor, and the OCC, its primary bank supervisor, regarding a key policy interpretation. Officials from the bank also noted that when the Federal Reserve collected information, it did not coordinate with OCC, the primary bank examiner of the lead bank, resulting in unnecessary duplication. We noted that to improve oversight in the future, regulators will need to work closely together to expedite examinations and avoid such duplications.
Since the SCAP stress test was concluded, the following examples highlight ongoing challenges in coordination and communication:
• Officials from OCC and FDIC indicated that they were not always involved in important discussions and decisions. For example, they were not involved in the decision to reduce GMAC’s SCAP capital requirement, even though they were significantly involved in establishing the original capital requirement. Also, FDIC noted that it was excluded from such decision even though it is the primary federal bank regulator for GMAC’s retail bank (Ally Bank).
• The Federal Reserve held an internal meeting to discuss lessons learned from SCAP, but has yet to reach out to the other SCAP regulators. The OCC and FDIC told us that they had not met with the Federal Reserve as a group to evaluate the SCAP process and document lessons learned. As a result, the FDIC and OCC did not have an opportunity to share their views on what aspects of SCAP worked and did not work, as well as any potential improvements that can be incorporated into future horizontal reviews or other coordinated efforts.
• In the recent horizontal examinations, both FDIC and OCC noted that the interagency process for collaboration—especially in the initial design stages—was not as effective as it was for SCAP. OCC commented that more collaboration up front would have been preferable. Also, FDIC stated that the Federal Reserve did not include it in meetings to formulate aggregate findings for the horizontal examination of incentive compensation programs, and it experienced difficulties in obtaining aggregate findings from the Federal Reserve. The Federal Reserve commented that the FDIC was involved in the development of findings for those organizations that control an FDIC-supervised subsidiary bank and that FDIC has since been provided information on the findings across the full range of organizations included in the horizontal review, the majority of which do not control an FDIC-supervised subsidiary bank.
Page 52 GAO-10-861 Lessons Learned from Bank Stress Test
These continued challenges in ensuring effective coordination and communication underscore the need for sustained commitment and effort by the regulators to ensure the inclusion of all relevant agencies in key discussions and decisions regarding the design, implementation, and results of multiagency horizontal examinations. As the SCAP process has shown, active participation by all relevant regulators can strengthen approaches used by examiners in performing their supervisory activities. Without continuous coordination and communication, the regulators will miss opportunities to leverage perspectives and experiences that could further strengthen the supervision of financial institutions, especially during horizontal examinations of financial institutions.
Publicly reporting a comparison of the actual performance of the SCAP BHCs and the estimated performance under a more adverse scenario provides insights into the financial strength of the nation’s largest BHCs. Senior Federal Reserve officials have publicly disclosed select aggregate information about the performance of the 19 BHCs consistent with the recommendation in our June 2009 report. Specifically, we recommended that the Federal Reserve consider periodically disclosing to the public the performance of the 19 BHCs against the SCAP estimates during the 2-year period. However, the Federal Reserve has yet to commit to completing a final analysis that compares the BHCs’ actual performance with the estimated performance under SCAP’s more adverse economic scenario for the entire 2-year period and making this analysis public. Such an analysis is important for the market and BHCs to assess the rigor of the stress test methodology. Publicly releasing the results also would allow the public to gauge the health of the BHCs that participated in SCAP, which is a strong proxy for the entire U.S. banking industry. And public disclosure of this analysis could act as a catalyst for a public discussion of the value of effective bank risk management and enhance confidence in the regulatory supervision of financial institutions.
Conclusions
The public release of the stress test methodology and results helped improve market confidence in the largest BHCs during the recent financial crisis and provided an unprecedented window into bank supervision process. Subsequently, the Chairman of the Federal Reserve and a Federal Reserve governor have publicly stated that greater transparency should be built into the supervisory process and that feedback from the public could help increase the integrity of the supervisory process. Increased transparency can also augment the information that is available to investors and counterparties of the institutions tested and enhance market discipline. Despite these statements, the Federal Reserve and other bank
Page 53 GAO-10-861 Lessons Learned from Bank Stress Test
regulators have yet to start a formal dialogue about this issue, nor have they developed a plan for integrating public disclosures into the ongoing supervisory process. Such a plan could detail the types of information that would benefit the markets if it were publicly released; the planned methodology for the stress tests, including assumptions; the frequency with which information would be made public; and the various means of disseminating the information. Taking into account the need to protect proprietary information and other market-sensitive information would be an important part of such a plan. While regulators will undoubtedly face challenges in determining how best to overcome skepticism about the potential effects on the financial markets of disclosing sensitive information on the financial health of banks, the Dodd-Frank Act requires that the Federal Reserve and certain banks publicly release a summary of results from periodic stress tests. Without a plan for enhancing the transparency of supervisory processes and practices, bank regulators may miss a significant opportunity to further strengthen market discipline and confidence in the banking industry by providing investors, creditors, and counterparties with useful information.
The SCAP stress test shed light on areas for further improvement in the regulators’ bank supervision processes, including oversight of risk management practices at BHCs. Prior to SCAP, regulatory oversight of stress tests performed by the BHCs themselves was ineffective. Specifically, although regulators required stress tests, the guidelines for conducting them were more than a decade old, and the individual banks were responsible for designing and executing them. The Federal Reserve’s reviews of the internal stress tests were done at the discretion of the BHCs’ individual supervisory teams and were not consistently performed. Further, even though BHCs performed stress tests, they were not required to report the results of their stress testing to the Federal Reserve without a specific request from regulators. Post-SCAP, however, the Federal Reserve has stated that stress testing will now be a fundamental part of their oversight of individual banks. The Federal Reserve expects to play a more prominent role in reviewing assumptions, results, and providing input into the BHCs’ risk management practices. While the Federal Reserve has begun to take steps to augment its oversight, currently Federal Reserve examiners lack specific criteria for assessing the severity of BHCs’ stress tests. Without specific criteria, Federal Reserve examiners will not be able to ensure the rigor of BHCs’ stress tests. Furthermore, the absence of such criteria could lead to variations in the intensity of these assessments by individual examiners and across regional districts.
Page 54 GAO-10-861 Lessons Learned from Bank Stress Test
The experience with SCAP also showed that regulators needed relevant and detailed data to improve oversight of individual banks and to identify and assess risks. As the Federal Reserve and the other regulators conduct more horizontal reviews, they will need a robust plan for quantitatively assessing the risk in the banking sector. Collecting timely data for the annual stress testing and other supervisory actions will be critical in order to better ensure the safety and soundness of the banking industry. The Federal Reserve has finalized a plan that describes a governance structure for overseeing large, complex financial organizations. However, further planning is needed to incorporate lessons learned from SCAP for addressing data and modeling gaps and a structure for disseminating improvements to risk identification and assessment. Further, efforts to improve the risk identification and assessment infrastructure will need to be effectively coordinated with other regulators and the newly established Financial Stability Oversight Council and Treasury’s Office of Financial Research in order to ensure an effective systemwide risk assessment. Without fully developing a plan that can identify BHCs’ risks in time to take appropriate supervisory action, the Federal Reserve may not be well-positioned to anticipate and minimize future banking problems and ensure the soundness of the banking system.
Despite the positive coordination and communication experience of the SCAP stress test, developments since the completion of SCAP have renewed questions about the effectiveness of regulators’ efforts to strengthen their coordination and communication. For example, on important issues, such as finalizing GMAC’s SCAP capital amount, the Federal Reserve chose not to seek the views of other knowledgeable bank regulators. While the Dodd-Frank Act creates formal mechanisms that require coordination and communication among regulators, the experiences from SCAP point to the need for a sustained commitment by each of the banking regulators to enhance coordination and communication. In particular, ensuring inclusion of relevant agencies in key discussions and decisions regarding the design, implementation, and results of multiagency horizontal examinations will be critical. If regulators do not consistently coordinate and communicate effectively during horizontal examinations, they run the risk of missing opportunities to leverage perspectives and experiences that could further strengthen bank supervision.
To gain a better understanding of SCAP and inform the use of similar stress tests in the future, we recommend that the Chairman of the Federal Reserve direct the Division of Banking Supervision and Regulation to:
Recommendations
Page 55 GAO-10-861 Lessons Learned from Bank Stress Test
• Compare the performance of the 19 largest BHCs against the more adverse scenario projections following the completion of the 2-year period covered in the SCAP stress test ending December 31, 2010, and disclose the results of the analysis to the public. To leverage the lessons learned from SCAP to the benefit of other regulated bank and thrift institutions, we recommend that the Chairman of the Federal Reserve in consultation with the heads of the FDIC and OCC take the following actions:
• Follow through on the Federal Reserve’s commitment to improve the transparency of bank supervision by developing a plan that reconciles the divergent views on transparency and allows for increased transparency in the regular supervisory process. Such a plan should, at a minimum, outline steps for releasing supervisory methodologies and analytical results for stress testing.
• Develop more specific criteria to include in its guidance to examiners for assessing the quality of stress tests and how these tests inform BHCs’ capital adequacy planning. These guidelines should clarify the stress testing procedures already incorporated into banking regulations and incorporate lessons learned from SCAP.
• Fully develop its plan for maintaining and improving the use of data, risk identification and assessment infrastructure, and requisite systems in implementing its supervisory functions and new responsibilities under the Dodd-Frank Act. This plan should also ensure the dissemination of these enhancements throughout the Federal Reserve System and other financial regulators, as well as new organizations established in the Dodd-Frank Act.
• Take further steps to more effectively coordinate and communicate among themselves. For example, ensuring that all applicable regulatory agencies are included in discussions and decisions regarding the development, implementation, and results of multiagency activities, such as horizontal examinations of financial institutions.
We provided a draft of this report to the Federal Reserve, FDIC, OCC, OTS, and Treasury for review and comment. We received written comments from the Chairman of the Federal Reserve Board of Governors and the Assistant Secretary for Financial Stability. These comments are summarized below and reprinted in appendixes IV and V, respectively. We
Agency Comments and Our Evaluation
Page 56 GAO-10-861 Lessons Learned from Bank Stress Test

also received technical comments from the Federal Reserve, FDIC, OCC, and Treasury, which we incorporated into the report as appropriate. OTS did not provide any comments. In addition, we received technical comments from the Federal Reserve and most of the 19 SCAP BHCs on the accuracy of our tracking of revenues and losses in 2009 for each of the SCAP BHCs and incorporated them into the report as appropriate.
In its comment letter, the Federal Reserve agreed with all five of our recommendations for building on the successes of SCAP to improve bank supervision. The Federal Reserve noted that our recommendations generally relate to actions it is currently undertaking or planning to take under the Dodd-Frank Act. It also cited that in coordination with FDIC and OCC, it would provide a public assessment of BHCs’ performance relative to the loss and preprovision net revenue estimates under the more adverse scenario, taking into account the limitations of such an analysis. For our remaining recommendations related to increased transparency, examiner guidance, risk identification and assessment, and coordination and communication of multiagency activities, the Federal Reserve generally noted that it has taken step in these areas and will continue to consult with the FDIC and OCC in implementing our recommendations and its new responsibilities under the Dodd-Frank Act.
While our report recognizes the steps that the Federal Reserve has taken related to transparency, examiner guidance, risk identification and assessment, and coordination and communication of multiagency activities, these areas warrant ongoing attention. For example, as we note in the report, while the Federal Reserve is in the process of finalizing examination guidance for reviewing stress tests, examiners currently do not have specific criteria for assessing the severity of these tests nor have they coordinated with the other bank regulators. Until this guidance is completed, examiners will lack the information needed to fully ensure the rigor of BHCs’ stress tests, and the Board will not be able to fully ensure the consistency of the assessment by individual examiners. Our report also notes the positive coordination and communication experience of the SCAP stress test, but we continued to find specific instances since the completion of SCAP that have renewed questions about the effectiveness of regulators’ efforts to strengthen their coordination and communication. For instance, while the Federal Reserve included relevant agencies in key discussions and decisions regarding the design, implementation, and results of SCAP, we found that the Federal Reserve missed opportunities to include other bank regulators when planning more recent horizontal examinations.
Page 57 GAO-10-861 Lessons Learned from Bank Stress Test
Treasury agreed with our report findings, noting that it appreciated our acknowledgment that SCAP met its goals of providing a comprehensive, forward-looking assessment of the balance sheet risks of the largest banks and increasing the level and quality of capital held by such banks. It further noted that the unprecedented public release of the stress test results led to an increase in the market confidence in the banking system, which aided in improving the capital adequacy of the largest banks.
We are sending copies of this report to the appropriate congressional committees; Chairman of the Federal Reserve, the Acting Comptroller of Currency, Chairman of the FDIC, the Acting Director of the Office of the Thrift Supervision, and the Secretary of the Treasury. Also, we are sending copies of this report to the Congressional Oversight Panel, Financial Stability Oversight Board, the Special Inspector General for TARP, and other interested parties. In addition, the report will be available at no charge on the GAO Web site at http://www.gao.gov.
Should you or your staff have any questions on the matters discussed in this report, please contact me at (202) 512-8678 or [email protected]. Contact points for our Offices of Congressional Relations and Public Affairs may be found on the last page of this letter. GAO staff who made key contributions to this report are listed in appendix VI.
Orice Williams Brown Director, Financial Markets and Community Investment
Page 58 GAO-10-861 Lessons Learned from Bank Stress Test

List of Committees
The Honorable Daniel K. Inouye Chairman The Honorable Thad Cochran Vice Chairman Committee on Appropriations United States Senate
The Honorable Christopher J. Dodd Chairman The Honorable Richard C. Shelby Ranking Member Committee on Banking, Housing, and Urban Affairs United States Senate
The Honorable Kent Conrad Chairman The Honorable Judd Gregg Ranking Member Committee on the Budget United States Senate
The Honorable Max Baucus Chairman The Honorable Charles E. Grassley Ranking Member Committee on Finance United States Senate
The Honorable David R. Obey Chairman The Honorable Jerry Lewis Ranking Member Committee on Appropriations House of Representatives
The Honorable John M. Spratt Jr. Chairman The Honorable Paul Ryan Ranking Member Committee on the Budget House of Representatives
Page 59 GAO-10-861 Lessons Learned from Bank Stress Test

The Honorable Barney Frank Chairman The Honorable Spencer Bachus Ranking Member Committee on Financial Services House of Representatives
The Honorable Sander M. Levin Chairman The Honorable Dave Camp Ranking Member Committee on Ways and Means House of Representatives
Page 60 GAO-10-861 Lessons Learned from Bank Stress Test

Appendix I: Objectives, Scope, and
Methodology
Page 61 GAO-10-861
Appendix I: Objectives, Scope, and Methodology
The objectives of this report were to (1) describe the process used to design and conduct the stress test and participants views’ of the process, (2) describe the extent to which the stress test achieved its goals and compare its estimates with the bank holding companies’ (BHC) actual results, and (3) identify the lessons regulators and BHCs learned from the Supervisory Capital Assessment Program (SCAP) and examine how each are using those lessons to enhance their risk identification and assessment practices.
To meet the report’s objectives, we reviewed the Board of Governors of the Federal Reserve System’s (Federal Reserve) The Supervisory Capital
Assessment Program: Design and Implementation (SCAP design and implementation document) dated April 24, 2009, and The Supervisory
Capital Assessment Program: Overview of Results (SCAP results document) dated May 7, 2009. We analyzed the initial stress test data that the Federal Reserve provided to each BHC, the subsequent adjustments the Federal Reserve made to these estimates, and the reasons for these adjustments. We reviewed BHC regulatory filings such as the Federal Reserve’s 2009 Consolidated Financial Statements for Bank Holding Companies—-FR Y-9C (Y-9C);1 company quarterly 10-Qs and annual 10-Ks; speeches and testimonies regarding SCAP and stress testing; BHCs’ presentations to shareholders and earnings reports; bank supervision guidance issued by the Federal Reserve, Office of the Comptroller of the Currency (OCC), and the Federal Deposit Insurance Corporation (FDIC); and documents regarding the impact of SCAP and the financial crisis and
1The Y-9C is a Federal Reserve reporting form that collects basic financial data from a domestic BHC on a consolidated basis in the form of a balance sheet, an income statement, and detailed supporting schedules, including a schedule of off balance-sheet items. The information is used to assess and monitor the financial condition of BHC organizations, which may include parent, bank, and nonbank entities. The Y-9C is a primary analytical tool used to monitor financial institutions between on-site inspections and is filed quarterly as of the last calendar day of March, June, September, and December. The Federal Reserve used such format to collect data from the BHCs for purposes of conducting the SCAP stress test.
Lessons Learned from Bank Stress Test
Appendix I: Objectives, Scope, and
Methodology
proposed revisions to bank regulation and supervisory oversight.2 To further understand these documents and obtain different perspectives on the SCAP stress test, we interviewed officials from the Federal Reserve, OCC, FDIC, and the Office of the Thrift Supervision, as well as members of the multidisciplinary teams created to execute SCAP.3
We also collected data from SNL Financial—a private financial database that contains publicly filed regulatory and financial reports, including those of the BHCs involved in SCAP—in order to compare the BHCs’ actual performance in 2009 against the regulators’ 2-year SCAP loss estimates and GAO’s 1-year pro rata loss estimates. To obtain additional background information regarding the tracking of the BHCs, perspectives on their performance, anticipated loan losses, and the success of SCAP in achieving its goals, we interviewed relevant officials (e.g., chief risk officers and chief financial officers) from 11 of the 19 BHCs that participated in the SCAP stress test. The BHCs we interviewed were the American Express Company; Bank of America Corporation; The Bank of New York Mellon Corporation; BB&T Corporation; Citigroup Inc.; GMAC LLC;4 The Goldman Sachs Group, Inc.; JPMorgan Chase & Co.; MetLife, Inc.; Regions Financial Corporation; and Wells Fargo & Company. We selected these BHCs to reflect differences in size, types of financial services provided, geographic location, primary bank regulator, and participation in the Troubled Asset Relief Program (TARP). In addition, we met with credit rating agency officials from the Standard and Poor’s Corporation, Moody’s Corporation, and Fitch Ratings Inc. for their
2For a more detailed discussion about risk-management practices in place during the market turmoil, see the following reports: Senior Supervisors Group, Observations on Risk
Management Practices during the Recent Market Turbulence (New York, Mar. 6, 2008); International Monetary Fund, Global Financial Stability Report: Containing Systemic
Risk and Restoring Financial Soundness (Washington, D.C.: April 2008); Financial Stability Forum, Report of the Financial Stability Forum on Enhancing Market and
Institutional Resilience (April 2008); Institute of International Finance, Final Report of the
IIF Committee on Market Best Practices: Principles of Conduct and Best Practice
Recommendations (July 2008); Credit Risk Management Policy Group III, Containing
Systemic Risk: The Road to Reform (August 2008); Senior Supervisors Group, Risk
Management Lessons from the Global Banking Crisis of 2008 (Oct. 21, 2009); Basel Committee on Banking Supervision, Principles for Sound Stress Testing Practices and
Supervision (Basel, Switzerland, May 2009); and the President’s Working Group on Financial Markets, Policy Statement on Financial Market Developments (March 2008).
3The Office of the Thrift Supervision did not participate in conducting the stress test.
4On June 30, 2009, GMAC LLC changed its corporate structure and became GMAC Inc., and on May 10, 2010, GMAC Inc. changed its name to Ally Financial Inc.
Page 62 GAO-10-861 Lessons Learned from Bank Stress Test
Appendix I: Objectives, Scope, and
Methodology
perspective on SCAP and their own stress test practices. To more completely understand the execution of SCAP, we completed a literature search of stress tests conducted by others—for example, the Committee on European Banking Supervisors and the International Monetary Fund. We also reviewed relevant credit rating agency reports and the reports of other oversight bodies such as the Congressional Oversight Panel and the Special Inspector General for the Troubled Asset Relief Program on topics related to stress testing and TARP. We also reviewed our past work on the bank supervisory process and SCAP.5
In addition, to track the actual performance of the 19 BHCs, we collected data from several sources. We then compared the BHCs’ actual performance to the December 31, 2008, capital levels presented in SCAP and the projections made under the more adverse scenario for estimated losses for loans, securities (available for sale and held to maturity), trading and counterparty, and resources other than capital to absorb losses.6 Our primary source for SCAP estimates was the May 7, 2009, SCAP results document, which contained the estimates for each of the 19 BHCs and aggregate data for all BHCs. We also reviewed the confidential April 24, 2009, and May 5, 2009, presentations that the SCAP regulators made to each of the 19 BHCs to identify estimates of preprovision net revenue (PPNR) and changes in allowance for loan and lease losses (ALLL) for the 2 years ended 2010. Our primary source for the actual results at the BHCs was the Federal Reserve’s Y-9C. In doing so, we used the SNL Financial database to extract data on the Y-9C and the Securities and Exchange Commission forms 10-K and 10-Q. These data were collected following the close of the fourth quarter of 2009, the halfway point of the SCAP’s 2-year time frame.
5See GAO, Financial Market Regulation: Agencies Engaged in Consolidated Supervision
Can Strengthen Performance Measurement and Collaboration, GAO-07-154 (Washington, D.C.: Mar. 15, 2007); Financial Regulation: A Framework for Crafting and Assessing
Proposals to Modernize the Outdated U.S. Financial Regulatory System, GAO-09-216 (Washington, D.C.: Jan. 8, 2009); Financial Regulation: Review of Regulators’ Oversight of
Risk Management Systems at a Limited Number of Large, Complex Financial
Institutions, GAO-09-499T (Washington, D.C.: Mar. 18, 2009); and Troubled Asset Relief
Program: June 2009 Status of Efforts to Address Transparency and Accountability
Issues, GAO-09-658 (Washington, D.C.: June 2009). Also, see Congressional Oversight Panel’s Stress Testing and Shoring Up Bank Capital (June 9, 2009).
6The BHCs had to maintain a tier 1 capital ratio of at least 6 percent of risk-weighted assets and a tier 1 common capital ratio of at least 4 percent of risk-weighted assets at the end of 2010. PPNR is defined as net interest income plus noninterest income minus noninterest expense. Allowance for loan and lease losses is defined as the capital reserve set aside to cover anticipated losses.
Page 63 GAO-10-861 Lessons Learned from Bank Stress Test

Appendix I: Objectives, Scope, and
Methodology
Since losses were not estimated on a quarter-by-quarter or yearly basis but projected for the full 2-year period, we assumed that losses and revenue estimates under the more adverse scenario were distributed at a constant rate across the projection period. Thus, we compared the actual 2009 year end values with half of the Federal Reserve’s 2-year SCAP projections. This methodology has some limitations because losses, expenses, revenues, and changes to reserves are historically unevenly distributed and loss rates over a 2-year period in an uncertain economic environment can follow an inconsistent path. However, the Federal Reserve, OCC, credit rating agencies, an SNL Financial analyst, and most of the BHCs we interviewed who are tracking performance relative to SCAP estimates are also using the same methodology. We assessed the reliability of the SNL Financial database by following GAO’s best practices for data reliability and found that the data was sufficiently reliable for our purposes.7 To confirm the accuracy of our BHC tracking data, we shared our data with the Federal Reserve and the 19 SCAP BHCs. We received comments and incorporated them as appropriate.
Some of the data that we collected were not in a form that was immediately comparable to the categories used in the SCAP results, and we had to make adjustments in order to make the comparison. For tier 1 common capital, most asset categories, and resources other than capital to absorb losses, we had to find a methodology suited to aggregating these data so that we could compare it to the corresponding SCAP data. For example, net-charge offs for the various loan categories are broken out into more subcategories in the Y-9C than those listed in the SCAP results. In addition, we calculated “Resources Other than Capital to Absorb Losses” to correspond to the SCAP definition of PPNR minus the change in ALLL, which required obtaining data from multiple entries within the Y-9C. When calculating noninterest expense we removed the line item for goodwill impairment losses because this item was not included in the SCAP regulators’ projections. We also used the calculation of a change in ALLL until December 31, 2009. But the SCAP regulators considered an increase in ALLL over the full 2-year period to be a drain on resources, because the provisions made to increase the ALLL balance would not be available to absorb losses during the 2-year SCAP time frame. This notion creates a problem in using the formula for 1-year tracking purposes because an increase in ALLL during 2009 would require provisions for that
7See GAO, Assessing the Reliability of Computer-Processed Data, Version 1, GAO-02-15G (Washington, D.C.: September 2002).
Page 64 GAO-10-861 Lessons Learned from Bank Stress Test

Appendix I: Objectives, Scope, and
Methodology
increase, but those added reserves could ultimately be used to absorb losses during 2010. To maintain consistency, our calculation considers ALLL increases during 2009 to be a drain on resources, but we recognize that this money could act as a resource to absorb losses rather than a drain on those resources.
We faced an additional limitation pertaining to the ALLL calculation and a challenge with regard to the treatment of trading and counterparty revenues. In our review of SCAP documentation, we found that SCAP regulators used two different ALLL calculations—1 calculation for 4 of the BHCs that included a reserve for off-balance sheet items and another for the remaining 15 BHCs that did not include off-balance sheet reserves. The Federal Reserve confirmed that there were two different calculations that were not adjusted for consistency. In order to be consistent across the BHCs, we applied the same methodology that the regulators used for 15 of the BHCs to the 4 that remained. The treatment of trading and counterparty revenue created a challenge because the data in the Y-9C includes both customer derived revenue from transactions for BHCs that operate as broker-dealers and gains (or losses) from proprietary trading and certain associated expenses. These items are presented only in net form in the Y-9C. However, for the five BHCs (Bank of America Corporation; Citigroup, Inc.; Goldman Sachs Group, Inc.; JPMorgan Chase & Co.; and Morgan Stanley) that had their trading portfolios stressed, the trading and counterparty line is based on projections of gains (losses) from proprietary trading, but PPNR (specifically noninterest revenue) is based on gains from customer derived revenue from transactions for BHCs that operate as broker-dealers. Because we could not segregate these items based on the Y-9C, we have included the net amount in both the trading and counterparty and noninterest income line items. This means that the net amount of the trading gains or losses as reported in the Y-9C are included in two places in our tracking table for those five BHCs. For the remaining 14 BHCs, we included the entire line item in noninterest income, as that is where it was located in the SCAP projections.
Table 6 shows the items we used to calculate tier 1 capital, asset losses, PPNR, and ALLL as of December 31, 2009 and the specific sources we used. We also included specific references to the sources we used. Some elements within the table required a more detailed aggregation or calculation and are therefore explained further in tables 7 and 8 below. For reporting these capital measures and asset balances for the year ending December 31, 2008, we generally relied on the figures published in various SCAP documents.
Page 65 GAO-10-861 Lessons Learned from Bank Stress Test
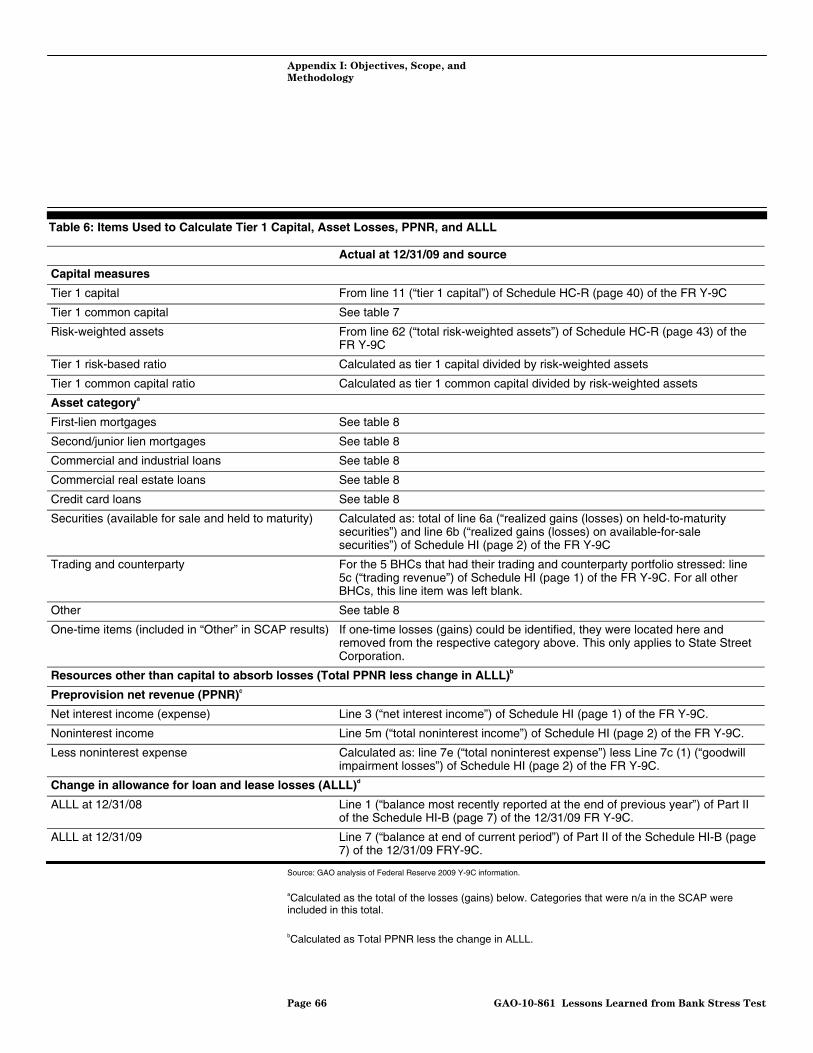
Appendix I: Objectives, Scope, and
Methodology
Table 6: Items Used to Calculate Tier 1 Capital, Asset Losses, PPNR, and ALLL
Actual at 12/31/09 and source
Capital measures
Tier 1 capital From line 11 (“tier 1 capital”) of Schedule HC-R (page 40) of the FR Y-9C
Tier 1 common capital See table 7
Risk-weighted assets From line 62 (“total risk-weighted assets”) of Schedule HC-R (page 43) of the FR Y-9C
Tier 1 risk-based ratio Calculated as tier 1 capital divided by risk-weighted assets
Tier 1 common capital ratio Calculated as tier 1 common capital divided by risk-weighted assets
Asset categorya
First-lien mortgages See table 8
Second/junior lien mortgages See table 8
Commercial and industrial loans See table 8
Commercial real estate loans See table 8
Credit card loans See table 8
Securities (available for sale and held to maturity) Calculated as: total of line 6a (“realized gains (losses) on held-to-maturity securities”) and line 6b (“realized gains (losses) on available-for-sale securities”) of Schedule HI (page 2) of the FR Y-9C
Trading and counterparty For the 5 BHCs that had their trading and counterparty portfolio stressed: line 5c (“trading revenue”) of Schedule HI (page 1) of the FR Y-9C. For all other BHCs, this line item was left blank.
Other See table 8
One-time items (included in “Other” in SCAP results) If one-time losses (gains) could be identified, they were located here and removed from the respective category above. This only applies to State Street Corporation.
Resources other than capital to absorb losses (Total PPNR less change in ALLL)b
Preprovision net revenue (PPNR)c
Net interest income (expense) Line 3 (“net interest income”) of Schedule HI (page 1) of the FR Y-9C.
Noninterest income Line 5m (“total noninterest income”) of Schedule HI (page 2) of the FR Y-9C.
Less noninterest expense Calculated as: line 7e (“total noninterest expense”) less Line 7c (1) (“goodwill impairment losses”) of Schedule HI (page 2) of the FR Y-9C.
Change in allowance for loan and lease losses (ALLL)d
ALLL at 12/31/08 Line 1 (“balance most recently reported at the end of previous year”) of Part II of the Schedule HI-B (page 7) of the 12/31/09 FR Y-9C.
ALLL at 12/31/09 Line 7 (“balance at end of current period”) of Part II of the Schedule HI-B (page 7) of the 12/31/09 FRY-9C.
Source: GAO analysis of Federal Reserve 2009 Y-9C information. aCalculated as the total of the losses (gains) below. Categories that were n/a in the SCAP were included in this total. bCalculated as Total PPNR less the change in ALLL.
Page 66 GAO-10-861 Lessons Learned from Bank Stress Test
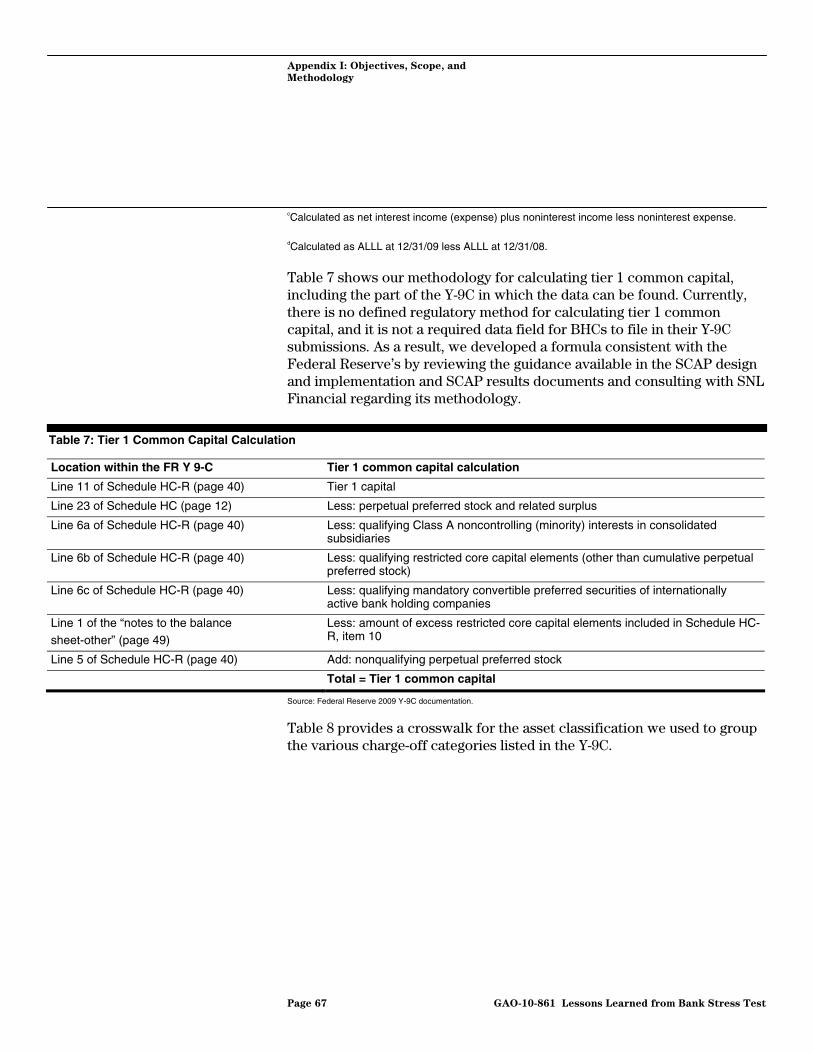
Appendix I: Objectives, Scope, and
Methodology
cCalculated as net interest income (expense) plus noninterest income less noninterest expense. dCalculated as ALLL at 12/31/09 less ALLL at 12/31/08.
Table 7 shows our methodology for calculating tier 1 common capital, including the part of the Y-9C in which the data can be found. Currently, there is no defined regulatory method for calculating tier 1 common capital, and it is not a required data field for BHCs to file in their Y-9C submissions. As a result, we developed a formula consistent with the Federal Reserve’s by reviewing the guidance available in the SCAP design and implementation and SCAP results documents and consulting with SNL Financial regarding its methodology.
Table 7: Tier 1 Common Capital Calculation
Location within the FR Y 9-C Tier 1 common capital calculation
Line 11 of Schedule HC-R (page 40) Tier 1 capital
Line 23 of Schedule HC (page 12) Less: perpetual preferred stock and related surplus
Line 6a of Schedule HC-R (page 40) Less: qualifying Class A noncontrolling (minority) interests in consolidated subsidiaries
Line 6b of Schedule HC-R (page 40) Less: qualifying restricted core capital elements (other than cumulative perpetual preferred stock)
Line 6c of Schedule HC-R (page 40) Less: qualifying mandatory convertible preferred securities of internationally active bank holding companies
Line 1 of the “notes to the balance sheet-other” (page 49)
Less: amount of excess restricted core capital elements included in Schedule HC-R, item 10
Line 5 of Schedule HC-R (page 40) Add: nonqualifying perpetual preferred stock
Total = Tier 1 common capital
Source: Federal Reserve 2009 Y-9C documentation.
Table 8 provides a crosswalk for the asset classification we used to group the various charge-off categories listed in the Y-9C.
Page 67 GAO-10-861 Lessons Learned from Bank Stress Test

Appendix I: Objectives, Scope, and
Methodology
Table 8: Crosswalk of Y-9C Net Charge-Offs and Asset Classifications to Classifications Used by SCAP
Classification used in GAO analysis
Y-9C classification Overall category Primary category Sub-category
1. Loans secured by real estate
a. Construction, land development, and other land loans in domestic offices:
(1) One to four family residential construction loans Commercial real estate
Commercial real estate
Construction
(2) Other construction loans and all land development and other land loans
Commercial real estate
Commercial real estate
Construction
b. Secured by farmland in domestic offices Other Other loans n/a
c. Secured by one to four family residential properties in domestic offices:
(1) Revolving, open-end loans secured by one to four family residential properties under lines of credit
Second/junior lien Second/junior lien Home equity line of credit
(2) Closed-end loans secured by one to four family residential properties in domestic offices:
(a) Secured by first liens First lien First lien n/a
(b) Secured by junior liens Second/junior lien Second/junior lien Closed-end junior liens
d. Secured by mutlifamily (five or more) residential properties in domestic offices
Commercial real estate
Commercial real estate
Multifamily
e. Secured by nonfarm nonresidential properties in domestic offices:
(1) Loans secured by owner-occupied nonfarm nonresidential properties
Commercial real estate
Commercial real estate
Nonfarm, nonresidential
(2) Loans secured by other nonfarm nonresidential properties
Commercial real estate
Commercial real estate
Nonfarm, nonresidential
f. In foreign offices Other Other loans n/a
2. Loans to depository institutions and acceptances of other banks:
a. To U.S. banks and other U.S. depository institutions Other Other loans n/a
b. To foreign banks Other Other loans n/a
3. Loans to finance agricultural production and other loans to farmers
Other Other loans n/a
4. Commercial and industrial loans:
a. To U.S. addresses (domicile) Commercial and industrial
Commercial and industrial
n/a
b. To non-U.S. addresses (domicile) Commercial and industrial
Commercial and industrial
n/a
5. Loans to individuals for household, family, and other personal expenditures
Page 68 GAO-10-861 Lessons Learned from Bank Stress Test

Appendix I: Objectives, Scope, and
Methodology
Classification used in GAO analysis
Y-9C classification Overall category Primary category Sub-category
a. Credit cards Credit cards Credit cards n/a
b. Other (includes single payment, installment, all student loans, and revolving credit plans other than credit cards)
Other Other consumer n/a
6. Loans to foreign governments and official institutions Other Other loans n/a
7. All other loans Other Other loans n/a
8. Lease financing receivables:
a. Leases to individuals for household, family, and other personal expenditures
Other Other consumer n/a
b. All other leases Other Other loans n/a
Source: Federal Reserve 2009 Schedule HI-B of the Y-9C.
Note: N/a means not applicable.
To ensure additional comparability with SCAP, we attempted to identify any unique circumstances that could skew the results. For example, after we shared our initial tracking estimates with the 19 BHCs, one BHC had identified an issue with our calculation of tier 1 common capital that resulted from the way information is reported on the Y-9C. After discussing the issue with the BHC and verifying their explanation, we adjusted our calculation to more accurately reflect their position. Another BHC also had a one-time charge that had been included in the “Other” loss category, and we decided to segregate this item as a separate line item. We have also submitted our tracking spreadsheet to the Federal Reserve and to each BHC to give them an opportunity to provide input and ensure the accuracy and comparability of our numbers. Appropriate adjustments to 2009 numbers based on information received from the Federal Reserve and individual BHCs are noted, where applicable, in the tables in appendix III.
Some items that impact precise comparisons between actual results and the pro rata estimates are disclosed in our footnotes, rather than as adjustments to our calculations. For example, the stress test was applied to loan and other asset portfolios as of December 31, 2008, without including a calculation for ongoing banking activities. Because the Y-9C data includes ongoing activity as of the date of the report, the actual results are slightly different than the performance of the stressed assets as the BHCs were treated as liquidating concerns rather than going concerns in the SCAP stress test. Distinguishing between the gains (losses) from legacy assets and those that resulted from new assets is not possible using public data. Other examples are that SCAP did not include the impact of the owned debt value adjustment or one-time items (occurring subsequent
Page 69 GAO-10-861 Lessons Learned from Bank Stress Test
Appendix I: Objectives, Scope, and
Methodology
to SCAP) in their projections of PPNR.8 As credit default swap spreads narrowed in 2009,9 liability values increased at most banks, causing a negative impact on revenue at those banks that chose to account for their debt at fair value; but these losses were not included in the SCAP estimates. One-time items, such as sales of business lines, were also not included in the SCAP estimates of PPNR, as these events occurred subsequent to the stress test and, in part, could not be fully predicted as a part of SCAP. Rather than remove the losses from the owned debt value adjustments and the gains (or losses) due to one-time items from the BHCs’ 2009 PPNR results, we disclosed the amounts in footnotes for the applicable BHCs. We chose this treatment so that PPNR would reflect actual results at the BHCs, while still disclosing the adjustments needed for more precise comparability to SCAP.
We identified the TARP status of each of the 19 BHCs that participated in SCAP by reviewing data from the Treasury’s Office of Financial Stability’s TARP Transactions Report for the Period Ending September 22, 2010 (TARP Transactions Report) and the SCAP results document. We used the SCAP results document to identify BHCs that were required to raise capital. The TARP Transactions Report, was then used to identify the program under which TARP funds were received (if any), the amount of funds received, capital repayment date, amount repaid, and warrant disposition date and to determine whether the warrants were repurchased or sold by Treasury in a public offering.
To gain a better understanding of future potential losses, we determined the percentage of BHCs’ total loans that are either nonaccrual or more
8The owned debt value adjustment is an adjustment made to BHC financial statements if the BHC chose to value its own debt on a mark-to-market basis rather than book value. As the BHC’s debt becomes cheaper, this creates a positive impact on its financial statements, while, as seen in 2009, the debt becomes more expensive, it has a negative impact on the BHC’s financial statements.
9A credit default swap spread is one measure of investors’ confidence in the banking sector. It is an agreement in which a buyer pays a periodic fee to a seller, in exchange for protection from certain credit events such as bankruptcy, failure to pay debt obligations, or a restructuring related to a specific debt issuer or issues known as the reference entity. Therefore, the credit default swap spread, or market price, is a measure of the credit risk of the reference entity, with a higher spread indicating a greater amount of credit risk. When the markets’ perception of the reference entity’s credit risk deteriorates or improves, the spread generally will widen or tighten, respectively.
Page 70 GAO-10-861 Lessons Learned from Bank Stress Test

Appendix I: Objectives, Scope, and
Methodology
than 90 days past due using Y-9C data from the SNL Financial database.10 We used quarterly data for the period 2007 through 2009 on nonaccrual loans and past due balances of more than 90 days, for each of the BHCs. We aggregated the data into the same six loan categories used in SCAP: first-lien mortgages, second/junior-lien mortgages, commercial and industrial loans, commercial real estate loans, credit card balances, and “Other.” (See tables 8 and 9 for details.) Once the data were aggregated, we divided that data by the applicable total loan balance for each category at each point in time (i.e., quarterly basis). One limitation is that Y-9C data were not available for all periods for four of the BHCs (American Express Company; GMAC LLC; The Goldman Sachs Group, Inc.; and Morgan Stanley) because they had recently became BHCs.11 As a result, we did not include these BHCs in the calculation during those periods where their Y-9Cs were not available (fourth quarter of 2008 and earlier for all except GMAC LLC, which also did not have a Y-9C in the first quarter of 2009).
We collected Y-9C data from the SNL Financial database to calculate the loan loss rates across BHCs with more than $1 billion of assets and compare the 19 BHCs with the indicative loss rates provided by the SCAP regulators. We used annual data for the year ended December 31, 2009, on loan charge-offs. We also used average total loan balances. In the Y-9C total loan balances were categorized somewhat differently from charge-offs. Table 9 provides a crosswalk for the asset classification. We aggregated loan balance data into the same categories that were used in the indicative loss rate table in SCAP: first-lien mortgages, prime mortgages, Alt-A mortgages, subprime mortgages, second/junior lien mortgages, closed-end junior liens, home equity lines of credit, commercial and industrial loans, commercial real estate loans, construction loans, multifamily loans, nonfarm nonresidential loans, credit card balances, other consumer, and other loans. Once the data were aggregated into these categories, we divided the net charge-offs by the
10Nonperforming loans represent the total of loans that are either 90 plus days past due or in nonaccrual status. As defined by the instructions to the Y-9C, an asset is in nonaccrual status if: (1) it is maintained on a cash basis because of deterioration in the financial condition of the borrower, (2) payment in full of principal or interest is not expected, or (3) principal or interest as been in default for a period of 90 days or more unless the asset is both well secured and in the process of collection. Per the Y-9C instructions, an asset is 90 plus days past due if payment is due and unpaid for 90 days or more, and if that asset is not in nonaccrual status.
11The Goldman Sachs Group, Inc. and Morgan Stanley were approved by the Federal Reserve to become BHCs on September 22, 2008; American Express Company was approved on November 10, 2008; and GMAC LLC was approved on December 24, 2008.
Page 71 GAO-10-861 Lessons Learned from Bank Stress Test

Appendix I: Objectives, Scope, and
Methodology
applicable average loan balance. This calculation showed the loss rate for each category (e.g., first-lien mortgages and commercial real estate) for the year ended December 31, 2009. This methodology was applied to calculate the loss rates for the 19 SCAP BHCs and all BHCs with more than $1 billion of assets, respectively. Because those institutions had recently converted to being BHCs, Y-9C data on loan balances was not available for the fourth quarter of 2008 for American Express Company; The Goldman Sachs Group, Inc.; and Morgan Stanley, and was not available for GMAC LLC for both the first quarter of 2009 and the fourth quarter of 2008. Therefore, we approximated the loan balances in these periods for GMAC LLC and American Express Company based on their Form 10-Q for these time periods. Because The Goldman Sachs Group, Inc. and Morgan Stanley have considerably smaller loan balances, in general, than the other BHCs; the fourth quarter of 2008 balance was not approximated for these BHCs. Instead, the average loan balance was simply based on the available data (e.g., first quarter of 2009 through fourth quarter of 2009).
Table 9: Crosswalk of Y-9C Loans and Lease Financing Receivables to and Classifications used by SCAP
Classification used in GAO analysis
Y-9C classification Overall
category Primary category Sub-category
1. Loans secured by real estate
a. Construction, land development, and other land loans in domestic offices:
(1) One to four family residential construction loans Commercial real estate
Commercial real estate
Construction
(2) Other construction loans and all land development and other land loans
Commercial real estate
Commercial real estate
Construction
b. Secured by farmland Other Other loans n/a
c. Secured by one to four family residential properties:
(1) Revolving, open-end loans secured by one to four family residential properties and extended under lines of credit
Second/junior lien
Second/junior lien Home equity lines of credit
(2) Closed-end loans secured by one to four family residential properties:
(a) Secured by first liens First lien First lien n/a
(b) Secured by junior liens Second/junior lien
Second/junior lien Closed-end junior liens
d. Secured by mutlifamily (five or more) residential properties Commercial real estate
Commercial real estate
Multifamily
e. Secured by nonfarm nonresidential properties:
(1) Loans secured by owner-occupied nonfarm nonresidential properties
Commercial real estate
Commercial real estate
Nonfarm, nonresidential
Page 72 GAO-10-861 Lessons Learned from Bank Stress Test
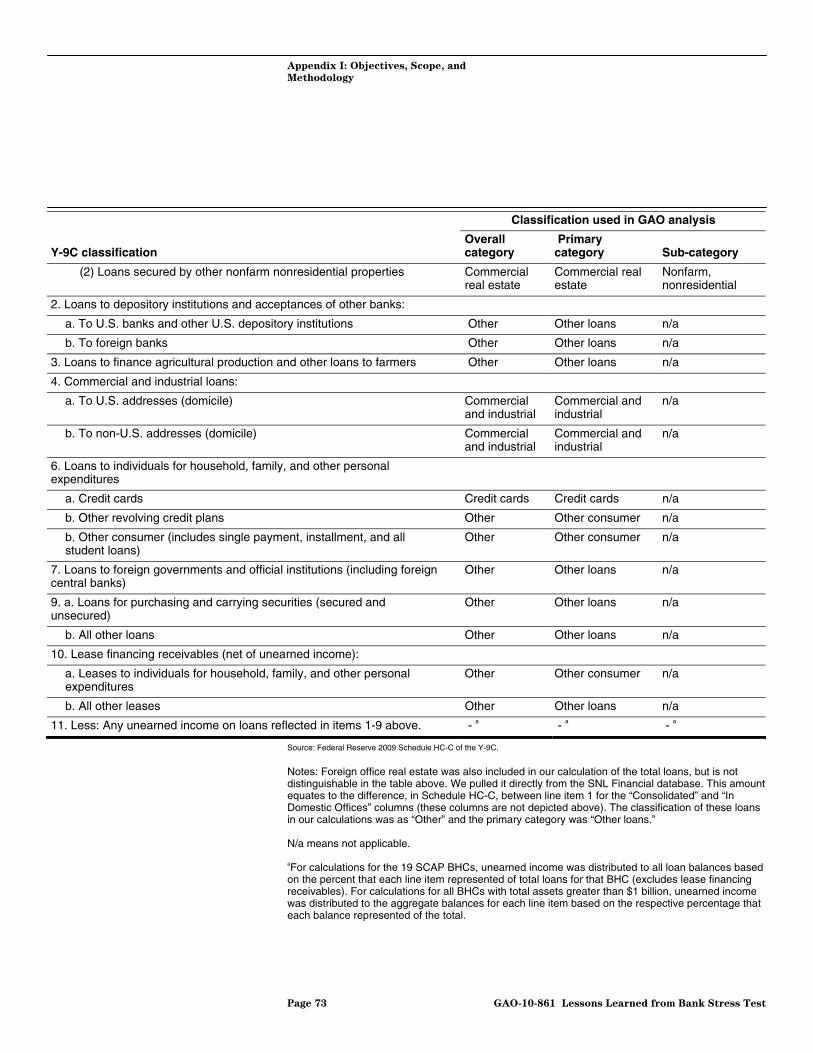
Appendix I: Objectives, Scope, and
Methodology
Classification used in GAO analysis
Y-9C classification Overall
category Primary category Sub-category
(2) Loans secured by other nonfarm nonresidential properties Commercial real estate
Commercial real estate
Nonfarm, nonresidential
2. Loans to depository institutions and acceptances of other banks:
a. To U.S. banks and other U.S. depository institutions Other Other loans n/a
b. To foreign banks Other Other loans n/a
3. Loans to finance agricultural production and other loans to farmers Other Other loans n/a
4. Commercial and industrial loans:
a. To U.S. addresses (domicile) Commercial and industrial
Commercial and industrial
n/a
b. To non-U.S. addresses (domicile) Commercial and industrial
Commercial and industrial
n/a
6. Loans to individuals for household, family, and other personal expenditures
a. Credit cards Credit cards Credit cards n/a
b. Other revolving credit plans Other Other consumer n/a
b. Other consumer (includes single payment, installment, and all student loans)
Other Other consumer n/a
7. Loans to foreign governments and official institutions (including foreign central banks)
Other Other loans n/a
9. a. Loans for purchasing and carrying securities (secured and unsecured)
Other Other loans n/a
b. All other loans Other Other loans n/a
10. Lease financing receivables (net of unearned income):
a. Leases to individuals for household, family, and other personal expenditures
Other Other consumer n/a
b. All other leases Other Other loans n/a
11. Less: Any unearned income on loans reflected in items 1-9 above. - a - a - a
Source: Federal Reserve 2009 Schedule HC-C of the Y-9C.
Notes: Foreign office real estate was also included in our calculation of the total loans, but is not distinguishable in the table above. We pulled it directly from the SNL Financial database. This amount equates to the difference, in Schedule HC-C, between line item 1 for the “Consolidated” and “In Domestic Offices” columns (these columns are not depicted above). The classification of these loans in our calculations was as “Other” and the primary category was “Other loans.” N/a means not applicable. aFor calculations for the 19 SCAP BHCs, unearned income was distributed to all loan balances based on the percent that each line item represented of total loans for that BHC (excludes lease financing receivables). For calculations for all BHCs with total assets greater than $1 billion, unearned income was distributed to the aggregate balances for each line item based on the respective percentage that each balance represented of the total.
Page 73 GAO-10-861 Lessons Learned from Bank Stress Test
Appendix I: Objectives, Scope, and
Methodology
We conducted this performance audit from August 2009 to September 2010 in accordance with generally accepted government auditing standards. Those standards require that we plan and perform the audit to obtain sufficient, appropriate evidence to provide a reasonable basis for our findings and conclusions based on our audit objectives. We believe that the evidence obtained provides a reasonable basis for our findings and conclusions based on our audit objectives.
Page 74 GAO-10-861 Lessons Learned from Bank Stress Test
Appendix II: Status of Bank Holding
Companies’ TARP Investments as September
22, 2010
Appendix II: Status of Bank Holding Companies’ TARP Investments as September 22, 2010
Twelve of the 19 bank holding companies (BHC) that participated in the Supervisory Capital Assessment Program (SCAP) had redeemed their Troubled Asset Relief Program (TARP) investments and had their warrants disposed of as of September 22, 2010, and most of them were not required to raise capital under SCAP (table 10). Six of the 19 BHCs tested under SCAP have not repaid TARP investments or disposed of warrants, and one, MetLife, Inc., did not receive any TARP investments. BHCs participating in SCAP must follow specific criteria to repay TARP funds. In approving applications from participating banks that want to repay TARP funds, the Federal Reserve considers various factors. Some of these factors1 include whether the banks can demonstrate an ability to access the long-term debt market without relying on the Federal Deposit Insurance Corporation’s (FDIC) Temporary Liquidity Guarantee Program and whether they can successfully access the public equity markets, remain in a position to facilitate lending, and maintain capital levels in accord with supervisory expectations.2 BHCs intending to repay TARP investments must have post repayment capital ratios that meet or exceed SCAP requirements.
1See Federal Reserve’s June 1, 2009, press release that sets forth the criteria that SCAP BHCs must meet before they can pay back their TARP investments.
2FDIC created this facility in November 2008 to encourage liquidity in the banking system by guaranteeing newly issued senior unsecured debt of banks, thrifts, and certain holding companies and by providing full coverage of noninterest-bearing deposit transaction accounts. The facility is scheduled to end in 2010.
Page 75 GAO-10-861 Lessons Learned from Bank Stress Test
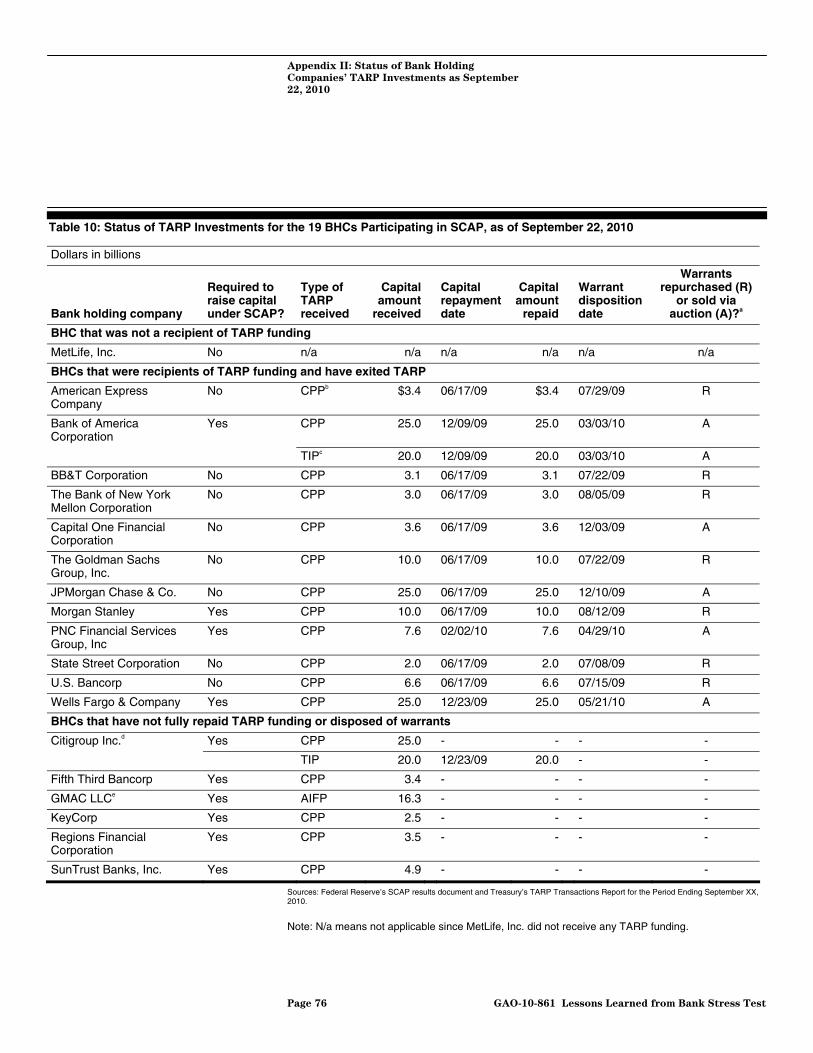
Appendix II: Status of Bank Holding
Companies’ TARP Investments as September
22, 2010
Table 10: Status of TARP Investments for the 19 BHCs Participating in SCAP, as of September 22, 2010
Dollars in billions
Bank holding company
Required to raise capital under SCAP?
Type of TARP received
Capital amount
received
Capital repayment date
Capitalamount
repaid
Warrant disposition date
Warrants repurchased (R)
or sold via auction (A)?a
BHC that was not a recipient of TARP funding
MetLife, Inc. No n/a n/a n/a n/a n/a n/a
BHCs that were recipients of TARP funding and have exited TARP
American Express Company
No CPPb $3.4 06/17/09 $3.4 07/29/09 R
Bank of America Corporation
Yes CPP 25.0 12/09/09 25.0 03/03/10 A
TIPc 20.0 12/09/09 20.0 03/03/10 A
BB&T Corporation No CPP 3.1 06/17/09 3.1 07/22/09 R
The Bank of New York Mellon Corporation
No CPP 3.0 06/17/09 3.0 08/05/09 R
Capital One Financial Corporation
No CPP 3.6 06/17/09 3.6 12/03/09 A
The Goldman Sachs Group, Inc.
No CPP 10.0 06/17/09 10.0 07/22/09 R
JPMorgan Chase & Co. No CPP 25.0 06/17/09 25.0 12/10/09 A
Morgan Stanley Yes CPP 10.0 06/17/09 10.0 08/12/09 R
PNC Financial Services Group, Inc
Yes CPP 7.6 02/02/10 7.6 04/29/10 A
State Street Corporation No CPP 2.0 06/17/09 2.0 07/08/09 R
U.S. Bancorp No CPP 6.6 06/17/09 6.6 07/15/09 R
Wells Fargo & Company Yes CPP 25.0 12/23/09 25.0 05/21/10 A
BHCs that have not fully repaid TARP funding or disposed of warrants
Citigroup Inc.d Yes CPP 25.0 - - - -
TIP 20.0 12/23/09 20.0 - -
Fifth Third Bancorp Yes CPP 3.4 - - - -
GMAC LLCe Yes AIFP 16.3 - - - -
KeyCorp Yes CPP 2.5 - - - -
Regions Financial Corporation
Yes CPP 3.5 - - - -
SunTrust Banks, Inc. Yes CPP 4.9 - - - -
Sources: Federal Reserve’s SCAP results document and Treasury’s TARP Transactions Report for the Period Ending September XX, 2010.
Note: N/a means not applicable since MetLife, Inc. did not receive any TARP funding.
Page 76 GAO-10-861 Lessons Learned from Bank Stress Test
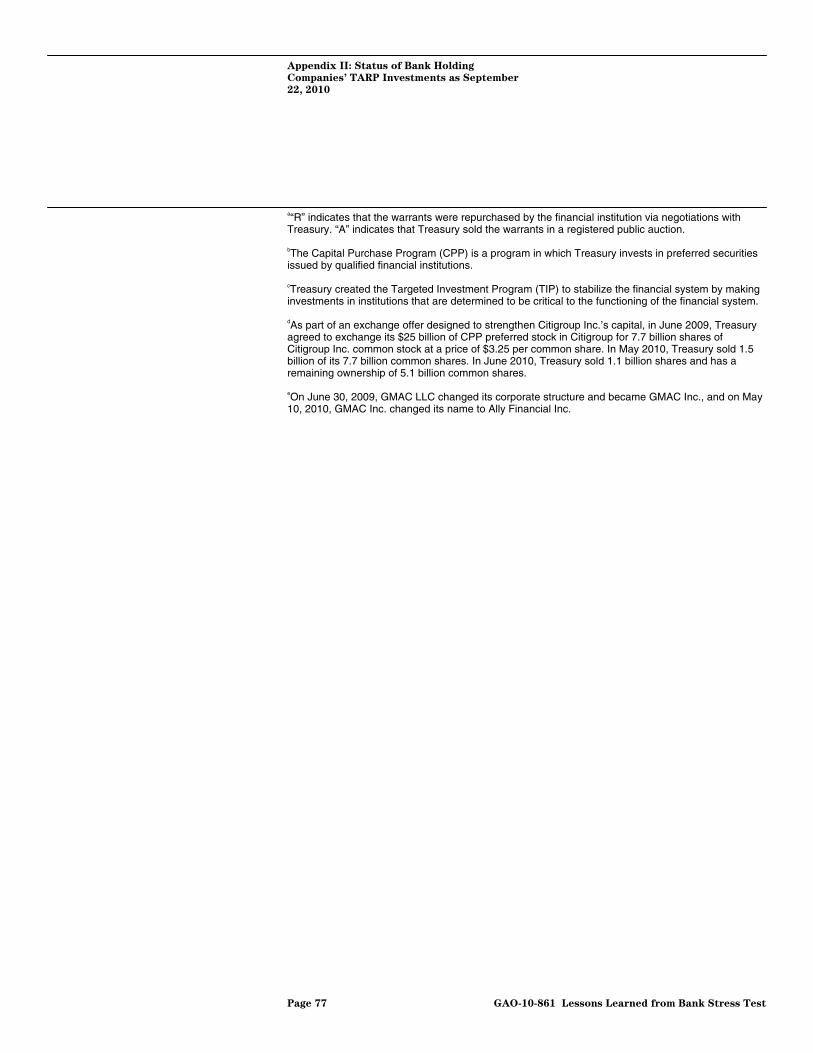
Appendix II: Status of Bank Holding
Companies’ TARP Investments as September
22, 2010
a“R” indicates that the warrants were repurchased by the financial institution via negotiations with Treasury. “A” indicates that Treasury sold the warrants in a registered public auction. bThe Capital Purchase Program (CPP) is a program in which Treasury invests in preferred securities issued by qualified financial institutions. cTreasury created the Targeted Investment Program (TIP) to stabilize the financial system by making investments in institutions that are determined to be critical to the functioning of the financial system. dAs part of an exchange offer designed to strengthen Citigroup Inc.’s capital, in June 2009, Treasury agreed to exchange its $25 billion of CPP preferred stock in Citigroup for 7.7 billion shares of Citigroup Inc. common stock at a price of $3.25 per common share. In May 2010, Treasury sold 1.5 billion of its 7.7 billion common shares. In June 2010, Treasury sold 1.1 billion shares and has a remaining ownership of 5.1 billion common shares. eOn June 30, 2009, GMAC LLC changed its corporate structure and became GMAC Inc., and on May 10, 2010, GMAC Inc. changed its name to Ally Financial Inc.
Page 77 GAO-10-861 Lessons Learned from Bank Stress Test
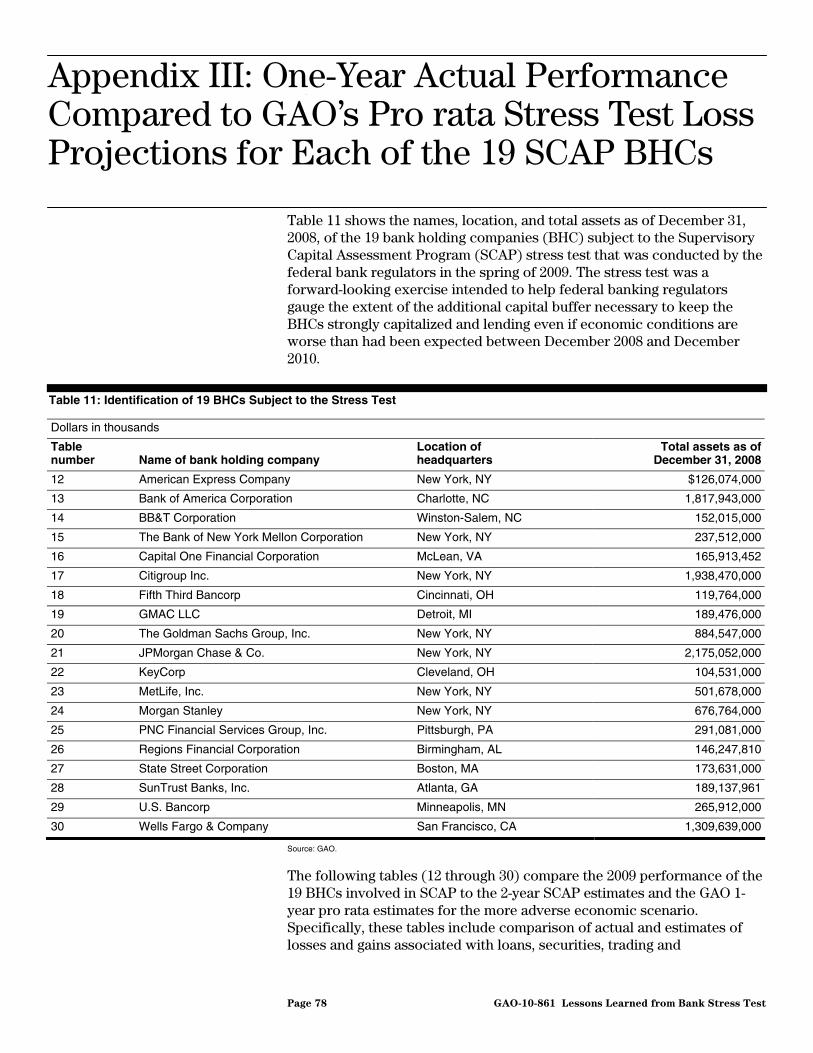
Appendix III: One-Year Actual Performance
Compared to GAO’s Pro rata Stress Test Loss
Projections for Each of the 19 SCAP BHCs
Appendix III: One-Year Actual Performance Compared to GAO’s Pro rata Stress Test Loss Projections for Each of the 19 SCAP BHCs
Table 11 shows the names, location, and total assets as of December 31, 2008, of the 19 bank holding companies (BHC) subject to the Supervisory Capital Assessment Program (SCAP) stress test that was conducted by the federal bank regulators in the spring of 2009. The stress test was a forward-looking exercise intended to help federal banking regulators gauge the extent of the additional capital buffer necessary to keep the BHCs strongly capitalized and lending even if economic conditions are worse than had been expected between December 2008 and December 2010.
Table 11: Identification of 19 BHCs Subject to the Stress Test
Dollars in thousands
Table number Name of bank holding company
Location of headquarters
Total assets as of December 31, 2008
12 American Express Company New York, NY $126,074,000
13 Bank of America Corporation Charlotte, NC 1,817,943,000
14 BB&T Corporation Winston-Salem, NC 152,015,000
15 The Bank of New York Mellon Corporation New York, NY 237,512,000
16 Capital One Financial Corporation McLean, VA 165,913,452
17 Citigroup Inc. New York, NY 1,938,470,000
18 Fifth Third Bancorp Cincinnati, OH 119,764,000
19 GMAC LLC Detroit, MI 189,476,000
20 The Goldman Sachs Group, Inc. New York, NY 884,547,000
21 JPMorgan Chase & Co. New York, NY 2,175,052,000
22 KeyCorp Cleveland, OH 104,531,000
23 MetLife, Inc. New York, NY 501,678,000
24 Morgan Stanley New York, NY 676,764,000
25 PNC Financial Services Group, Inc. Pittsburgh, PA 291,081,000
26 Regions Financial Corporation Birmingham, AL 146,247,810
27 State Street Corporation Boston, MA 173,631,000
28 SunTrust Banks, Inc. Atlanta, GA 189,137,961
29 U.S. Bancorp Minneapolis, MN 265,912,000
30 Wells Fargo & Company San Francisco, CA 1,309,639,000
Source: GAO.
The following tables (12 through 30) compare the 2009 performance of the 19 BHCs involved in SCAP to the 2-year SCAP estimates and the GAO 1-year pro rata estimates for the more adverse economic scenario. Specifically, these tables include comparison of actual and estimates of losses and gains associated with loans, securities, trading and
Page 78 GAO-10-861 Lessons Learned from Bank Stress Test

Appendix III: One-Year Actual Performance
Compared to GAO’s Pro rata Stress Test Loss
Projections for Each of the 19 SCAP BHCs
counterparty, resources, preprovision net revenue (PPNR), and allowance for loan and lease losses (ALLL). These tables also include a comparison of actual capital levels at December 31, 2009, and December 31, 2008. Totals may not add due to rounding. For a more detailed explanation of the calculations made in constructing this analysis, see appendix I.
Page 79 GAO-10-861 Lessons Learned from Bank Stress Test
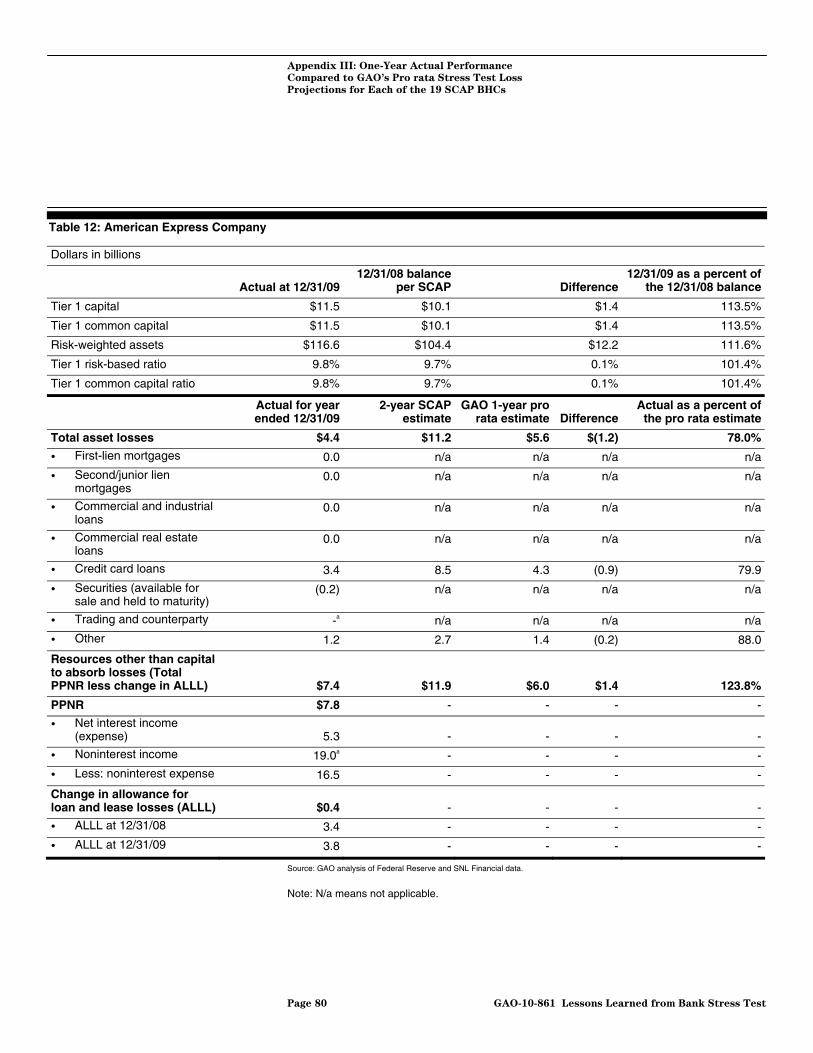
Appendix III: One-Year Actual Performance
Compared to GAO’s Pro rata Stress Test Loss
Projections for Each of the 19 SCAP BHCs
Table 12: American Express Company
Dollars in billions
Actual at 12/31/09
12/31/08 balance per SCAP Difference
12/31/09 as a percent of the 12/31/08 balance
Tier 1 capital $11.5 $10.1 $1.4 113.5%
Tier 1 common capital $11.5 $10.1 $1.4 113.5%
Risk-weighted assets $116.6 $104.4 $12.2 111.6%
Tier 1 risk-based ratio 9.8% 9.7% 0.1% 101.4%
Tier 1 common capital ratio 9.8% 9.7% 0.1% 101.4%
Actual for year ended 12/31/09
2-year SCAP estimate
GAO 1-year prorata estimate Difference
Actual as a percent of the pro rata estimate
Total asset losses $4.4 $11.2 $5.6 $(1.2) 78.0%
• First-lien mortgages 0.0 n/a n/a n/a n/a
• Second/junior lien mortgages
0.0 n/a n/a n/a n/a
• Commercial and industrial loans
0.0 n/a n/a n/a n/a
• Commercial real estate loans
0.0 n/a n/a n/a n/a
• Credit card loans 3.4 8.5 4.3 (0.9) 79.9
• Securities (available for sale and held to maturity)
(0.2) n/a n/a n/a n/a
• Trading and counterparty -a n/a n/a n/a n/a
• Other 1.2 2.7 1.4 (0.2) 88.0
Resources other than capital to absorb losses (Total PPNR less change in ALLL) $7.4 $11.9 $6.0 $1.4 123.8%
PPNR $7.8 - - - -
• Net interest income (expense) 5.3 - - - -
• Noninterest income 19.0a - - - -
• Less: noninterest expense 16.5 - - - -
Change in allowance for loan and lease losses (ALLL) $0.4 - - - -
• ALLL at 12/31/08 3.4 - - - -
• ALLL at 12/31/09 3.8 - - - -
Source: GAO analysis of Federal Reserve and SNL Financial data.
Note: N/a means not applicable.
Page 80 GAO-10-861 Lessons Learned from Bank Stress Test

Appendix III: One-Year Actual Performance
Compared to GAO’s Pro rata Stress Test Loss
Projections for Each of the 19 SCAP BHCs
aTrading and counterparty positions were not stressed because the total portfolio is less than the $100 billion required for stress testing in SCAP, but trading (gain) loss information for this BHC was included in the “trading revenue” line of Schedule HI of the Y-9C in 2009. In SCAP, the projections of trading gains or losses for this BHC were included in the estimate of PPNR rather than the trading and counterparty line. Therefore, we have included the actual trading results in PPNR (specifically noninterest income).
Page 81 GAO-10-861 Lessons Learned from Bank Stress Test
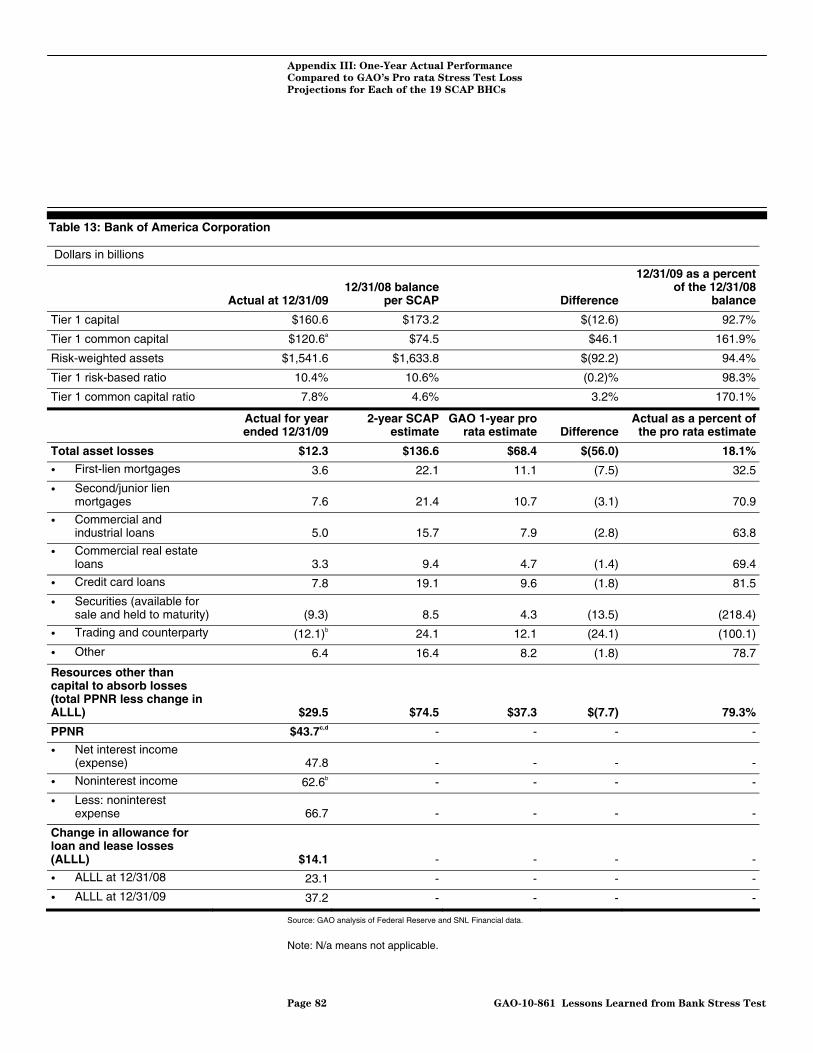
Appendix III: One-Year Actual Performance
Compared to GAO’s Pro rata Stress Test Loss
Projections for Each of the 19 SCAP BHCs
Table 13: Bank of America Corporation
Dollars in billions
Actual at 12/31/0912/31/08 balance
per SCAP Difference
12/31/09 as a percent of the 12/31/08
balance
Tier 1 capital $160.6 $173.2 $(12.6) 92.7%
Tier 1 common capital $120.6a $74.5 $46.1 161.9%
Risk-weighted assets $1,541.6 $1,633.8 $(92.2) 94.4%
Tier 1 risk-based ratio 10.4% 10.6% (0.2)% 98.3%
Tier 1 common capital ratio 7.8% 4.6% 3.2% 170.1%
Actual for year ended 12/31/09
2-year SCAP estimate
GAO 1-year pro rata estimate Difference
Actual as a percent of the pro rata estimate
Total asset losses $12.3 $136.6 $68.4 $(56.0) 18.1%
• First-lien mortgages 3.6 22.1 11.1 (7.5) 32.5
• Second/junior lien mortgages 7.6 21.4 10.7 (3.1) 70.9
• Commercial and industrial loans 5.0 15.7 7.9 (2.8) 63.8
• Commercial real estate loans 3.3 9.4 4.7 (1.4) 69.4
• Credit card loans 7.8 19.1 9.6 (1.8) 81.5
• Securities (available for sale and held to maturity) (9.3) 8.5 4.3 (13.5) (218.4)
• Trading and counterparty (12.1)b 24.1 12.1 (24.1) (100.1)
• Other 6.4 16.4 8.2 (1.8) 78.7
Resources other than capital to absorb losses (total PPNR less change in ALLL) $29.5 $74.5 $37.3 $(7.7) 79.3%
PPNR $43.7c,d - - - -
• Net interest income (expense) 47.8 - - - -
• Noninterest income 62.6b - - - -
• Less: noninterest expense 66.7 - - - -
Change in allowance for loan and lease losses (ALLL) $14.1 - - - -
• ALLL at 12/31/08 23.1 - - - -
• ALLL at 12/31/09 37.2 - - - -
Source: GAO analysis of Federal Reserve and SNL Financial data.
Note: N/a means not applicable.
Page 82 GAO-10-861 Lessons Learned from Bank Stress Test
Appendix III: One-Year Actual Performance
Compared to GAO’s Pro rata Stress Test Loss
Projections for Each of the 19 SCAP BHCs
aTier 1 common capital includes $19.29 billion of common equivalent securities (CES) issued in December 2009. As described in Bank of America Corporation’s (Bank of America) Form 10-K for the year ended December 31, 2009, CES are included in tier 1 common capital based upon applicable regulatory guidance and the expectation that the underlying securities would convert to common stock following shareholder approval of additional authorized shares. Shareholders approved the increase in the number of authorized shares of common stock at the special meeting of shareholders held on February 23, 2010, and the CES converted to common stock on February 24, 2010. bThe trading and counterparty data in the Y-9C includes both customer derived revenue from transactions for BHCs that operate as broker-dealers as well as gains and losses from proprietary trading and associated expenses. These items are presented in net form only in the Y-9C. For the five BHCs that had their trading portfolios stressed (including Bank of America), the trading and counterparty line is based on projections of (gains) losses from proprietary trading, but PPNR (specifically noninterest revenue) included projections of gains (losses) from customer derived revenue from transactions due to operations as a broker-dealer. Because we could not segregate these items based on the Y-9C, we have included the net amount in the trading and counterparty and noninterest income line items above. As a result of this limitation, the net amount of the trading gains or losses and PNNR in the table may be overstated or understated. cPPNR includes an owned debt value adjustment of ($4.80) billion, which was not stressed in SCAP. As Bank of America’s credit spreads narrowed during 2009, this caused the liability values to increase. This offsets the gains Bank of America experienced in 2008 when its credit spreads widened. dPPNR includes one-time items totaling $4.90 billion, which were not included in SCAP.
Page 83 GAO-10-861 Lessons Learned from Bank Stress Test

Appendix III: One-Year Actual Performance
Compared to GAO’s Pro rata Stress Test Loss
Projections for Each of the 19 SCAP BHCs
Table 14: BB&T Corporation
Dollars in billions
Actual at 12/31/0912/31/08 balance
per SCAP Difference
12/31/09 as a percent of the 12/31/08
balance
Tier 1 capital $13.5 $13.4 $0.1 100.4%
Tier 1 common capital $10.0 $7.8 $2.2 127.7%
Risk-weighted assets $117.2 $109.8 $7.4 106.7%
Tier 1 risk-based ratio 11.5% 12.3% (0.8)% 93.4%
Tier 1 common capital ratio 8.5% 7.1% 1.4% 119.7%
Actual for year ended 12/31/09
2-year SCAP estimate
GAO 1-year pro rata estimate Difference
Actual as a percent of the pro rata estimate
Total asset losses $1.6 $8.7 $4.4 $(2.8) 36.2%
• First-lien mortgages 0.3 1.1 0.6 (0.3) 47.8
• Second/junior lien mortgages 0.1 0.7 0.4 (0.2) 40.9
• Commercial and industrial loans 0.2 0.7 0.4 (0.2) 56.5
• Commercial real estate loans 0.7 4.5 2.3 (1.5) 32.3
• Credit card loans 0.1 0.2 0.1 (0.0) 81.6
• Securities (available for sale and held to maturity) (0.2) 0.2 0.1 (0.3) -199.3
• Trading and counterparty -a n/a n/a - -
• Other 0.4 1.3 0.7 (0.3) 55.6
Resources other than capital to absorb losses (total PPNR less change in ALLL) $2.6 $5.5 $2.8 $(0.1) 94.9%
PPNR $3.6 - - - -
• Net interest income (expense) 4.8 - - - -
• Noninterest income 3.5a - - - -
• Less: noninterest expense 4.7 - - - -
Change in allowance for loan and lease losses (ALLL) $1.0 - - - -
• ALLL at 12/31/08 1.6 - - - -
• ALLL at 12/31/09 2.6 - - - -
Source: GAO analysis of Federal Reserve and SNL Financial data.
Note: N/a means not applicable.
Page 84 GAO-10-861 Lessons Learned from Bank Stress Test
Appendix III: One-Year Actual Performance
Compared to GAO’s Pro rata Stress Test Loss
Projections for Each of the 19 SCAP BHCs
On August 14, 2009, BB&T Corporation (BB&T) entered into a purchase and assumption agreement with the Federal Deposit Insurance Corporation (FDIC) to acquire certain assets and assume substantially all of the deposits and certain liabilities of Colonial Bank, an Alabama state-chartered bank headquartered in Montgomery, Alabama. As further discussed in BB&T’s Form 10-K for the year ended December 31, 2009, BB&T entered into loss sharing agreements with the FDIC related to certain loans, securities, and other assets. The actual results include BB&T’s performance including the Colonial Bank acquisition. aTrading and counterparty positions were not stressed because the total portfolio is less than the $100 billion required for stress testing in SCAP, but trading (gain) loss information for this BHC was included in the “trading revenue” line of Schedule HI of the Y-9C in 2009. In SCAP, the projections of trading gains or losses for this BHC were included in the estimate of PPNR rather than the trading and counterparty line. Therefore, we have included the actual trading results in PPNR (specifically noninterest income).
Page 85 GAO-10-861 Lessons Learned from Bank Stress Test

Appendix III: One-Year Actual Performance
Compared to GAO’s Pro rata Stress Test Loss
Projections for Each of the 19 SCAP BHCs
Table 15: The Bank of New York Mellon Corporation
Dollars in billions
12/31/09 as a percent of the 12/31/08
balance
12/31/08 balance
per SCAP Actual at 12/31/09 Difference
Tier 1 capital $12.9 $15.4 $(2.5) 83.7%
Tier 1 common capital $11.2 $11.0 $0.2 101.8%
Risk-weighted assets $106.3 $115.8 $(9.5) 91.8%
Tier 1 risk-based ratio 12.1% 13.3% (1.2)% 91.1%
Tier 1 common capital ratio 10.5% 9.5% 1.0% 110.8%
Actual for year ended 12/31/09
2-year SCAP estimate
GAO 1-year pro rata estimate Difference
Actual as a percent of the pro rata estimate
Total asset losses $5.6 $5.4 $2.7 $2.9 207.6%
• First-lien mortgages 0.1 0.2 0.1 (0.0) 60.0
• Second/junior lien mortgages 0.0 n/a n/a
• Commercial and industrial loans 0.1 0.4 0.2 (0.1) 45.0
• Commercial real estate loans 0.1 0.2 0.1 (0.1) 50.0
• Credit card loans 0.0 n/a n/a
• Securities (available for sale and held to maturity) 5.4a 4.2 2.1 3.3 255.7
• Trading and counterparty -b n/a n/a
• Other 0.0 0.4 0.2 (0.2) 17.0
Resources other than capital to absorb losses (total PPNR less change in ALLL): $3.4 $6.7 $3.4 $(0.0) 100.2%
PPNR $3.5 - - - -
• Net interest income (expense) 2.9 - - - -
• Noninterest income 10.1b - - - -
• Less: noninterest expense 9.6 - - - -
Change in allowance for loan and lease losses (ALLL) $0.1 - - - -
• ALLL at 12/31/08 .4 - - - -
• ALLL at 12/31/09 .5 - - - -
Source: GAO analysis of Federal Reserve and SNL Financial data. Note: N/a means not applicable.
Page 86 GAO-10-861 Lessons Learned from Bank Stress Test

Appendix III: One-Year Actual Performance
Compared to GAO’s Pro rata Stress Test Loss
Projections for Each of the 19 SCAP BHCs
aBased on discussions with Bank of New York Mellon Corporation (Bank of New York Mellon) officials, the company’s securities portfolio underwent a significant restructuring in the third quarter of 2009 in order to de-risk this portfolio, causing the recognition of significant losses in that period. However, The Bank of New York Mellon sold off many of its riskiest holdings in that period, including many Alt-A residential mortgage-backed securities, so that it expects to see gains in this portfolio in the future, causing the final 2-year loss amount to be less than the amount projected under SCAP in the securities (available for sale and held to maturity) portfolio. See the Bank of New York Mellon’s Form 10-K for the year ended December 31, 2009, and other public disclosures for additional information. As a result of the write downs taken due to the restructuring of the securities portfolio, Bank of New York Mellon expects an increase in net interest revenue of $200 million in 2010. As of the second quarter of 2010 year to date, the BHC experienced a gain of $20 million in this portfolio. bTrading and counterparty positions were not stressed because the total portfolio is less than the $100 billion required for stress testing in SCAP, but trading (gain) loss information for this BHC was included in the “trading revenue” line of Schedule HI of the Y-9C in 2009. In SCAP, the projections of trading gains or losses for this BHC were included in the estimate of PPNR rather than the trading and counterparty line. Therefore, we have included the actual trading results in PPNR (specifically noninterest income).
Page 87 GAO-10-861 Lessons Learned from Bank Stress Test

Appendix III: One-Year Actual Performance
Compared to GAO’s Pro rata Stress Test Loss
Projections for Each of the 19 SCAP BHCs
Table 16: Capital One Financial Corporation
Dollars in billions
Actual at 12/31/0912/31/08 balance
per SCAP Difference
12/31/09 as a percent of the 12/31/08
balance
Tier 1 capital $16.0 $16.8 $(0.8) 95.2%
Tier 1 common capital $12.4 $12.0 $0.4 103.0%
Risk-weighted assets $116.3 $131.8 $(15.5) 88.2%
Tier 1 risk-based ratio 13.7% 12.7% 1.0% 108.2%
Tier 1 common capital ratio 10.6% 9.1% 1.5% 116.7%
Actual for year ended 12/31/09
2-year SCAP estimate
GAO 1-year pro rata estimate Difference
Actual as a percent of the pro rata estimate
Total asset losses $4.4 $13.4 $6.7 $(2.3) 65.1%
• First-lien mortgages 0.1 1.8 0.9 (0.8) 7.8%
• Second/junior lien mortgages 0.2 0.7 0.4 (0.1) 63.0
• Commercial and industrial loans 0.6 1.5 0.8 (0.1) 81.5
• Commercial real estate loans 0.3 1.1 0.6 (0.2) 62.4
• Credit card loans 1.8 3.6 1.8 (0.0) 98.0
• Securities (available for sale and held to maturity) (0.2) 0.4 0.2 (0.4) (103.1)
• Trading and counterparty -a n/a n/a - -
• Other 1.6 4.3 2.2 (0.6) 72.5
Resources other than capital to absorb losses (total PPNR less change in ALLL): $5.8 $9.0 $4.5 $1.3 128.0%
PPNR $5.4 - - - -
• Net interest income (expense) 7.7 - - - -
• Noninterest income 5.0a - - - -
• Less: noninterest expense 7.3 - - - -
Change in allowance for loan and lease losses (ALLL) $(0.4) - - - -
• ALLL at 12/31/08 4.5 - - - -
• ALLL at 12/31/09 4.1 - - - -
Source: GAO analysis of Federal Reserve and SNL Financial data.
Note: N/a means not applicable.
Page 88 GAO-10-861 Lessons Learned from Bank Stress Test

Appendix III: One-Year Actual Performance
Compared to GAO’s Pro rata Stress Test Loss
Projections for Each of the 19 SCAP BHCs
aTrading and counterparty positions were not stressed because the total portfolio is less than the $100 billion required for stress testing in SCAP, but trading (gain) loss information for this BHC was included in the “trading revenue” line of Schedule HI of the Y-9C in 2009. In SCAP, the projections of trading gains or losses for this BHC were included in the estimate of PPNR rather than the trading and counterparty line. Therefore, we have included the actual trading results in PPNR (specifically noninterest income).
Page 89 GAO-10-861 Lessons Learned from Bank Stress Test

Appendix III: One-Year Actual Performance
Compared to GAO’s Pro rata Stress Test Loss
Projections for Each of the 19 SCAP BHCs
Table 17: Citigroup Inc.
Dollars in billions
Actual at 12/31/0912/31/08 balance
per SCAP Difference
12/31/09 as a percent of the 12/31/08
balance
Tier 1 capital $127.0 $118.8 $8.2 106.9%
Tier 1 common capital $106.4 $22.9 $83.5 464.5%
Risk-weighted assets $1088.5 $996.2 $92.3 109.3%
Tier 1 risk-based ratio 11.7% 11.9% (0.2)% 98.1%
Tier 1 common capital ratio 9.8% 2.3% 7.5% 424.9%
Actual for year ended 12/31/09
2-year SCAP estimate
GAO 1-year pro rata estimate Difference
Actual as a percent of the pro rata estimate
Total asset losses $27.2 $104.7 $52.4 $(25.1) 52.0%
• First-lien mortgages 4.2 15.3 7.7 (3.5) 54.5
• Second/junior lien mortgages 4.7 12.2 6.1 (1.4) 76.8
• Commercial and industrial loans 5.1 8.9 4.5 0.6 113.6
• Commercial real estate loans 0.7 2.7 1.4 (0.6) 52.2
• Credit card loans 6.5 19.9 10.0 (3.4) 65.4
• Securities (available for sale and held to maturity) 0.9 2.9 1.5 (0.5) 62.8
• Trading and counterparty (4.4)a 22.4 11.2 (15.6) (39.7)
• Other 9.6 20.4 10.2 (0.6) 94.3
Resources other than capital to absorb losses (total PPNR less change in ALLL): $25.5 $49.0 $24.5 $1.0 103.9%
PPNR $31.9b,c - - - -
• Net interest income (expense) 50.4 - - - -
• Noninterest income 32.1a - - - -
• Less: noninterest expense 50.6 - - - -
Change in allowance for loan and lease losses (ALLL) $6.4 - - - -
• ALLL at 12/31/08 29.6 - - - -
• ALLL at 12/31/09 36.0 - - - -
Source: GAO analysis of Federal Reserve and SNL Financial data. Note: N/a means not applicable.
Page 90 GAO-10-861 Lessons Learned from Bank Stress Test

Appendix III: One-Year Actual Performance
Compared to GAO’s Pro rata Stress Test Loss
Projections for Each of the 19 SCAP BHCs
aThe trading and counterparty data in the Y-9C includes both customer derived revenue from transactions for BHCs that operate as broker-dealers as well as gains and losses from proprietary trading and associated expenses. These items are presented in net form only in the Y-9C. For the five BHCs that had their trading portfolios stressed (including Citigroup Inc.), the trading and counterparty line is based on projections of (gains) losses from proprietary trading, but PPNR (specifically noninterest revenue) included projections of gains (losses) from customer derived revenue from transactions due to operations as a broker-dealer. Because we could not segregate these items based on the Y-9C, we have included the net amount in both the trading and counterparty and noninterest income line items above. As a result of this limitation, the net amount of the trading gains or losses and PPNR in the table may be overstated or understated. bPPNR includes an owned debt value adjustment of ($4.23) billion, which was not included stressed in SCAP. As Citigroup’s credit spreads narrowed during 2009, this caused the liability values to increase. This offsets the gains Citigroup Inc. experienced in 2008 when its credit spreads widened. cPPNR includes one-time items totaling $2.73 billion, which were not included in SCAP.
Page 91 GAO-10-861 Lessons Learned from Bank Stress Test

Appendix III: One-Year Actual Performance
Compared to GAO’s Pro rata Stress Test Loss
Projections for Each of the 19 SCAP BHCs
Table 18: Fifth Third Bancorp
Dollars in billions
Actual at 12/31/0912/31/08 balance
per SCAP Difference
12/31/09 as a percent of the 12/31/08
balance
Tier 1 capital $13.4 $11.9 $1.5 112.8%
Tier 1 common capital $7.1 $4.9 $2.2 144.0%
Risk-weighted assets $100.9 $112.6 $(11.7) 89.6%
Tier 1 risk-based ratio 13.3% 10.6% 2.7% 125.6%
Tier 1 common capital ratio 7.0% 4.4% 2.6% 159.0%
Actual for year ended 12/31/09
2-year SCAP estimate
GAO 1-year pro rata estimate Difference
Actual as a percent of the pro rata estimate
Total asset losses $2.5 $9.1 $4.6 $(2.1) 54.6%
• First-lien mortgages 0.3 1.1 0.6 (0.3) 49.1
• Second/junior lien mortgages 0.3 1.1 0.6 (0.2) 57.8
• Commercial and industrial loans 0.6 2.8 1.4 (0.8) 39.4
• Commercial real estate loans 1.0 2.9 1.5 (0.4) 70.8
• Credit card loans 0.2 0.4 0.2 (0.0) 84.6
• Securities (available for sale and held to maturity) (0.1) 0.1 0.0 (0.1) -227.5
• Trading and counterparty -a n/a n/a -
• Other 0.2 0.9 0.5 (0.2) 54.6
Resources other than capital to absorb losses (total PPNR less change in ALLL): $3.3 $5.5 $2.8 $0.5 119.7%
PPNR $4.3b - - - -
• Net interest income (expense) 3.5 - - - -
• Noninterest income 4.6a - - - -
• Less: noninterest expense 3.8 - - - -
Change in allowance for loan and lease losses (ALLL) $1.0 - - - -
• ALLL at 12/31/08 2.8 - - - -
• ALLL at 12/31/09 3.7 - - - -
Source: GAO analysis of Federal Reserve and SNL Financial data.
Note: N/a means not applicable.
Page 92 GAO-10-861 Lessons Learned from Bank Stress Test
Appendix III: One-Year Actual Performance
Compared to GAO’s Pro rata Stress Test Loss
Projections for Each of the 19 SCAP BHCs
aTrading and counterparty positions were not stressed because the total portfolio is less than the $100 billion required for stress testing in SCAP, but trading (gain) loss information for this BHC was included in the “trading revenue” line of Schedule HI of the Y-9C in 2009. In SCAP, the projections of trading gains or losses for this BHC were included in the estimate of PPNR rather than the trading and counterparty line. Therefore, we have included the actual trading results in PPNR (specifically noninterest income). bFifth Third Bancorp’s PPNR includes one-time items totaling $2.05 billion, which were not included in SCAP.
Page 93 GAO-10-861 Lessons Learned from Bank Stress Test
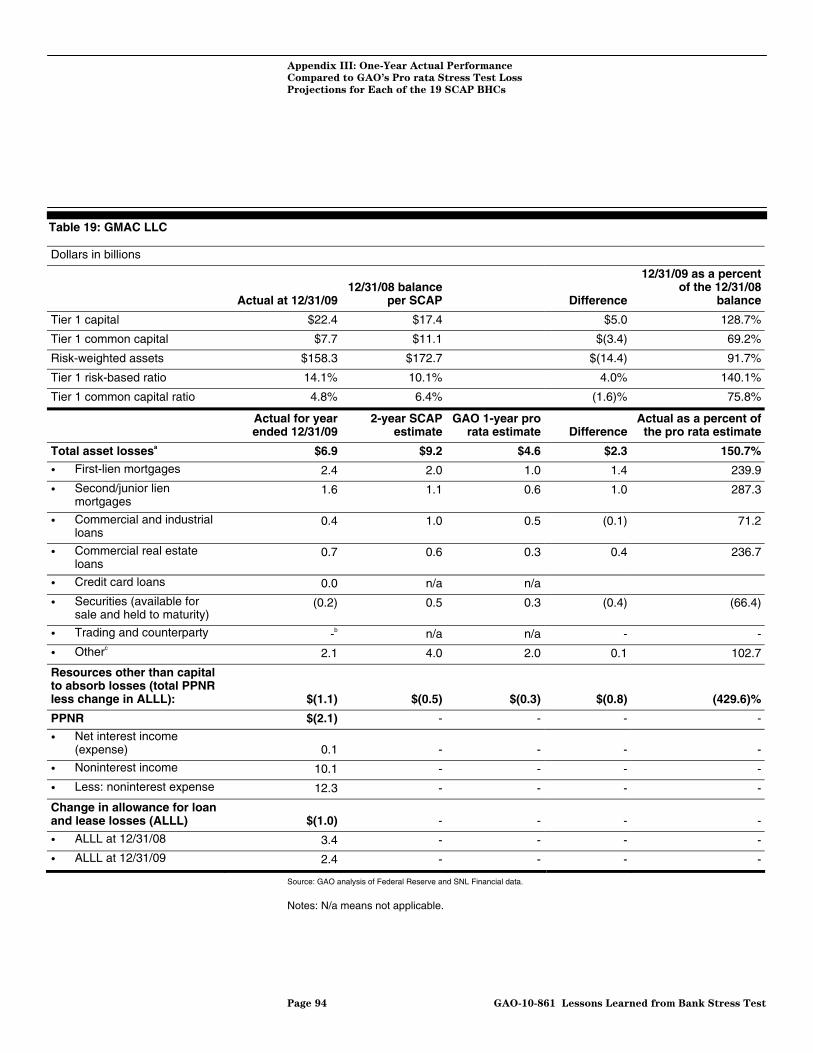
Appendix III: One-Year Actual Performance
Compared to GAO’s Pro rata Stress Test Loss
Projections for Each of the 19 SCAP BHCs
Table 19: GMAC LLC
Dollars in billions
Actual at 12/31/0912/31/08 balance
per SCAP Difference
12/31/09 as a percent of the 12/31/08
balance
Tier 1 capital $22.4 $17.4 $5.0 128.7%
Tier 1 common capital $7.7 $11.1 $(3.4) 69.2%
Risk-weighted assets $158.3 $172.7 $(14.4) 91.7%
Tier 1 risk-based ratio 14.1% 10.1% 4.0% 140.1%
Tier 1 common capital ratio 4.8% 6.4% (1.6)% 75.8%
Actual for year ended 12/31/09
2-year SCAP estimate
GAO 1-year pro rata estimate Difference
Actual as a percent of the pro rata estimate
Total asset lossesa $6.9 $9.2 $4.6 $2.3 150.7%
• First-lien mortgages 2.4 2.0 1.0 1.4 239.9
• Second/junior lien mortgages
1.6 1.1 0.6 1.0 287.3
• Commercial and industrial loans
0.4 1.0 0.5 (0.1) 71.2
• Commercial real estate loans
0.7 0.6 0.3 0.4 236.7
• Credit card loans 0.0 n/a n/a
• Securities (available for sale and held to maturity)
(0.2) 0.5 0.3 (0.4) (66.4)
• Trading and counterparty -b n/a n/a - -
• Otherc 2.1 4.0 2.0 0.1 102.7
Resources other than capital to absorb losses (total PPNR less change in ALLL): $(1.1) $(0.5) $(0.3) $(0.8) (429.6)%
PPNR $(2.1) - - - -
• Net interest income (expense) 0.1 - - - -
• Noninterest income 10.1 - - - -
• Less: noninterest expense 12.3 - - - -
Change in allowance for loan and lease losses (ALLL) $(1.0) - - - -
• ALLL at 12/31/08 3.4 - - - -
• ALLL at 12/31/09 2.4 - - - -
Source: GAO analysis of Federal Reserve and SNL Financial data.
Notes: N/a means not applicable.
Page 94 GAO-10-861 Lessons Learned from Bank Stress Test

Appendix III: One-Year Actual Performance
Compared to GAO’s Pro rata Stress Test Loss
Projections for Each of the 19 SCAP BHCs
GMAC LLC (GMAC) experienced a loss from discontinued operations totaling $2.4 billion in 2009. The item was not included in our calculation of PPNR. GMAC changed its corporate name to GMAC Inc. on June 30, 2009. On May 10, 2010, GMAC Inc. changed its name to Ally Financial Inc. aAccording to GMAC officials, in order to be positioned for better future performance the company pulled losses forward into the fourth quarter of 2009 by recognizing the lifetime losses on assets in that period; and as a result of the accelerated loss recognition less losses would be expected in 2010. GMAC had a profit in the first and second quarters of 2010, its first profits since the fourth quarter of 2008. GMAC’s tier 1 common capital ratio also improved to 5 percent and 5.2 percent, respectively. bTrading and counterparty positions were not stressed because the total portfolio is less than the $100 billion required for stress testing in SCAP, but trading (gain) loss information for this BHC was included in the “trading revenue” line of Schedule HI of the Y-9C in 2009. In SCAP, the projections of trading gains or losses for this BHC were included in the estimate of PPNR rather than the trading and counterparty line. Therefore, we have included the actual trading results in PPNR (specifically noninterest income). cGMAC’s “Other” loans category per SCAP included only automobile-related loans. However, our classification of “Other” using Y-9C data includes automobile loans and other loans such as European home mortgages, which had substantial losses in 2009. Automobile loan losses totaled about $600 million in 2009 compared to the $2.0 billion prorated SCAP estimate, according to GMAC officials. On April 12, 2010, GMAC’s mortgage subsidiary, Residential Capital, LLC agreed to sell its European mortgage assets and business. The assets in the transactions are valued at approximately the levels established in the fourth quarter of 2009, and there is no material gain or loss expected.
Page 95 GAO-10-861 Lessons Learned from Bank Stress Test
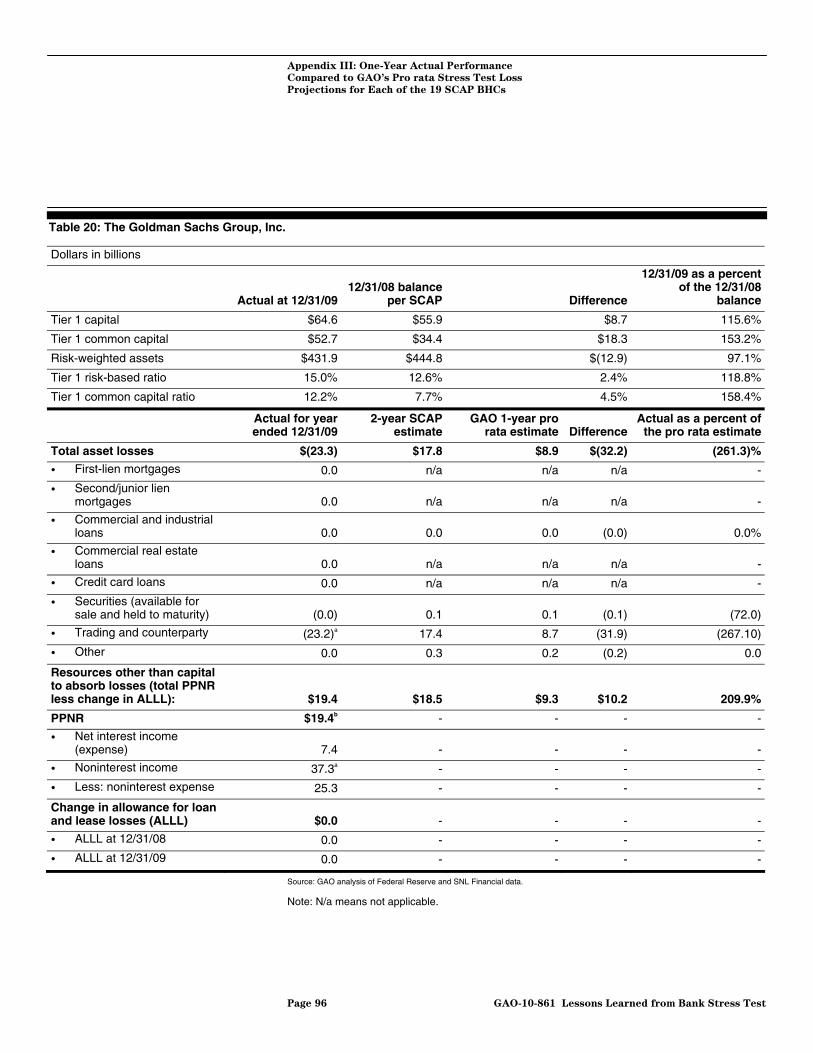
Appendix III: One-Year Actual Performance
Compared to GAO’s Pro rata Stress Test Loss
Projections for Each of the 19 SCAP BHCs
Table 20: The Goldman Sachs Group, Inc.
Dollars in billions
Actual at 12/31/0912/31/08 balance
per SCAP Difference
12/31/09 as a percent of the 12/31/08
balance
Tier 1 capital $64.6 $55.9 $8.7 115.6%
Tier 1 common capital $52.7 $34.4 $18.3 153.2%
Risk-weighted assets $431.9 $444.8 $(12.9) 97.1%
Tier 1 risk-based ratio 15.0% 12.6% 2.4% 118.8%
Tier 1 common capital ratio 12.2% 7.7% 4.5% 158.4%
Actual for year ended 12/31/09
2-year SCAP estimate
GAO 1-year pro rata estimate Difference
Actual as a percent of the pro rata estimate
Total asset losses $(23.3) $17.8 $8.9 $(32.2) (261.3)%
• First-lien mortgages 0.0 n/a n/a n/a -
• Second/junior lien mortgages 0.0 n/a n/a n/a -
• Commercial and industrial loans 0.0 0.0 0.0 (0.0) 0.0%
• Commercial real estate loans 0.0 n/a n/a n/a -
• Credit card loans 0.0 n/a n/a n/a -
• Securities (available for sale and held to maturity) (0.0) 0.1 0.1 (0.1) (72.0)
• Trading and counterparty (23.2)a 17.4 8.7 (31.9) (267.10)
• Other 0.0 0.3 0.2 (0.2) 0.0
Resources other than capital to absorb losses (total PPNR less change in ALLL): $19.4 $18.5 $9.3 $10.2 209.9%
PPNR $19.4b - - - -
• Net interest income (expense) 7.4 - - - -
• Noninterest income 37.3a - - - -
• Less: noninterest expense 25.3 - - - -
Change in allowance for loan and lease losses (ALLL) $0.0 - - - -
• ALLL at 12/31/08 0.0 - - - -
• ALLL at 12/31/09 0.0 - - - -
Source: GAO analysis of Federal Reserve and SNL Financial data. Note: N/a means not applicable.
Page 96 GAO-10-861 Lessons Learned from Bank Stress Test

Appendix III: One-Year Actual Performance
Compared to GAO’s Pro rata Stress Test Loss
Projections for Each of the 19 SCAP BHCs
aThe trading and counterparty data in the Y-9C includes both customer derived revenue from transactions for BHCs that operate as broker-dealers as well as gains and losses from proprietary trading and associated expenses. These items are presented in net form only in the Y-9C. For the five BHCs that had their trading portfolios stressed (including Goldman Sachs Group, Inc.), the trading and counterparty line is based on projections of (gains) losses from proprietary trading, but PPNR (specifically noninterest revenue) included projections of gains (losses) from customer derived revenue from transactions due to operations as a broker-dealer. Because we could not segregate these items based on the Y-9C, we have included the net amount in both the trading and counterparty and noninterest income line items above. As a result of this limitation, the net amount of the trading gains or losses and PPNR in the table may be overstated or understated. bPPNR includes an owned debt value adjustment of ($770) million, which was not stressed in SCAP. As Goldman Sachs Group, Inc.’s credit spreads narrowed during 2009, this caused the liability values to increase. This offsets the gains Goldman Sachs Group, Inc. experienced in 2008 when its credit spreads widened.
Page 97 GAO-10-861 Lessons Learned from Bank Stress Test
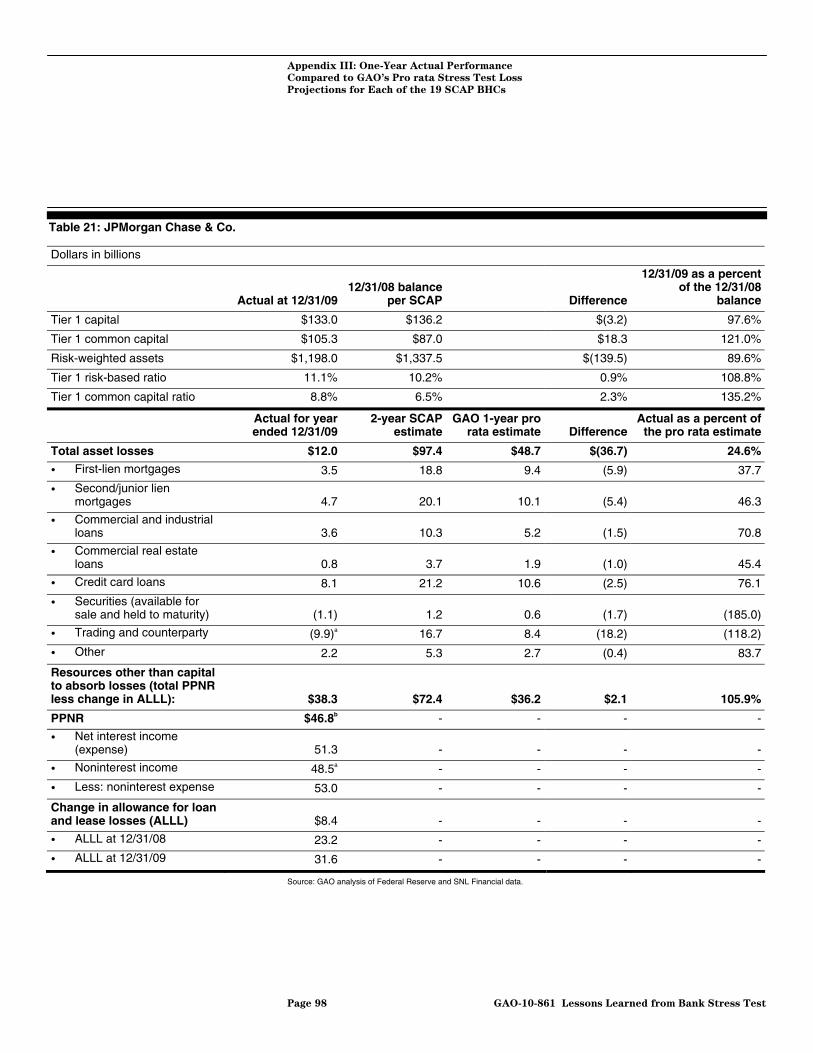
Appendix III: One-Year Actual Performance
Compared to GAO’s Pro rata Stress Test Loss
Projections for Each of the 19 SCAP BHCs
Table 21: JPMorgan Chase & Co.
Dollars in billions
Actual at 12/31/0912/31/08 balance
per SCAP Difference
12/31/09 as a percent of the 12/31/08
balance
Tier 1 capital $133.0 $136.2 $(3.2) 97.6%
Tier 1 common capital $105.3 $87.0 $18.3 121.0%
Risk-weighted assets $1,198.0 $1,337.5 $(139.5) 89.6%
Tier 1 risk-based ratio 11.1% 10.2% 0.9% 108.8%
Tier 1 common capital ratio 8.8% 6.5% 2.3% 135.2%
Actual for year ended 12/31/09
2-year SCAP estimate
GAO 1-year pro rata estimate Difference
Actual as a percent of the pro rata estimate
Total asset losses $12.0 $97.4 $48.7 $(36.7) 24.6%
• First-lien mortgages 3.5 18.8 9.4 (5.9) 37.7
• Second/junior lien mortgages 4.7 20.1 10.1 (5.4) 46.3
• Commercial and industrial loans 3.6 10.3 5.2 (1.5) 70.8
• Commercial real estate loans 0.8 3.7 1.9 (1.0) 45.4
• Credit card loans 8.1 21.2 10.6 (2.5) 76.1
• Securities (available for sale and held to maturity) (1.1) 1.2 0.6 (1.7) (185.0)
• Trading and counterparty (9.9)a 16.7 8.4 (18.2) (118.2)
• Other 2.2 5.3 2.7 (0.4) 83.7
Resources other than capital to absorb losses (total PPNR less change in ALLL): $38.3 $72.4 $36.2 $2.1 105.9%
PPNR $46.8b - - - -
• Net interest income (expense) 51.3 - - - -
• Noninterest income 48.5a - - - -
• Less: noninterest expense 53.0 - - - -
Change in allowance for loan and lease losses (ALLL) $8.4 - - - -
• ALLL at 12/31/08 23.2 - - - -
• ALLL at 12/31/09 31.6 - - - -
Source: GAO analysis of Federal Reserve and SNL Financial data.
Page 98 GAO-10-861 Lessons Learned from Bank Stress Test
Appendix III: One-Year Actual Performance
Compared to GAO’s Pro rata Stress Test Loss
Projections for Each of the 19 SCAP BHCs
aThe trading and counterparty data in the Y-9C includes both customer derived revenue from transactions for BHCs that operate as broker-dealers as well as gains and losses from proprietary trading and associated expenses. These items are presented in net form only in the Y-9C. For the five BHCs that had their trading portfolios stressed (including JPMorgan Chase & Co.), the trading and counterparty line is based on projections of (gains) losses from proprietary trading, but PPNR (specifically noninterest revenue) included projections of gains (losses) from customer derived revenue from transactions due to operations as a broker-dealer. Because we could not segregate these items based on the Y-9C, we have included the net amount in both the trading and counterparty and noninterest income line items above. As a result of this limitation, the net amount of the trading gains or losses and PPNR in the table may be overstated or understated. bPPNR includes an owned debt value adjustment of ($1.57) billion, which was not stressed in SCAP. As JPMorgan Chase & Co.’s credit spreads narrowed during 2009, this caused the liability values to increase. This offsets the gains JPMorgan Chase & Co. experienced in 2008 when its credit spreads widened.
Page 99 GAO-10-861 Lessons Learned from Bank Stress Test
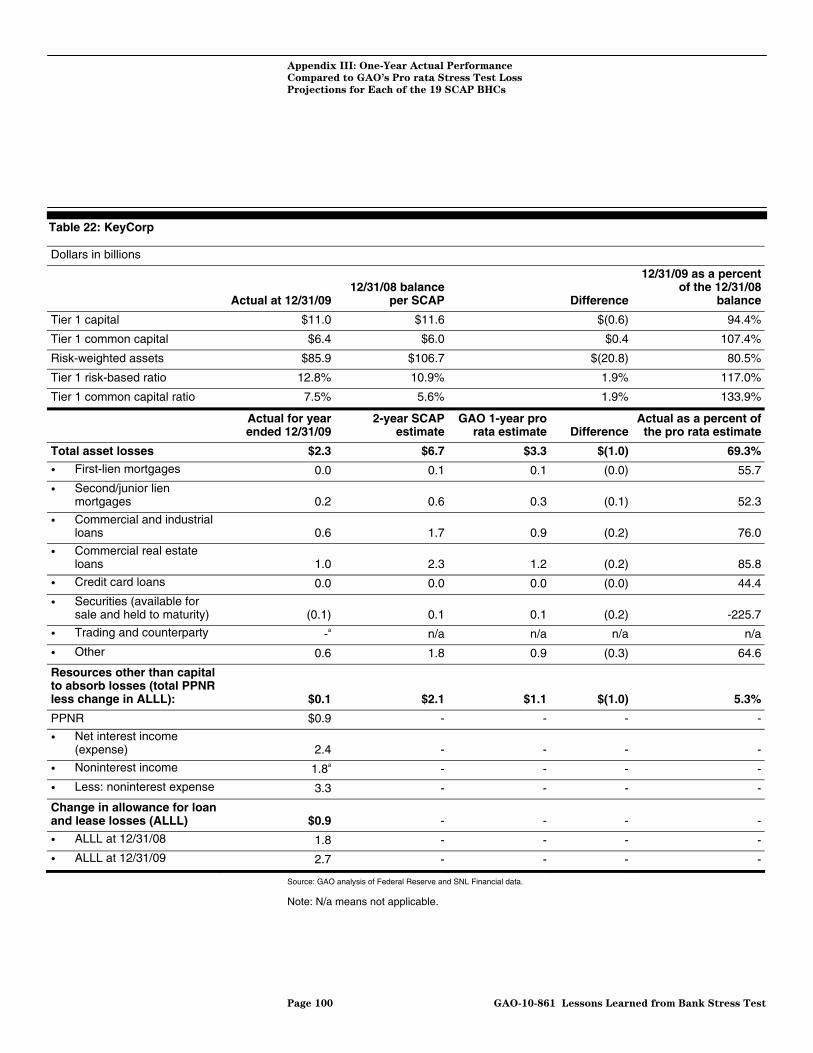
Appendix III: One-Year Actual Performance
Compared to GAO’s Pro rata Stress Test Loss
Projections for Each of the 19 SCAP BHCs
Table 22: KeyCorp
Dollars in billions
Actual at 12/31/0912/31/08 balance
per SCAP Difference
12/31/09 as a percent of the 12/31/08
balance
Tier 1 capital $11.0 $11.6 $(0.6) 94.4%
Tier 1 common capital $6.4 $6.0 $0.4 107.4%
Risk-weighted assets $85.9 $106.7 $(20.8) 80.5%
Tier 1 risk-based ratio 12.8% 10.9% 1.9% 117.0%
Tier 1 common capital ratio 7.5% 5.6% 1.9% 133.9%
Actual for year ended 12/31/09
2-year SCAP estimate
GAO 1-year pro rata estimate Difference
Actual as a percent of the pro rata estimate
Total asset losses $2.3 $6.7 $3.3 $(1.0) 69.3%
• First-lien mortgages 0.0 0.1 0.1 (0.0) 55.7
• Second/junior lien mortgages 0.2 0.6 0.3 (0.1) 52.3
• Commercial and industrial loans 0.6 1.7 0.9 (0.2) 76.0
• Commercial real estate loans 1.0 2.3 1.2 (0.2) 85.8
• Credit card loans 0.0 0.0 0.0 (0.0) 44.4
• Securities (available for sale and held to maturity) (0.1) 0.1 0.1 (0.2) -225.7
• Trading and counterparty -a n/a n/a n/a n/a
• Other 0.6 1.8 0.9 (0.3) 64.6
Resources other than capital to absorb losses (total PPNR less change in ALLL): $0.1 $2.1 $1.1 $(1.0) 5.3%
PPNR $0.9 - - - -
• Net interest income (expense) 2.4 - - - -
• Noninterest income 1.8a - - - -
• Less: noninterest expense 3.3 - - - -
Change in allowance for loan and lease losses (ALLL) $0.9 - - - -
• ALLL at 12/31/08 1.8 - - - -
• ALLL at 12/31/09 2.7 - - - -
Source: GAO analysis of Federal Reserve and SNL Financial data. Note: N/a means not applicable.
Page 100 GAO-10-861 Lessons Learned from Bank Stress Test

Appendix III: One-Year Actual Performance
Compared to GAO’s Pro rata Stress Test Loss
Projections for Each of the 19 SCAP BHCs
aTrading and counterparty positions were not stressed because the total portfolio is less than the $100 billion required for stress testing in SCAP, but trading (gain) loss information for this BHC was included in the “trading revenue” line of Schedule HI of the Y-9C in 2009. In SCAP, the projections of trading gains or losses for this BHC were included in the estimate of PPNR rather than the trading and counterparty line. Therefore, we have included the actual trading results in PPNR (specifically noninterest income).
Page 101 GAO-10-861 Lessons Learned from Bank Stress Test
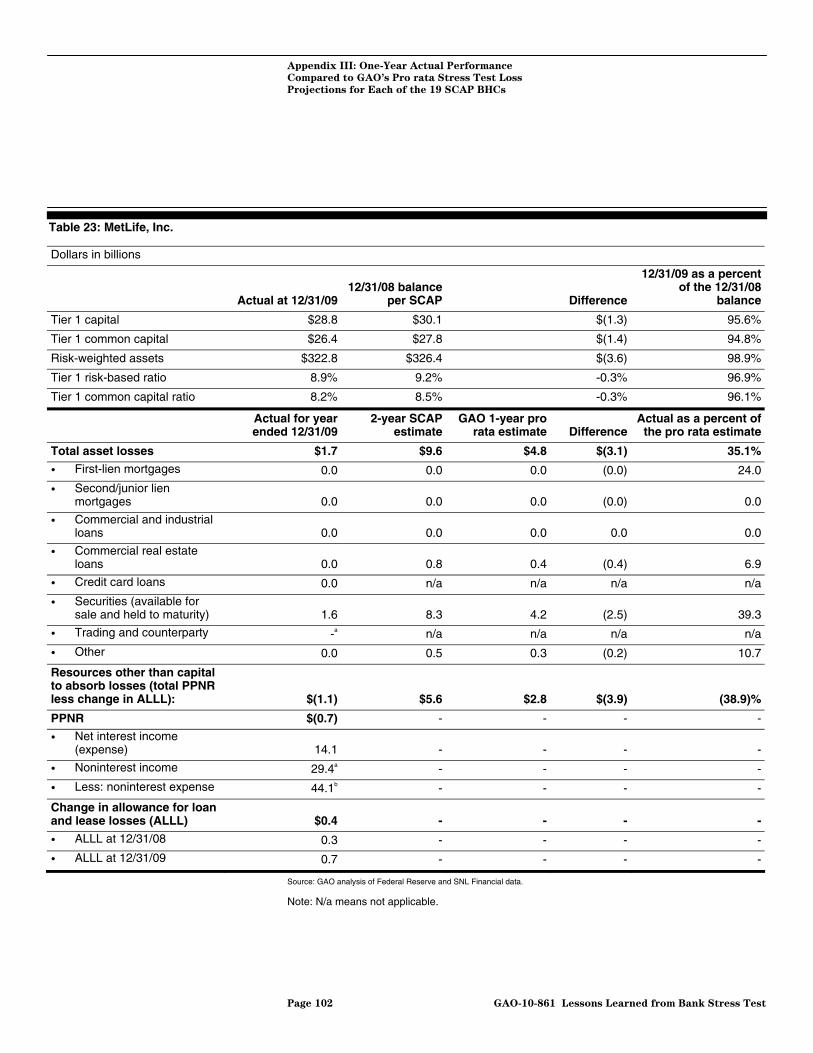
Appendix III: One-Year Actual Performance
Compared to GAO’s Pro rata Stress Test Loss
Projections for Each of the 19 SCAP BHCs
Table 23: MetLife, Inc.
Dollars in billions
Actual at 12/31/0912/31/08 balance
per SCAP Difference
12/31/09 as a percent of the 12/31/08
balance
Tier 1 capital $28.8 $30.1 $(1.3) 95.6%
Tier 1 common capital $26.4 $27.8 $(1.4) 94.8%
Risk-weighted assets $322.8 $326.4 $(3.6) 98.9%
Tier 1 risk-based ratio 8.9% 9.2% -0.3% 96.9%
Tier 1 common capital ratio 8.2% 8.5% -0.3% 96.1%
Actual for year ended 12/31/09
2-year SCAP estimate
GAO 1-year pro rata estimate Difference
Actual as a percent of the pro rata estimate
Total asset losses $1.7 $9.6 $4.8 $(3.1) 35.1%
• First-lien mortgages 0.0 0.0 0.0 (0.0) 24.0
• Second/junior lien mortgages 0.0 0.0 0.0 (0.0) 0.0
• Commercial and industrial loans 0.0 0.0 0.0 0.0 0.0
• Commercial real estate loans 0.0 0.8 0.4 (0.4) 6.9
• Credit card loans 0.0 n/a n/a n/a n/a
• Securities (available for sale and held to maturity) 1.6 8.3 4.2 (2.5) 39.3
• Trading and counterparty -a n/a n/a n/a n/a
• Other 0.0 0.5 0.3 (0.2) 10.7
Resources other than capital to absorb losses (total PPNR less change in ALLL): $(1.1) $5.6 $2.8 $(3.9) (38.9)%
PPNR $(0.7) - - - -
• Net interest income (expense) 14.1 - - - -
• Noninterest income 29.4a - - - -
• Less: noninterest expense 44.1b - - - -
Change in allowance for loan and lease losses (ALLL) $0.4 - - - -
• ALLL at 12/31/08 0.3 - - - -
• ALLL at 12/31/09 0.7 - - - -
Source: GAO analysis of Federal Reserve and SNL Financial data. Note: N/a means not applicable.
Page 102 GAO-10-861 Lessons Learned from Bank Stress Test
Appendix III: One-Year Actual Performance
Compared to GAO’s Pro rata Stress Test Loss
Projections for Each of the 19 SCAP BHCs
aTrading and counterparty positions were not stressed because the total portfolio is less than the $100 billion required for stress testing in SCAP, but trading (gain) loss information for this BHC was included in the “trading revenue” line of Schedule HI of the Y-9C in 2009. In SCAP, the projections of trading gains or losses for this BHC were included in the estimate of PPNR rather than the trading and counterparty line. Therefore, we have included the actual trading results in PPNR (specifically noninterest income). bMetLife, Inc. (MetLife) experienced high noninterest expense in 2009 largely due to derivative losses from interest rate hedging, which protects MetLife against lower interest rates among other things. Similar to the owned debt value adjustment, as MetLife’s credit spreads narrowed during 2009, this caused the liability values to increase. This offsets the gains MetLife experienced in 2008 when its credit spreads widened.
Page 103 GAO-10-861 Lessons Learned from Bank Stress Test

Appendix III: One-Year Actual Performance
Compared to GAO’s Pro rata Stress Test Loss
Projections for Each of the 19 SCAP BHCs
Table 24: Morgan Stanley
Dollars in billions
Actual at 12/31/0912/31/08 balance
per SCAP Difference
12/31/09 as a percent of the 12/31/08
balance
Tier 1 capital $46.7 $47.2 $(0.5) 98.9%
Tier 1 common capital $20.5 $17.8 $2.7 115.0%
Risk-weighted assets $305.0 $310.6 $(5.6) 98.2%
Tier 1 risk-based ratio 15.3% 15.2% 0.1% 100.7%
Tier 1 common capital ratio 6.7% 5.7% 1.0% 117.8%
Actual for year ended 12/31/09
2-year SCAP estimate
GAO 1-year pro rata estimate Difference
Actual as a percent of the pro rata estimate
Total asset losses $(7.1) $19.7 $9.8 $(16.9) -72.7%
• First-lien mortgages 0.0 n/a n/a n/a n/a
• Second/junior lien mortgages 0.0 n/a n/a n/a n/a
• Commercial and industrial loans 0.0 0.1 0.1 (0.0) 20.0
• Commercial real estate loans 0.1 0.6 0.3 (0.2) 46.7
• Credit card loans 0.0 n/a n/a n/a n/a
• Securities (available for sale and held to maturity) 0.0 n/a n/a n/a n/a
• Trading and counterparty (7.3)a 18.7 9.4 (16.6) -77.9
• Other 0.0 0.2 0.1 (0.1) 0.0
Resources other than capital to absorb losses (total PPNR less change in ALLL): $1.0 $7.1 $3.6 $(2.5) 28.4%
PPNR $1.1b,c - - - -
• Net interest income (expense) 0.9 - - - -
• Noninterest income 22.7a - - - -
• Less: noninterest expense 22.5 - - - -
Change in allowance for loan and lease losses (ALLL)
$0.1 - - - -
• ALLL at 12/31/08 0.0 - - - -
• ALLL at 12/31/09 0.2 - - - -
Source: GAO analysis of Federal Reserve and SNL Financial data. Note: N/a means not applicable.
Page 104 GAO-10-861 Lessons Learned from Bank Stress Test
Appendix III: One-Year Actual Performance
Compared to GAO’s Pro rata Stress Test Loss
Projections for Each of the 19 SCAP BHCs
aThe trading and counterparty data in the Y-9C includes both customer derived revenue from transactions for BHCs that operate as broker-dealers as well as gains and losses from proprietary trading and associated expenses. These items are presented in net form only in the Y-9C. For the five BHCs that had their trading portfolios stressed (including Morgan Stanley), the trading and counterparty line is based on projections of (gains) losses from proprietary trading, but PPNR (specifically noninterest revenue) included projections of gains (losses) from customer derived revenue from transactions due to operations as a broker-dealer. Because we could not segregate these items based on the Y-9C, we have included the net amount in both the trading and counterparty and noninterest income line items above. As a result of this limitation, the net amount of the trading gains or losses and preprovision net revenue in the table may be overstated or understated. bPPNR includes an owned debt value adjustment of ($5.30) billion, which was not included as a stress in SCAP. As Morgan Stanley’s credit spreads narrowed during 2009, this caused the liability values to increase. This offsets the gains Morgan Stanley experienced in 2008 when its credit spreads widened. cPPNR includes one-time items totaling $710 million, which were not included in SCAP.
Page 105 GAO-10-861 Lessons Learned from Bank Stress Test

Appendix III: One-Year Actual Performance
Compared to GAO’s Pro rata Stress Test Loss
Projections for Each of the 19 SCAP BHCs
Table 25: PNC Financial Services Group, Inc.
Dollars in billions
Actual at 12/31/0912/31/08 balance
per SCAP Difference
12/31/09 as a percent of the 12/31/08
balance
Tier 1 capital $26.5 $24.1 $2.4 110.1%
Tier 1 common capital $13.9 $11.7 $2.2 119.2%
Risk-weighted assets $232.3 $250.9 $(18.6) 92.6%
Tier 1 risk based ratio 11.4% 9.6% 1.8% 119.0%
Tier 1 common capital ratio 6.0% 4.7% 1.3% 127.7%
Actual for year ended 12/31/09
2-year SCAP estimate
GAO 1-year pro rata estimate Difference
Actual as a percent of the pro rata estimate
Total asset losses $2.7 $18.8 $9.4 $(6.6) 29.3%
• First-lien mortgages 0.1 2.4 1.2 (1.1) 4.6
• Second/junior lien mortgages
0.4 4.6 2.3 (1.9) 19.4
• Commercial and industrial loans
0.9 3.2 1.6 (0.7) 57.8
• Commercial real estate loans
0.8 4.5 2.3 (1.5) 33.4
• Credit card loans 0.2 0.4 0.2 (0.0) 85.6
• Securities (available for sale and held to maturity)
0.0 1.3 0.7 (0.6) 4.2
• Trading and counterparty -a n/a n/a n/a n/a
• Other 0.4 2.3 1.2 (0.8) 31.4
Resources other than capital to absorb losses (Total PPNR less change in ALLL):
$6.2 $9.6 $4.8 $1.4 128.6%
PPNR $7.3b - - - -
• Net interest income (expense)
9.1 - - - -
• Noninterest income 7.9a - - - -
• Less: noninterest expense 9.6 - - - -
Change in allowance for loan and lease losses (ALLL)
$1.2 - - - -
• ALLL at 12/31/08 3.9 - - - -
• ALLL at 12/31/09 5.1 - - - -
Source: GAO analysis of Federal Reserve and SNL Financial data.
Note: N/a means not applicable.
Page 106 GAO-10-861 Lessons Learned from Bank Stress Test
Appendix III: One-Year Actual Performance
Compared to GAO’s Pro rata Stress Test Loss
Projections for Each of the 19 SCAP BHCs
aTrading and counterparty positions were not stressed because the total portfolio is less than the $100 billion required for stress testing in SCAP, but trading (gain) loss information for this BHC was included in the “trading revenue” line of Schedule HI of the Y-9C in 2009. In SCAP, the projections of trading gains or losses for this BHC were included in the estimate of PPNR rather than the trading and counterparty line. Therefore, we have included the actual trading results in PPNR (specifically noninterest income). bPPNR includes one-time items totaling $1.08 billion, which were not included in SCAP.
Page 107 GAO-10-861 Lessons Learned from Bank Stress Test

Appendix III: One-Year Actual Performance
Compared to GAO’s Pro rata Stress Test Loss
Projections for Each of the 19 SCAP BHCs
Table 26: Regions Financial Corporation
Dollars in billions
Actual at 12/31/0912/31/08 balance
per SCAP Difference
12/31/09 as a percent of the 12/31/08
balance
Tier 1 capital $11.9 $12.1 $(0.2) 98.5%
Tier 1 common capital $7.4 $7.6 $(0.2) 97.2%
Risk-weighted assets $103.3 $116.3 $(13.0) 88.8%
Tier 1 risk-based ratio 11.5% 10.4% 1.1% 111.0%
Tier 1 common capital ratio 7.1% 6.6% 0.5% 108.3%
Actual for year ended 12/31/09
2-year SCAP estimate
GAO 1-year pro rata estimate Difference
Actual as a percent of the pro rata
estimate
Total asset losses $2.2 $9.2 $4.6 $(2.4) 48.8%
• First-lien mortgages 0.2 1.0 0.5 (0.3) 36.7
• Second/junior lien mortgages 0.4 1.1 0.6 (0.2) 72.0
• Commercial and industrial loans 0.3 1.2 0.6 (0.3) 43.2
• Commercial real estate loans 1.1 4.9 2.5 (1.3) 46.7
• Credit card loans 0.0 n/a n/a n/a n/a
• Securities (available for sale and held to maturity) (0.0) 0.2 0.1 (0.1) (6.4)
• Trading and counterparty -a n/a n/a n/a n/a
• Other 0.3 0.8 0.4 (0.1) 67.9
Resources other than capital to absorb losses (total PPNR less change in ALLL): $1.1 $3.3 $1.7 $(0.6) 64.9%
PPNR $2.4b - - - -
• Net interest income (expense) 3.3 - - - -
• Noninterest income 3.5a - - - -
• Less: noninterest expense 4.5 - - - -
Change in allowance for loan and lease losses (ALLL) $1.3 - - - -
• ALLL at 12/31/08 1.8 - - - -
• ALLL at 12/31/09 3.1 - - - -
Source: GAO analysis of Federal Reserve and SNL Financial data. Note: N/a means not applicable.
Page 108 GAO-10-861 Lessons Learned from Bank Stress Test

Appendix III: One-Year Actual Performance
Compared to GAO’s Pro rata Stress Test Loss
Projections for Each of the 19 SCAP BHCs
aTrading and counterparty positions were not stressed because the total portfolio is less than the $100 billion required for stress testing in SCAP, but trading (gain) loss information for this BHC was included in the “trading revenue” line of Schedule HI of the Y-9C in 2009. In SCAP, the projections of trading gains or losses for this BHC were included in the estimate of PPNR rather than the trading and counterparty line. Therefore, we have included the actual trading results in PPNR (specifically noninterest income). bPPNR includes one-time items totaling $140 million, which were not included in SCAP.
Page 109 GAO-10-861 Lessons Learned from Bank Stress Test
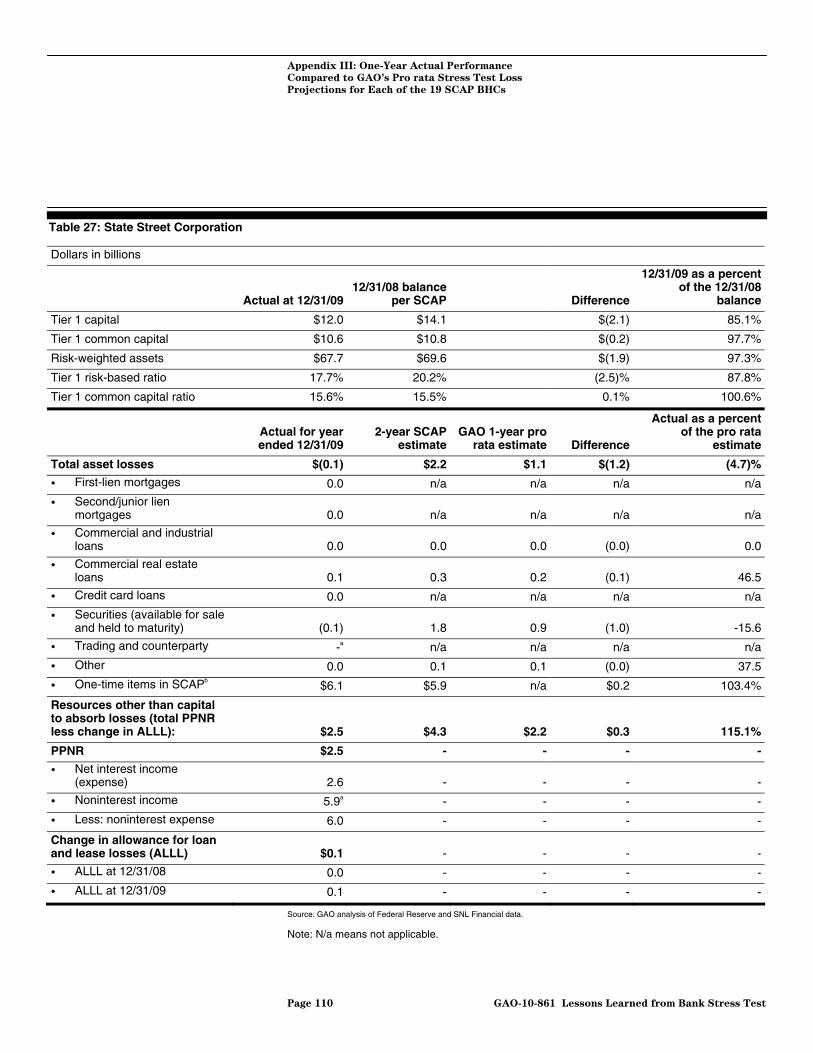
Appendix III: One-Year Actual Performance
Compared to GAO’s Pro rata Stress Test Loss
Projections for Each of the 19 SCAP BHCs
Table 27: State Street Corporation
Dollars in billions
Actual at 12/31/0912/31/08 balance
per SCAP Difference
12/31/09 as a percent of the 12/31/08
balance
Tier 1 capital $12.0 $14.1 $(2.1) 85.1%
Tier 1 common capital $10.6 $10.8 $(0.2) 97.7%
Risk-weighted assets $67.7 $69.6 $(1.9) 97.3%
Tier 1 risk-based ratio 17.7% 20.2% (2.5)% 87.8%
Tier 1 common capital ratio 15.6% 15.5% 0.1% 100.6%
Actual for year ended 12/31/09
2-year SCAP estimate
GAO 1-year pro rata estimate Difference
Actual as a percent of the pro rata
estimate
Total asset losses $(0.1) $2.2 $1.1 $(1.2) (4.7)%
• First-lien mortgages 0.0 n/a n/a n/a n/a
• Second/junior lien mortgages 0.0 n/a n/a n/a n/a
• Commercial and industrial loans 0.0 0.0 0.0 (0.0) 0.0
• Commercial real estate loans 0.1 0.3 0.2 (0.1) 46.5
• Credit card loans 0.0 n/a n/a n/a n/a
• Securities (available for sale and held to maturity) (0.1) 1.8 0.9 (1.0) -15.6
• Trading and counterparty -a n/a n/a n/a n/a
• Other 0.0 0.1 0.1 (0.0) 37.5
• One-time items in SCAPb $6.1 $5.9 n/a $0.2 103.4%
Resources other than capital to absorb losses (total PPNR less change in ALLL): $2.5 $4.3 $2.2 $0.3 115.1%
PPNR $2.5 - - - -
• Net interest income (expense) 2.6 - - - -
• Noninterest income 5.9a - - - -
• Less: noninterest expense 6.0 - - - -
Change in allowance for loan and lease losses (ALLL) $0.1 - - - -
• ALLL at 12/31/08 0.0 - - - -
• ALLL at 12/31/09 0.1 - - - -
Source: GAO analysis of Federal Reserve and SNL Financial data. Note: N/a means not applicable.
Page 110 GAO-10-861 Lessons Learned from Bank Stress Test

Appendix III: One-Year Actual Performance
Compared to GAO’s Pro rata Stress Test Loss
Projections for Each of the 19 SCAP BHCs
aTrading and counterparty positions were not stressed because the total portfolio is less than the $100 billion required for stress testing in SCAP, but trading (gain) loss information for this BHC was included in the “trading revenue” line of Schedule HI of the Y-9C in 2009. In SCAP, the projections of trading gains or losses for this BHC were included in the estimate of PPNR rather than the trading and counterparty line. Therefore, we have included the actual trading results in PPNR (specifically noninterest income) bWe broke out “other” losses into two categories—”Other” and “One-time items.” As discussed in State Street Corporation’s (State Street) May 7, 2009, press release, $5.9 billion of the amount listed in the “Other” category in the SCAP results was a pretax charge that was expected to occur when certain asset-backed commercial paper conduits administered by State Street were consolidated onto its balance sheet in 2009. Since this was a one-time charge that was realized in 2009, this effect was segregated from more typical loss amounts for tracking purposes. Upon consolidation, the actual amount realized was $6.1 billion, as reported in State Street’s Form 10-Q for the second quarter of 2009.
Page 111 GAO-10-861 Lessons Learned from Bank Stress Test

Appendix III: One-Year Actual Performance
Compared to GAO’s Pro rata Stress Test Loss
Projections for Each of the 19 SCAP BHCs
Table 28: SunTrust Banks, Inc.
Dollars in billions
Actual at 12/31/0912/31/08 balance
per SCAP Difference
12/31/09 as a percent of the 12/31/08
balance
Tier 1 capital $18.1 $17.6 $0.5 102.7%
Tier 1 common capital $10.7 $9.4 $1.3 113.7%
Risk-weighted assets $139.4 $162.0 $(22.6) 86.0%
Tier 1 risk-based ratio 13.0% 10.9% 2.1% 118.9%
Tier 1 common capital ratio 7.7% 5.8% 1.9% 132.3%
Actual for year ended 12/31/09
2-year SCAP estimate
GAO 1-year pro rata estimate Difference
Actual as a percent of the pro rata estimate
Total asset losses $3.1 $11.8 $5.9 $(2.8) 53.1%
• First-lien mortgages 1.1 2.2 1.1 0.0 101.5
• Second/junior lien mortgages 0.8 3.1 1.6 (0.8) 48.8
• Commercial and industrial loans 0.5 1.5 0.8 (0.2) 69.9
• Commercial real estate loans 0.6 2.8 1.4 (0.8) 39.8
• Credit card loans 0.1 0.1 0.1 0.0 115.3
• Securities (available for sale and held to maturity) (0.1) 0.0 0.0 (0.1) (980.2)
• Trading and counterparty -a n/a n/a n/a n/a
• Other 0.2 2.1 1.1 (0.8) 21.6
Resources other than capital to absorb losses (total PPNR less change in ALLL): $1.4 $4.7 $2.4 $(0.9) 61.3%
PPNR $2.2b,c - - - -
• Net interest income (expense) 4.5 - - - -
• Noninterest income 3.6a - - - -
• Less: noninterest expense 5.9 - - - -
Change in allowance for loan and lease losses (ALLL) $0.8 - - - -
• ALLL at 12/31/08 2.4 - - - -
• ALLL at 12/31/09 3.1 - - - -
Source: GAO analysis of Federal Reserve and SNL Financial data. Note: N/a means not applicable.
Page 112 GAO-10-861 Lessons Learned from Bank Stress Test
Appendix III: One-Year Actual Performance
Compared to GAO’s Pro rata Stress Test Loss
Projections for Each of the 19 SCAP BHCs
aTrading and counterparty positions were not stressed because the total portfolio is less than the $100 billion required for stress testing in SCAP, but trading (gain) loss information for this BHC was included in the “trading revenue” line of Schedule HI of the Y-9C in 2009. In SCAP, the projections of trading gains or losses for this BHC were included in the estimate of PPNR rather than the trading and counterparty line. Therefore, we have included the actual trading results in PPNR (specifically noninterest income). bPPNR includes an owned debt value adjustment of ($150) million, which was not stressed in SCAP. As SunTrust Banks Inc.’s credit spreads narrowed during 2009, this caused the liability values to increase. This offsets the gains SunTrust experienced in 2008 when its credit spreads widened. cPPNR includes one-time items totaling $110 million, which were not included in SCAP.
Page 113 GAO-10-861 Lessons Learned from Bank Stress Test

Appendix III: One-Year Actual Performance
Compared to GAO’s Pro rata Stress Test Loss
Projections for Each of the 19 SCAP BHCs
Table 29: U.S. Bancorp
Dollars in billions
Actual at 12/31/0912/31/08 balance
per SCAP Difference
12/31/09 as a percent of the 12/31/08
balance
Tier 1 capital $22.6 $24.4 $(1.8) 92.7%
Tier 1 common capital $15.9 $11.8 $4.1 134.7%
Risk-weighted assets $235.2 $230.6 $4.6 102.0%
Tier 1 risk-based ratio 9.6% 10.6% (1.0)% 90.7%
Tier 1 common capital ratio 6.8% 5.1% 1.7% 132.5%
Actual for year ended 12/31/09
2-year SCAP estimate
GAO 1-year pro rata estimate Difference
Actual as a percent of the pro rata
estimate
Total asset losses $4.3 $15.7 $8.0 $(3.6) 54.3%
• First-lien mortgages 0.5 1.8 0.9 (0.4) 54.3
• Second/junior lien mortgages 0.3 1.7 0.9 (0.5) 39.8
• Commercial and industrial loans 0.6 2.3 1.2 (0.6) 50.9
• Commercial real estate loans 0.6 3.2 1.6 (1.0) 38.6
• Credit card loans 1.0 2.8 1.4 (0.4) 73.6
• Securities (available for sale and held to maturity) 0.5 1.3 0.7 (0.2) 69.4
• Trading and counterparty -a n/a n/a n/a n/a
• Other 0.8 2.8 1.4 (0.6) 57.7
Resources other than capital to absorb losses (total PPNR less change in ALLL): $7.1 $13.7 $6.9 $0.2 103.3%
PPNR $8.6 - - - -
• Net interest income (expense) 8.5 - - - -
• Noninterest income 8.4a - - - -
• Less: noninterest expense 8.3 - - - -
Change in allowance for loan and lease losses (ALLL) $1.6 - - - -
• ALLL at 12/31/08 3.5 - - - -
• ALLL at 12/31/09 5.1 - - - -
Source: GAO analysis of Federal Reserve and SNL Financial data. Note: N/a means not applicable.
Page 114 GAO-10-861 Lessons Learned from Bank Stress Test
Appendix III: One-Year Actual Performance
Compared to GAO’s Pro rata Stress Test Loss
Projections for Each of the 19 SCAP BHCs
aTrading and counterparty positions were not stressed because the total portfolio is less than the $100 billion required for stress testing in SCAP, but trading (gain) loss information for this BHC was included in the “trading revenue” line of Schedule HI of the Y-9C in 2009. In SCAP, the projections of trading gains or losses for this BHC were included in the estimate of PPNR rather than the trading and counterparty line. Therefore, we have included the actual trading results in PPNR (specifically noninterest income).
Page 115 GAO-10-861 Lessons Learned from Bank Stress Test
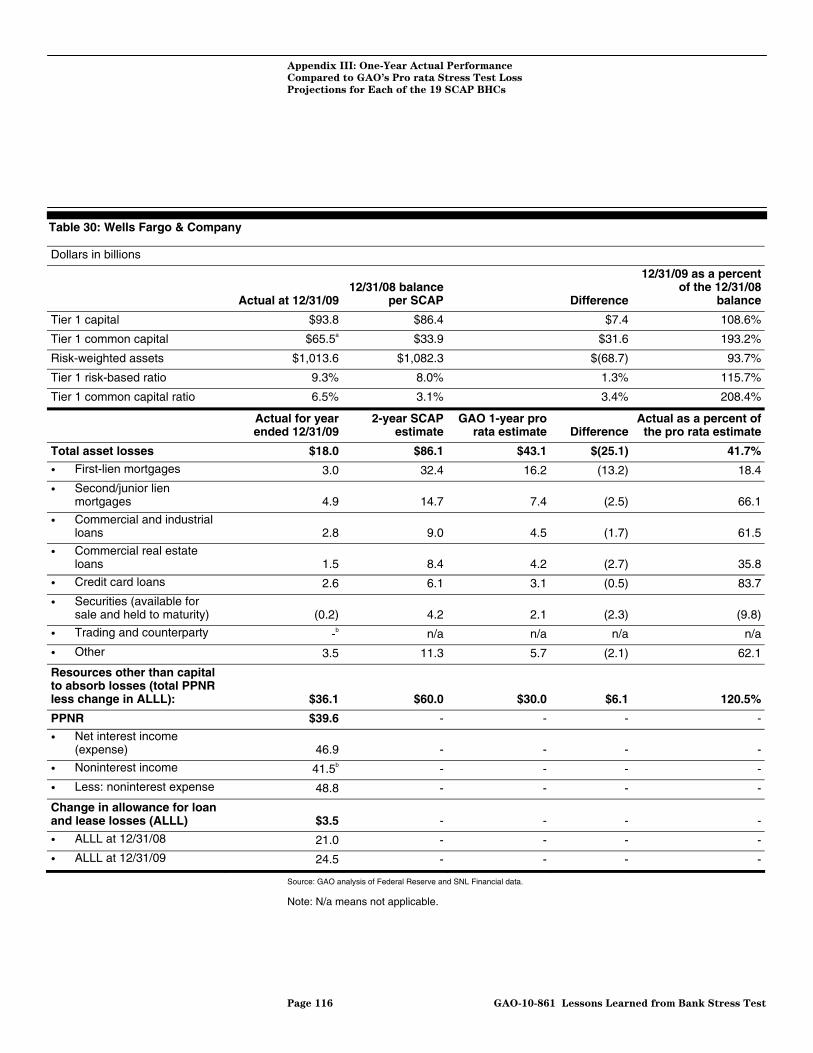
Appendix III: One-Year Actual Performance
Compared to GAO’s Pro rata Stress Test Loss
Projections for Each of the 19 SCAP BHCs
Table 30: Wells Fargo & Company
Dollars in billions
Actual at 12/31/0912/31/08 balance
per SCAP Difference
12/31/09 as a percent of the 12/31/08
balance
Tier 1 capital $93.8 $86.4 $7.4 108.6%
Tier 1 common capital $65.5a $33.9 $31.6 193.2%
Risk-weighted assets $1,013.6 $1,082.3 $(68.7) 93.7%
Tier 1 risk-based ratio 9.3% 8.0% 1.3% 115.7%
Tier 1 common capital ratio 6.5% 3.1% 3.4% 208.4%
Actual for year ended 12/31/09
2-year SCAP estimate
GAO 1-year pro rata estimate Difference
Actual as a percent of the pro rata estimate
Total asset losses $18.0 $86.1 $43.1 $(25.1) 41.7%
• First-lien mortgages 3.0 32.4 16.2 (13.2) 18.4
• Second/junior lien mortgages 4.9 14.7 7.4 (2.5) 66.1
• Commercial and industrial loans 2.8 9.0 4.5 (1.7) 61.5
• Commercial real estate loans 1.5 8.4 4.2 (2.7) 35.8
• Credit card loans 2.6 6.1 3.1 (0.5) 83.7
• Securities (available for sale and held to maturity) (0.2) 4.2 2.1 (2.3) (9.8)
• Trading and counterparty -b n/a n/a n/a n/a
• Other 3.5 11.3 5.7 (2.1) 62.1
Resources other than capital to absorb losses (total PPNR less change in ALLL): $36.1 $60.0 $30.0 $6.1 120.5%
PPNR $39.6 - - - -
• Net interest income (expense) 46.9 - - - -
• Noninterest income 41.5b - - - -
• Less: noninterest expense 48.8 - - - -
Change in allowance for loan and lease losses (ALLL) $3.5 - - - -
• ALLL at 12/31/08 21.0 - - - -
• ALLL at 12/31/09 24.5 - - - -
Source: GAO analysis of Federal Reserve and SNL Financial data. Note: N/a means not applicable.
Page 116 GAO-10-861 Lessons Learned from Bank Stress Test
Appendix III: One-Year Actual Performance
Compared to GAO’s Pro rata Stress Test Loss
Projections for Each of the 19 SCAP BHCs
aThe tier 1 common calculation has been adjusted to provide for appropriate treatment of preferred shares Wells Fargo & Company (Wells Fargo) issued as a part of its Employee Stock Ownership Plan (ESOP). Each share of ESOP preferred stock released from the unallocated reserve of the 401(k) plan is converted into shares of Wells Fargo’s common stock based on the stated value of the ESOP preferred stock and the current market price of Wells Fargo’s common stock. Wells Fargo sells ESOP preferred stock to its 401(k) plan and lends the 401(k) plan cash to purchase those shares. The loan is recorded as “Unearned ESOP Preferred Shares.” While the ESOP preferred shares are counted as an addition to equity, the loans recorded as Unearned ESOP Preferred Shares are treated as a reduction to equity, and so there is no net impact on the equity accounts (including tier 1 capital). However, the tier 1 common capital calculation removes the ESOP preferred shares without also removing the corresponding loans recorded as Unearned ESOP Preferred Shares. After consulting with Wells Fargo, GAO adjusted the tier 1 common capital calculation by removing the $442 million of Unearned ESOP Preferred Shares outstanding as of December 31, 2009 (the Unearned ESOP Preferred Shares is a negative amount; thus, removing this item leads to the addition of $442 million in tier 1 capital), which is consistent with SCAP’s treatment. bTrading and counterparty positions were not stressed because the total portfolio is less than the $100 billion required for stress testing in SCAP, but trading (gain) loss information for this BHC was included in the “trading revenue” line of Schedule HI of the Y-9C in 2009. In SCAP, the projections of trading gains or losses for this BHC were included in the estimate of PPNR rather than the trading and counterparty line. Therefore, we have included the actual trading results in PPNR (specifically noninterest income).
Page 117 GAO-10-861 Lessons Learned from Bank Stress Test
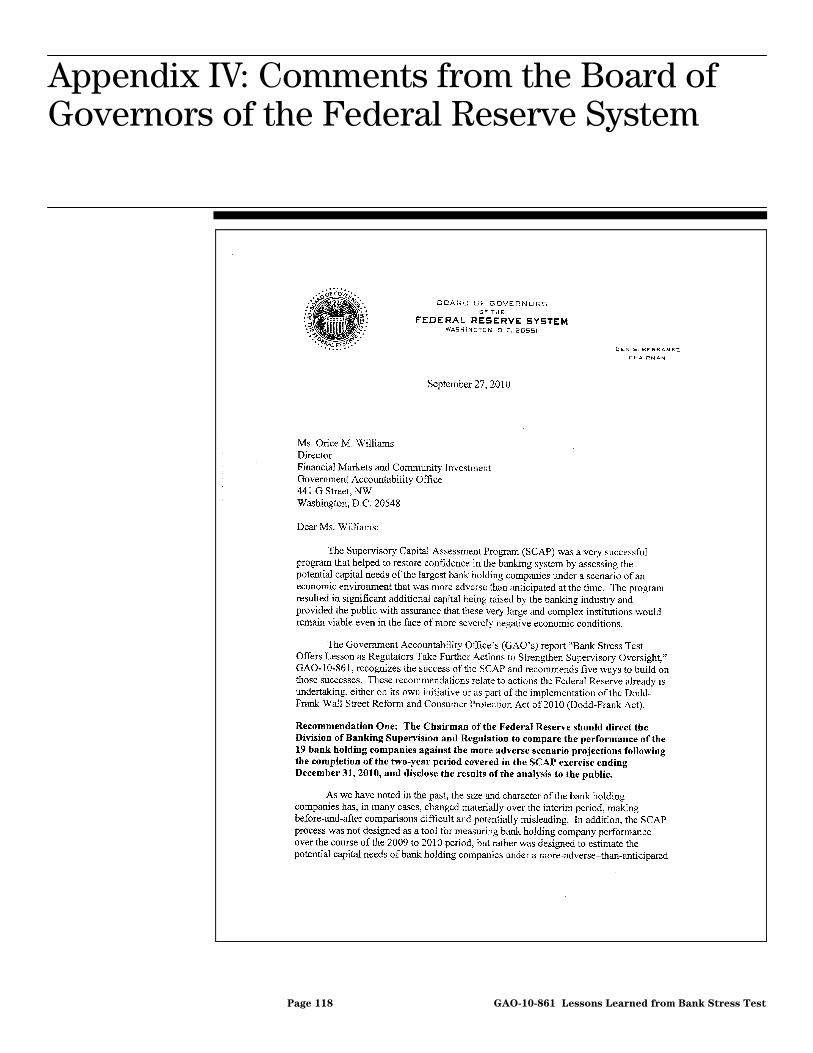
Appendix IV: Comments from the Board of
Governors of the Federal Reserve System
Appendix IV: Comments from the Board of Governors of the Federal Reserve System
Page 118 GAO-10-861 Lessons Learned from Bank Stress Test
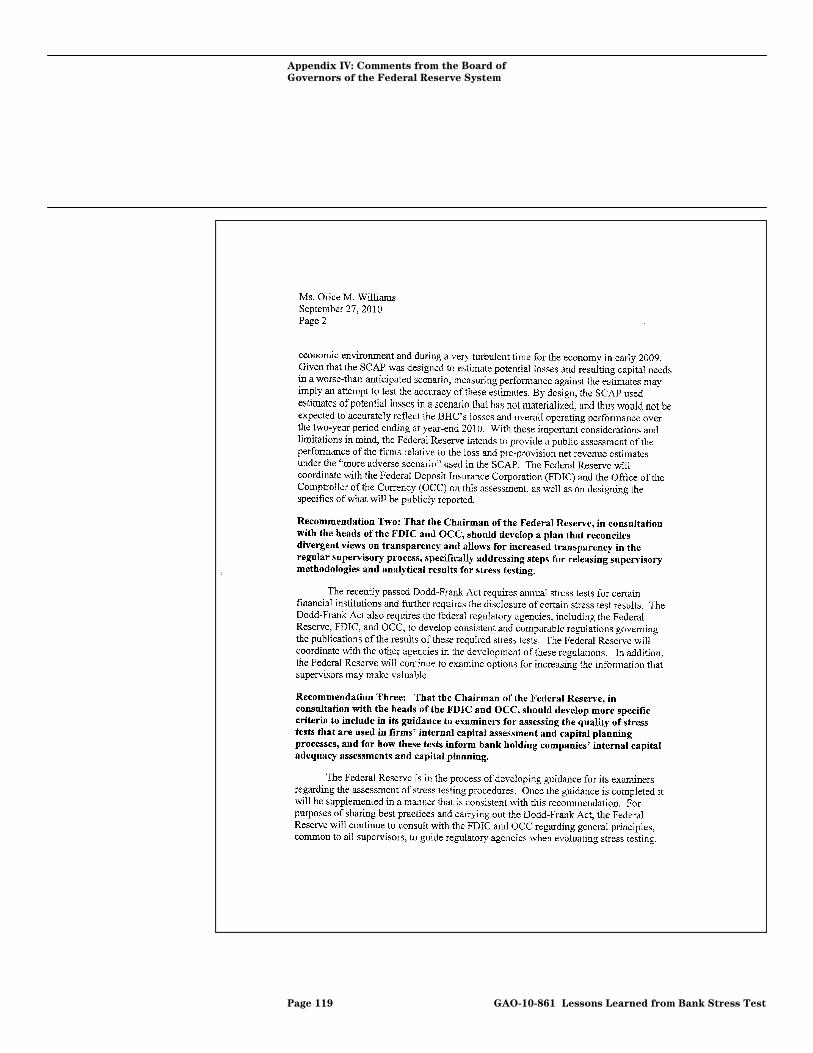
Appendix IV: Comments from the Board of
Governors of the Federal Reserve System
Page 119 GAO-10-861 Lessons Learned from Bank Stress Test

Appendix IV: Comments from the Board of
Governors of the Federal Reserve System
Page 120 GAO-10-861 Lessons Learned from Bank Stress Test
Appendix V: Comments from the Department
of the Treasury’s Office of Financial Stability
Appendix V: Comments from the Department of the Treasury’s Office of Financial Stability
Page 121 GAO-10-861 Lessons Learned from Bank Stress Test
Appendix VI: GAO Contact and Staff
Acknowledgments
Appendix VI: GAO Contact and Staff Acknowledgments
Orice Williams Brown, (202) 512-8678 or [email protected]
Daniel Garcia-Diaz (Assistant Director), Michael Aksman, Emily Chalmers, Rachel DeMarcus, Laurier Fish, Joe Hunter, William King, Matthew McDonald, Sarah M. McGrath, Timothy Mooney, Marc Molino, Linda Rego, and Cynthia Taylor made important contributions to this report.
Page 122 GAO-10-861 Lessons Learned from Bank Stress Test
GAO Contact
Staff Acknowledgments
(250507)

GAO’s Mission The Government Accountability Office, the audit, evaluation, and investigative arm of Congress, exists to support Congress in meeting its constitutional responsibilities and to help improve the performance and accountability of the federal government for the American people. GAO examines the use of public funds; evaluates federal programs and policies; and provides analyses, recommendations, and other assistance to help Congress make informed oversight, policy, and funding decisions. GAO’s commitment to good government is reflected in its core values of accountability, integrity, and reliability.
The fastest and easiest way to obtain copies of GAO documents at no cost is through GAO’s Web site (www.gao.gov). Each weekday afternoon, GAO posts on its Web site newly released reports, testimony, and correspondence. To have GAO e-mail you a list of newly posted products, go to www.gao.gov and select “E-mail Updates.”
Obtaining Copies of GAO Reports and Testimony
Order by Phone The price of each GAO publication reflects GAO’s actual cost of production and distribution and depends on the number of pages in the publication and whether the publication is printed in color or black and white. Pricing and ordering information is posted on GAO’s Web site, http://www.gao.gov/ordering.htm.
Place orders by calling (202) 512-6000, toll free (866) 801-7077, or TDD (202) 512-2537.
Orders may be paid for using American Express, Discover Card, MasterCard, Visa, check, or money order. Call for additional information.
Contact:
Web site: www.gao.gov/fraudnet/fraudnet.htm E-mail: [email protected] Automated answering system: (800) 424-5454 or (202) 512-7470
Ralph Dawn, Managing Director, [email protected], (202) 512-4400 U.S. Government Accountability Office, 441 G Street NW, Room 7125 Washington, DC 20548
To Report Fraud, Waste, and Abuse in Federal Programs
Congressional Relations
Chuck Young, Managing Director, [email protected], (202) 512-4800 U.S. Government Accountability Office, 441 G Street NW, Room 7149 Washington, DC 20548
Public Affairs
Please Print on Recycled Paper