september 2008 kraft foods...
TRANSCRIPT

September 2008
KRAFT FOODS BACK-TO-SCHOOL
2
Irene RosenfeldChairman and CEO

Forward Looking StatementsThis presentation contains forward-looking statements regarding our four strategies to get Kraft growing, specifically rewiring the organization for growth, reframing our categories, exploiting our sales capabilities and balancing cost and quality; our belief that input costs will be at least $3.3 billion, or 23%, higher in 2008 than 2006; that we're doing what we said we would and building momentum; that we’ll deliver GAAP EPS of at least $2.00 in 2009; our belief that we’re rebuilding our brand equities, and in particular, that our investments are paying off, we are reframing value proposition and leveraging our portfolio breadth; that the integration of our LU biscuits business is on track, growing strongly and accretive to EPS in 2008; that we are benefiting from decentralized structure and tightly controlling costs; that we are delivering improved financial results and improving profitability while we invest; our belief regarding our long-term EPS growth; our plan to rewire Kraft International by winning locally, leveraging globally, building management depth and focusing on specific categories, brands and markets where we believe we can win; how we plan to leverage our biscuits and snacks businesses for growth; our plan to build Oreo as a global icon, market by market and extending the brand into all channels and new countries; that we are trading up our power brands such as Milka, improving quality, increasing marketing, moving from mainstream to upper mainstream and obtaining higher margins from trading up consumers; that we are growing our Carte Noire brand and expanding into new segments and geographies and enhancing the mix of our coffee business; our belief that the best is yet to come and our long-term organic net revenue growth and margin targets; that our international business is key to our growth; our belief of what drives long-term and near-term EPS growth and our long-term EPS growth expectation; our estimates for restructuring, specifically that our savings will reach $1.1 billion in 2008 and $1.4 billion total and spending will be approximately $900 million in 2008 and $3.0 billion total; our expectation that we will continue to optimize our manufacturing network and reduce overhead costs by at least 1% of net revenue over the next few years; our 2008 guidance, in particular organic net revenue growth of at least 6%, EPS excluding items of at least $1.88 and effective tax rate of approximately 33%; our 2009 guidance, in particular organic net revenue growthof at least 4% and GAAP EPS of at least $2.00; our belief that we are improving cash flow with a $1 billion opportunity; and ourexpectation for additional cash flow improvements and our long-term target expectations for primary working capital and capital spending. These forward-looking statements involve risks and uncertainties that could cause actual results to differ materially from those predicted in any such forward-looking statements. Such factors, include, but are not limited to, continued higher input costs, pricing actions, increased competition, our ability to differentiate our products from private label products, increased costs of sales, our ability to realize the expected cost savings and spending from our planned restructuring program, unexpected safety or manufacturing issues, FDA or other regulatory actions or delays, unanticipated expenses such as litigation or legal settlement expenses, our indebtedness and ability to pay our indebtedness, the shift in our product mix to lower margin offerings, risks from operating internationally, our inability to integrate the LU biscuit business and tax law changes. For additional information on these and other factors that could affect our forward-looking statements, see our filings with the SEC, including our most recently filed Annual Report on Form 10-K/A and subsequent reports on Forms 10-Q and 8-K. We disclaim and do not undertake any obligation to update or revise any forward-looking statement in this presentation.

4
Strategic Turnaround
Operational Turnaround
Financial Turnaround

BalanceCost & Quality
ExploitSales
CapabilitiesReframe
CategoriesRewire for
Growth
1 2 3 4
5

Unprecedented input cost inflationTotal Input Costs
+$1.3Bn+$3.3Bn
vs. 2006
+23%
2006 2007 2008E
6Source: Company estimates

Doingwhat we said we would do
7

We’re building momentum
8

We’ll deliver GAAP EPS of at least $2.00 in 2009
9
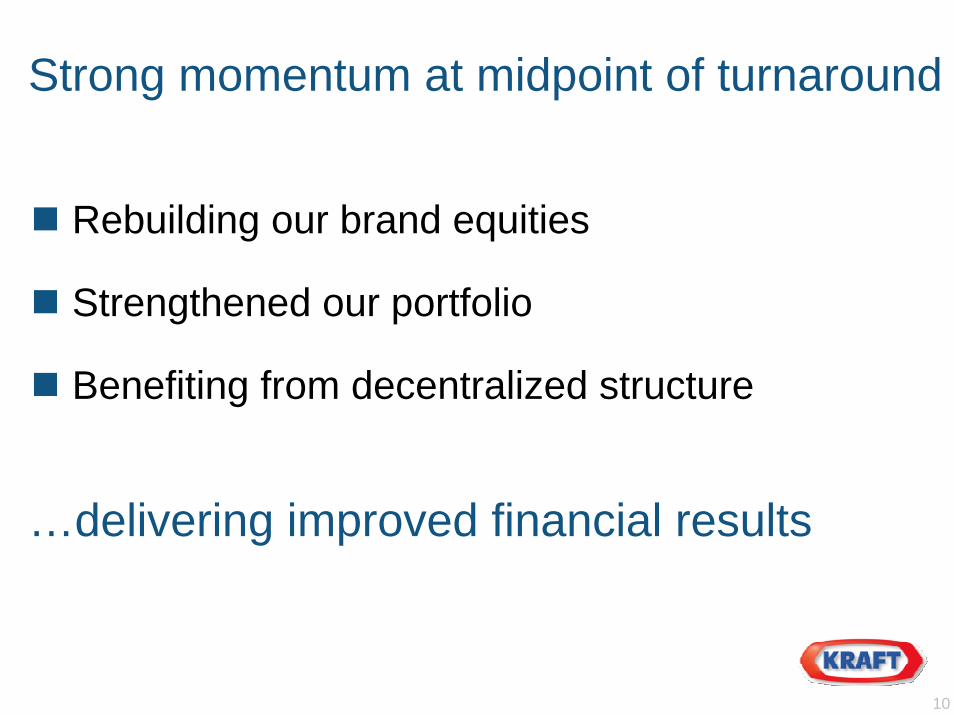
Strong momentum at midpoint of turnaround
Rebuilding our brand equities
Strengthened our portfolio
Benefiting from decentralized structure
…delivering improved financial results
10

Rebuilding our brand equities
11
Reframing Value PropositionInvestments Paying Off

Leveraging our portfolio breadth
12

Solid volume/mix despite pricing
6.2%
4.0%
pp contribution 1.5%PricingVolume/Mix
7.5%
0.70.8
3.0
1.0
4.1
2.1
1.7
5.8
Organic revenue growth profile*
H1 ‘082006 H1 ‘07 H2 ‘07
13* Reported net revenue growth was 0.7% in 2006; 6.3% in H1 ’07; 10.4% in H2 ’07; 21.1% in H1 ’08. See GAAP to Non-GAAP reconciliation at the end of this presentation

Strengthened our portfolio
Exited several businesses that did not fit− VeryFine and Fruit 2O− Post cereals− European salty snacks
Acquired LU biscuits− Integration on track− Business growing strongly− EPS accretive in 2008
14

Benefiting from decentralized structure
Faster reaction to marketplace− Taking the lead on cost-driven pricing− Cutting inefficient trade spending
Tightly controlling costs
15

Improving profitability while we invest(ex items*)
16
33.7%
Q1 ‘08
36.1%
Q2 ‘08
31.2%
Q4 ‘07
Gross margin
15.3%
34.8%Adjusted**
Operating incomemargin 12.4% 13.9%
Adjusted**11.4%
Q4 ‘07 Q1 ‘08 Q2 ‘08
* Reported gross profit margin was 31.0% in Q4 2007, 33.6% in Q1 2008 and 36.2% in Q2 2008. Reported operating income margin was 10.0% in Q4 2007, 11.2% in Q1 2008 and 13.5% in Q2 2008. See GAAP to Non-GAAP reconciliation at the end of this presentation. ** Adjusted for $150 million gain related to certain commodity hedges

Returning Kraft to reliable growth
2007: Investment
2008: Sequential improvement
2009: We hit our stride− At least 4% organic revenue growth− 7%-9% EPS growth
17

18
Strategic Turnaround
Operational Turnaround
Financial Turnaround
19
Sanjay KhoslaPresident, Kraft International

International a vital part of Kraft
41%$16 Bn
Net Revenue
34%$1.7 Bn
Operating Income
202007 pro-forma estimated results including LU biscuit, excluding Post cereal.
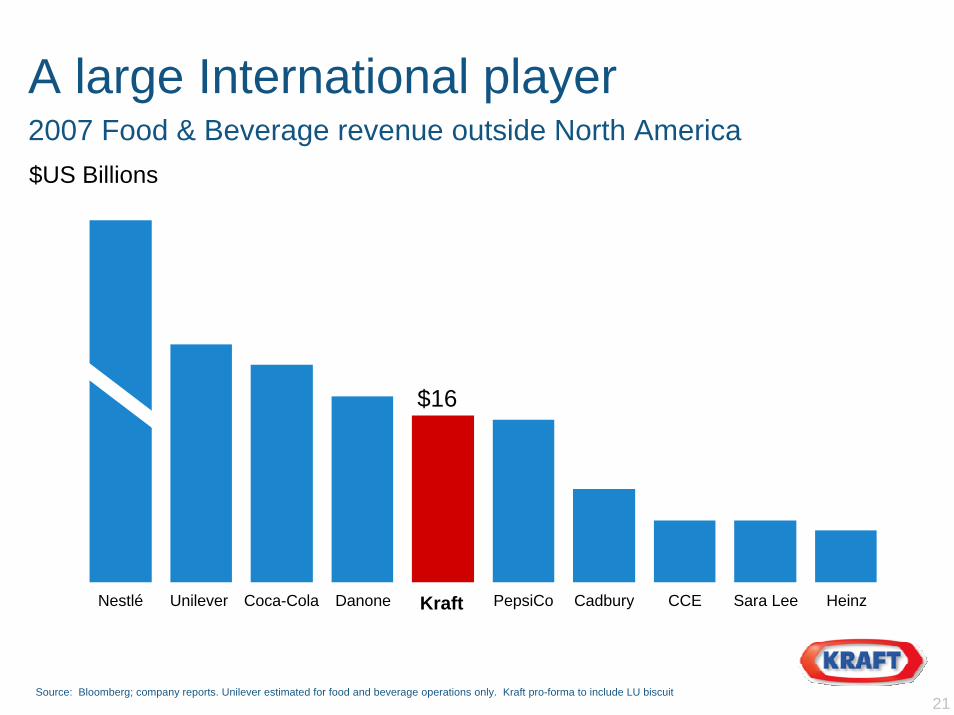
A large International player2007 Food & Beverage revenue outside North America
Nestlé Kraft
$16
Unilever Coca-Cola Danone CCEPepsiCo Cadbury Sara Lee Heinz
$US Billions
21Source: Bloomberg; company reports. Unilever estimated for food and beverage operations only. Kraft pro-forma to include LU biscuit

But not performing up to potentialKraft International
2003-2006 CAGR
2.4%Organic revenue growth*
22
(3.5)%
Operating income growthEx items*
* See GAAP to Non-GAAP reconciliations at the end of this presentation

BalanceCost & Quality
ExploitSales
CapabilitiesReframe
CategoriesRewire for
Growth
1 2 3 4
23

Three pillars to rewire Kraft International
1. Win locally, leverage globally
2. Build management depth
3. Focus where we can win
24

1. Win locally, leverage globally
Established a more flexible, decentralized business model
Empowered business units with full P&L responsibility
Linked pay structure to local results
Ensured leveraging of global expertise
25

2. Build management depth
Best of home-grown talent
Experienced international managers from the outside
Key leaders from LU biscuits
26

3. Focus where we can win
5 Categories
10 Brands
10 Markets27

5 Categories
Snacks Beverages
BiscuitsBiscuits
PowderedBev
PowderedBev
CheeseCheeseChocolateChocolate
CoffeeCoffee
Biscuits
Chocolate
Powdered Beverages
Coffee
Cream Cheese
28
Global Biscuits leader
Number 1 in key markets
More than 4X largest competitor
Seamless integration of LU biscuits
Accretive to earnings this year
29
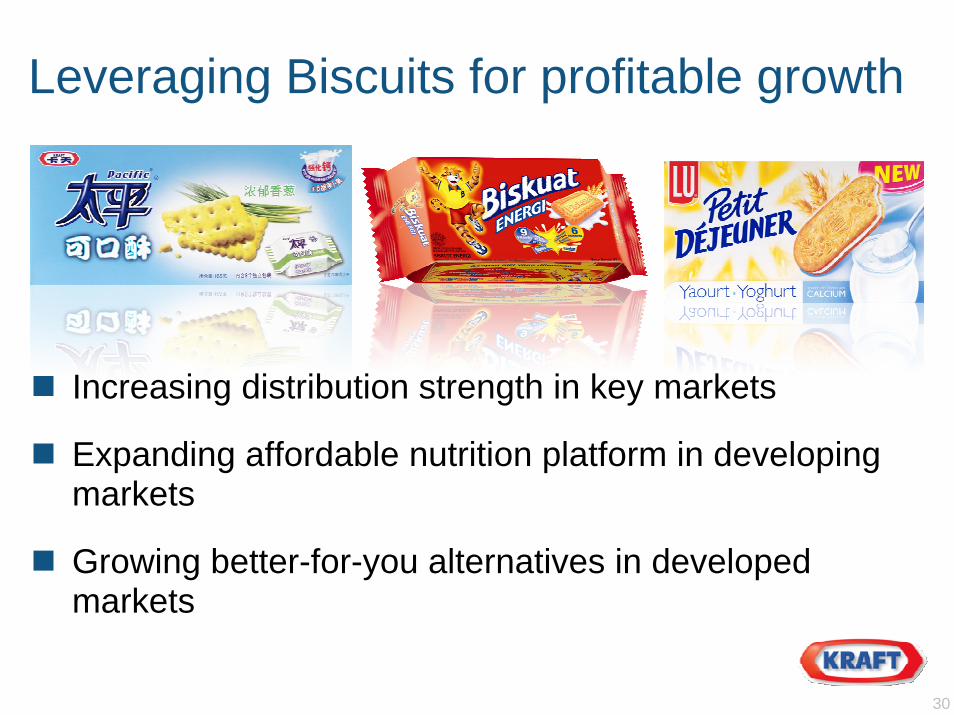
Leveraging Biscuits for profitable growth
Increasing distribution strength in key markets
Expanding affordable nutrition platform in developing markets
Growing better-for-you alternatives in developed markets
30

Leveraging strong Snacks position for growthRevenue rank versus competition by region
EU EEMA LA APBiscuits 1 1 1 1Chocolate 3 1 2
31
Source: Euromonitor, AC NielsenKraft does not compete in this region

Strong share positions in all 5 categoriesRevenue rank versus competition by region
EU EEMA LA APBiscuits 1 1 1 1Chocolate 3 1 2Powdered Beverages 1 1 1Coffee 1 2Cream Cheese 1 1 1
32
Source: Euromonitor, AC NielsenKraft does not compete in this region

10 BrandsComposite organic revenue growth
H1 2008
14%11%
2007
6%
’03-’06CAGR
33

Building a global icon, market by market
34
Oreo in Asia for more than 10 years but not growing
Reframed into individually-wrapped, wafer forms
Extending into all channels, new countries
2007 Oreo sales +51%; +46% 2008 first half

Trading up our power brands
35
Improving quality, increasing marketing on the core
Moving from mainstream to upper mainstream
Higher margins from trading up consumers
10% growth in 2007, 18% growth 2008 first half
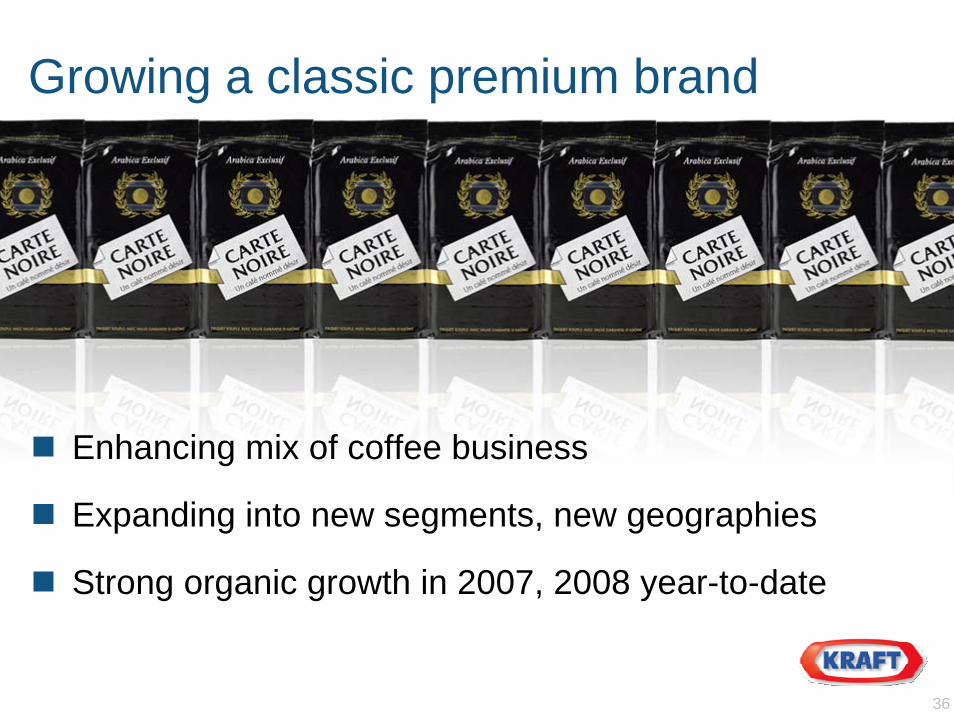
Growing a classic premium brand
Enhancing mix of coffee business
Expanding into new segments, new geographies
Strong organic growth in 2007, 2008 year-to-date
36

10 Markets60% of international revenue; 70% of profit
37

10 Markets4 Growth Engines
38

10 Markets4 Growth Engines6 Scale Markets
39

Three pillars to rewire Kraft International
1. Win locally, leverage globally
2. Build management depth
3. Focus where we can win
40

Gaining momentum11.7%
2.4%
03-06 CAGR
6.8%Organic RevenueGrowth*
Kraft International
2007 H1 2008
15.0%**
(3.5)%
3.0%
Operating IncomeGrowth (ex items)*
2007 H1 2008
03-06 CAGR
* See GAAP to Non-GAAP reconciliation at the end of this presentation** Organic OI growth (excluding currency and LU biscuit); See GAAP to Non-GAAP reconciliation at the end of this presentation
41

Best is yet to come
Organic Net Revenue Growth* Margin
2003-2006 CAGR
LTTarget
LTTarget
European Union (0.5) 1-3 ++
Developing Markets 7.4 8-10 +
42* See GAAP to Non-GAAP reconciliation at the end of this presentation

International is key to Kraft’s growth
Right strategy
+ Right people in the right places
+ Right focus
43

International is key to Kraft’s growth
Right strategy
+ Right people in the right places
+ Right focus
= Powerful growth engine for Kraft
44

45
Tim McLevishChief Financial Officer

46
Strategic Turnaround
Operational Turnaround
Financial Turnaround

Long-term growth model
Pricing and productivity cover input cost inflation
Volume and mix drive margin expansion
47

Long-term growth model
Organic Revenue Growth 4%+
Manufacturing, Overhead Leverage 2-3pp
Cash Flow Leverage & Tax Rate 1-2pp
Long-Term EPS Growth 7%-9%
48

Near-term drivers different
Cost-driven pricing a bigger factor
Volume and mix pressure due to pricing
Driving greater cost reductions to protect investments for long-term growth
49

Tightly controlling costs
Greater savings from Restructuring− Total program savings of $1.4 billion; +$200mm− Savings to reach $1.1 billion in 2008 − Spending $900 million in 2008; $3.0 billion total program
Savings beyond Restructuring− Costs into P&L as ordinary cost of doing business− Continue to optimize manufacturing network− Reduce overhead costs by at least 1% of Net Revenue
50

2008 Guidance update
Organic net revenue growth at least 6%
EPS excluding items at least $1.88− Adjusted downwards by $(0.04) from exiting
Post cereals in August− Effective tax rate ~33.0%
51

2009 Guidance
Organic net revenue growth at least 4%− Impact from pricing dependent on input cost trends
GAAP EPS at least $2.00− Double-digit growth from continuing operations,
excluding items− $200-300 million spending on cost-saving
initiatives− $(0.03) residual impact from exiting Post cereals
52

$1 billion annual cash flow improvement
Earnings growth− “Pay as you go” restructuring
Other opportunities over time− Primary working capital below 11% of net revenue− Capital Spending below 3% of net revenue
53

Summary
Gaining momentum at midpoint of turnaround
Strengthening our global portfolio
Driving improved financial results
54

AppendixGAAP to non-GAAP reconciliation
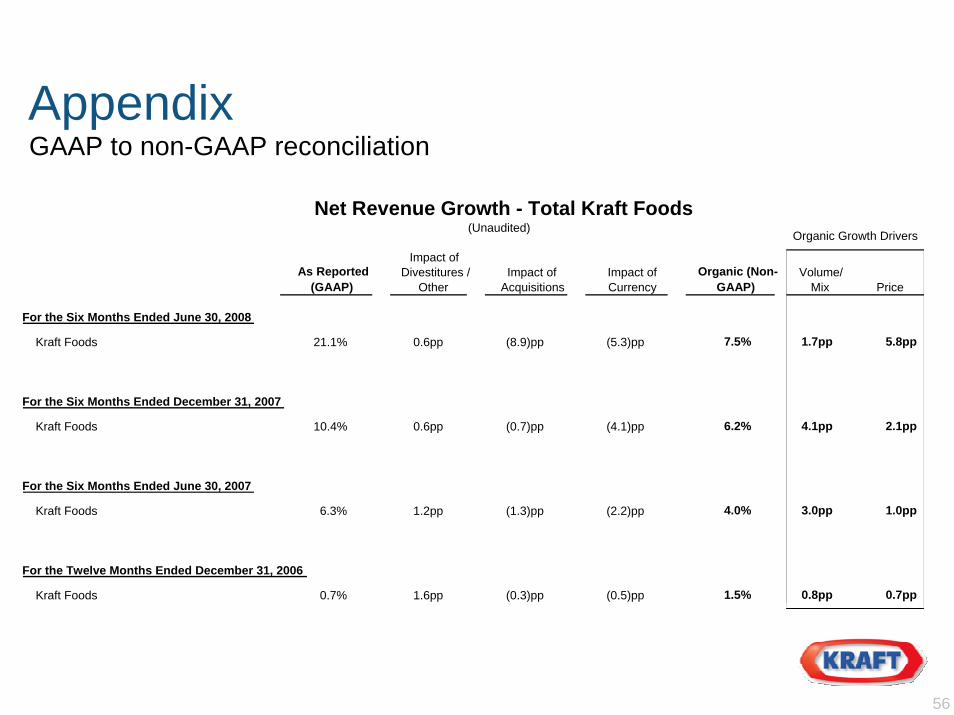
(Unaudited)Net Revenue Growth - Total Kraft Foods
Organic Growth Drivers
56
As Reported (GAAP)
Impact of Divestitures /
OtherImpact of
AcquisitionsImpact of Currency
Organic (Non-GAAP)
Volume/Mix Price
For the Six Months Ended June 30, 2008
Kraft Foods 21.1% 0.6pp (8.9)pp (5.3)pp 7.5% 1.7pp 5.8pp
For the Six Months Ended December 31, 2007
Kraft Foods 10.4% 0.6pp (0.7)pp (4.1)pp 6.2% 4.1pp 2.1pp
For the Six Months Ended June 30, 2007
Kraft Foods 6.3% 1.2pp (1.3)pp (2.2)pp 4.0% 3.0pp 1.0pp
For the Twelve Months Ended December 31, 2006
Kraft Foods 0.7% 1.6pp (0.3)pp (0.5)pp 1.5% 0.8pp 0.7pp

AppendixGAAP to non-GAAP reconciliation
(Unaudited)Net Revenue Growth - Kraft International
Impact of Divestitures /
OtherOrganic (Non-
GAAP)As Reported
(GAAP)Impact of
AcquisitionsImpact of Currency
For the Years Ended:
2004European UnionDeveloping Markets
International
6.2%4.8%5.7%
3.2%13.9%7.0%
(0.6)%11.2%3.9%
19.2%17.1%18.4%
56.9%40.0%50.1%
2.0pp 0.0pp(0.7)pp
(10.1)pp(1.8)pp(7.1)pp
(1.9)%2.8%0.5pp
1.4pp (0.2)pp (0.2)%
2005European UnionDeveloping Markets
International
1.0pp 0.0pp (3.1)pp 1.1%0.6pp 0.0pp (4.6)pp 9.9%0.9pp 0.0pp (3.6)pp 4.3%
2006European UnionDeveloping Markets
International
0.2pp (1.7)pp0.0pp
1.4pp(2.1)pp
0.1pp
(0.7)%9.6%3.2%
0.5pp0.3pp (1.1)pp
2007European UnionDeveloping Markets
International
0.0pp (5.1)pp (10.5)pp(5.4)pp(8.5)pp
3.6%11.5%
6.8%0.0pp (0.2)pp0.0pp (3.1)pp
For the six months ended June 30, 2008:European UnionDeveloping Markets
International
1.7pp (37.2)pp (15.0)pp(9.9)pp
6.4%19.3%11.7%
0.0pp (10.9)pp0.9pp (26.4)pp (12.9)pp
Compound Annual Growth Rate, 2003 - 2006:European UnionDeveloping Markets
International
(0.5)%7.4%2.4%
57
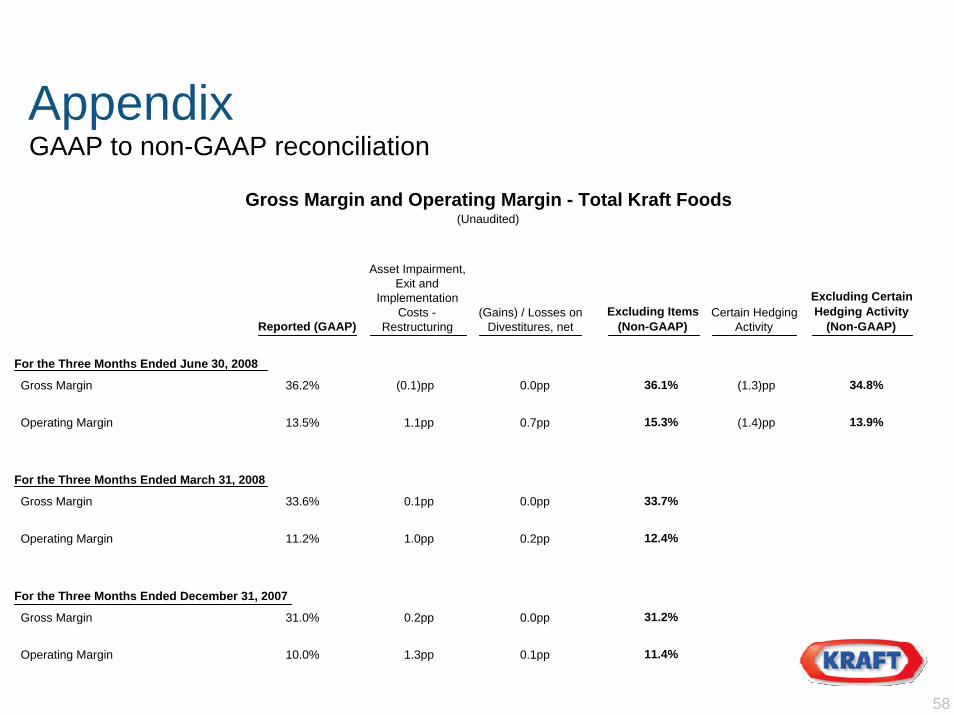
AppendixGAAP to non-GAAP reconciliation
Gross Margin and Operating Margin - Total Kraft Foods(Unaudited)
Asset Impairment, Exit and
Implementation Costs -
Restructuring
Excluding Certain Hedging Activity
(Non-GAAP)Excluding Items
(Non-GAAP)(Gains) / Losses on
Divestitures, netCertain Hedging
ActivityReported (GAAP)
For the Three Months Ended June 30, 2008
Gross Margin
Operating Margin
For the Three Months Ended March 31, 2008
Gross Margin
Operating Margin
For the Three Months Ended December 31, 2007
Gross Margin
Operating Margin
36.2%
13.5%
33.6%
11.2%
31.0%
10.0%
36.1% 34.8%(0.1)pp 0.0pp (1.3)pp
15.3% 13.9%1.1pp 0.7pp (1.4)pp
33.7%0.1pp 0.0pp
12.4%1.0pp 0.2pp
31.2%0.2pp 0.0pp
58
11.4%1.3pp 0.1pp

AppendixGAAP to non-GAAP reconciliation
Operating Income Growth - Kraft International(Unaudited)
Asset Impairment, Exit and
Implementation Costs -
Restructuring
Asset Impairment and Other Costs -Non-Restructuring
Excluding Items (Non-GAAP)
(Gains) / Losses on Divestitures, netReported (GAAP)
For the Twelve Months Ended December 31, 2004
Operating Income Growth (33.0)% 15.6pp 3.4pp 2.1pp (11.9)%
For the Twelve Months Ended December 31, 2005
Operating Income Growth 20.3% (7.9)pp (4.4)pp (9.3)pp (1.3)%
For the Twelve Months Ended December 31, 2006
Operating Income Growth (14.1)% 14.2pp 14.0pp (10.7)pp 3.4%
For the Twelve Months Ended December 31, 2007
3.0%Operating Income Growth 10.2% (12.9)pp (11.2)pp 16.9pp
2003 - 2006 Compound Annual Growth Rate (3.5)%
59

AppendixGAAP to non-GAAP reconciliation
Organic Operating Income Growth - Kraft International(Unaudited)
Asset Impairment and Other Costs -
Non-Restructuring
Asset Impairment, Exit and
Implementation Costs -
Restructuring
LU Acquisition, net of
Integration Costs Organic
(Gains) / Losses on
Divestitures, net
Excluding Items
(Non-GAAP)
Impact ofDivestitures /
OtherReported (GAAP) Currency
For the Six Months Ended June 30, 2008
Operating Income Growth 43.6% 53.0% 15.0%(8.9)pp 0.7pp 17.6pp 1.6pp (11.1)pp (28.5)pp
60