separation of mercury from voc’s and selective detection using gold film amalgamation and...
TRANSCRIPT
Separation of mercury from VOC’s and Separation of mercury from VOC’s and selective detection using gold film selective detection using gold film
amalgamation and photoionizationamalgamation and photoionization
Dr. Jack N. Driscoll & Jennifer MaclachlanPID Analyzers, LLC
Sandwich, MA 02563ACS Spring National Meeting, Denver, CO
Paper # ANYL 15March 23, 2015
1Advances in Analytical Separations

We used a sensitive but nonspecific photoionization detector (PID) with a 10.6eV lamp to measure mercury, which has an ionization potential of 10.43eV. The PID responds to both mercury and VOC’s so the VOC’s have to be removed to make the technique specific for mercury.The chemistry of the gold/mercury amalgam makes this method specific for mercury and eliminates interferences from VOC’s. This technique also concentrates the sample making the method sensitive to sub ppb levels.
Advances in Analytical Separations 2
OverviewOverview

IntroductionIntroduction• Hgo has long been detected by non specific
techniques such as UV absorbance (253.7 nm). Fluorescence is also a popular non specific technique for Hgo
• The reaction of mercury vapor (Hgo) with gold (Au) is used to concentrate the Hg while removing any potential interferences
• The free mercury is desorbed from the amalgam by rapidly heating to 500o C
• This amalgamation reaction turns non specific Hg methods into specific ones.
3Advances in Analytical Separations

Introduction (cont.)Introduction (cont.)• Photoionization (PID) is a technique that has been used
primarily for ppb detection of VOC’s.• We report here, for the first timeWe report here, for the first time, that Hgthat Hg00 with its ionization with its ionization
potential (IP) of 10.4 eV can be detected at low ppb levels potential (IP) of 10.4 eV can be detected at low ppb levels (using the gold pre concentrator) with the 10.6 eV lamp in our (using the gold pre concentrator) with the 10.6 eV lamp in our PID.PID.
• A known volume of air containing Hgo is passed over a gold substrate at ambient temperatures to form an amalgam (Au/Hg). An ambient nitrogen flow purges and removes VOC’s and water. The gold substrate is rapidly heated to 500oC to desorb only mercury vapor specifically into the PID
• We will describe our work on the detection of ppb levels of Hg in air & water in this presentation.
4Advances in Analytical Separations

Photoionization ProcessPhotoionization Process
R + hν => R+ + e- Where: R is any molecule with an Ionization Potential 10.6 eV
or less.Hg IP = 10.4 eVHg IP = 10.4 eVhν is a high energy photon (10.6 eV)
The R+ ions are collected in an ionization chamber adjacent to the UV lamp; the current is proportional to concentration over a range of 10⁷.So it has a very wide dynamic range.
5Advances in Analytical Separations
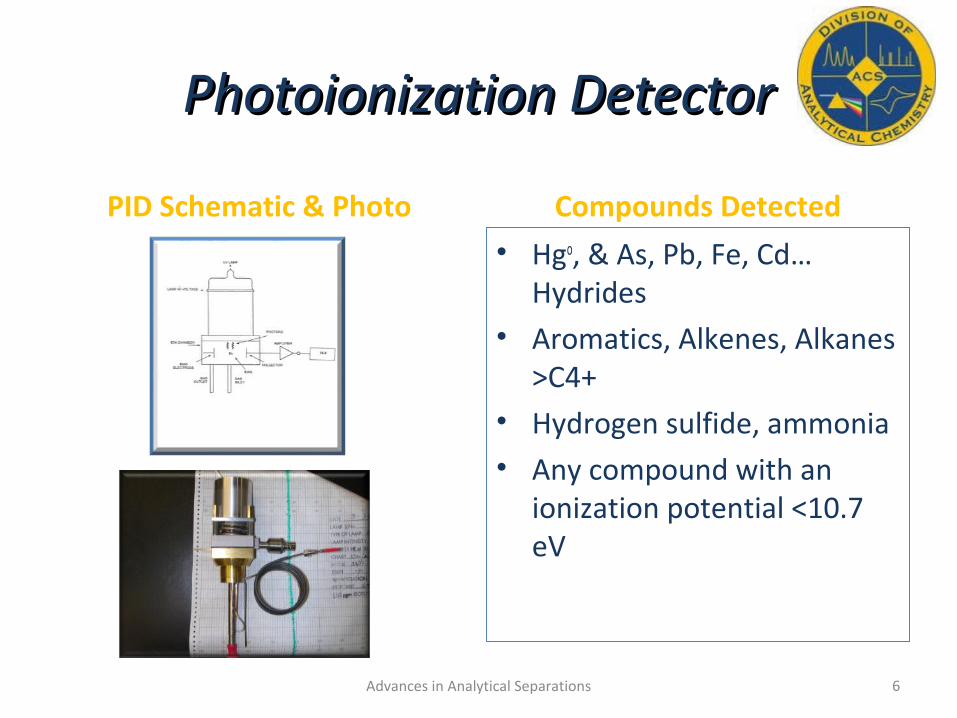
Photoionization DetectorPhotoionization Detector
PID Schematic & Photo Compounds Detected
• Hgo, & As, Pb, Fe, Cd… Hydrides
• Aromatics, Alkenes, Alkanes >C4+
• Hydrogen sulfide, ammonia• Any compound with an
ionization potential <10.7 eV
6Advances in Analytical Separations

List of Ionization PotentialsList of Ionization Potentials
Name Formula Ionization Potential (eV)
Methane CH4 12.48
Oxygen O2 12.08
Water H2O 12.59
Arsine AsH3 10.5
Phosphine PH3 10.1
Mercury Hgo 10.4
Benzene C6H6 9.24
Toluene C7H8 8.82
O-Xylene C8H10 8.56
Ethylene C2H4 10.15
Hydrogen telluride H2Te 9.14
Germane GeH4 10.53
Advances in Analytical Separations 7

Applications of the GC/PID-Applications of the GC/PID-HC AnalysisHC Analysis
• First commercial PID was introduced by HNU Systems (Driscoll) at Pittcon 1976 in Cleveland. The detector was described as being 50x more sensitive than the FID for aromatic HC
• 1978- EPA method 602 for aromatics in drinking water recommended the HNU Model PI52 since it was the only PID commercially available
• Drinking water- EPA 602b, 502.3, 506, • Solid waste- EPA SW846. 8021, 8260, • Soil –OSW 8021B, EMMI 1997, OSW 8020B, • Solid waste- 1996B, OSW 5021• Air- TO3, TO14• OSHA- Tetra ethyl lead, Ethylene oxide• PID/FID ratios for HC identification- basis of >40 state & EPA methods for
gasoline hydrocarbon samples instead of dual column confirmation• SINCE 1976 the primary application for the PID has been HC Analysis
8Advances in Analytical Separations

Air and Water Hg MethodsAir and Water Hg Methods
• Hg- Air– Collect, pre concentrate (Au/Hg amalgam), and
make sample specific for Hgmake sample specific for Hgo then flash heat to the PID for detection
• Hg- Water– Hg using H+/NaBH4 to reduce Hg+2 to Hgo
– Analysis collection with Au/Hg amalgam & then thermal desorption with PID detection
9Advances in Analytical Separations

Mercury in AirMercury in Air
• Ambient air sampling usually involves looking for low levels (0.5 to 5 ng/m3) of mercury (typical sampling times can range from 5 to 30 min.
• For workplace air sampling, the levels are typically higher (0-50 µg/m3 or 0-6 ppb) and prone to sudden fluctuations. Shorter sampling times can be used with an increased sampling frequency. We’re working with these levels in this paper.
10Advances in Analytical Separations

Air Sample Collection SystemAir Sample Collection System
Description• Sample collection is
via a metering pump for a specific period of time. As seen in the next slide, the detection limit by PID is approximately at the OSHA PEL so sample concentration is necessary. We use a gold film pre concentrator.
Collection
11Advances in Analytical Separations

Hg in NHg in N22 Detection by PID Detection by PID
100 ppb Hg direct injection Description• A Hgo permeation tube (at
50oC) was purged with a constant flow of nitrogen and directed into the PID. The results are shown in the figure on the left. The response to Hgo is quite strong and reproducible. The detection limit for Hgo is < 10 ppb for direct injection of 1 cc of Hgo in N2. Note this would not be specific if VOC’s were present.
12Advances in Analytical Separations

12.5 ppb Hg w/gold pre concentrator12.5 ppb Hg w/gold pre concentrator
Description• Here, the Hg opermeation
tube at 20oC is run through the gold pre concentrator (GPC) for 2 minutes, wait for 30 seconds to establish a baseline, then flash heat to 500oC and introduce the sample to the PID. The detection limit here is about 100 ppt Hgo and this GPC ensures that it is specific for Hgo. This is sufficient for the OSHA limit but a much larger sample would be needed for ambient air.
Chromatogram
13Advances in Analytical Separations

Conversion from Conversion from µg/mg/m33 to ppb or ppt to ppb or ppt
• Hg values are frequently quoted in units of mg/m3 to convert to ppm/ppb/ppt see below:
MW Hg= 200.59 g/mole
ppb = ug/m3 x 24.45/ MW
ppb= µg/m3 x 0.12
ppt= ng/m3 x 0.12
14Advances in Analytical Separations

What What MetalsMetals have been Analyzed by GC/PID? have been Analyzed by GC/PID?
• Vien 1988 arsenic, selenium, tin and antimony (as hydrides) in natural waters
• Yamamoto 1992 As, Sb in natural waters• Cutter 1991, 2006 As, Sb; in natural waters• Haque 2007 As, in natural waters• Mergemeyer- no GC-just single element-Analysis has been by Hydride generation (with strong acidic reducing agents)-
generally with the metalloids using a liquid N2 trap/concentrator- These methods were not very popular and produced fewer than 7 papers in the last 25 years. This very sensitive method has been underutilized.
Driscoll & Maclachlan described a more sensitive GC/PID method a more sensitive GC/PID method at ACS/NOLA (2013) for As in Juices at sub ppb levels. No liquid nitrogen was needed to concentrate the sample. We also described HG/GC/PID methods for Pb, Cd & FePb, Cd & Fe at ACS in SF (2014).
Now we can add HgNow we can add Hgo with gold pre concentration/PID to the list of metals that can be detected specifically at sub ppb levels
15Advances in Analytical Separations

Jack and Jennifer at the 2013 R&D 100 AwardsJack and Jennifer at the 2013 R&D 100 Awards in Orlando, FL: Arsenic in Food & Water Analyzer in Orlando, FL: Arsenic in Food & Water Analyzer
Advances in Analytical Separations 16

Also presented at this meeting in Denver:Also presented at this meeting in Denver:Arsenic in drinking water samplesArsenic in drinking water samples
from Bangladesh from Bangladesh• CHED: Division of Chemical Education• 293 - Apparatus for ultratrace detection of arsenic in drinking water by hydride
generation gas chromatography with photoionization detection• View Session Detail
Author Block: William Borgeson1 , Seth Frisbie1 , Jack Driscoll2
1 Chemistry & Biochemistry, Norwich University, Brooklyn, New York, United States; 1 Chemistry & Biochemistry, Norwich University, Brooklyn, New York, United States; 2 PID Analyzers, LLC, Sandwich, Massachusetts, United States
• Abstract:The hydride generation technique is a common method to determine trace amounts of arsenic in drinking water. This method produces a considerable amount of pressure which would be unsafe if carried out in a normal closed glass reaction vessel. A stainless steel reaction vessel was machined which could handle the pressure generated in the hydride generation technique as well as provide an oxygen free environment to reduce interferences. A sample loop was also constructed to reduce systematic error and ensure a uniform sample introduction into the gas chromatograph. A very sensitive photoionization detector was used. A calibration curve was then constructed to determine the dynamic range of the instrument. This instrument was validated by the analysis of highly characterized drinking water samples from Bangladesh.
Advances in Analytical Separations 17

Apparatus for ultratrace detection of arsenic in drinking water by hydride generation gas chromatography with
photoionization detection at #ACS Denver 2015
Advances in Analytical Separations 18

A New Method for the Analysis of ppb Levels ofA New Method for the Analysis of ppb Levels of Mercury in Air and Water Mercury in Air and Water
• At Pittcon 2015 in New Orleans, we reported for the eported for the first timefirst time, that Hgthat Hg00 with its ionization potential (IP) of with its ionization potential (IP) of 10.43 eV can be detected at low ppb levels with the 10.43 eV can be detected at low ppb levels with the 10.6 eV lamp in our PID via GC/PID.10.6 eV lamp in our PID via GC/PID.
• Instead of Au/Hg amalgam, we chose NIOSH method 6009 for collection(on a Hopcalite® tube) & concentration of a Hg air sample followed by dissolution in Nitric/HCl, followed by reduction with NaBH4 and specific analysis by GC/PID.
• Our work with the detection of ppb levels of Hg in air & water were presented.
Advances in Analytical Separations 19
Cold Vapor Mercury AnalysisCold Vapor Mercury Analysis
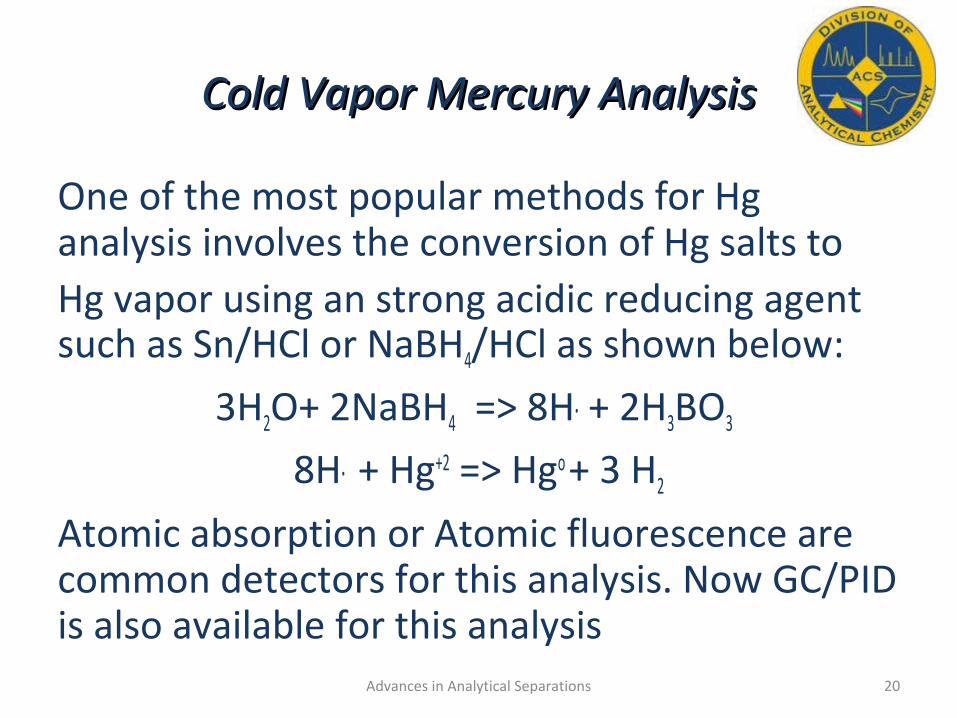
One of the most popular methods for Hg analysis involves the conversion of Hg salts to Hg vapor using an strong acidic reducing agent such as Sn/HCl or NaBH4/HCl as shown below:
3H2O+ 2NaBH4 => 8H. + 2H3BO3
8H. + Hg+2 => Hgo + 3 H2
Atomic absorption or Atomic fluorescence are common detectors for this analysis. Now GC/PID is also available for this analysis
20Advances in Analytical Separations

Mercury Generator for WaterMercury Generator for WaterDescription
• 25 ml of an aqueous sample containing ppb level of Hg salt is pipeted into the sparging vessel.
• Add 1 ml of concentrated HCl and screw the top on tight. Start the nitrogen purge at 50 cc/min and continue for 3-4 min.
• Start the teflon stirring bar, then add 1 cc of 4% NaBH4 with a syringe via the septum.
• Inject a number of samples via the 10 port valve. At low levels, it will take 10-13min to collect all the Hgo
• EPA drinking water standard for Hg0 is 2 ppb
Hydride Generator
21Advances in Analytical Separations

HG Generation & Detection by Au-Hg/PIDHG Generation & Detection by Au-Hg/PID
22Advances in Analytical Separations

Hg Analysis for Water SamplesHg Analysis for Water Samples
Hydride generation• The Hgo from the sparger
is collected on a gold pre concentrator continuously at a flowrate of 50 cc/min for a period of 10-12 minutes. Then purged with nitrogen for 3 minutes to remove water vapor or VOC’s and finally flash heated to 500oC to release Hgo for the PID to detect. A typical analysis is shown in the Fig. to the right
Hg concentration
23Advances in Analytical Separations
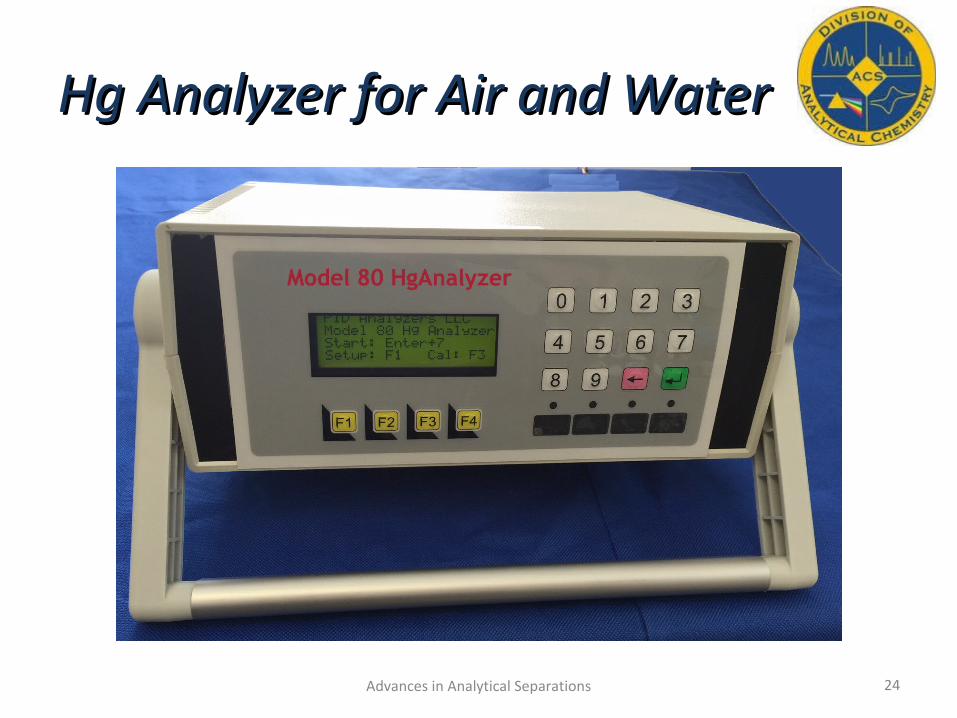
Hg Analyzer for Air and WaterHg Analyzer for Air and Water
Advances in Analytical Separations 24

Comparison of HGAAS & HG/PIDComparison of HGAAS & HG/PID
HG/AAS• Cleans up sample• Concentrates the sample• Uses a Hg lamp/uv
absorption• Detection limits in low or
sub ppb• Sample concentrated
using Au amalgam (gold pre concentrator
HG/PID
• Cleans up the sample• Reduces the Hg salt to elemental
Hgo that the PID can detect• Major improvements in PID
sensitivity and optimization, reduces the detection limit to < 100 ppt
• Air sample is concentrated using gold preconcentrator
• Water samples are concentrated using hydride generation and a gold pre concentrator
• PID is 10-50 times more sensitive than AAS
25Advances in Analytical Separations

ConclusionsConclusions• Mercury (IP= 10.4 eV) is detected with sub ppb
sensitivity by the PID (10.6 eV lamp) with gold pre concentration (first time reported).
• Mercury vapor in the air can be collected and pre concentrated using a gold substrate. Hg detection levels down to ppt are achievable by PID.
• Mercury in water can be detected by PID or with improved specificity by gold pre concentration after reduction with NaBH4 (hydride reduction) Part per trillion levels of Hg can be detected.
• This new method of analysis for Hg has significant potential for measuring ppt levels of Hg (specifically) in air, water and food analysis.
26Advances in Analytical Separations

Connect with us!Connect with us!
27
@pidguy @pidgirl
www.hnu.com
www.facebook.com/pidanalyzers
www.twitter.com/pidguy
www.twitter.com/pidgirl
www.analyzersource.blogspot.com
www.linkedin.com/in/johnjackdriscoll
www.linkedin.com/in/jenniferlmaclachlan
Advances in Analytical Separations