separation of ions of lead and cobalt from solutionpirun.ku.ac.th/~fsciass/pdf/thesis apisit's...
TRANSCRIPT

1
SEPARATION OF LEAD AND COBALT IONS FROM SOLUTION
BY 2-(2′-THIAZOLYLAZO)-P-CRESOL CHELATING RESIN
INTRODUCTION
Cobalt is a grayish lustrous metal. It is brittle, hard, transition metal with
magnetic properties similar to those of iron. The properties of cobalt are shown in
Table 1. Cobalt is not found as the free metal. The abundance of cobalt in the earth’s
crust is 30.0 ppm. More than 200 ores are known to contain cobalt but only a few are
of commercial value. The more important are arsenides and sulfides such as smaltite,
CoAs2, cobaltite, CoAsS, and linnaeite, Co3S4.
Cobalt is used in magnet steels, stainless steels, alloys, jet turbines, gas turbine
generators and electroplating because of its appearance, hardness, and resistance to
oxidation. Cobalt salts are used for the production of brilliant and permanent blue
colors in porcelain, glass, pottery, tiles, and enamels. Cobalt compounds are used as
paint pigments. Cobalt-60, an artificial isotope, is an important γ-ray source, and is
extensively used as a tracer and a radiotherapeutic agent. Single compact sources of 60Co are readily available.
Cobalt metal powder is a fire hazard. Evidence indicates that minute quantities
of cobalt may be detrimental to higher plant life, particularly in water and sand
cultures. Cobalt toxicity is characterized by a chlorosis similar to that induced by lack
of iron. Growing cattle can consume up to 50 mg cobalt per 100 lb body weight
without ill effects. Sheep can tolerate up to 160 mg daily per 100 lb weight for at least
eight weeks without harmful effects. Higher dosages are injurious.

2
Table 1
Some properties of cobalt and lead
Property Cobalt Lead
Atomic number
Number of naturally occurring isotopes
Atomic weight
Electronic configuration
Electronegativity
Melting point / °C
Boiling point / °C
Thermal conductivity / W m-1 K-1
Density (20 °C) / g cm-3
Electrical resistivity (20 °C) / µΩ cm
27
1
58.933
[Ar] 3d7 4s2
1.7
1495
2927
100
8.9
6
82
4
207.2
[Xe] 4f14 5d10 6s2 6p2
1.6
327.5
1749
35
11.34
21
Source: Greenwood (1997)
Lead is a bluish-white lustrous metal. The properties of lead are shown in
Table 1. Lead is very soft, highly malleable, ductile, and a relatively poor conductor
of electricity. It is very resistant to corrosion but tarnishes upon exposure to air.
Lead is found in nature sparingly. It is present in ores such as galena (lead
sulfide, PbS), anglesite (lead sulfate, PbSO4), minim (a form of lead oxide with
formula Pb3O4), cerussite (lead carbonate, PbCO3) and other minerals. Galena is the
most important source.
Lead is widely used in alloys, cable covering, plumbing, ammunition, storage
batteries, paints, solder, containing corrosive liquids and insecticides. The oxide of
lead is used in producing fine "crystal glass" and "flint glass" with a high refractive
index for achromatic lenses. Tetraethyl lead (PbEt4), antiknock additive substance, is
still used in some grades of petrol (gasoline) and is responsible for a considerable
portion of the lead found in the biosphere. It is being phased out in many countries on

3
environmental grounds. Typical symptoms of lead poisoning are cholic, anaemia,
headaches, convulsions, chronic nephritis of kidneys, brain damage and central
nervous-system disorders. It acts by complexing with oxo-groups in enzymes and
affects virtually all steps in the process of haem synthesis and porphyrin metabolism.
From the hazard of cobalt and lead, it is important to separate these elements
from aqueous solutions.
Thiazolylazo dyes and its derivatives can be used as sensitive chromogenic
reagents, complexing agents, reagents for spectrophotometric and extraction-
photometric determination of many metal ions (Jensen, 1960). These compounds are
easily prepared by diazotisation of 2-aminothiazole and then coupling the reactive
diazotate formed with phenolic substances. a
Many procedures for determination, preconcentration and separation of
several metals have been developed which usually involved with various materials for
the adsorption such as polyurethane foam loaded with TAC collected copper, cobalt,
nickel, zinc and cadmium (Tanaka, 1982), heterocyclic azo dyes supported on silica
gel was used as a chelating resin for adsorption of uranium (Ueda, 1985), Amberlite
XAD resin was used for the preconcentration of zinc(II), cadmium(II), nickel(II) and
lead(II) from aqueous solutions (Saxena, 1994).
Chloromethylated polystyrene divinylbenzene loaded with 3,5-methylpyrazole
was used for the adsorption of metal ions (Myasoedova, 1976). It was used because of
its good physical and chemical properties such as porosity, high surface area,
durability and purity.
In this work, 2-(2′-thiazolylazo)-p-cresol (TAC) which is derivative of
thiazolylazophenol was prepared and used as chelating ligand for cobalt(II) and
lead(II). a

4
TAC is soluble in acidic and neutral solution, giving yellow color with a
maximum absorption at 372 nm and in strongly alkali solution, giving red color with a
maximum absorption at 532 nm. These hypsochromic (blue shift) and bathochromic
(red shift) shifts are due to protonation and ionization, respectively.
Figure 1
Source: Hovind (1975)
Chemical structure of 2-(2′-thiazolylazo)-p-cresol (TAC) in acidic, neutral
and alkali solution.
The complexation of TAC with cobalt(II) and lead(II) were determined by
using continuous variation method in acidic and alkali solutions.
The chelating resin was prepared by using chloromethylated polystyrene
divinylbenzene which was immobilized with 2-(2′-thiazolylazo)-p-cresol (TAC) for
separation of cobalt(II) and lead(II) from aqueous solutions and selectivity of this
chelating resin for cobalt(II) and lead(II) were studied.
acidic neutral alkali
CH3
OH
NN
N
S
CH3
OH
NN
N
S
CH3
O
NN
N
S
H

5
LITERATURE REVIEWS
1.
Synthesis of thiazolylazo derivatives and spectrophotometric determination
of metal ions
Kaneniwa (1959) synthesized 2-(2′-thiazolylazo)-p-cresol (TAC) by
diazotisation of 2-aminothiazole and then coupling with p-cresol. The crude product
was recrystallized in ethanol to gave TAC as brown needles, melting point of 131-
132 °C. The 0.1% methanolic solution of TAC became yellow to pink at pH 7.0-9.0.
The following compounds were similarly prepared and their change of color
according to pH studied [appearance, m.p., change of color (pH interval) given]:
thiazolylazo-resorcinol (TAR), red needles, 218-219 °C, yellow to deep orange (4.2-
6.2) and deep orange to red (8.2-10.2); thiazolylazo-β-naphthol (β-TAN), brown red
needles, 140-141 °C, orange to pink (8.2-10.0); thiazolylazo-α-naphthol (α-TAN),
brown red needles, 185-186 °C, slightly red to violet (5.4-7.4). These compounds
formed chelate complexes with Cu(II), Co(II) and Ni(II) to gave red, violet, and blue
solutions, respectively. f
Jensen (1960) synthesized 1-(2′-thiazolylazo)-β-naphthol-6-sulphonic acid
(TAN-6-S), 2-(2′-thiazolylazo)-p-cresol (TAC), 6-(2′-thiazolylazo)-resorcinol (TAR),
6-(2′-thiazolylazo)-orcinol (TAO) and 6-(2′-thiazolylazo)-1-oxy-3-dimethylamino-
benzene (TAM) which could be used as complexometric metal indicator. These azo
dyes were prepared by diazotisation of 2-aminothiazole and then coupling with
β-naphthol-6-sulphonic acid, p-cresol, resorcinol, orcinol and m-dimethylamino-
phenol, respectively. The compounds were investigated for their properties as metal
indicators for Th(V), La(III), UO2(II), Pb(II), Hg(II), Cu(II), Co(II), Ni(II), Zn(II),
Cd(II), Mg(II) and Ca(II). a
Komarek et al. (1979) studied the usefulness of several azo dyes for the
extraction concentration of traces of Cu(II), Ni(II), Co(II), Cd(II), and Zn(II) in iso-
BuCOMe and for their final determination by atomic absorption spectrophotometry

6
with an acetylene-air flame or using a graphite atomizer. The azo dyes: 1-(2-
pyridylazo)-2-naphthol, 2-(2-pyridylazo)-1-naphthol (Ι), 2-(2-benzothiazolylazo)-1-
naphthol, 2-(2-quinolylazo)-1-naphthol, 1-(2-thiazolylazo)-2-naphthol, 2-(2-
thiazolylazo)-4-methylphenol and 2-(2-thiazolylazo)-4-methoxyphenol were studied.
Procedures for determination of metals in salt solutions, potable waters and metallic
aluminium were given. By using electrothermal atomization on graphite, the detection
limits were 2.54, 2.47, 2.64, 0.045, and 0.13 µg/ml for Cu(II), Ni(II), Co(II), Cd(II),
and Zn(II), respectively. Atomic absorption spectrophotometry was also useful in the
study of extraction equilbria, and for finding the optimum extraction conditions for
these elements by heterocyclic azo dyes. a
Fumiaki et al. (1982) synthesized ligands Ι (R = Me, Et, Ph, Cl, R1 = R2 = H;
R = Me, R1 = H, R2 = OMe, Me; R = R2 = H, R1 = NMe2) by azo coupling of the
diazonium salt and the appropriate phenol and their acid dissociation constants were
studied. The complexes of Ι with Mn(II), Co(II), Ni(II), Cu(II), Zn(II), Cd(II) and
Pb(II) were prepared and their formation constants were determined. These
complexes had enhanced stability over the analogs without Me substitution of the
thiazole ring.
ligands Ι
Feng (1984) studied the complex formation reaction of Co(III) with 2-(2-
thiazolylazo)-5-(diethylamino)phenol and a method was developed for the
spectrophotometric determination of trace of cobalt. The composition of the 1:2
metal-ligand complex was determined by Job’s method and by the molar ratio method.
The complex had and apparent stability constant of 4.78x10¹⁰ and a molar
absorptivity of 7.69x10⁴ L mol-1 cm-1. Beer’s law was obeyed for 0-0.8 µg Co/ml.
N
S
N N
R
R1
R2HO
Me
Me

7
Interferences by various anions and cations were studied. The method was applied to
the determination of trace cobalt in natural water. a
Rathaiah and Eshwar (1985) studied the complexation between Pb(II) and 1-
(2′-thiazolylazo)-2-naphthol in faintly acidic media (pH 6.1-6.7), which formed a
reddish brown chelate solution in MeOH-H2O mixtures. The 1:1 complex exhibited
maximum absorbance at 575-580 nm in 40% MeOH, was stable for 36 hours, adhered
to Beer’s law for Pb(II) concentration of 0.2-6.0 µg/ml, had formation constant
(log K) of 5.30, and molar absorptivity 1.7x10⁴ L mol-1 cm-1. The method was applied
for the determination of lead content in an alloy.
Gandhi et al. (1990) synthesized three thiazolylazo dyes; 5-(2-thiazolylazo)-
2,4-dihydroxybenzoid acid (TARK), 2-(2-thiazolylazo)-p-cresol (TAC) and 1-(2-
thiazolylazo)-2-naphthol (TAN). They had been investigated as reagents for the spot
detection, ring oven identification and ring colorimetric detection of Cd(II), Pb(II) and
Zn(II). It was found that TAC was the most sensitive reagent for Cd(II), Pb(II) and
Zn(II). a
Ferreira et al. (1991) studied the reaction between Pb(II) and 2-(2-
thiazolylazo)-p-cresol (TAC) in the presence of Tergitol NPX (4 mg/ml). At pH 9.0-
10.0, an intensely colored complex was given which was stable for at least 4 hours.
The composition of the complex was 1:2 (Pb(II):TAC) and the log of the formation
constant was 11.92 ± 0.40. Beer's law was obeyed up to 6.0 µg/ml of Pb(II) at 650
nm. The apparent molar absorptivity at 650 nm was 2.07x10⁴ L mol-1 cm-1 and the
detection limit was obtained as 10.0 µg/ml of Pb(II). The method was applied to the
determination of Pb(II) in copper-base alloy. a
Masoud et al. (1995) studied the electronic absorption spectra of thiazolylazo
compounds in presence of different solvents. The pK-values of these compounds were
evaluated spectrophotometrically and pH-metrically and laid in the range of 4.30-
8.92. The position of the spectral bands and their intensities were pH-dependent, with
the presence of different isobestic points. The modes of ionization were assigned. The

8
formation constants of the Co(II), Ni(II) and Cu(II) complexes were evaluated. The
mechanisms of hydration and solvation of thiazolylazo compounds in dioxane were
discussed.
2.
Preparation of chelating resin for seperation of metal ions
Myasoedova et al. (1976) synthesized chelating adsorbent containing pyrazole
groups as substituent by aminating chloromethylated polystyrene divinylbenzene
copolymers with 3,5-methylpyrazole. The structure of this chelating resin can be
depicted as;
The adsorption of metal ions, which interacted with the pyrazole groups of the
adsorbent, depended on the solution acidity and the concentration of other elements.
Nakayama et al. (1982) prepared a new chelate-forming resin bearing -SH and
azo groups from a common anion- exchange res in by treatment with azothiopyrine -
disulfonic acid (Ι). The Ι-treated resin was very stable and highly effective for the
collection of Hg (II) by the batch and column methods and for adsorption of copper
and cadmium . In the column method , the amount of Hg (II) in solution could be
reduced to <0.5 µg/L. The Hg(II) adsorbed could be eluted with thiourea solution, and
the resin could be used repeatedly , especially for the treatment of wastewater .
Tanaka et al. (1982) studied polyurethane foam which loaded with Bu3PO4
solution of 2-(2-thiazolylazo)-4-mephenol (TAC) collected several metal ions, as
Cu(II), Ni(II), Co(II), Zn(II), and Cd(II), by immersing it in the sample solution, and
the color of the foam changes from yellow to green and greenish brown. The color
intensity of the foam was proportional to the metal concentration. When the foam
(1 cm x 1 cm x 1 cm, TAC: 0.5 mg, Bu3PO4 0.05 ml) was immersed for 5 min in 2 ml
of the sample solution buffered at pH 8.3 with NH4NO3-NH3 solution, the detection
HC
CH2 N
N
CH3
CH3
CH2

9
limit and absorption maximum wavelength were as follow; Cu(II) 0.5 ppm, 615 nm,
Ni(II) 0.2 ppm, 615 nm, Co(II) 0.2 ppm, 586 nm, Zn(II) 1 ppm, 598nm, and Cd(II)
2 ppm, 598 nm. The proposed method was applied to the determination of the metal
ion concentration in wastewater of plating industry.
Grote and Kettrup (1985) synthesized the ion-exchange resins containing S-
bonded dithizone and dehydrodithizone as functional groups. The adsorption of noble
metals and base metals on the ion-exchange resins were investigated. The reaction of
dehydrodithizone with chloromethylated polystrene yielded the ion-exchanger, P-TD.
The tetrazolium groups on P-TD were reduced to produce a chelating resin, P-D,
which contained S-bonded dithizone as the functional group. These sorbents were
used for adsorption of platinum group metal ions and Au(III). The distribution
coefficients as function of acidity were also studied. The desorption of precious metal
ions such as Au(III), Pd(II), Pt(IV), Ru(III), Rh(III), Os(III), Ir(II) and Ir(IV) from the
P-D and P-TD ion-exchange resins were studied by various eluents (6 M hydrochloric
acid, 2 M perchloric acid, amonium nitrate, sodium thiocyanate and thiourea). The
P-D ion-exchange loaded with precious metal ions was eluted with 4 M hydrochloric
acid for eluting the Ru(III), Rh(III) and Ir(V). Then the sorbed species of Au(III) and
Pd(II) were eluted with 10 ml of 5% thiourea in 0.1 M hydrochloric acid. For P-TD,
Pd(II) and Pt(IV) were eluted satisfactorily by thiourea in the absence of Ir(IV). Then
the loaded resin was eluted with 0.5 M thiocyanate which desorped Os(IV) and 50%
of Ir(IV). The P-D chelating resin was selective for separation of Pd(II) and Au(III).
P-D chelating resin was unsuitable for cyclic procedures whereas the P-TD anion-
exchanger was able to regenerate and utilize for selective separation of Pd(II), Pt(IV),
Os(IV) and Au(III).
Ueda et al. (1985) synthesized the chelating adsorbents, heterocyclic azo dyes
supported on silica gel, and investigated their adsorption behavior toward metal ions.
1-(2-Pyridylazo)-2-naphthol-silica gel and 2-(2-thiazolylazo)-p-cresol-silica gel show
greater affinity for UO22+ and ZrO2+ than for other metal ions like Cu(II), Cd(II),
Fe(II), Fe(III), and the alkali earths. Trace UO22+ could be quantitatively retained on
gel columns in the neutral pH region and at flow-rate 3-4 ml/min. The UO22+ retained

10
was easily eluted from the column bed by 9:1 (v/v) Me2CO-HNO3 determined by
spectrophotometry using Arsenazo-III. Matrix components in seawater did not
interfere, and the spiked recovery of UO22+ in artificial seawater averaged 98.6%, with
a relative standard deviation of 1.08%. Both gels were applied to the determination of
Uranium in seawater with satisfactory results.
Mao et al. (1986) studied the determination of trace uranium in wastewater by
using spectrophotometric method. A polystyrene-based macroporous resin containing
PAR was used for separation and enrichment of uranium from wastewater from
uranite mining with a recovery of >98%. UO22+ was quantitatively sorbed from the
wastewater at a pH of 5.5 in the presence of 1.2x10⁻⁶ M EDTA and eluted with 1 N
HCl. The preparation of the polystyrene-azo-PAR resin was discussed.
Pesavento et al. (1988) studied two sulfonated azo- dyes, which had a N-donor
atom in the diazo group and were known to complex heavy metal ions in aqueous
solution . They were sorbed by a strong- base anion- exchange resin (Dowex 1-X8)
simply by ion-exchange. The resin containing the dyes behaved like a chelating resin ,
able to sorbed Cu(II) and Ni(II) from aqueous solution , under proper conditio ns. The
acidity, ionic compound , volume of the aqueous solution and the amount and nature
of the sorbed ligand were the factors which determined the fraction of metal ion
sorbed when the batch technique was used.
Saxena et al. (1994) synthesized a very stable chelating resin matrix by
covalently linking Alizarin Red-S with the benzene ring of the polymer Amberlite
XAD-2 through an -N=N- group. The chelating resin was used for the
preconcentration of Zn(II), Cd(II), Ni(II) and Pb(II) from aqueous solution. The
optimum pH for the adsorption of Zn(II) and Cd(II) were 5-6, for Ni(II) and Pb(II)
were 3-4 and 6, respectively. Zn(II), Cd(II), Ni(II) and Pb(II) were eluted from the
chelating resin by 4 M hydrochloric acid, 1 M nitric acid, 4 M hydrochloric acid and 3
to 4 M nitric acid, respectively. The adsorption capacities of the resin were 511, 124,
135 and 306 µg/g of the resin for Zn(II), Cd(II), Ni(II) and Pb(II), respectively. a

11
Lim et al. (1996) synthesized the new chelating resins, XAD-2, 4, 16-TAC and
XAD-2, 4, 16-TAO by reacting Amberlite XAD-2, XAD-4, and XAD-16 macro-
reticular resins with 2-(2-thiazolylazo)-p-cresol (TAC) and 4-(2-thiazolylazo)-orcinol
(TAO) as functional groups and were characterized by elemental analysis and FTIR
spectrophotometry. The content of functional group in chelating resin was 0.60
mmol/g in XAD-16-TAC and 0.68 mmol/g in XAD-16-TAO, respectively. The
chelating resins were stable in acidic and alkali solution and can be reused over 10
times. The adsorption behaviors of some metal ions on two chelating resins were
studied by batch method. For the optimum conditions of adsorption, the time required
for equilibrium was about 1 hour and the optimum pH was 5. In the presence of
anions such as SO42- and CH3COO-, the adsorption of U(VI) ion was slightly reduced
but other anions such as Cl- and NO3- revealed no interference effect. Also, adsorption
capacity of U(VI) ion was decreased by addition of CO32- ion because of complex
formation of [UO2(CO3)3]4-, but alkali metals and alkali earth metals including Na(I),
K(I), Mg(II), and Ca(II) were not affected by the adsorption extent. Masking agent,
NTA showed better separation efficiency of U(VI) ion from coexisting metal ions
such as Th(IV), Zr(IV), Hf(IV), Cu(II), Cd(II), Pb(II), Ni(II), Zn(II) and Mn(II) than
EDTA and CDTA.
Chattopadhyay et al . (1997 ) prepared a new chelating resin incorporating
imidazolylazo groups into a matrix of polystyrene divinylbenzene . The exchange
capacity of the resin for the ions Hg (II), Ag(I), and Pb (II) as a function of pH was
determined. The resin exhibit ed no affinity to alka li, or alkali earth metals . Hg(II) in
trace quantities was very effectively removed from river water spike d with Hg(II) at
the usual pH of natural waters.
Lemos et al. (1998) used polyurethan foam modified by 2-(2′-benzo-
thiazolylazo)-2-p-cresol (B-TAC) as a sorbent for determination of Cd(II) trace levels.
It was found that pH had effect on the adsorption of Cd(II) on B-TAC. The adsorption
of Cd(II) by B-TAC had been investigated within the pH range of 6.50 to 9.25. It was
found that the maximum adsorption of Cd(II) was achieved at pH 9.0 in the
ammonium buffer solution. Cd(II) was eluted from the column by using hydrochloric

12
acid at various concentrations. The results showed that 0.1 M hydrochloric acid was
the most suitable eluent for desorption Cd(II) from B-TAC. a
Ferreira and De Brito (1999) studied an analytical procedure for the
determination of trace cobalt in saline matrixes by ICP-AES, using a column
containing Amberlite XAD-2 resin loaded with 2-(2-thiazolylazo)-p-cresol (TAC) for
the steps of preconcentration and separation. This method did not require toxic
chloroform as an eluent. a
Kim et al. (2000) studied polystyrene-divinylbenzene-2-(2-thiazolylazo)-p-
cresol, which could absorb metal ions, specially uranium ion, and work as a ligand of
metal for forming chelate with metal to isolate the metal. The compound was
manufactured by the following steps of: (1) nitration of polystyrene-divinylbenzene
copolymer; (2) amination of nitro compound; (3) diazotisation of aminated
polystyrene-divinylbenzene copolymer; (4) reaction of diazotized polystyrene-
divinylbenzene copolymer with thiazolylazo-p-cresol. a
Lee et al. (2000) synthesized two chelating resins, XAD-16-TAC and XAD-
16-TAO by Amberlite XAD-16 macroreticular resin with 2-(2-thiazolylazo)-p-cresol
(TAC) and 4-(2-thiazolylazo)-orcinol (TAO) as functional groups. The adsorption
behavior of Zr(IV), Th(IV) and U(VI) with two chelating resins were examined with
respect to the effect of pH and masking agent by batch method. It was found that the
optimum pH was at 5-6, and the two chelating resins showed good separation
efficiency of Zr(IV) and Th(IV) by using NH4F as a masking agent. Characteristics of
desorption were studied with 0.1-2.0 M HNO3 as desorption reagent. 2 M HNO3
showed high desorption efficiency to most of metal ions except Zr(IV). XAD-16-TAC
resin was applied for the separation and preconcentration of trace Zr(IV) from mixed
metal ions. Also Th(IV) ion could be successfully separated from U(VI) and Zr(IV)
ion by using XAD-16-TAO resin.
Lemos et al. (2002) studied an online enrichment flow system, which was
developed to determine trace amounts of cobalt in seawater samples. It was based on

13
the chemical adsorption of cobalt(II) ions onto a mini-column packed with Amberlite
XAD-2 resin loaded with TAC reagent. After cobalt preconcentration, the analyte was
eluted by 0.50 M nitric acid solution and determined directly by flame atomic
absorption spectrometry (FAAS). A preconcentration factor of 87 in 15 ml of sample
(3 min preconcentration time) was achieved by using the time-based technique. The
detection limit was 0.13 µg/l and the precision (evaluated as the relative standard
deviation) reached values within the range of 7.0-1.4% in cobalt solutions varying
from 0.50 to 10 µg/l concentration, respectively. Chemical and flow variables as well
as concomitant were studied in the developed procedure. The method was tolerant to
other ions usually presence in the analyzed samples. The proposed procedure was
successfully applied for the determination of cobalt in a certified reference material.
The recoveries of cobalt in samples of natural waters, measured by standard addition
technique, demonstrated that the proposed procedure had also a good accuracy.
Mondal and Das (2002) studied chloromethylated polystyrene divinylbenzene ,
which was functionalized through -NH-CH2- bond with bis-(2-aminophenyl)disulfide.
The resulting chelating resin was characterized by elemental analyse s, IR spectra and
metal ion capacity . The sorption capacities for both As (III ) and As (V) were
determined using batch technique and they show a strong sorption at pH 4.5. The
effects of the presence of co- existing ions were examined . The concentration of ea ch
of the arsenic species was determined by HG- AAS. The sorption and desorption
cycles were examined using a column packed with the resin without any loss of
column performance which indicate d the possibility for its reuse . The developed
column technique was used for the removal of arsenic species from natural water.
Rerkpalin (2003) synthesized 2-(2′-thiazolylazo)-p-cresol (TAC) and studied
properties and application of TAC. The complexation of TAC with Cu(II) and Cd(II)
were studied. TAC could form green complex with Cu(II) at pH 3.0, 5.0 and 7.0 and
red-violet complex at pH 10.0. The color of Cd(II)-TAC complex is yellow at pH 7.0,
violet at pH 7.5 and 8.0 and red-violet complex at pH 9.0. The ratio of Cu(II):TAC
and Cd(II):TAC in their complex are 1:1 in acidic and alkali condition. The chelating
resin (P-TAC) was prepared. The ability of P-TAC for adsorption of Cu(II) an Cd(II)
14
had been studied by batch equilibrium and column experiment. Cu(II) and Cd(II) on
P-TAC were successively eluted by 2 M hydrochloric acid and 1 M nitric acid,
respectively. P-TAC was used to separate Cu(II) and Cd(II) from synthetic waste
solution.

15
MATERIALS AND METHODS
Materials
1.
Apparatus
Absorbance measurements were carried out on a Jasco model 7800 UV-Vis
spectrophotometer. Perkin Elmer 1100B and Perkin Elmer (Analyst 800) Atomic
absorption spectrophotometers were used for the quantitative determination of
cobalt(II) and lead(II). The instrument was operated under air-acetylene flame with
analytical wavelengths at 240.7 nm and 283.3 nm for cobalt(II) and lead(II),
respectively. Infrared spectra (4000-200 cm-1) were obtained by a Perkin Elmer
system 2000 Fourier transform infrared spectrometer. All absorption was reported in
wave number (cm-1). Nuclear magnetic spectra were recorded at 400 MHz on a
Bruker Advance DPX-400. An elemental analysis of TAC was performed with a
Perkin Elmer series II CHNS/O analyzer 2400. Mass spectrum of TAC was obtained
from HPLC/MS (Agilent 1100). The pH values were measured by using an inolab
level 1-pH meter. a
2.
Reagents
All reagents were analytical grade, except 2-aminothiazole (Merck, Darmstadt,
Germany) and p-cresol (M&B, Degenhamt, England) were laboratory grade. Double
distilled deionized water was used for the preparation of solutions. Chloromethylated
polystyrene divinylbenzene (Fluka, Steinheim, Switzerland) consists of cross linked
with 1% DVB, 200-400 mesh. Standard solution of cobalt(II) and lead(II) for atomic
absorption spectrophotometry were prepared by dilution of 1000 mg L-1 stock
standard solution (Carlo Erba, Milan, Italy). a

16
Methods
1.
Preparation of solutions
1.1 Preparation of buffer solutions
Buffer solutions used in this work were prepared by mixing various
reagents as stated in Table 2.
Table 2
The buffer solutions at pH range from 3.0 to 10.0 which were prepared and
used in this work.
pH Buffer system
3
4
5
6
7
8
9
10
0.1 M CH3COOH (98.23 ml) and 0.1 M CH3COONa (1.77 ml)
0.1 M CH3COOH (64.75 ml) and 0.1 M CH3COONa (36.25 ml)
0.1 M CH3COOH (35.70 ml) and 0.1 M CH3COONa (64.30 ml)
0.1 M KHP (50.00 ml) and 0.1 M NaOH (22.60 ml)
0.1 M CH3COOH (5.26 ml) and 0.1 M CH3COONa (94.74 ml)
0.1 M KHP (50.00 ml) and 0.1 M NaOH (44.20 ml)
0.1 M NaH2PO4 (62.00 ml) and 0.1 M Na2HPO4 (38.00 ml)
0.1 M KH2PO4 (50.00 ml) and 0.1 M NaOH (29.10 ml)
0.1 M tris(hydroxymethyl)aminomethane (50.00 ml) and 0.1 M HCl (46.60 ml)
0.1 M NH4OH (5.26 ml) and 0.1 M NH4Cl (94.74 ml)
0.1 M KH2PO4 (50.00 ml) and 0.1 M NaOH (46.70 ml)
0.1 M tris(hydroxymethyl)aminomethane (50.00 ml) and 0.1 M HCl (29.20 ml)
0.1 M NH4OH (35.71 ml) and 0.1 M NH4Cl (64.29 ml)
0.1 M tris(hydroxymethyl)aminomethane (50.00 ml) and 0.1 M HCl (5.70 ml)
0.1 M NaHCO3 (65.80 ml) and 0.1 M Na2CO3 (34.20 ml)
0.1 M NH4OH (84.75 ml) and 0.1 M NH4Cl (15.25 ml)
0.1 M tris(hydroxymethyl)aminomethane (50.00 ml) and 0.1 M HCl (3.80 ml)
0.1 M NaHCO3 (27.27 ml) and 0.1 M Na2CO3 (72.73 ml)

17
1.2 Preparation of universal buffer solutions
Universal buffer solutions used in this work were prepared by mixing the
mixture of 0.20 M boric acid and 0.05 M citric acid (1:1) with 0.10 M Na3PO4 at
various ratios as stated in Table 3.
Table 3
The universal buffer solutions at pH range from 3.0 to 11.0 which were
prepared and used in this work.
pH Mixture of 0.20 M boric acid
and 0.05 M citric acid (1:1)
(ml)
0.10 M Na3PO4
(ml)
3
4
5
6
7
8
9
10
11
176
155
134
118
99
85
69
54
44
24
45
66
82
101
115
131
146
156
1.3 Preparation of 1x10⁻³ M and 2x10⁻⁴ M TAC
For the preparation of 1x10⁻³ M, 0.0219 g of TAC was dissolved and
made up to 100 ml by 95% ethanol in volumetric flask.
Solutions of 2x10⁻⁴ M TAC at various pH were prepared by diluting
1x10⁻³ M TAC in volumetric flask with various buffer solutions as stated in Table 2.

18
1.4 Preparation of 1x10⁻³ M and 2x10⁻⁴ M cobalt(II) solutions
For the preparation of 1x10⁻³ M cobalt(II), 5.89 ml of standard solution of
cobalt nitrate (1000 ppm) was added in a 100 ml volumetric flask and diluted to the
marked by 0.1 M HNO3. Solutions of 2x10⁻⁴ M cobalt(II) at various pH were prepared
by diluting 1x10⁻³ M cobalt(II) in volumetric flask with various buffer solutions as
stated in Table 2.
1.5 Preparation of 1x10⁻³ M and 2x10⁻⁴ M lead(II) solutions
For the preparation of 1x10⁻³ M lead(II), 20.70 ml of standard solution of
lead nitrate (1000 ppm) was added in a 100 ml volumetric flask and diluted to the
marked by 0.1 M HNO3. Solutions of 2x10⁻⁴ M lead(II) at various pH were prepared
by diluting 1x10⁻³ M lead(II) in volumetric flask with various buffer solutions as
stated in Table 2.
2.
Synthesis of 2-(2′-thiazolylazo)-p-cresol (TAC)
Two grams of 2-aminothiazole was dissolved in 20 ml of 6 M hydrochloric
acid and cooled in an ice-bath. Sodium nitrate (1.40 g) was dissolved in a small
amount of water. After the crushed ice was added to both solutions, nitrite solution
was slowly poured into the 2-aminothiazole solution while stirring with a glass rod
under low temperature (-5 to 0 °C). The solution of diazonium salt was slowly poured
while stirring into a well cooled solution of p-cresol in 50 ml of 4 M hydrochloric
acid. The mixture was left in the ice-bath for 1 hour and then 40% w/v of sodium
acetate solution was added into the mixture until pH 5.0 was reached. A brown
precipitate began to settle immediately. The solution was filtered and the precipitated
was washed with water and air-dried to gave 2-(2′-thiazolylazo)-p-cresol (TAC). The
crude product was purified by recrystallization with a mixture of ethanol-water (1:1)
to give brown needles-shaped crystals with melting point of 131-132 °C. The resultant
product was characterized by FTIR, 1H NMR, MS and elemental analysis.

19
3.
Determination of the acid dissociation constant (pKa) of 2-(2′-thiazolylazo)-p-
cresol (TAC)
One millilitre of 1x10⁻³ M TAC solution was added into each of nine 25 ml
volumetric flasks and then made up volume by universal buffer solutions at pH 3.0-
11.0 (shown in Table 3). The absorbance of the solution was measured by UV-Vis
spectrophotometer at 350-800 nm. The pKa of the –OH group of TAC was determined
by two different methods: the half height method and the limiting absorbance method
(Masoud, 2003). The calculation is shown in Appendix C.
4.
Structural determination of complex between 2-(2′-thiazolylazo)-p-cresol
(TAC) and cobalt(II) and between TAC and lead(II)
The mixture between 1x10⁻³ M TAC solution and 1x10⁻³ M cobalt(II) solution
and the mixture between 1x10⁻³ M TAC solution and 1x10⁻³ M lead(II) solution (1:1)
were prepared at pH 8.0. The precipitate was taken at room temperature and then
filtered off and washed with double distilled deionized water. Finally, the precipitate
of complexes were dried at room temperature under low pressure and studied by using
FTIR spectrophotometer, nuclear magnetic resonance spectrometer.
5.
Complex formation between 2-(2′-thiazolylazo)-p-cresol (TAC) and cobalt(II)
and between TAC and lead(II)
2-(2′-thiazolylazo)-p-cresol (TAC) is thiazolylazo dye, which gives color
complex with most metals especially with transition metals. The reaction of TAC with
cobalt(II) and lead(II) at various pH were investigated in order to determine the
appropriate pH for studying on the formation of complex between cobalt(II) and TAC
and between lead(II) and TAC. The effect of the buffer was also investigated. The
following procedure for formation of complex was used in this work. Pipetted 5.0 ml
of 2.0x10⁻⁴ M metal ions in buffer solution (pH range 3.0 to 10.0) into 25 ml
volumetric flasks and then 5.0 ml of 2.0x10⁻⁴ M TAC solution in buffer solution (pH
range 3.0 to 10.0) were pipetted into the previous volumetric flasks. After that,

20
complex solutions were diluted to the mark with buffer solutions. The formation of
complex between cobalt(II) and TAC and between lead(II) and TAC were studied by
spectrophotometric method. The results are shown in Figures 17 to 24.
6.
Stoichiometric determination of complex between 2-(2′-thiazolylazo)-p-cresol
(TAC) and cobalt(II) and between TAC and lead(II) by continuous variation
method
From the studying on the complex formation in the previous section(5), the
appropriate pH for studying on the stoichiometric determination of cobalt(II) complex
were pH 5.0, 6.0, 7.0, 8.0, 9.0 and 10.0 and for lead(II) complex were pH 6.5, 7.0, 8.0
and 9.0.
6.1 Stoichiometric determination of complex between 2-(2′-thiazolylazo)-p-
cresol (TAC) and cobalt(II)
Pipetted 0.00, 1.00, 2.00, 3.00, 4.00, 5.00, 6.00, 7.00, 8.00, 9.00 and 10.00
ml of 2.0x10⁻⁴ M cobalt(II) in acetate buffer solution at pH 5.0 into each of eleven 25
ml volumetric flasks. Then 10.00, 9.00, 8.00, 7.00, 6.00, 5.00, 4.00, 3.00, 2.00, 1.00
and 0.00 ml of 2.0x10⁻⁴ M 2-(2′-thiazolylazo)-p-cresol (TAC) in acetate buffer
solution at pH 5.0 were pipetted into each volumetric flasks, respectively. After that,
the solution were diluted to the mark with acetate buffer solution at pH 5.0. The
stoichiometric determination of the complex at pH 6.0, 7.0, 8.0, 9.0 and 10.0 were
also studied by using the same method as described above. The buffer solutions used
in this study were stated in Table 2. The absorbance of the solutions were measured
by UV-Vis spectrophotometer at 585 nm for acidic and neutral condition, and at 610
nm for basic condition. The results are shown in Figures 25 to 40.

21
6.2 Stoichiometric determination of complex between 2-(2′-thiazolylazo)-p-
cresol (TAC) and lead(II)
Pipetted 0.00, 1.00, 2.00, 3.00, 4.00, 5.00, 6.00, 7.00, 8.00, 9.00 and 10.00
ml of 2.0x10⁻⁴ M lead(II) in acetate buffer solution at pH 6.5 into each of eleven 25
ml volumetric flasks. Then 10.00, 9.00, 8.00, 7.00, 6.00, 5.00, 4.00, 3.00, 2.00, 1.00
and 0.00 ml of 2.0x10⁻⁴ M 2-(2′-thiazolylazo)-p-cresol (TAC) in acetate buffer
solution at pH 6.5 were pipetted into each volumetric flasks, respectively. After that,
the solution were diluted to the mark with acetate buffer solution at pH 6.5. The
stoichiometric determination of the complex at pH 7.0, 8.0 and 9.0 were also studied
by using the same method as described above. The buffer solutions used in this study
were stated in Table 2. The absorbance of the solutions were measured by UV-Vis
spectrophotometer at 595 nm for acidic and neutral condition, and at 615 nm for basic
condition. The results are shown in Figures 42 and 43.
7.
Preparation of 2-(2′-thiazolylazo)-p-cresol resin (P-TAC)
The experimental conditions for studying on the influence of solvent and
shaking time on the preparation of P-TAC were as followed;
Effect of solvent : Solvents used for the preparation of P-TAC were
dimethylformamide, diethylamine, triethylamine and the mixture of dimethyl-
formamide and triethylamine (1:1). The procedure for preparation of P-TAC was as
followed; fifty milligrams of chloromethylated polystyrene divinylbenzene was
activated in 5.0 ml of each solvent at 50 °C for 3 hours. Then solution of TAC (0.02 g
of TAC was dissolved in 5.0 ml of each solvent) was added into each flask. The flasks
were shaken at room temperature for 72 hours. The resulting P-TAC was filtered off
and washed with 0.5 M hydrochloric acid, 0.5 M sodium hydroxide and double
distilled deionized water, respectively. It was then extracted in a soxhlet extractor
with ethanol for 48 hours and washed with double distilled deionized water until the
filtrate was colorless. The P-TAC was dried at room temperature at low pressure
condition. The dried P-TAC was used to study on the influence of solvent on the

22
preparation of P-TAC. The procedure for determination of capacity for cobalt(II) of
P-TAC was as followed; Fifty milligrams of P-TAC, which was prepared in each
solvent, was equilibrated with 10.00 ml of 100 ppm of cobalt(II) solution at pH 7.0.
Then the mixtures were shaken for 3 hours and filtered. The filtrates were determined
for cobalt(II) and lead(II) by atomic absorption spectrophotometer. The results are
shown in Table 10.
Effect of shaking time : the shaking time was varied from 12 to 96 hours (12,
24, 48, 72 and 96 hours) by using the previous procedure. In addition, the mixture
solvent of dimethylformamide and triethylamine (1:1) was used in the preparation of
P-TAC. The results are shown in Figure 45.
As the effect of solvent and shaking time had been optimized, therefore the
procedure for the preparation of P-TAC was recommended. Firstly, by 0.50 g of
chloromethylated polystyrene divinylbenzene was activated in 5.0 ml of the mixture
solvent of dimethylformamide and triethylamine (1:1) at 50 °C for 3 hours. Then
0.02 g of TAC, which was dissolved in 5.0 ml of the mixture solvent, was added into
the flask. The flask was shaken at room temperature for 72 hours and the P-TAC was
filtered off and washed with 0.5 M hydrochloric acid, 0.5 M sodium hydroxide and
double distilled deionized water, respectively. It was then extracted in a soxhlet
extractor with ethanol for 48 hours and washed with double distilled deionized water
until the filtrate was colorless. The P-TAC was dried at room temperature at low
pressure condition.
8.
Determination of the sorption capacity of cobalt(II) and lead(II) by P-TAC
The sorption of cobalt(II) and lead(II) were studied under static and dynamic
conditions. To determine the capacity of P-TAC, the influence of various parameters
such as pH, initial concentration of metal ion and shaking time were optimized under
static condition by using batch equilibrium experiment, whereas the effect of flow rate
was studied under dynamic condition by using column equilibrium experiment.

23
8.1 Optimization of parameters for the maximum adsorption of cobalt(II) on
P-TAC
8.1.1 Batch equilibrium experiment
The experiment conditions for studying on the influence of various
parameters on the sorption of cobalt(II) on P-TAC were as followed;
Effect of pH : Capacity of P-TAC was determined in the pH range
from 3.0 to 7.0. The pH of the solution in each experiment was adjusted by buffer
solutions. Fifty milligrams of P-TAC was equilibrated with 10.0 ml of 150 ppm
cobalt(II) solution, which were prepared in buffer solution at pH 3.0, 4.0, 5.0, 6.0 and
7.0. Then the mixtures were shaken for 4 hours. After the mixture were filtered, the
filtrates were determined for cobalt(II) by atomic absorption spectrophotometer. The
results are shown in Figure 46.
Effect of concentration of cobalt(II) : 10, 25, 50, 100, 150 and 200
ppm cobalt(II) solution were prepared in acetate buffer at pH 7.0. Fifty milligrams of
P-TAC was equilibrated with 10.0 ml of cobalt(II) solution at various concentration.
Then the mixtures were shaken for 4 hours. After the mixture were filtered, the
filtrates were determined for cobalt(II) by atomic absorption spectrophotometer. The
results are shown in Figure 47.
Effect of shaking time : Fifty milligrams of P-TAC was
equilibrated with 10.0 ml of 150 ppm cobalt(II) solution in acetate buffer at pH 7.0.
Then the mixtures were shaken for 0.5, 1.0, 1.5, 2.0, 3.0, 4.0 and 5.0 hours,
respectively. After the mixtures were filtered, the filtrates were determined for
cobalt(II) by atomic absorption spectrophotometer. The results are shown in
Figure 48.
As the results of optimization study shown above, the following
procedure could be recommended. Fifty milligrams of P-TAC was equilibrated with

24
10.0 ml of 150 ppm cobalt(II) solution in acetate buffer at pH 7.0. Then the mixtures
were shaken for 4 hours. After the mixtures were filtered, the filtrates were
determined for cobalt(II) by atomic absorption spectrophotometer.
8.1.2 Column equilibrium experiment
The studying method of the column equilibrium experiment in the
effect of flow rate for sorption of cobalt(II) on P-TAC was as followed;
Effect of the flow rate : The effect of flow rate on the sorption of
cobalt(II) on P-TAC was studied at the flow rate of 0.50, 0.33 and 0.25 ml min-1. The
procedure to determine the capacity of P-TAC was as followed; A glass column with
1.0 cm diameter was filled with 0.30 g of P-TAC to gave a bed height of about 1.0 cm.
Then acetate buffer solution at pH 7.0 was passed through this column. Then 200 ml of
10 ppm cobalt(II) in acetate buffer solution at the pH 7.0 was passed through the
column at flow rate of 0.5 ml min-1 until the concentration of cobalt(II) in the effluent
was the same as the feed solution. Fractions (1.0 ml) of the effluent were determined
for cobalt(II) by the atomic absorption spectrophotometer. The capacity of P-TAC was
determined from breakthrough curve. The capacity of P-TAC at flow rate of 0.33 and
0.25 ml min-1 were determined by using the same method as described above. The
results are shown in Figures 49 and 51.
8.2 Optimization of parameters for the maximum adsorption of lead(II) on
P-TAC
8.2.1 Batch equilibrium experiment
The experiment conditions for studying on the influence of various
parameters on the sorption of lead(II) on P-TAC were as followed;
Effect of pH : Capacity of P-TAC was determined in the pH range
from 3.0 to 6.0. The pH of the solution in each experiment was adjusted by buffer

25
solutions. Fifty milligrams of P-TAC was equilibrated with 10.0 ml of 100 ppm
lead(II) solution, which were prepared in buffer solution at pH 3.0, 4.0, 5.0, 5.5 and
6.0. Then the mixtures were shaken for 24 hours. After the mixtures were filtered, the
filtrates were determined for lead(II) by atomic absorption spectrophotometer. The
results are shown in Figure 52.
Effect of concentration of lead(II) : 10, 25, 50, 75, 100 and 150
ppm lead(II) solution were prepared in acetate buffer at pH 5.5. Fifty milligrams of
P-TAC was equilibrated with 10.0 ml of lead(II) solution at various concentrations.
Then the mixtures were shaken for 24 hours. After the mixtures were filtered, the
filtrates were determined for lead(II) by atomic absorption spectrophotometer. The
results are shown in Figure 53.
Effect of shaking time : Fifty milligrams of P-TAC was
equilibrated with 10.0 ml of 150 ppm lead(II) solution in acetate buffer at pH 5.5.
Then the mixtures were shaken for 1, 2, 4, 8, 12, 16, 20, 24, 28 and 32 hours,
respectively. After the mixtures were filtered, the filtrates were determined for
lead(II) by atomic absorption spectrophotometer. The results are shown in Figure 54.
As the results of optimization study shown above the following
procedure could be recommended. Fifty milligrams of P-TAC was equilibrated with
10.0 ml of 100 ppm lead(II) solution in acetate buffer at pH 5.5. Then the mixtures
were shaken for 24 hours. After the mixtures were filtered, the filtrates were
determined for lead(II) by atomic absorption spectrophotometer.
8.2.2 Column equilibrium experiment
The studying method of the column equilibrium experiment in the
effect of flow rate for sorption of lead(II) on P-TAC was as follow;
Effect of the flow rate : The effect of flow rate on the sorption of
lead(II) on P-TAC was studied at the flow rate of 0.50, 0.33 and 0.25 ml min-1. The

26
procedure to determine the capacity of P-TAC was as followed; A glass column of 1.0
cm inner diameter was filled with 0.30 g of P-TAC to gave a bed height of about 1.0
cm. Then acetate buffer solution at pH 5.5 was passed through this column. Then 200
ml of 20 ppm lead(II) in acetate buffer solution at the pH 5.5 was passed through the
column at flow rate of 0.5 ml min-1 until the concentration of lead(II) in the effluent
were the same as the feed solution. Fractions (1.0 ml) of the effluents were determined
for lead(II) by atomic absorption spectrophotometer. The capacity of P-TAC was
determined from breakthrough curve. The capacity of P-TAC at flow rate of 0.33 and
0.25 ml min-1 were determined by using the same method as described above. The
results are shown in Figures 55 to 57.
9.
Desorption of cobalt(II) and lead(II) on P-TAC
Fifty milligram of P-TAC loaded with 10.0 ml of 150 ppm of cobalt(II)
solution was shaken for 4 hours and fifty milligram of P-TAC loaded with 10.0 ml of
100 ppm of lead(II) solution was shaken for 10 minutes. Then the loaded resin was
filtered off, washed with double distilled water and air-dried. The loaded resin was
shaken individually in 10.0 ml of 10 eluents, namely, ammonia solution, perchloric
acid, hydrochloric acid, nitric acid, potassium thiocyanate, acethylacetone, citric acid,
EDTA, 1,10-phenanthroline and thiourea. After the shaking period for 3 hours, the
mixtures were filtered and the filtrates were analyzed for cobalt(II) and lead(II) by
atomic absorption spectrophotometer. The results are shown in Table 11.
10.
Using P-TAC for the separation of cobalt(II) and lead(II) mixture solution
The mixture solution of cobalt(II) and lead(II) was prepared by mixing 10.0
ml of 20.0 ppm cobalt(II) solution and 10.0 ml of 40.0 ppm of lead(II) solution and
adjusted to pH 5.5 by 0.1 M sodium hydroxide. After that, the mixture was passed
through the column which contained 300 mg of P-TAC, with the flow rate of 0.33 ml
min-1.

27
In the first column, the loaded resin was desorped by 12 ml of 0.5 M thiourea
and followed by 10 ml of 3 M HClO4 with the flow rate of 0.33 ml min-1. Fractions
(2.0 ml) of the effluent were determined for cobalt(II) and lead(II) by atomic
absorption spectrophotometer. The results are shown in Figures 60 and 61.
In the second column, the effect of the concentration of thiourea on the
separation of cobalt(II) and lead(II) mixture solution was studied by using 20 ml of
0.1 M thiourea with the flow rate 0.33 ml min-1 instead of 0.5 M thiourea. Fractions
(2.0 ml) of the effluent were determined for cobalt(II) and lead(II) by atomic
absorption spectrophotometer. The results are shown in Figure 62.
11.
Efficiency of P-TAC on the sorption of cobalt(II) and lead(II) by column
experiment
11.1 Efficiency of P-TAC on the sorption of cobalt(II)
Three hundreds milligrams of P-TAC was filled in a glass column with
1.0 cm diameter and then buffer solution at pH 7.0 was passed through this column to
activated the P-TAC. Ten ppm of cobalt(II) solution at pH 7.0 was passed through the
column at the flow rate of 0.25 ml min-1 until the concentration of cobalt(II) in the
effluent was the same as in the feed solution. The retained cobalt(II) was eluted with 3
M perchloric acid by batch method with the shaking time of 3 hours. After the
filtration of these mixtures, the filtrates were determined for cobalt(II) by atomic
absorption spectrophotometer. The efficiency of the used-P-TAC for the sorption of
cobalt(II) was studied by repeating the previous procedure for 4 times. The results are
shown in Figure 63.
11.2 Efficiency of P-TAC on the sorption of lead(II)
Three hundreds milligrams of P-TAC was filled in a glass column with
1.0 cm diameter and then buffer solution at pH 5.5 was passed through this column to
activated the P-TAC. Twenty ppm of lead(II) solution at pH 5.5 was passed through

28
the column at the flow rate of 0.33 ml min-1 until the concentration of lead(II) in the
effluent was the same as in the feed solution. The retained lead(II) was eluted with 0.3
M thiourea solution by batch method with the shaking time of 3 hours. After the
filtration of these mixtures, the filtrates were determined for lead(II) by atomic
absorption spectrophotometer. The efficiency of the used-P-TAC for the sorption of
lead(II) was studied by repeating the previous procedure for 4 times. The results are
shown in Figure 64.

29
RESULTS AND DISCUSSIONS
1.
Synthesis of 2-(2′-thiazolylazo)-p-cresol (TAC)
Figure 2 shows the pathway of synthesis of 2-(2′-thiazolylazo)-p-cresol (TAC)
which was synthesized by diazotisation of 2-aminothiazole in hydrochloric acid at –5
to 0 °C, then coupling with p-cresol in hydrochloric acid at the same temperature.
Finally, the crude product of TAC was precipitated with 40% v/v sodium acetate solution.
The crude product was purified by recrystallization from ethanol-water (1:1) solution,
which gave TAC as brown needle crystal with the melting point of 131-132 °C and
74.52% yield.
The brown needle shaped crystalline of TAC was characterized by FTIR
spectrophotometry, 1H NMR, mass spectrometry and elemental analysis, the results
are shown in Figures 3, 4, 5, 6, 7 and Table 4. The solution of TAC in acidic and
neutral solution gave yellow color with the maximum absorption at 372 nm while the
alkaline solution gave red violet color with the maximum absorption at 532 nm.
Figure 2
N
S
NH2
NO2-+
N
S
N N
HCl-5 to 0 şC
2-Aminothiazole 2-Thiazolylazo
Pathway of synthesis of 2-(2′-thiazolylazo)-p-cresol (TAC).
N
S
N N
+
CH3
OH
HCl-5 to 0 ºC
CH3
OH
NN
S
N
p-cresol 2-(2'-thiazolylazo)-p-cresol (TAC)2-Thiazolylazo

30
Figure 3
The infrared spectrum (KBr : cm-1) was as followed : 3375 (w, O-H
stretch), 3082 (m, C-H stretch aromatic), 1619 (w, N=N stretch), 1582 (m,
C=N stretch), 1488 and 1429 (s, C=C stretch), 1276 (vs, C-O stretch), 1218
(m, C-N stretch), 1153 (m, C-S stretch) and 742 (m, C-H bend aromatic,
para substituent).
IR spectrum of 2-(2′-thiazolylazo)-p-cresol (TAC).
Figure 4
Source: Pavia (1996)
IR spectrum of p-cresol.
3375 3082
1619
1582
1488 1276
1218 742
1429 1153
100
60
80
40
20
0 4000 3600 3200 2800 2400 2000 1800 1600 1400 1200 1000 400 800 600
%T
cm-1
3377 780
3078
1435 1490 1270

31
From IR spectra of TAC and p-cresol, the peaks of O-H stretch at 3375 cm-1,
C-H stretch aromatic at 3082 cm-1, C=C stretch at 1488 and 1429 cm-1, C-O stretch at
1276 cm-1 and C-H bend aromatic (para substituent) at 742 cm-1 of TAC were
determined at the closely wavenumber with p-cresol. Because of the peak of O-H
stretch of TAC was very weak, so the 1H NMR spectrum of TAC was used to confirm
the O-H group in TAC. The result is shown in Figure 5.
Figure 5
The 1H NMR spectrum (CDCl3, 400 MHz) was as follow: δ 2.394 (3H, s,
Ha), 6.990 (1H, d, Hb), 7.270 (1H, d, Hc), 7.439 (1H, d, Hd), 7.719 (1H, s,
He), 8.003 (1H, d, Hf) and 11.585 (1H, s, Hg).
1H NMR spectrum of 2-(2′-thiazolylazo)-p-cresol (TAC).
CH3
OH
NN
S
N
HH
HH
H
(a)
(b)
(c)
(d)
(e)
(f)
(g)
f d e
g c
b
a

32
Figure 6
m/z (relative intensity) : 219.9 (61.67), 134.9 (100.00), 107.1 (17.78) , 84.0
(3.05) and 79.1 (29.44).
Mass spectrum of 2-(2′-thiazolylazo)-p-cresol (TAC).
Figure 7
CH3
OHN
N
S
NS
N
CH3
OHNN
+
CH3
OHNN
N N
OH
H++
OH HH
CO+
Pathway of the fragmentation of 2-(2′-thiazolylazo)-p-cresol (TAC).
m/z = 134.9
m/z = 107.1
m/z = 79.1
m/z = 84.0
50 200 100 250 150 300 m/z
50
25
75
100
0
79.1
107.1
219.9
134.9
84.0

33
From Figures 6 and 7, TAC could fragment to cation (m/z = 84.0) and free
radical (m/z = 134.9). The high relative intensity at m/z = 134.9 indicated the stability
of the free radical. For the m/z = 84.0, the low relative intensity indicated the
instability of the cation.
Table 4
The elemental analysis of 2-(2′-thiazolylazo)-p-cresol (TAC)
% Element Theoretical value* Experimental value % Error
%C
%H
%N
%S
%O
54.78%
4.137%
19.16%
14.62%
7.297%
53.84%
4.149%
19.21%
15.30%
7.501%
1.716%
0.290%
0.261%
4.651%
2.796%
* The calculation for the theoretical value is shown in Appendix A.
The results of IR spectrum, 1H NMR spectrum, mass spectrum and elemental
analysis indicated that the synthesized product was TAC.
2.
Determination of the acid dissociation constant (pKa) of 2-(2′-thiazolylazo)-p-
cresol (TAC)
From the chemical structure of TAC, oxygen atom has an important role for
the complexation between TAC and metal ions. The proton of the hydroxyl group
could be deprotonated. So it is necessary to determine the pKa of TAC. The chemical
structures of TAC in acid and basic form are shown in Figure 8.

34
acid form basic form
Figure 8
Chemical structures of TAC in acid and basic form.
The absorption spectra in the visible region of 2-(2′-thiazolylazo)-p-cresol
(TAC) at pH 3-11 (using universal buffer solutions) were investigated as shown in
Figure 9. The isobestic point of TAC was obtained.
Figure 9
Absorption spectra of 1x10⁻⁴ M of TAC at pH 3-11.
The dissociation constant value (pKa) of –OH group in TAC has been
determined by two methods, the half height method and the limiting absorbance
method (Masoud, 2003).The results are presented in Figures 10 and 11, which the
calculated pKa of TAC from both methods were approximately 8.6.
CH3
OH
NN
N
S
CH3
O
NN
N
S
Isobestic point

35
Figure 10
Absorbance-pH curve of TAC (Half height method).
Figure 11
-pH curve of TAC (Limiting Absorbance method).
log As - AsminAsmax - As
0.0000
0.1000
0.2000
0.3000
0.4000
0.5000
0.6000
1 2 3 4 5 6 7 8 9pH
Abs
350 nm
370 nm
400 nm
425 nm
500 nm
535 nm
570 nm
3 4 5 6 7 8 9 10 11 8.60
-2.5000
-2.0000
-1.5000
-1.0000
-0.5000
0.0000
pH
350 nm
370 nm
400 nm
425 nm
500 nm
535 nm
570 nm
8.65 3 4 5 6 7 8 9 10 11

36
3.
Structural determination of complex between 2-(2′-thiazolylazo)-p-cresol
(TAC) and cobalt(II) and between TAC and lead(II)
TAC is a polydentate ligand which can form complex with metal ions by using
nitrogen, sulfur and oxygen as donor atom. Cobalt(II) and lead(II) are transition
metals which are the characteristic of the borderline acid (Shriver, 1999). TAC might
act as chelating ligand with two probable formulas of complex formed as shown in
Figure 12. However, the structure in Figure 12 (a) is likely to be the correct structure
due to the softness parameter because of nitrogen atom is the borderline base while
sulfur atom is the soft base.
(a) (b)
Figure 12 Postulated structures of complex between metal ions and TAC.
a) Oxygen atom and two atoms of nitrogen are donor atoms
b) Oxygen, nitrogen and sulfur atoms are donor atoms
IR spectrum could indicated the donor atoms for bonding with metal ions by
the decreasing of wavenumber due to the decreasing of the bond order of the donor
atom. The results from the infrared spectra of TAC and cobalt(II)-TAC complex are
shown in Figure 13 and Table 5. For the complex, the peak assigned for N=N bond
was shifted from 1619 cm-1 to 1601 cm-1, the peak assigned for C=N bond was shifted
from 1582 cm-1 to 1522 cm-1 and the peak assigned for O-H bond was shifted from
3375 cm-1 to 3323 cm-1. Therefore, the cobalt(II) could form complex with might
acted as a tridentate ligand. The intensity of the peak at 742 cm-1, assigned for C-H
bend aromatic (para substituent), was decreased may be because the oxygen atom of
TAC formed coordinate covalent bond with cobalt(II) so that the aromaticity of p-
cresol was decreased. The postulated structure of the complex is shown in Figure 14.
N
N
CH3
OH
M2+
S
N
N
N
CH3
OH
M2+
N
S

37
Figure 13 IR spectra of (a) 2-(2′-thiazolylazo)-p-cresol (TAC) and (b) cobalt(II)-TAC
complex.
Table 5 Data from the IR spectra of TAC and cobalt(II)-TAC complex
2-(2′-thiazolylazo)-p-cresol (TAC) Cobalt(II)-TAC complex
Wavenumber
(cm-1) Functional group Wavenumber
(cm-1) Functional group
3375
3082
1619
1582
1488 and 1429
1276
1153
O-H stretch
C-H stretch (aromatic)
N=N stretch
C=N stretch
C=C stretch
C-O stretch
C-S stretch
3323
3074
1601
1522
1489 and 1405
1285
1154
O-H stretch
C-H stretch (aromatic)
N=N stretch
C=N stretch
C=C stretch
C-O stretch
C-S stretch
(a)
(b) 3323
3375
3074
3082
1601
1619
1522
1582
1489
1488
1405
1429
1285
1276
1154
1153 742
740

38
Figure 14 Postulated structure of cobalt(II)-TAC complex.
From the results of infrared spectra of TAC and the lead(II)-TAC complex
(Figure 15 and Table 6), the peak assigned for O-H bond at 3375 cm-1 was shifted to
3349 cm-1, the peak assigned for N=N bond at 1619 cm-1 was shifted to 1603 cm-1 and
the peak assigned for C=N bond at 1582 cm-1 was shifted to 1526 cm-1. The using of
nitrogen and oxygen atom for the bonding with lead(II) could caused the O-H, N=N
and C=N bond in the complex weaker than in TAC. The intensity of the peak at 742
cm-1, assigned for C-H bend aromatic (para substituent), was decreased may be
because the oxygen atom of TAC formed coordinate covalent bond with lead(II) so
that the aromaticity of p-cresol was decreased. The postulated structure of the
lead(II)-TAC complex is shown in Figure 16.
Figure 15 IR spectra of (a) 2-(2′-thiazolylazo)-p-cresol (TAC) and (b) lead(II)-TAC
complex.
N
N
CH3
OH
Co2+
S
N
(a)
(b)
3375 3082
1619
1582 1488
1429 1276
1153
3079 1603 1526
1490 1397 1246
1150 3349
742
737

39
Table 6 Data from the IR spectra of TAC and lead(II)-TAC complex
2-(2′-thiazolylazo)-p-cresol (TAC) Lead(II)-TAC complex
Wavenumber
(cm-1) Functional group Wavenumber
(cm-1) Functional group
3375
3082
1619
1582
1488 and 1429
1276
1153
O-H stretch
C-H stretch (aromatic)
N=N stretch
C=N stretch
C=C stretch
C-O stretch
C-S stretch
3349
3079
1603
1526
1490 and 1397
1246
1150
O-H stretch
C-H stretch (aromatic)
N=N stretch
C=N stretch
C=C stretch
C-O stretch
C-S stretch
Figure 16 Postulated structure of lead(II)-TAC complex.
4. Complex formation between 2-(2′-thiazolylazo)-p-cresol (TAC) and cobalt(II)
and between TAC and lead(II)
The absorption of TAC was studied in aqueous buffer solution in the visible
region. The azo compound displays mainly a broad band in the visible region which
was assigned as n → π* transition within the azo linkage influenced by intramolecular
charge transfer. The formation of complex between TAC and cobalt(II) at various pH
showed that TAC could form complexes with cobalt(II) at pH 5, 6, 7, 8, 9 and 10. The
cobalt(II) complex gave a yellow brown color at pH 5 and 6, violet color at pH 7 and
N
N
CH3
O
Pb2+
S
N

40
8 and green color at pH 9 and 10. The results are shown in Figures 17 to 22 and
Table 7.
Figure 17 Absorption spectra of TAC and cobalt(II)-TAC complex at pH 5.
(a) TAC 4x10⁻⁵ M
(b) Complex of cobalt(II)-TAC (cobalt(II) 4x10⁻⁵ M and TAC 4x10⁻⁵ M)
Figure 18 Absorption spectra of TAC and cobalt(II)-TAC complex at pH 6.
(a) TAC 4x10⁻⁵ M
(b) Complex of cobalt(II)-TAC (cobalt(II) 4x10⁻⁵ M and TAC 4x10⁻⁵ M)
(a)
(b) λmax 565 nm
200.0 400.0 600.0 800.0 1000.0 0.000
1.000
0.800
0.200
0.400
0.600
(a) (b) λmax 588 nm
200.0 400.0 600.0 800.0 1000.0 0.000
1.000
0.800
0.200
0.400
0.600

41
Figure 19 Absorption spectra of TAC and cobalt(II)-TAC complex at pH 7.
(a) TAC 4x10⁻⁵ M
(b) Complex of cobalt(II)-TAC (cobalt(II) 4x10⁻⁵ M and TAC 4x10⁻⁵ M)
Figure 20 Absorption spectra of TAC and cobalt(II)-TAC complex at pH 8.
(a) TAC 4x10⁻⁵ M
(b) Complex of cobalt(II)-TAC (cobalt(II) 4x10⁻⁵ M and TAC 4x10⁻⁵ M)
(a) (b) λmax 560 nm
200.0 400.0 600.0 800.0 1000.0 0.000
1.000
0.800
0.200
0.400
0.600
(a)
(b) λmax 558 nm
200.0 400.0 600.0 800.0 1000.0 0.000
1.000
0.800
0.200
0.400
0.600

42
Figure 21 Absorption spectra of TAC and cobalt(II)-TAC complex at pH 9.
(a) TAC 4x10⁻⁵ M
(b) Complex of cobalt(II)-TAC (cobalt(II) 4x10⁻⁵ M and TAC 4x10⁻⁵ M)
Figure 22 Absorption spectra of TAC and cobalt(II)-TAC complex at pH 10.
(a) TAC 4x10⁻⁵ M
(b) Complex of cobalt(II)-TAC (cobalt(II) 4x10⁻⁵ M and TAC 4x10⁻⁵ M)
(a)
(b) λmax 632 nm
200.0 400.0 600.0 800.0 1000.0 0.000
1.000
0.800
0.200
0.400
0.600
(a)
(b) λmax 628 nm
200.0 400.0 600.0 800.0 1000.0 0.000
1.000
0.800
0.200
0.400
0.600

43
Table 7 Complex formation between cobalt(II) and TAC at pH 5-10
pH Color of TAC
solution
Color of Co(II)-TAC
complex solution λmax
5
6
7
8
9
10
light yellow
light yellow
yellow
red
red
red
yellow brown
yellow brown
violet
violet
green
green
588
565
558
560
628
632
The absorption spectra of TAC and lead(II) complex at pH 6 and 7 are shown
in Figures 23, 24 and Table 8. From the results, lead(II) formed yellow brown
complexes with TAC at pH 6 and 7. At pH 9 and 10, TAC formed violet complexes
with lead(II) but these complexes precipitated immediately.
Figure 23 Absorption spectra of TAC and lead(II)-TAC complex at pH 6.
(a) TAC 4x10⁻⁵ M
(b) Complex of lead(II)-TAC (lead(II) 4x10⁻⁵ M and TAC 4x10⁻⁵ M)
200.0 400.0 600.0 800.0 1000.0 0.000
1.000
0.800
0.200
0.400
0.600
(a) (b) λmax 589 nm

44
Figure 24 Absorption spectra of TAC and lead(II)-TAC complex at pH 7.
(a) TAC 4x10⁻⁵ M
(b) Complex of lead(II)-TAC (lead(II) 4x10⁻⁵ M and TAC 4x10⁻⁵ M)
Table 8 Complex formation between lead(II) and TAC at pH 6-10
pH Color of TAC
solution
Color of Co(II)-TAC
complex solution λmax
6
7
8
9
10
light yellow
yellow
red
red
red
yellow brown solution
yellow brown solution
violet precipitate
violet precipitate
violet precipitate
589
586
-
-
-
0.000
1.000
0.800
0.200
0.400
0.600
(a)
(b) λmax 586 nm
200.0 400.0 600.0 800.0

45
5. Stoichiometric determination of complex between 2-(2′-thiazolylazo)-p-cresol
(TAC) and cobalt(II) and between TAC and lead(II) by continuous variation
method
The stoichiometry of complex between cobalt(II) and 2-(2′-thiazolylazo)-p-
cresol (TAC) was determined by continuous variation method at pH 5, 6, 7, 8, 9 and
10. The results are shown in Figures 25 to 40 and Table 9. The maximum absorption
from spectra (shown in Figure 17, 18, 19, 20, 21 and 22) of cobalt(II) complex at pH
5, 6, 7, 8, 9 and 10 were 588, 565, 558, 560, 628 and 632 nm, respectively. Therefore,
these wavelengths were chosen as reasonable wavelength for studying on the
formation of cobalt(II) complex at the corresponding pH.
Figure 25 Stoichiometric determination of complex between cobalt(II) and TAC in
acetic acid and sodium acetate buffer solution at pH 5.
0.0000
0.0100
0.0200
0.0300
0.0 0.2 0.4 0.6 0.8 1.0
Mole fraction of cobalt(II)
Abso
rban
ce
0.35

46
Figure 26 Stoichiometric determination of complex between cobalt(II) and TAC in
potassium hydrogen phthalate and sodium hydroxide buffer solution at
pH 5.
Figure 27 Stoichiometric determination of complex between cobalt(II) and TAC in
acetic acid and sodium acetate buffer solution at pH 6.
0.0000
0.0100
0.0200
0.0300
0.0 0.2 0.4 0.6 0.8 1.0
Mole fraction of cobalt(II)
Abso
rban
ce
0.32
0.0000
0.0500
0.1000
0.1500
0.2000
0.2500
0.0 0.2 0.4 0.6 0.8 1.0
Mole fraction of cobalt(II)
Abso
rban
ce
0.36

47
Figure 28 Stoichiometric determination of complex between cobalt(II) and TAC in
potassium dihydrogen phosphate and sodium hydroxide buffer solution
at pH 6.
Figure 29 Stoichiometric determination of complex between cobalt(II) and TAC in
sodium dihydrogen phosphate and disodium hydrogen phosphate buffer
solution at pH 7.
0.0000
0.0500
0.1000
0.1500
0.2000
0.0 0.2 0.4 0.6 0.8 1.0
Mole fraction of cobalt(II)
Abso
rban
ce
0.35
0.0000
0.1000
0.2000
0.3000
0.0 0.2 0.4 0.6 0.8 1.0
Mole fraction of cobalt(II)
Abso
rban
ce
0.32

48
Figure 30 Stoichiometric determination of complex between cobalt(II) and TAC in
potassium dihydrogen phosphate and sodium hydroxide buffer solution
at pH 7.
Figure 31 Stoichiometric determination of complex between cobalt(II) and TAC in
tris-(hydroxymethyl)aminomethane and hydrochloric acid buffer solution
at pH 7.
0.0000
0.1000
0.2000
0.3000
0.4000
0.0 0.2 0.4 0.6 0.8 1.0
Mole fraction of cobalt(II)
Abso
rban
ce
0.32
0.0000
0.1000
0.2000
0.3000
0.4000
0.0 0.2 0.4 0.6 0.8 1.0
Mole fraction of cobalt(II)
Abso
rban
ce
0.32

49
Figure 32 Stoichiometric determination of complex between cobalt(II) and TAC in
ammonium hydroxide and ammonium chloride buffer solution at pH 8.
Figure 33 Stoichiometric determination of complex between cobalt(II) and TAC in
potassium dihydrogen phosphate and sodium hydroxide buffer solution
at pH 8.
0.0000
0.1000
0.2000
0.3000
0.0 0.2 0.4 0.6 0.8 1.0
Mole fraction of cobalt(II)
Abso
rban
ce
0.33
0.0000
0.1000
0.2000
0.3000
0.4000
0.0 0.2 0.4 0.6 0.8 1.0
Mole fraction of cobalt(II)
Abs
orba
nce
0.34

50
Figure 34 Stoichiometric determination of complex between cobalt(II) and TAC in
tris-(hydroxymethyl)aminomethane and hydrochloric acid buffer solution
at pH 8.
Figure 35 Stoichiometric determination of complex between cobalt(II) and TAC in
ammonium hydroxide and ammonium chloride buffer solution at pH 9.
0.0000
0.1000
0.2000
0.3000
0.0 0.2 0.4 0.6 0.8 1.0
Mole fraction of cobalt(II)
Abso
rban
ce
0.49
0.0000
0.1000
0.2000
0.3000
0.0 0.2 0.4 0.6 0.8 1.0
Mole fraction of cobalt(II)
Abso
rban
ce
0.34

51
Figure 36 Stoichiometric determination of complex between cobalt(II) and TAC in
sodium hydrogen carbonate and sodium carbonate buffer solution at pH 9.
Figure 37 Stoichiometric determination of complex between cobalt(II) and TAC in
tris-(hydroxymethyl)aminomethane and hydrochloric acid buffer solution
at pH 9.
0.0000
0.0500
0.1000
0.1500
0.0 0.2 0.4 0.6 0.8 1.0
Mole fraction of cobalt(II)
Abso
rban
ce
0.44
0.0000
0.0500
0.1000
0.1500
0.2000
0.2500
0.0 0.2 0.4 0.6 0.8 1.0
Mole fraction of cobalt(II)
Abso
rban
ce
0.36

52
Figure 38 Stoichiometric determination of complex between cobalt(II) and TAC in
ammonium hydroxide and ammonium chloride buffer solution at pH 10.
Figure 39 Stoichiometric determination of complex between cobalt(II) and TAC in
sodium hydrogen carbonate and sodium carbonate buffer solution at
pH 10.
0.0000
0.0500
0.1000
0.1500
0.2000
0.0 0.2 0.4 0.6 0.8 1.0
Mole fraction of cobalt(II)
Abso
rban
ce
0.33
0.0000
0.0500
0.1000
0.1500
0.2000
0.0 0.2 0.4 0.6 0.8 1.0
Mole fraction of cobalt(II)
Abso
rban
ce
0.58

53
Figure 40 Stoichiometric determination of complex between cobalt(II) and TAC in
tris-(hydroxymethyl)aminomethane and hydrochloric acid buffer solution
at pH 10.
0.0000
0.0200
0.0400
0.0600
0.0800
0.0 0.2 0.4 0.6 0.8 1.0
Mole fraction of cobalt(II)
Abso
rban
ce
0.58

54
Table 9 The ratio of cobalt(II) : TAC in the complex at pH 5, 6, 7, 8, 9 and 10 by
continuous variation method
pH of cobalt(II) complex
solution Buffer solution
The ratio of
cobalt(II) : TAC
5.0
5.0
6.0
6.0
7.0
7.0
7.0
8.0
8.0
8.0
9.0
9.0
9.0
10.0
10.0
10.0
CH3COOH/CH3COONa
KHP/NaOH
CH3COOH/CH3COONa
KH2PO4/NaOH
NaH2PO4/Na2HPO4
KH2PO4/NaOH
C4H11NO3/HCl
NH4OH/NH4Cl
KH2PO4/NaOH
C4H11NO3/HCl
NH4OH/NH4Cl
NaHCO3/Na2CO3
C4H11NO3/HCl
NH4OH/NH4Cl
NaHCO3/Na2CO3
C4H11NO3/HCl
1 : 2
1 : 2
1 : 2
1 : 2
1 : 2
1 : 2
1 : 2
1 : 2
1 : 2
1 : 2
1 : 1
1 : 2
1 : 1
1 : 1
1 : 2
1 : 1
At pH higher than pKa (pH 9 and 10), TAC is in basic form, which hydroxyl group
was deprotonated and the oxygen atom could form strong coordinate covalent bond with
metal ions. So TAC might acted as tridentate ligand in the complex formation. On the other
hand, at pH lower than pKa (pH 5-8), TAC is in acid form, therefore hydroxyl group could
form weaker bond with metal ions. In this case, TAC might acted as bidentate ligand which
the ratio of cobalt(II) : TAC was 1 : 2. However, TAC in acid form as the tridentate ligand
could not rule out.

55
At pH lower than the pKa (pH 5-8), type of buffer did not has effect on the
complexation between cobalt(II) and TAC. The ratio of cobalt(II) : TAC was 1 : 2. At pH 9
and 10, the ratio of cobalt(II) : TAC were 1 : 2 for NaHCO3/Na2CO3 buffer and 1 : 1 for
NH4OH/NH4Cl and C4H11NO3/HCl buffer. When the C4H11NO3/HCl buffer was used
in the preparation of complex between cobalt(II) and TAC, at pH 8 which lower than
the pKa the ratio was 1 : 2 but at pH 9 and 10 which higher than the pKa the ratio was
1 : 1. This may be because nitrogen atom of the buffer molecules could be the donor
atom for the complexation with cobalt(II). While the molecule of NaHCO3/Na2CO3
buffer could not coordinate with cobalt(II) because the oxygen atom in this buffer was
the hard base comparing with the nitrogen atom of TAC.
The postulated structures from continuous variation method of ratio 1 : 1 and 1 : 2
of cobalt(II)-TAC complex are shown in Figure 41.
Figure 41 Postulated structures of cobalt(II)-TAC complex.
(a) 1 : 1 complex
(b) 1 : 2 complex (TAC as tridentate ligand)
(c) 1 : 2 complex (TAC as bidentate ligand)
O
CoN
NN
S
H3C
N
S
NN
O CH32+
H
H
N
N
CH3
O
Co2+
S
N
(a)
(b)
OH
H3C
NN Co2+
N
S
NS
NN
HO CH3
(c)

56
Figures 42 and 43 show stoichiometric determination of complexes between
lead(II) and TAC by continuous variation method at pH 6 and 7. The maximum
absorption from spectra (shown in Figures 23 and 24) of lead(II) complex at pH 6 and
7 were 589 and 586 nm, respectively. Therefore, these wavelength were chosen as
reasonable wavelength for studying on the formation of lead(II) complex at
corresponding pH. From Figure 42, the complexation ratio between lead(II) and TAC was
1 : 1. From Figure 43, at pH 7, it is difficult to make the conclusion on the complexation
ratio. This may be due to the type of buffer system. The postulated structures from
continuous variation method for the ratio of 1 : 1, lead(II)-TAC complex was already
shown in Figure 16.
Figure 42 Stoichiometric determination of complex between lead(II) and TAC in
acetic acid and sodium acetate buffer solution at pH 6.
0.0000
0.0100
0.0200
0.0300
0.0400
0.0500
0.0 0.2 0.4 0.6 0.8 1.0
Mole fraction of lead(II)
Abso
rban
ce
0.488

57
Figure 43 Stoichiometric determination of complex between lead(II) and TAC in
sodium dihydrogen phosphate and disodium hydrogen phosphate buffer
solution at pH 7.
6. Preparation of and 2-(2′-thiazolylazo)-p-cresol resin (P-TAC)
P-TAC was prepared by the immobilization of TAC on chloromethylated
polystyrene divinylbenzene. The preparation pathway of P-TAC is shown in Figure
44. The data from the infrared spectrum of P-TAC (Rerkpalin, 2003) was found that
chloromethylated polystyrene divinylbenzene was chemically modified by TAC. The
chemical modification was achieved through O-alkylation leading to the formation of
polymer-supported.
0.0000
0.0500
0.1000
0.1500
0.2000
0.0 0.2 0.4 0.6 0.8 1.0
Mole fraction of lead(II)
Abso
rban
ce

58
Figure 44 O-alkylation of chloromethylated polystyrene divinylbenzene copolymer with TAC.
The P-TAC was prepared in various organic solvents. The influence of the
type of organic solvent was examined as shown in Table 10. It shows that the
adsorption capacity of P-TAC prepared in the mixture solvent of dimethylformamide
and triethylamine (1:1) was better than other solvents.
HC
CH2
CH2
HC
CH2
CH
CH2Cl
CH2
HC
CH2
CH2ClCH3
OH
NN
S
N+
HC
CH2
CH2
HC
CH2
CH
CH2
CH2
HC
CH2
CH2 O CH3
NN
NS
O CH3
NN
SN
chloromethylated polystyrene divinylbenzene
TAC
+ HCl
P-TAC

59
Table 10 Effect of solvent on the preparation of P-TAC
Solvent Capacity of cobalt(II) (mmol g-1)
Dimethylformamide
Dimethylamine
Diethylamine
Triethylamine
Dimethylformamide : Triethylamine (1:1)
6.25 x 10⁻²
6.03 x 10⁻²
6.34 x 10⁻²
6.71 x 10⁻²
7.51 x 10⁻²
The effect of shaking time on the preparation of P-TAC is shown in Figure 45.
It was found that the adsorption capacity of P-TAC increased with increasing shaking
time up to 72 hours or above, the adsorption of cobalt(II) on the P-TAC was almost
constant. Therefore, the chelating resin (P-TAC) was synthesized from the reaction of
TAC in a mixture of 1:1 triethyamine and dimethylformamide on chloromethylated
polystyrene divinylbenzene. The mixture was shaken at room temperature for 72
hours.
Figure 45 The effect of shaking time on the preparation of P-TAC.
0
0.05
0.1
0.15
0.2
0 20 40 60 80 100
shaking time (hours)
Amou
nt o
f Co(
II) a
dsor
bed
on P
-TAC
(mm
ol/g
)

60
The result from the elemental analysis indicated that, the incorporation of
TAC on chloromethylated polystyrene divinylbenzene was 0.178 mmol of TAC per 1
g of chloromethylated polystyrene divinylbenzene. The calculation is shown in
Appendix B.
7. Determination of capacity for the adsorption of cobalt(II) by P-TAC
7.1 Optimization of parameters for the maximum adsorption of cobalt(II) on P-
TAC by batch equilibrium experiment
7.1.1 Effect of pH
The capacity of P-TAC at pH 3, 4, 5, 6 and 7 were 0.0292, 0.0357,
0.0456, 0.0878 and 0.1420 mmol/g, respectively. The results are shown in Figure 46.
It was found that the adsorption efficiency of P-TAC increased when the pH was
increased and the highest capacity for cobalt(II) on P-TAC was obtained at pH 7. Due
to the hydrolysis of cobalt(II) over pH 7 (observed white precipitate of Co(OH)2),
therefore the experiment could not be performed at the pH higher than 7.
Figure 46 Effect of pH on the adsorption of cobalt(II) by P-TAC (P-TAC 50 mg,
initial concentration of cobalt(II) 125 ppm and shaking time 3 hours).
0
0.04
0.08
0.12
0.16
2 3 4 5 6 7 8
pH
Amou
nt o
f Co(
II) a
dsor
bed
on P
-TAC
(mm
ol/g
)

61
7.1.2 Effect of initial concentration of cobalt(II)
Figure 47 indicated that the initial concentration had affect on the
adsorption of cobalt(II) by P-TAC. The capacity of P-TAC for cobalt(II) reached
maximum when the concentration of cobalt(II) was 125 ppm.
Figure 47 Effect of initial concentration of cobalt(II) on the adsorption of cobalt(II)
by P-TAC (P-TAC 50 mg, pH 7 and shaking time 3 hours).
7.1.3 Effect of shaking time
The capacity of P-TAC for the adsorption of cobalt(II) as a function of
shaking time is shown in Figure 48. It was found that the adsorption of cobalt(II) on
P-TAC increased with increasing shaking time up to 3 hours, which the capacity of P-
TAC was almost constant.
0
0.04
0.08
0.12
0.16
0 50 100 150 200
Initial concentration of Co(II) (ppm)
Amou
nt o
f Co(
II) a
dsor
bed
on P
-TAC
(mm
ol/g
)

62
Figure 48 Effect of shaking time on the adsorption of cobalt(II) by P-TAC (P-TAC
50 mg, initial concentration of cobalt(II) 125 ppm and pH 7).
From the results, the capacity of P-TAC of cobalt(II) at the optimum
condition (pH 7, shaking time 3 hours and initial concentration of cobalt(II) 125 ppm)
was 0.159 mmol/g.
7.2 Optimization of parameters for the maximum adsorption of cobalt(II) on P-
TAC by column equilibrium experiment
After all the parameters were optimized, the optimum condition was used to
determine the capacity of P-TAC for cobalt(II) by column equilibrium experiment.
The effect of flow rate on the adsorption of cobalt(II) on P-TAC had been studied.
The flow rates used in this study were 0.50, 0.33 and 0.25 ml/min. The results are
shown in Figures 49, 50 and 51 (where C0 is initial concentration of cobalt(II) and C
is concentration of cobalt(II) at each fraction). It was found that the flow rate of 0.25
ml/min was more suitable than the flow rate of 0.50 and 0.33 ml/min because the first
30 ml of cobalt(II) was adsorbed completely. The capacity of cobalt(II) on P-TAC at
flow rate 0.25 ml/min determined by breakthrough column experiment was
0
0.04
0.08
0.12
0.16
0.00 1.00 2.00 3.00 4.00 5.00
Shaking time (hours)
Amou
nt o
f Co(
II) a
dsor
bed
on P
-TAC
(mm
ol/g
)

63
9.989x10⁻³ mmol/g, which was lower than the capacity obtained from batch
equilibrium experiment.
Figure 49 Breakthrough curve of cobalt(II) on P-TAC (P-TAC 0.300 g, initial
concentration of cobalt(II) 10 ppm, pH 7 and flow rate 0.50 ml/min).
Figure 50 Breakthrough curve of cobalt(II) on P-TAC (P-TAC 0.301 g, initial
concentration of cobalt(II) 10 ppm, pH 7 and flow rate 0.33 ml/min).
0
0.2
0.4
0.6
0.8
1
1.2
0 20 40 60 80 100 120
Volume of Co(II) (ml)
C/C 0
0
0.2
0.4
0.6
0.8
1
1.2
0 10 20 30 40 50 60 70
Volume of Co(II) (ml)
C/C 0

64
Figure 51 Breakthrough curve of cobalt(II) on P-TAC (P-TAC 0.298 g, initial
concentration of cobalt(II) 10 ppm, pH 7 and flow rate 0.25 ml/min).
8. Determination of capacity for the adsorption of lead(II) by P-TAC
8.1 Optimization of parameters for the maximum adsorption of lead(II) on P-TAC
by batch equilibrium experiment
8.1.1 Effect of pH
The effect of pH on the adsorption of lead(II) was studied on pH range
from 3-6. The capacity of P-TAC at pH 3, 4, 5, 5.5 and 6 were 0.29x10⁻³, 9.95x10⁻³,
11.90x10⁻³, 14.10x10⁻³ and 10.20x10⁻³ mmol/g, respectively. The results are shown in
Figure 52. It was found that the highest capacity for lead(II) on P-TAC was obtained
at pH 5.5. The lead(II) was hydrolyzed at pH higher than 6. Therefore, pH 5.5 was
chosen as the appropriate pH for the adsorption of lead(II) on P-TAC.
0
0.2
0.4
0.6
0.8
1
0 20 40 60 80 100 120 140 160
Volume of Co(II) (ml)
C/C 0

65
Figure 52 Effect of pH on the adsorption of lead(II) by P-TAC (P-TAC 50 mg, initial
concentration of lead(II) 100 ppm and shaking time 24 hours).
8.1.2 Effect of initial concentration of lead(II)
The effect of initial concentration of lead(II) on the adsorption of
lead(II) on P-TAC was studied at pH 5.5. Figure 53 indicated the initial concentration
had affect on the adsorption of lead(II) by P-TAC. The capacity of P-TAC for lead(II)
reached maximum when the concentration of lead(II) was 100 ppm.
0
5
10
15
2 3 4 5 6 7
pH
Amou
nt o
f Pb(I
I) ad
sorb
ed o
n P-
TAC
(10-3
mm
ol/g
)

66
Figure 53 Effect of initial concentration of lead(II) on the adsorption of lead(II) by
P-TAC (P-TAC 50 mg, pH 5.5 and shaking time 24 hours).
8.1.3 Effect of shaking time
The capacity of P-TAC for the adsorption of lead(II) as a function of
shaking time is shown in Figure 54. It was found that the adsorption of lead(II) on P-
TAC increased with increasing shaking time up to 24 hours, which the capacity of P-
TAC was almost constant.
0
1
2
3
4
0 50 100 150 200 250
Initial concentration of Pb(II) (ppm)
Amou
nt o
f Pb(
II) a
dsor
bed
on P
-TAC
(10-2
mm
ol/g
)

67
Figure 54 Effect of shaking time on the adsorption of lead(II) by P-TAC (P-TAC 50
mg, initial concentration of lead(II) 100 ppm and pH 5.5).
From the results, the capacity of P-TAC of lead(II) at the optimum
condition (pH 5.5, shaking time 24 hours and initial concentration of cobalt(II) 100
ppm) was 3.45x10⁻² mmol/g.
8.2 Optimization of parameters for the maximum adsorption of lead(II) on P-
TAC by column equilibrium experiment
After all of the parameters were optimized, the optimum condition was
used to determine the capacity of P-TAC for lead(II) by column equilibrium
experiment. The effect of flow rate on the adsorption of lead(II) on P-TAC had been
studied. The flow rates used in this study were 0.50, 0.33 and 0.25 ml/min. The results
are shown in Figures 55, 56 and 57 (where C0 is initial concentration of lead(II) and C
is concentration of lead(II) at each fractions). It was found that the flow rate of 0.25
ml/min was more suitable than the flow rate of 0.50 and 0.33 ml/min because the first
40 ml of lead(II) was adsorbed completely. The capacity of lead(II) on P-TAC at flow
rate 0.25 ml/min determined by breakthrough column experiment was 2.267x10⁻²
0
1
2
3
4
0 10 20 30 40
shaking time (hours)
Amou
nt o
f Pb(
II) a
dsor
bed
on P
-TAC
(10-3
mm
ol/g
)

68
mmol/g, which was lower than the capacity obtained from batch equilibrium
experiment.
Figure 55 Breakthrough curve of lead(II) on P-TAC (P-TAC 0.299 g, initial
concentration of lead(II) 16 ppm, pH 5.5 and flow rate 0.50 ml/min).
Figure 56 Breakthrough curve of lead(II) on P-TAC (P-TAC 0.296 g, initial
concentration of lead(II) 16 ppm, pH 5.5 and flow rate 0.33 ml/min).
0
0.2
0.4
0.6
0.8
1
1.2
0 20 40 60 80 100 120 140 160
Volume of Pb(II) (ml)
C/C
0
0
0.2
0.4
0.6
0.8
1
0 50 100 150 200
Volume of Pb(II) (ml)
C/C 0
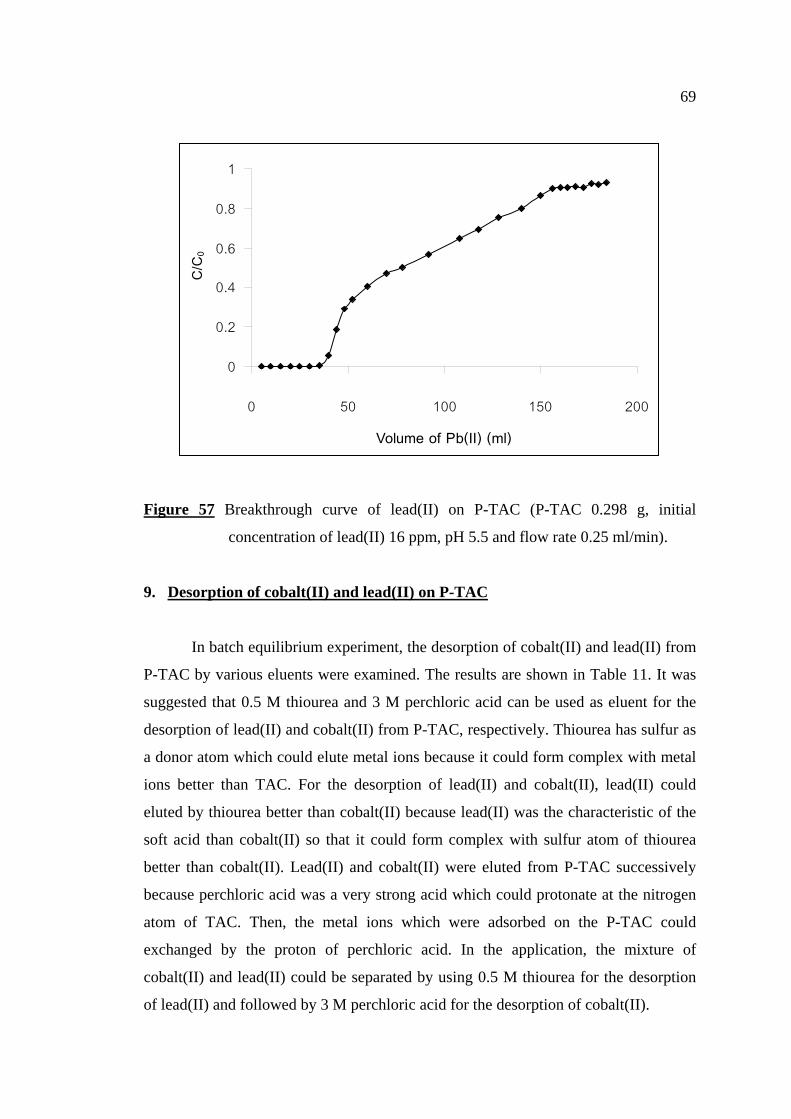
69
Figure 57 Breakthrough curve of lead(II) on P-TAC (P-TAC 0.298 g, initial
concentration of lead(II) 16 ppm, pH 5.5 and flow rate 0.25 ml/min).
9. Desorption of cobalt(II) and lead(II) on P-TAC
In batch equilibrium experiment, the desorption of cobalt(II) and lead(II) from
P-TAC by various eluents were examined. The results are shown in Table 11. It was
suggested that 0.5 M thiourea and 3 M perchloric acid can be used as eluent for the
desorption of lead(II) and cobalt(II) from P-TAC, respectively. Thiourea has sulfur as
a donor atom which could elute metal ions because it could form complex with metal
ions better than TAC. For the desorption of lead(II) and cobalt(II), lead(II) could
eluted by thiourea better than cobalt(II) because lead(II) was the characteristic of the
soft acid than cobalt(II) so that it could form complex with sulfur atom of thiourea
better than cobalt(II). Lead(II) and cobalt(II) were eluted from P-TAC successively
because perchloric acid was a very strong acid which could protonate at the nitrogen
atom of TAC. Then, the metal ions which were adsorbed on the P-TAC could
exchanged by the proton of perchloric acid. In the application, the mixture of
cobalt(II) and lead(II) could be separated by using 0.5 M thiourea for the desorption
of lead(II) and followed by 3 M perchloric acid for the desorption of cobalt(II).
0
0.2
0.4
0.6
0.8
1
0 50 100 150 200
Volume of Pb(II) (ml)
C/C
0

70
Table 11 The percentage of the desorption of cobalt(II) and lead(II) from P-TAC by
various eluents (loaded P-TAC 50 mg and shaking time 3 hours)
Eluent % Desorption of cobalt(II) % Desorption of lead(II)
1.0 M hydrochloric acid
2.0 M hydrochloric acid
3.0 M hydrochloric acid
4.0 M hydrochloric acid
5.0 M hydrochloric acid
6.0 M hydrochloric acid
0.1 M thiourea
0.25 M thiourea
0.5 M thiourea
0.75 M thiourea
1.0 M thiourea
1.0 M perchloric acid
2.0 M perchloric acid
3.0 M perchloric acid
4.0 M perchloric acid
5.0 M perchloric acid
6.0 M perchloric acid
0.1 M EDTA
0.2 M EDTA
21.15
25.21
28.72
20.16
17.42
20.57
20.07
19.79
23.25
22.47
20.61
57.20
92.66
93.41
90.50
71.74
73.57
38.92
61.51
69.28
72.61
75.26
55.36
54.82
50.20
63.05
92.65
99.27
86.02
85.54
42.30
75.75
90.83
56.76
59.38
62.16
58.90
70.69
The desorption of cobalt(II) and lead(II) by 0.5 M thiourea were obtained from
column equilibrium experiment, the results are shown in Figures 58 and 59. It was
found that the flow rate of 0.5 ml/min gave a better separation result of cobalt(II) and
lead(II) than others flow rates. At this flow rate, lead(II) was well eluted from column
but cobalt(II) was adsorbed in column at the first 26 ml.

71
Figure 58 Efficiency of the desorption of lead(II) from P-TAC by 0.5 M thiourea
(column equilibrium experiment).
Figure 59 Efficiency of the desorption of cobalt(II) from P-TAC by 0.5 M thiourea
(column equilibrium experiment).
0
10
20
30
40
50
60
0 10 20 30 40 50Volume of thiourea (ml)
Con
cent
ratio
n of
Pb(
II) (p
pm) FR = 0.50 ml/min
FR = 0.33 ml/min
FR = 0.25 ml/min
0
2
4
6
8
10
0 10 20 30 40 50Volume of thiourea (ml)
Con
cent
ratio
n of
Co(
II) (p
pm)
FR = 0.50 ml/min
FR = 0.33 ml/min
FR = 0.25 ml/min

72
10. Using P-TAC for the separation of cobalt(II) and lead(II)
From the previous study, the separation of cobalt(II) and lead(II) were
obtained by using two eluents, 0.5 M thiourea and 3 M perchloric acid. Firstly, the
Co-Pb-P-TAC column was eluted by 12 ml of 0.5 M thiourea at flow rate 0.5 ml/min
and followed by 10 ml of 3 M perchloric acid at the same flow rate. The results are
shown in Figures 60 and 61.
Figure 60 Efficiency of the desorption of cobalt(II) and lead(II) from P-TAC by 0.5
M thiourea (flow rate 0.5 ml/min).
0
5
10
15
20
0 2 4 6 8 10 12
Volume of 0.5 M thiourea
Amou
nt o
f des
orpe
d m
etal
ions
(x 1
0-4 m
mol
/g)
Pb(II)
Co(II)

73
Figure 61 Efficiency of the desorption of cobalt(II) and lead(II) from P-TAC by 3 M
HClO4 (flow rate 0.5 ml/min).
From the results showed in Figure 60, It was found that 0.5 M thiourea could
eluted both cobalt(II) and lead(II) at the same time. In order to separate the two metal
ions from each other, 0.1 M thiourea was chosen as the eluent instead of 0.5 M
thiourea. The result show in Figure 62 indicated that 0.1 M thiourea could partially
separate lead(II) from the mixture of lead(II) and cobalt(II).
Figure 62 Efficiency of the desorption of cobalt(II) and lead(II) from P-TAC by
0.1 M thiourea (flow rate 0.5 ml/min).
0
5
10
15
20
25
0 2 4 6 8 10Volume of 3 M HClO4 (ml)
Amou
nt o
f des
orpe
d me
tal io
ns
(x10
-4 m
mol/g
)
Pb(II)
Co(II)
0
2
4
6
8
10
12
0 2 4 6 8 10 12 14 16 18 20
Volume of 0.1 M thiourea (ml)
Amou
nt o
f des
orpe
d me
tal i
ons
(x10
-4 m
mol/g
)
Pb(II)
Co(II)

74
11. Efficiency of P-TAC on the adsorption of cobalt(II) and lead(II) by column
equilibrium experiment
11.1 Efficiency of P-TAC on the adsorption of cobalt(II)
The efficiency of used-P-TAC for adsorption of cobalt(II) was determined
by column equilibrium experiment. The results are shown in Figure 63. It showed that
the P-TAC can be reused as adsorbent for cobalt(II), which could be eluted from P-
TAC by 3 M perchloric acid, three times for adsorption capacity higher than 95%.
Figure 63 The percentage of efficiency of P-TAC for the adsorption of cobalt(II) by
column equilibrium experiment (P-TAC 50 mg, pH 7, initial
concentration of cobalt(II) 125 ppm and shaking time 3 hours).
0
20
40
60
80
100
% E
ffici
ency
of P
-TAC
for
Co(
II)
1 2 3 4
Number of reused P-TAC

75
11.2 Efficiency of P-TAC on the adsorption of lead(II)
The efficiency of used-P-TAC for adsorption of lead(II) was determined by
column equilibrium experiment. The results are shown in Figure 64. It showed that
the P-TAC can be reused as adsorbent for lead(II), which could be eluted from P-
TAC by 0.5 M thiourea, three times for adsorption capacity higher than 95%.
Figure 64 The percentage of efficiency of P-TAC for the adsorption of lead(II) by
column equilibrium experiment (P-TAC 50 mg, pH 5.5, initial
concentration of lead(II) 100 ppm and shaking time 24 hours).
0
20
40
60
80
100
% E
ffici
ency
of P
-TAC
for
Pb(II
)
1 2 3 4
Number of reused P-TAC

76
CONCLUSION
2-(2′-thiazolylazo)-p-cresol (TAC) has been synthesized and characterized.
The dissociation constant value (pKa) of TAC had been determined by the half height
method and the limiting absorbance method which the calculated pKa of TAC from
both methods were approximately 8.6.
The complex formation of TAC with cobalt(II) and lead(II) were studied. TAC
could form complex with cobalt(II) at pH 5.0, 6.0, 7.0, 8.0, 9.0 and 10.0. At pH 5-8,
the ratio of cobalt(II) : TAC was 1 : 2. At pH 9-10, the ratios of cobalt(II) : TAC were
1 : 1 in NaHCO3/Na2CO3 buffer solution and 1 : 2 in NH4OH/NH4Cl and C4H11NO3
/HCl buffer solutions. TAC could form complex with lead(II) at pH 6.0. The ratios of
lead(II) : TAC was 1 : 1.
The structure of complexes between TAC and cobalt(II) and between TAC
and lead(II) were determined. TAC might acted as tridentate ligand which had
nitrogen atoms of 2-aminothiazole and azo group and oxygen atom of p-cresol as
donor atoms.
A selective polystyrene-divinylbenzene sorbent containing substituted 2-(2′-
thiazolylazo)-p-cresol (P-TAC) has been developed for selective sorption of cobalt(II)
and lead(II) from aqueous solution. The optimum conditions of P-TAC for the
adsorption of cobalt(II) and lead(II) were pH 7 and 5.5, initial concentration 125 and
100 ppm and shaking time 3 and 24 hours, respectively. The loaded P-TAC has been
eluted by 3 M perchloric acid and 0.5 M thiourea for cobalt(II) and lead(II),
respectively. The efficiency of P-TAC is good, the exchange capacity of the resin
remain constant after three times of working cycles.

77
LITERATURE CITED
Chattopadhyay, P., C. Sinha and D.K. Pal. 1997. Preparation and properties of a new
chelating resin containing imidazolyl azo groups . Fresenius' J. Anal. Chem.
357(4): 368-372.
Feng, J. 1984. Spectrophotometric study of the reaction of cobalt with 2-(2-
thiazolylazo)-5-(diethylamino)phenol. Chem. Abstr. 102: 89284r
Ferreira, S.L.C., M.G.M. Andrade, I.P. Lobo and A.C.S. Costa. 1991. 2-(2-
Thiazolylazo)-p-cresol (TAC) as a reagent for the spectrophotometric
determination of lead(II). Anal. Lett. 24(9): 1675-1684.
_____________. and C.F. de Brito. 1999. Separation of cobalt after sorption onto
Amberlite XAD-2 loaded with 2-(2′-thiazolylazo)-p-cresol. Anal. Sci. 15:189-
191.
Fumiaki, K., H. Takeshita, S. Sukimoto and K. Tamaoku. 1982. Preparation of new
ligand o-(4,5-dimethyl-2-thiazolylazo)phenol and their metal complexes. J.
Inorg. Nucl. Chem. 43(11): 3013-3015.
Gandhi, M.H., K.C. Pathak and D.J. Parikh. 1990. Thiazolylazo dyes as reagents for
the detection and ring colorimetric determination of cadmium, lead and zinc.
Acta. Ciencia Indica, Chemistry. 16C(4): 371-378.
Greenwood, N.N. and A. Earnshaw. 1997. Chemistry of the elements. 2nd ed.,
Butterworth-Heinemann, Oxford. 1340p.
Grote, M. and A. Kettrup. 1985. Ion-exchangge resins containing S-bonded dithizone
and dehydrodithizone as functional groups part1. Preparation of the resins and
investigation of the sorption of noble metals and base metals. Anal. Chim.
Acta. 172: 223-239.

78
Hanna, W.G. 1999. Complexation and determination of palladium(II) ion with p-Cl-
phenylazo-R-acid spectrophotometrically. Talanta. 50: 809-818.
Hovind, H.R. 1975. Thiazolylazo dyes and their applications in analytical chemistry.
Analyst. 100: 769-796.
Jensen, B.R. 1960. 1-(2′-Thiazolylazo)-2-oxyaryl compounds as complexometric
metal indicators. Acta. Chem. Scand. 14: 927-932.
Kaneniwa, N. 1959. Metal chelates of azophenol derivatives. VI. Thiazole-p-cresol,
thiazoleazoresorcinol, and thiazoleazo--naphthol as metal indicators. Chem.
Abstr. 54: 4541g.
Kim, M.G. and B.E. Kim. 2000. Manufacturing method of polystyrene-
divinylbenzene-2-(2-thiazolylazo)-p-cresol useful for adsorption of metal
ions. Repub. Korean Kongkae Taeho Kongbo.
Komarek, J., J. Havel and L. Sommer. 1979. The use of chelates of copper, nickel,
cobalt, cadmium and zinc with heterocyclic azo dyes in the atomic absorption
spectrophotometric determination of these elements. Chem. Comm. 44(11):
3241-3255.
Lee, W., J.K. Yook, S.E. Lee and C.H. Lee. 2000. Selective separation of Zr(IV) and
Th(IV) by (polystyrene-divinylbenzene)-thiazolylazo chelating resins(I).
Anal. Sci. Technol. 13(3): 323-331.
Lemos, V.A., C.F. de Brito, A.C. Ferreira and M.A. Korn. 2002. Flame atomic
absorption spectrometric determination of cobalt after on-line
preconcentration. Canadian J. Anal. Sci. Spec. 47(2): 49-54.
79
Lim, J.H., M.K. Kim, C.H. Lee and W. Lee. 1996. Studies on the separation and
preconcentration of metal ions by using chelating resin containing
(polystyrene-divinylbenzene)-thiazolylazophenol derivatives. (I). Anal. Sci.
Technol. 9(3): 279-291.
Mao , X., F. Tang , Y. Chen , and M . Zhong . 1986 . Synthesis and analytical
characterization of a polystyrene- azo-PAR chelating resin . Huaxue Shiji .
8(5): 269-273.
Masoud, M.S., O.F. Hafez and A.A. Soayed. 1995. Chemical equilibria for some
thiazolylazo compounds and their complexes. B: Chemistry. 24(2): 45-61.
___________., M. Abd El Zaher Mostafa, R.H. Ahmed and N.H. Abd El Moneim.
2003. Structures and chemical equilibria do some N-heterocycles containing
amide linkages. Molecules. 8: 430-438
Miessler, G.L. and D.A. Tarr. 1999. Inorganic chemistry. 2nd ed., Prentice-Hall, Inc.,
London. 642p.
Mondal , B.C. and A.K. Das. 2002 . Synthesis of a new chelating resin containing
nitrogen and sulfur donor sites and its application for the removal of inorganic
arsenic from natural water . Indian Journal of Chemistry , Section A :
Inorganic , Bio-inorganic , Physical , Theoretical & Analytical Chemistry .
41A(9): 1821-1825.
Myasoedova, G.V., I.I. Antokolskaya, O.P. Shvoeva, L.I. Bolshakova and S.B.
Savvin. 1976. A selective sorbent for concontrating noble metals. Talanta. 23:
866-868.
Nakayama, M., M. Chikuma, H. Tanaka and T. Tanaka. 1982. A chelate-forming resin
bearing mercapto and azo groups and its application to the recovery of
mercury(II). Talanta. 29(6): 503-506.

80
Pavia, D.L., G.M. Lampman and G.S. Kriz. 1996. Introduction to spectroscopy. 2nd
ed., Saunders Collage Publishing, Florida.
Perrin, D.D. and B. Dempsey. 1983. Buffers for pH and metals ion control.
Chapman&Hall, New York.
Pesavento , M., A. Profumo and R . Biesuz. 1988. Sorption of protons and metal ions
from aqueous solutions by a strong- base an ion-exchange resin loaded with
sulfonated azo dyes. Talanta. 35(6): 431-437.
Pretsch, E., P. Bühlmann and C. Affolter. 2000. Structure determination of organic
compounds tables of spectral data. Springer Verlag, New York.
Rathaiah, G.V. and M.C. Eshwar. 1985. Spectrophotometric determination of lead(II)
with 1-(2′-thiazolylazo)-2-naphthol. Indian J. Technol. 23(4): 157-158.
Rerkpalin, W. 2003. Complex formation of 2-(2′-thiazolylazo)-p-cresol and its
application as chelating reagent for cadmium(II) and copper(II)., Science
thesis, Kasetsart University, Bangkok.
Saxena, R., A.K. Singh and S.S. Sambi. 1994. Synthesis of a chelating polyner metrix
by immobilizing alizarin red-S Amberlite XAD-2 and its application to the
preconcentration of lead(II), cadmium(II), zinc(II) and nickel(II). Anal. Chim.
Acta. 295: 199-204.
Shriver, D.F. and P.W. Atkins. 1999. Inorganic chemistry. 3rd ed., Oxford University
Press., New York. 763 p.
Tanaka, T., K. Hiro and A. Kawahara. 1982. Colorimetric determination of several
metal ions using polyurethane foam loaded with 2-(2-thiazolylazo)-4-
methylphenol. Osaka Kogyo Gijutsu Shikensho Kiho. 33(4): 411-415.

81
Ueda, K., Y. Koshino and Y. Yamamoto. 1985. Preconcentration of uranium in
seawater with heterocyclic azo dyes supported on silica gel. Anal. Lett.
18(A18): 2345-2359.
Vosburgh, W.C. and G.R. Cooper. 1941. Complex ions I. The identification of
complex ions in solution by spectrophotometric measurements. J. Am. Chem.
Soc. 63 : 437-442.

82
APPENDICES

83
APPENDIX A
The theoretical value of element in TAC
Molecular formula of TAC is C10H9N3SO. From molecular weight of TAC
(219.267 g/mol), the percentage of elements of TAC can be determined as follow:
Percentage of carbon = number of carbon x atomic weight of carbon x 100
= 10 x 12.011 x 100
= 54.78%
Percentage of hydrogen = number of hydrogen x atomic weight of hydrogen x 100
= 9 x 1.008 x 100
= 4.137%
Percentage of nitrogen = number of nitrogen x atomic weight of nitrogen x 100
= 3 x 14.007 x 100
= 19.16%
Percentage of sulfur = number of sulfur x atomic weight of sulfur x 100
= 1 x 32.066 x 100
= 14.62%
Molecular weight of TAC
219.267
Molecular weight of TAC
219.267
Molecular weight of TAC
219.267
Molecular weight of TAC
219.267

84
Percentage of oxygen = number of oxygen x atomic weight of oxygen x 100
= 1 x 15.999 x 100
= 7.297%
Molecular weight of TAC
219.267

85
APPENDIX B
Determination of amount of TAC immobilized on of chloromethylated
polystyrene divinylbenzene
Elemental analysis of P-TAC was found that, there are 83.95% carbon,
8.195% hydrogen, 4.463% nitrogen and 0.549% sulfur. Molecular formula and
molecular weight of TAC are C10H9N3SO and 219.268, respectively.
Chloromethylated polystyrene divinylbenzene was composed of carbon, hydrogen
and chlorine elements. From %sulfur, the weight of TAC coated on chloromethylated
polystyrene divinylbenzene can be calculated as follow:
The amount of TAC in the P-TAC = 219.268×0.549 = 3.754 g or 17.12 mmol
The weight of chloromethylated polystyrene divinylbenzene is 100-3.754 =
96.246 g. Therefore, the amount of TAC per 1 g of chloromethylated polystyrene
divinylbenzene is 0.178 mmol/g.
32.066

86
APPENDIX C
Methods applied to determine the dissociation constant (pKa) of TAC
1. Half Height Method (Masoud, 2003)
At a constant wavelength, the pK value of the compound can be evaluated
(where half of the compound exists in the ionized form and the other half in the non-
ionized). It is known that:
(γ = activity coefficient term and controlled by ionic strength of a supporting
electrolyte)
Where As is the absorbance of the solution at given pH ; Asmax the absorbance
of the solution when the total amount of reagent is in the form HnA.
An example, Appendix Figure 1 shows Absorption spectra of 4×10⁻⁵ M of p-
Cl-phenylazo-R-acid in aqueous solution of varying pH values. Changes in the
absorption spectra at various pH values were followed. Log has approximate
value by absobance, so that the relationship of absorbance and pH can plotted at
various wavelength. The pKa was obtained form the interception of lines. The results
are shown in Appendix Figure 2 (a).
2. Limiting Absorbance Methods (Masoud, 2003)
For an organic compound of formula HnA, the first ionization for the ligand
takes place as follows:
pH = pK + log γ + logAs
Asmax - As
HnA Hn-1A- + H+
As Asmax - As

87
Where As is the absorbance of the soluti on at given pH ; Asmin the absorbance
of the solution when the total amount of reagent is in the ionized form H n-1A ; Asmax
the absorbance of the solution when the total amount of reagent is in the form HnA.
Changes in the absorption spectra at various pH values were followed . The
absorbance at more characteristic wavelengths was measured as a function of the pH
value. The relationship of log(absorbance) and pH can plotted. The pKa was obtained
form the interception of lines. The results are shown in Appendix Figure 2 (b).
Appendix Figure C1 Absorption spectra of 4×10⁻⁵ M of p-Cl-phenylazo-R-acid in
aqueous solution of varying pH values.
pH = pK1 + log γ + logAs - Asmin
Asmax - As
350 410 470 530 590

88
Appendix Figure C2 (a) Absorbance–pH curves (half height method)
(b) Log(A-Amin)–pH curves (limiting absorbance method)
(a) (b)