senvion s.a., luxembourg interim report as of … · senvion s.a., luxembourg interim report as of...
TRANSCRIPT

+
Senvion S.A., Luxembourg Interim Report as of September 30, 2016 January 1, 2016 – September 30, 2016
Senvion S.A., Interim Report September 30, 2016 2
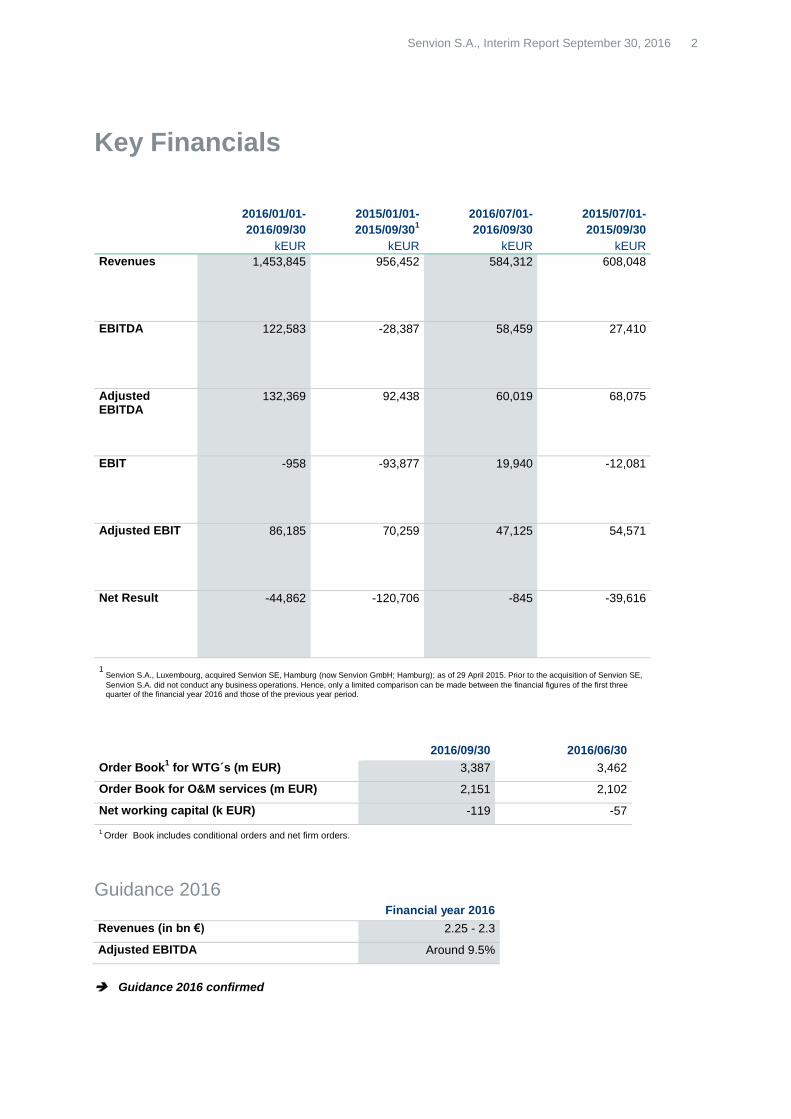
2016/01/01- 2015/01/01- 2016/07/01- 2015/07/01-
2016/09/30 2015/09/30
1 2016/09/30 2015/09/30
kEUR kEUR kEUR kEUR
Revenues 1,453,845 956,452 584,312 608,048
EBITDA 122,583 -28,387 58,459 27,410
Adjusted EBITDA
132,369 92,438 60,019 68,075
EBIT -958 -93,877 19,940 -12,081
Adjusted EBIT 86,185 70,259 47,125 54,571
Net Result -44,862 -120,706 -845 -39,616
1 Senvion S.A., Luxembourg, acquired Senvion SE, Hamburg (now Senvion GmbH; Hamburg); as of 29 April 2015. Prior to the acquisition of Senvion SE,
Senvion S.A. did not conduct any business operations. Hence, only a limited comparison can be made between the financial figures of the first three quarter of the financial year 2016 and those of the previous year period.
2016/09/30 2016/06/30
Order Book1 for WTG´s (m EUR) 3,387 3,462
Order Book for O&M services (m EUR) 2,151 2,102
Net working capital (k EUR) -119 -57
1 Order Book includes conditional orders and net firm orders.
Guidance 2016 Financial year 2016
Revenues (in bn €) 2.25 - 2.3
Adjusted EBITDA Around 9.5%
Guidance 2016 confirmed
Key Financials
Senvion S.A., Interim Report September 30, 2016 3
Key Highlights
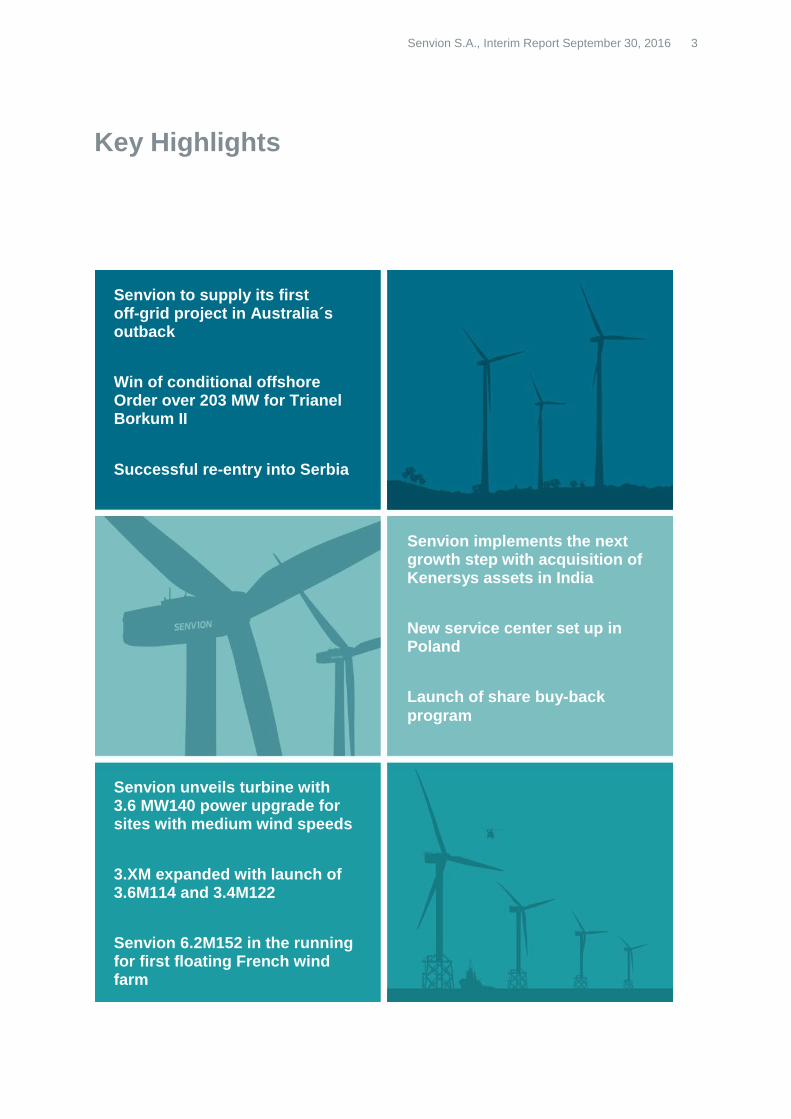
Senvion to supply its first off-grid project in Australia´s outback
Win of conditional offshore Order over 203 MW for Trianel Borkum II
Successful re-entry into Serbia
Senvion implements the next growth step with acquisition of Kenersys assets in India
New service center set up in Poland
Launch of share buy-back
program
Senvion unveils turbine with 3.6 MW140 power upgrade for sites with medium wind speeds
3.XM expanded with launch of 3.6M114 and 3.4M122
Senvion 6.2M152 in the running for first floating French wind farm
Senvion S.A., Interim Report September 30, 2016 4
Senvion is a leading global manufacturer of onshore and offshore wind turbines. The company develops,
produces and markets wind turbines for almost any location - with rated outputs of 2 MW to 6.15 MW and rotor
diameters of 82 metres to 152 metres. Furthermore, the company offers its customers project specific solutions in
the areas of turnkey, service and maintenance, transport and installation, as well as foundation planning and
construction. The systems are designed at the Senvion TechCenter in Osterrönfeld as well as in Bangalore, India.
Senvion manufactures at its German plants in Husum (North Friesland), Trampe (Brandenburg) and
Bremerhaven, as well as Portugal. With approximately 4,000 employees worldwide, the company makes use of
the experience gained from the manufacture and installation of more than 6,600 wind turbines around the world.
The company's operational subsidiary Senvion GmbH is based in Hamburg and represented by distribution
partners, subsidiaries and participations in European markets such as France, Belgium, the Netherlands, the UK,
Italy, Romania, Portugal, Sweden, and Poland as well as on a global level in the USA, China, Australia, Japan,
India and Canada. Senvion S.A. is listed on the Prime Standard of the Frankfurt Stock Exchange.
Introduction
Senvion S.A., Interim Report September 30, 2016 5
1 Performance 6
a. Consolidated Income Statement 6 b. Segment Reporting 8 c. Consolidated statements of financial position 9 d. Consolidated statement of cash flow 11 e. Key performance indicators 12
2 Consolidated financial statements as of 30 September 2016 14
a. Consolidated statement of financial position 14 b. Consolidated income statement 16 c. Consolidated statement of comprehensive income 17 d. Consolidated statement of cash flow 18 e. Consolidated statement of changes in shareholders´ equity 19 f. Information on Segment Reporting 20
3 Financial Calendar 22
4 Forward-Looking Statement 23
Contents

Senvion S.A., Interim Report September 30, 2016 6
2016/01/01- 2015/01/01- 2016/07/01- 2015/07/01-
mEUR 2016/09/30 2015/09/301 2016/09/30 2015/09/30 Comments
Revenue 1,453.8 956.5 584.3 608.0 Q3 2016 revenues slightly below last year mainly due to a decrease of onshore revenues in the German market.
EBITDA 122.6 -28.4 58.5 27.4 Unadjusted EBITDA in Q3 2016 increased as Q3 2015 was heavily impacted by PPA results (36 mEUR).
Adjusted EBITDA 132.3 92.5 60.0 68.1 Adjusted EBITDA below last years level mainly driven by lower revenue volume and higher personnel costs.
EBIT -1.0 -93.9 19.9 -12.1 Unadjusted EBIT in Q3 2016 higher as Q3 2015 was heavily impacted by PPA effects (62 mEUR).
Adjusted EBIT 86.2 70.3 47.1 54.6 Adjusted EBIT normalized for PPA results shows similar picture as adjusted EBITDA.
Net result -44.9 -120.7 -0.8 -39.6 Net result in Q3 2016 above last year's quarter due to lower impact of PPA.
1
Senvion S.A., Luxembourg, acquired Senvion SE, Hamburg (now Senvion GmbH, Hamburg); as of 29 April 2015. Prior to the acquisition of Senvion SE, Senvion S.A.
did not conduct any business operations. Hence, only a limited comparison can be made between the financial figures of the first three quarter of the financial year 2016 and those of the previous year period.
1 Performance
a. Consolidated Income Statement
Senvion S.A., Interim Report September 30, 2016 7
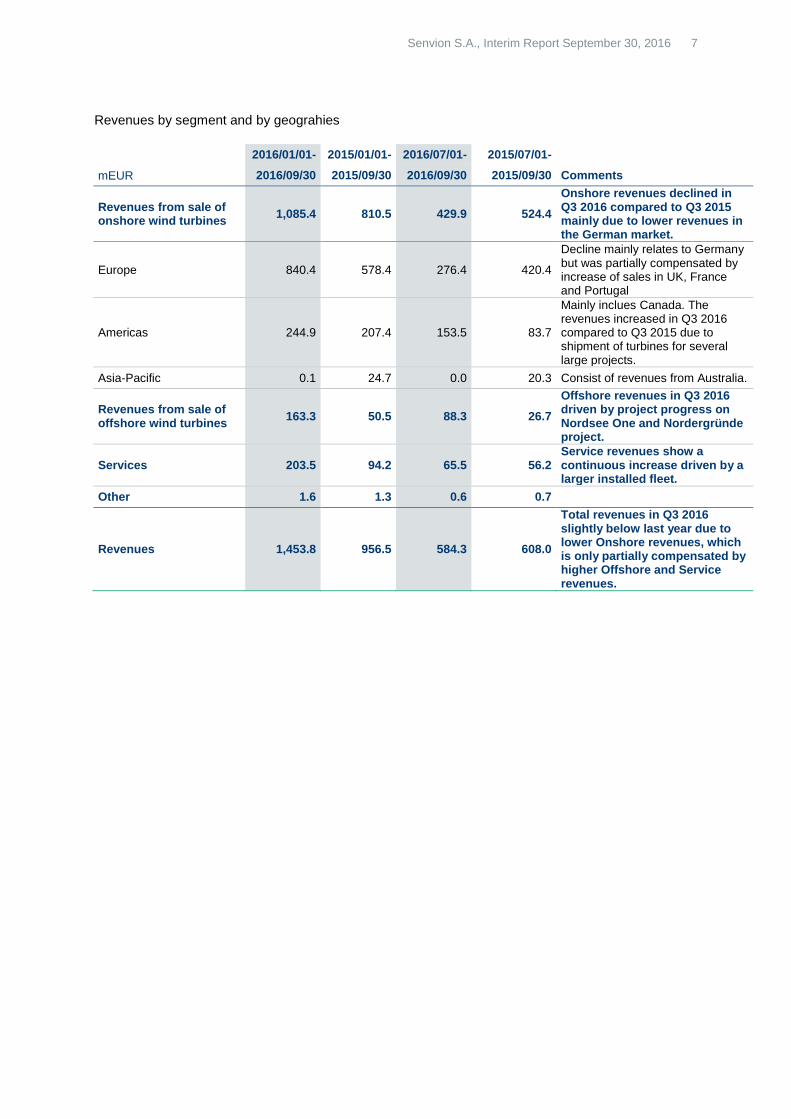
Revenues by segment and by geograhies
2016/01/01- 2015/01/01- 2016/07/01- 2015/07/01-
mEUR 2016/09/30 2015/09/30 2016/09/30 2015/09/30 Comments
Revenues from sale of onshore wind turbines
1,085.4 810.5 429.9 524.4
Onshore revenues declined in Q3 2016 compared to Q3 2015 mainly due to lower revenues in the German market.
Europe 840.4 578.4 276.4 420.4
Decline mainly relates to Germany but was partially compensated by increase of sales in UK, France and Portugal
Americas 244.9 207.4 153.5 83.7
Mainly inclues Canada. The revenues increased in Q3 2016 compared to Q3 2015 due to shipment of turbines for several large projects.
Asia-Pacific 0.1 24.7 0.0 20.3 Consist of revenues from Australia.
Revenues from sale of offshore wind turbines
163.3 50.5 88.3 26.7
Offshore revenues in Q3 2016 driven by project progress on Nordsee One and Nordergründe project.
Services 203.5 94.2 65.5 56.2 Service revenues show a continuous increase driven by a larger installed fleet.
Other 1.6 1.3 0.6 0.7
Revenues 1,453.8 956.5 584.3 608.0
Total revenues in Q3 2016 slightly below last year due to lower Onshore revenues, which is only partially compensated by higher Offshore and Service revenues.
Senvion S.A., Interim Report September 30, 2016 8
b. Segment Reporting
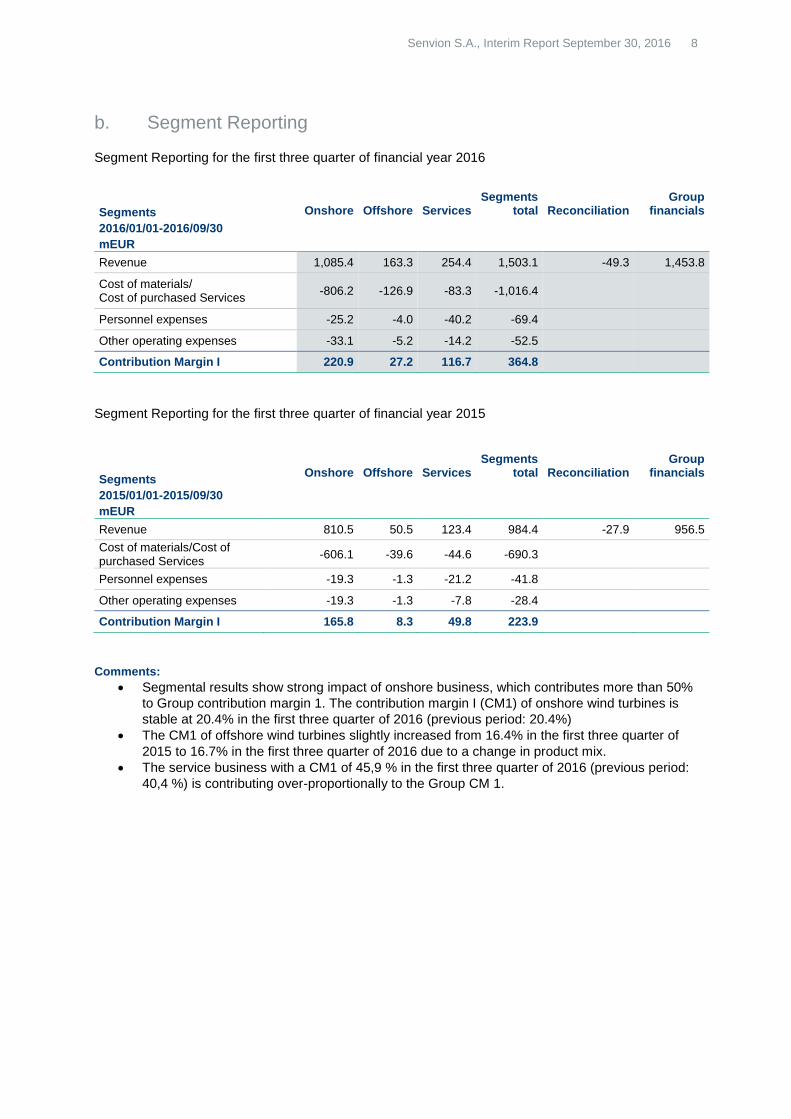
Segment Reporting for the first three quarter of financial year 2016
Segments
2016/01/01-2016/09/30
mEUR
Onshore Offshore Services Segments
total Reconciliation Group
financials
Revenue 1,085.4 163.3 254.4 1,503.1 -49.3 1,453.8
Cost of materials/ Cost of purchased Services
-806.2 -126.9 -83.3 -1,016.4
Personnel expenses -25.2 -4.0 -40.2 -69.4
Other operating expenses -33.1 -5.2 -14.2 -52.5
Contribution Margin I 220.9 27.2 116.7 364.8
Segment Reporting for the first three quarter of financial year 2015
Segments
2015/01/01-2015/09/30
mEUR
Onshore Offshore Services Segments
total Reconciliation Group
financials
Revenue 810.5 50.5 123.4 984.4 -27.9 956.5
Cost of materials/Cost of purchased Services
-606.1 -39.6 -44.6 -690.3
Personnel expenses -19.3 -1.3 -21.2 -41.8
Other operating expenses -19.3 -1.3 -7.8 -28.4
Contribution Margin I 165.8 8.3 49.8 223.9
Comments:
Segmental results show strong impact of onshore business, which contributes more than 50%
to Group contribution margin 1. The contribution margin I (CM1) of onshore wind turbines is
stable at 20.4% in the first three quarter of 2016 (previous period: 20.4%)
The CM1 of offshore wind turbines slightly increased from 16.4% in the first three quarter of
2015 to 16.7% in the first three quarter of 2016 due to a change in product mix.
The service business with a CM1 of 45,9 % in the first three quarter of 2016 (previous period:
40,4 %) is contributing over-proportionally to the Group CM 1.
Senvion S.A., Interim Report September 30, 2016 9
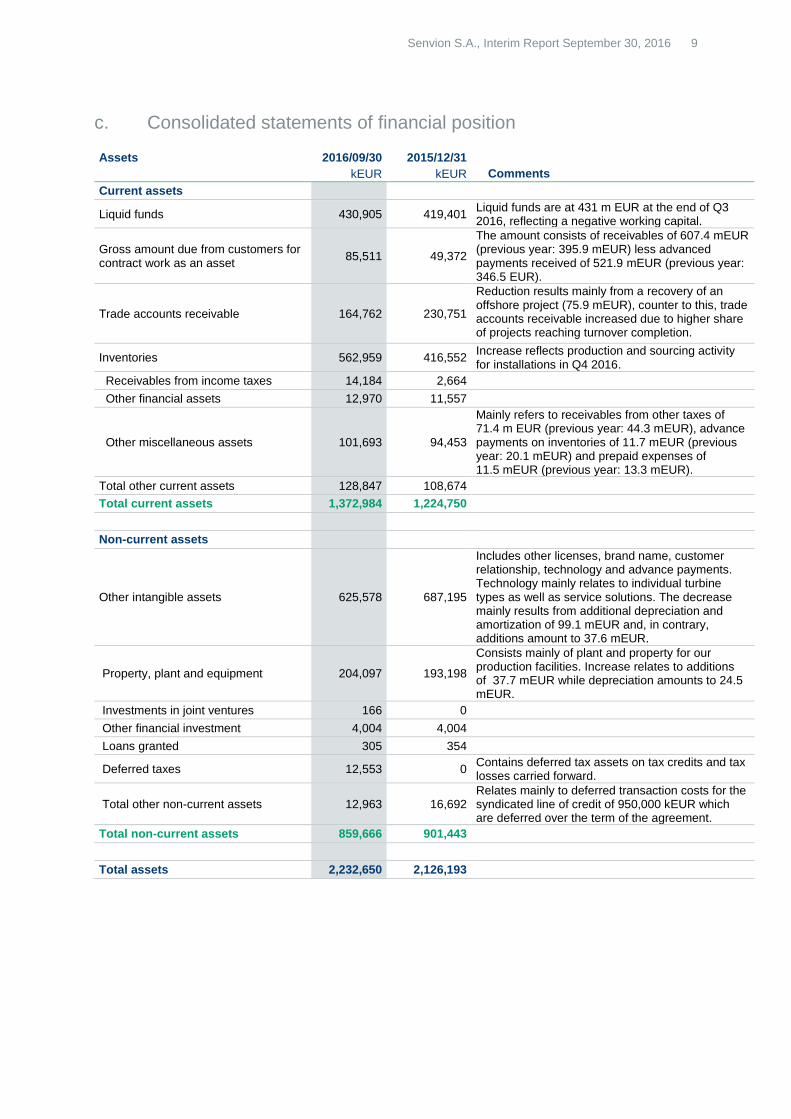
c. Consolidated statements of financial position Assets 2016/09/30 2015/12/31
kEUR kEUR Comments
Current assets
Liquid funds 430,905 419,401 Liquid funds are at 431 m EUR at the end of Q3 2016, reflecting a negative working capital.
Gross amount due from customers for contract work as an asset
85,511 49,372
The amount consists of receivables of 607.4 mEUR (previous year: 395.9 mEUR) less advanced payments received of 521.9 mEUR (previous year: 346.5 EUR).
Trade accounts receivable 164,762 230,751
Reduction results mainly from a recovery of an offshore project (75.9 mEUR), counter to this, trade accounts receivable increased due to higher share of projects reaching turnover completion.
Inventories 562,959 416,552 Increase reflects production and sourcing activity for installations in Q4 2016.
Receivables from income taxes 14,184 2,664
Other financial assets 12,970 11,557
Other miscellaneous assets 101,693 94,453
Mainly refers to receivables from other taxes of 71.4 m EUR (previous year: 44.3 mEUR), advance payments on inventories of 11.7 mEUR (previous year: 20.1 mEUR) and prepaid expenses of 11.5 mEUR (previous year: 13.3 mEUR).
Total other current assets 128,847 108,674
Total current assets 1,372,984 1,224,750
Non-current assets
Other intangible assets 625,578 687,195
Includes other licenses, brand name, customer relationship, technology and advance payments. Technology mainly relates to individual turbine types as well as service solutions. The decrease mainly results from additional depreciation and amortization of 99.1 mEUR and, in contrary, additions amount to 37.6 mEUR.
Property, plant and equipment 204,097 193,198
Consists mainly of plant and property for our production facilities. Increase relates to additions of 37.7 mEUR while depreciation amounts to 24.5 mEUR.
Investments in joint ventures 166 0
Other financial investment 4,004 4,004
Loans granted 305 354
Deferred taxes 12,553 0 Contains deferred tax assets on tax credits and tax losses carried forward.
Total other non-current assets 12,963 16,692 Relates mainly to deferred transaction costs for the syndicated line of credit of 950,000 kEUR which are deferred over the term of the agreement.
Total non-current assets 859,666 901,443
Total assets 2,232,650 2,126,193
Senvion S.A., Interim Report September 30, 2016 10
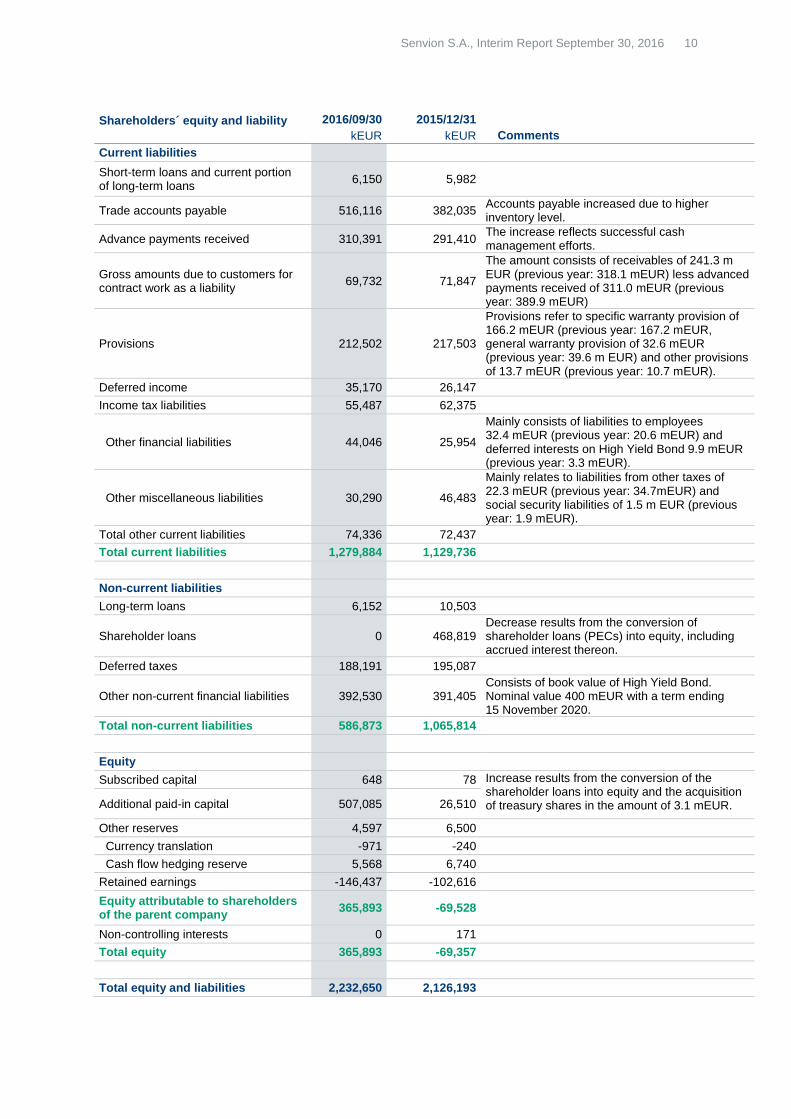
Shareholders´ equity and liability 2016/09/30 2015/12/31
kEUR kEUR Comments
Current liabilities
Short-term loans and current portion of long-term loans
6,150 5,982
Trade accounts payable 516,116 382,035 Accounts payable increased due to higher inventory level.
Advance payments received 310,391 291,410 The increase reflects successful cash management efforts.
Gross amounts due to customers for contract work as a liability
69,732 71,847
The amount consists of receivables of 241.3 m EUR (previous year: 318.1 mEUR) less advanced payments received of 311.0 mEUR (previous year: 389.9 mEUR)
Provisions 212,502 217,503
Provisions refer to specific warranty provision of 166.2 mEUR (previous year: 167.2 mEUR, general warranty provision of 32.6 mEUR (previous year: 39.6 m EUR) and other provisions of 13.7 mEUR (previous year: 10.7 mEUR).
Deferred income 35,170 26,147
Income tax liabilities 55,487 62,375
Other financial liabilities 44,046 25,954
Mainly consists of liabilities to employees 32.4 mEUR (previous year: 20.6 mEUR) and deferred interests on High Yield Bond 9.9 mEUR (previous year: 3.3 mEUR).
Other miscellaneous liabilities 30,290 46,483
Mainly relates to liabilities from other taxes of 22.3 mEUR (previous year: 34.7mEUR) and social security liabilities of 1.5 m EUR (previous year: 1.9 mEUR).
Total other current liabilities 74,336 72,437
Total current liabilities 1,279,884 1,129,736
Non-current liabilities
Long-term loans 6,152 10,503
Shareholder loans 0 468,819 Decrease results from the conversion of shareholder loans (PECs) into equity, including accrued interest thereon.
Deferred taxes 188,191 195,087
Other non-current financial liabilities 392,530 391,405 Consists of book value of High Yield Bond. Nominal value 400 mEUR with a term ending 15 November 2020.
Total non-current liabilities 586,873 1,065,814
Equity
Subscribed capital 648 78 Increase results from the conversion of the shareholder loans into equity and the acquisition of treasury shares in the amount of 3.1 mEUR. Additional paid-in capital 507,085 26,510
Other reserves 4,597 6,500
Currency translation -971 -240
Cash flow hedging reserve 5,568 6,740
Retained earnings -146,437 -102,616
Equity attributable to shareholders of the parent company
365,893 -69,528
Non-controlling interests 0 171
Total equity 365,893 -69,357
Total equity and liabilities 2,232,650 2,126,193
Senvion S.A., Interim Report September 30, 2016 11
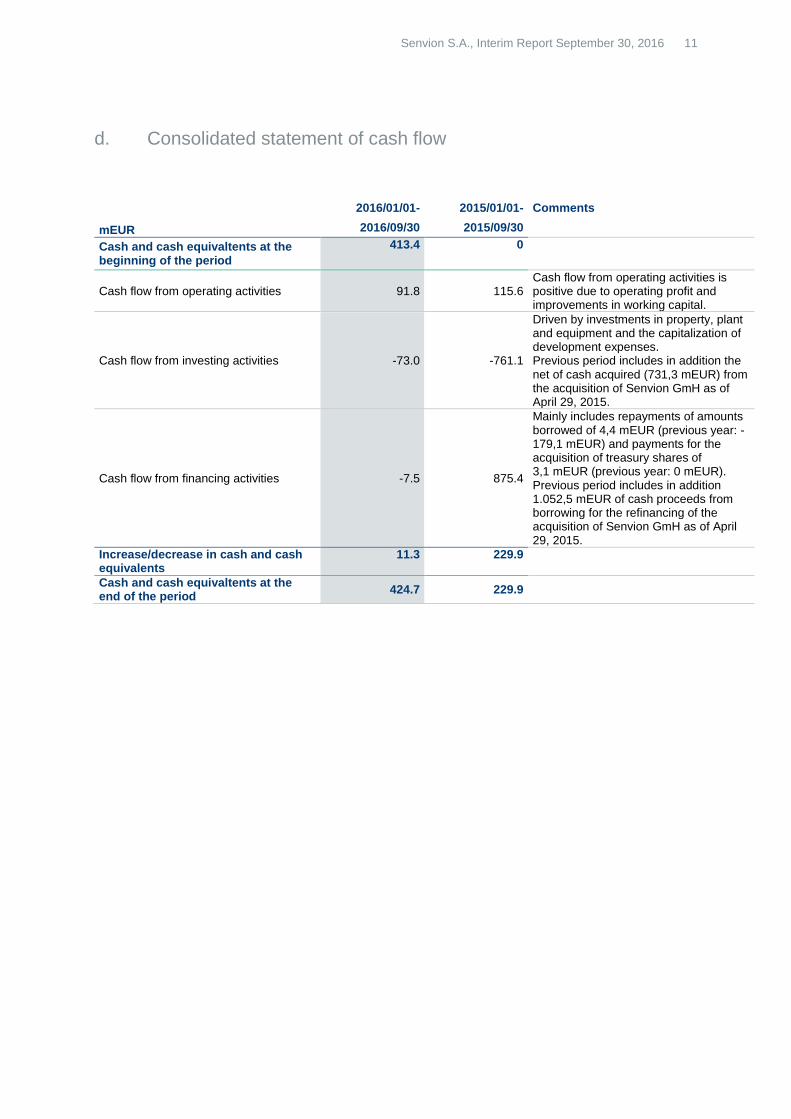
d. Consolidated statement of cash flow
mEUR
2016/01/01- 2015/01/01- Comments
2016/09/30 2015/09/30
Cash and cash equivaltents at the beginning of the period
413.4 0
Cash flow from operating activities 91.8 115.6 Cash flow from operating activities is positive due to operating profit and improvements in working capital.
Cash flow from investing activities -73.0 -761.1
Driven by investments in property, plant and equipment and the capitalization of development expenses. Previous period includes in addition the net of cash acquired (731,3 mEUR) from the acquisition of Senvion GmH as of April 29, 2015.
Cash flow from financing activities -7.5 875.4
Mainly includes repayments of amounts borrowed of 4,4 mEUR (previous year: -179,1 mEUR) and payments for the acquisition of treasury shares of 3,1 mEUR (previous year: 0 mEUR). Previous period includes in addition 1.052,5 mEUR of cash proceeds from borrowing for the refinancing of the acquisition of Senvion GmH as of April 29, 2015.
Increase/decrease in cash and cash equivalents
11.3 229.9
Cash and cash equivaltents at the end of the period
424.7 229.9
Senvion S.A., Interim Report September 30, 2016 12
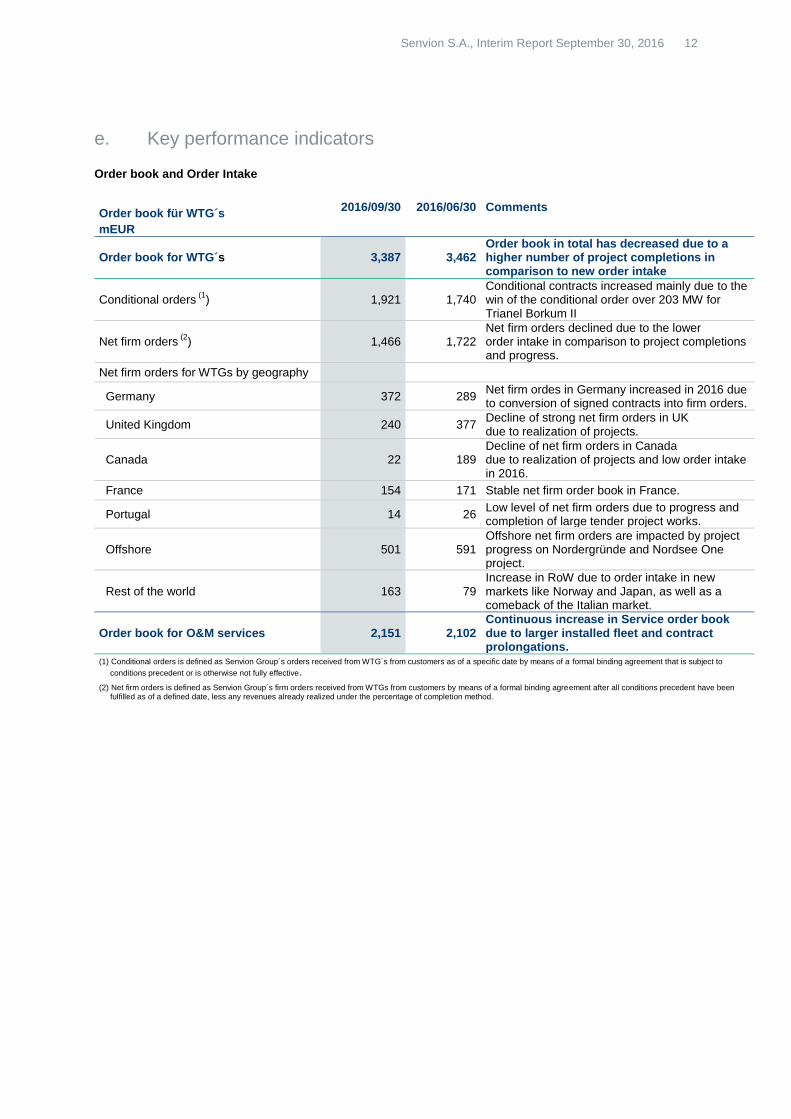
e. Key performance indicators
Order book and Order Intake
Order book für WTG´s
mEUR
2016/09/30 2016/06/30 Comments
Order book for WTG´s 3,387 3,462 Order book in total has decreased due to a higher number of project completions in comparison to new order intake
Conditional orders (1
) 1,921 1,740 Conditional contracts increased mainly due to the win of the conditional order over 203 MW for Trianel Borkum II
Net firm orders (2
) 1,466 1,722 Net firm orders declined due to the lower order intake in comparison to project completions and progress.
Net firm orders for WTGs by geography
Germany 372 289 Net firm ordes in Germany increased in 2016 due to conversion of signed contracts into firm orders.
United Kingdom 240 377 Decline of strong net firm orders in UK due to realization of projects.
Canada 22 189 Decline of net firm orders in Canada due to realization of projects and low order intake in 2016.
France 154 171 Stable net firm order book in France.
Portugal 14 26 Low level of net firm orders due to progress and completion of large tender project works.
Offshore 501 591 Offshore net firm orders are impacted by project progress on Nordergründe and Nordsee One project.
Rest of the world 163 79 Increase in RoW due to order intake in new markets like Norway and Japan, as well as a comeback of the Italian market.
Order book for O&M services 2,151 2,102 Continuous increase in Service order book due to larger installed fleet and contract prolongations.
(1) Conditional orders is defined as Senvion Group´s orders received from WTG´s from customers as of a specific date by means of a formal binding agreement that is subject to
conditions precedent or is otherwise not fully effective.
(2) Net firm orders is defined as Senvion Group´s firm orders received from WTGs from customers by means of a formal binding agreement after all conditions precedent have been fulfilled as of a defined date, less any revenues already realized under the percentage of completion method.
Senvion S.A., Interim Report September 30, 2016 13
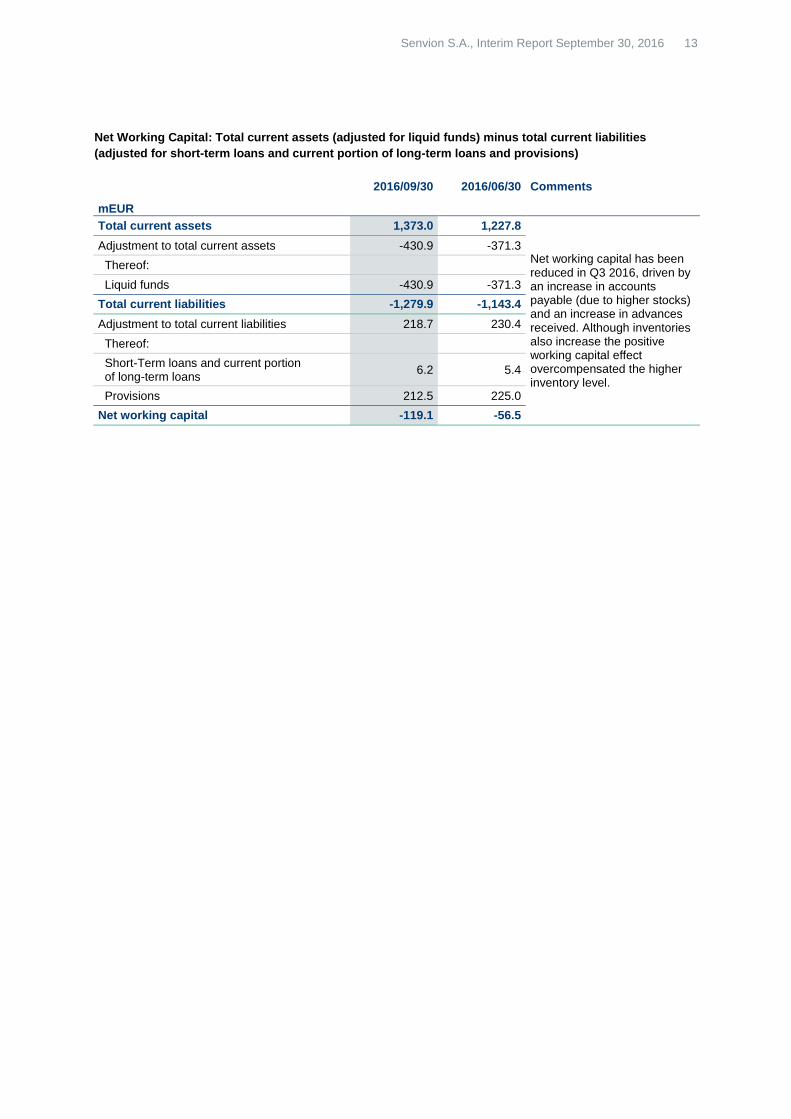
Net Working Capital: Total current assets (adjusted for liquid funds) minus total current liabilities
(adjusted for short-term loans and current portion of long-term loans and provisions)
mEUR
2016/09/30 2016/06/30 Comments
Total current assets 1,373.0 1,227.8
Net working capital has been reduced in Q3 2016, driven by an increase in accounts payable (due to higher stocks) and an increase in advances received. Although inventories also increase the positive working capital effect overcompensated the higher inventory level.
Adjustment to total current assets -430.9 -371.3
Thereof:
Liquid funds -430.9 -371.3
Total current liabilities -1,279.9 -1,143.4
Adjustment to total current liabilities 218.7 230.4
Thereof:
Short-Term loans and current portion of long-term loans
6.2 5.4
Provisions 212.5 225.0
Net working capital -119.1 -56.5
Senvion S.A., Interim Report September 30, 2016 14
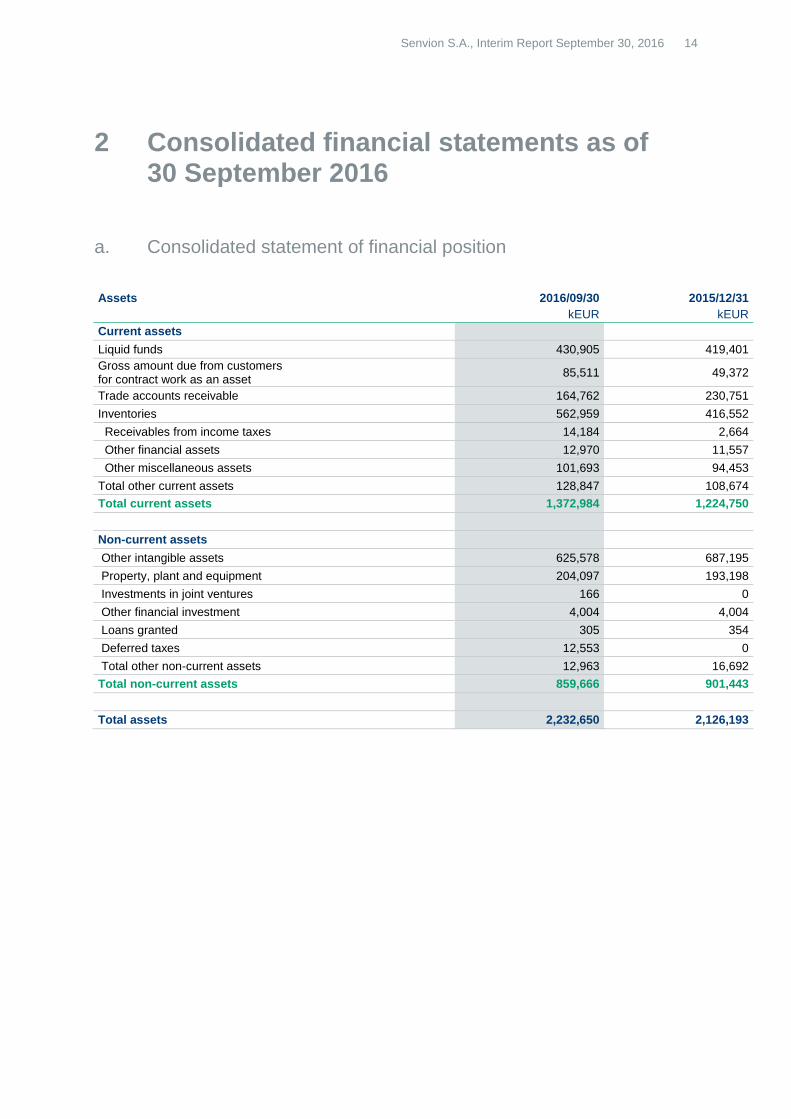
Assets 2016/09/30 2015/12/31
kEUR kEUR
Current assets
Liquid funds 430,905 419,401
Gross amount due from customers for contract work as an asset
85,511 49,372
Trade accounts receivable 164,762 230,751
Inventories 562,959 416,552
Receivables from income taxes 14,184 2,664
Other financial assets 12,970 11,557
Other miscellaneous assets 101,693 94,453
Total other current assets 128,847 108,674
Total current assets 1,372,984 1,224,750
Non-current assets
Other intangible assets 625,578 687,195
Property, plant and equipment 204,097 193,198
Investments in joint ventures 166 0
Other financial investment 4,004 4,004
Loans granted 305 354
Deferred taxes 12,553 0
Total other non-current assets 12,963 16,692
Total non-current assets 859,666 901,443
Total assets 2,232,650 2,126,193
2 Consolidated financial statements as of 30 September 2016
a. Consolidated statement of financial position

Senvion S.A., Interim Report September 30, 2016 15
Shareholders´ equity and liability 2016/09/30 2015/12/31
kEUR kEUR
Current liabilities
Short-term loans and current portion of long-term loans
6,150 5,982
Trade accounts payable 516,116 382,035
Advance payments received 310,391 291,410
Gross amounts due to customers for contract work as a liability
69,732 71,847
Provisions 212,502 217,503
Deferred income 35,170 26,147
Income tax liabilities 55,487 62,375
Other financial liabilities 44,046 25,954
Other miscellaneous liabilities 30,290 46,483
Total other current liabilities 74,336 72,437
Total current liabilities 1,279,884 1,129,736
Non-current liabilities
Long-term loans 6,152 10,503
Shareholder loans 0 468,819
Deferred taxes 188,191 195,087
Other non-current financial liabilities 392,530 391,405
Total non-current liabilities 586,873 1,065,814
Equity
Subscribed capital 648 78
Additional paid-in capital 507,085 26,510
Other reserves 4,597 6,500
Currency translation -971 -240
Cash flow hedging reserve 5,568 6,740
Retained earnings -146,437 -102,616
Equity attributable to shareholders of the parent company
365,893 -69,528
Non-controlling interests 0 171
Total equity 365,893 -69,357
Total equity and liabilities 2,232,650 2,126,193
Senvion S.A., Interim Report September 30, 2016 16
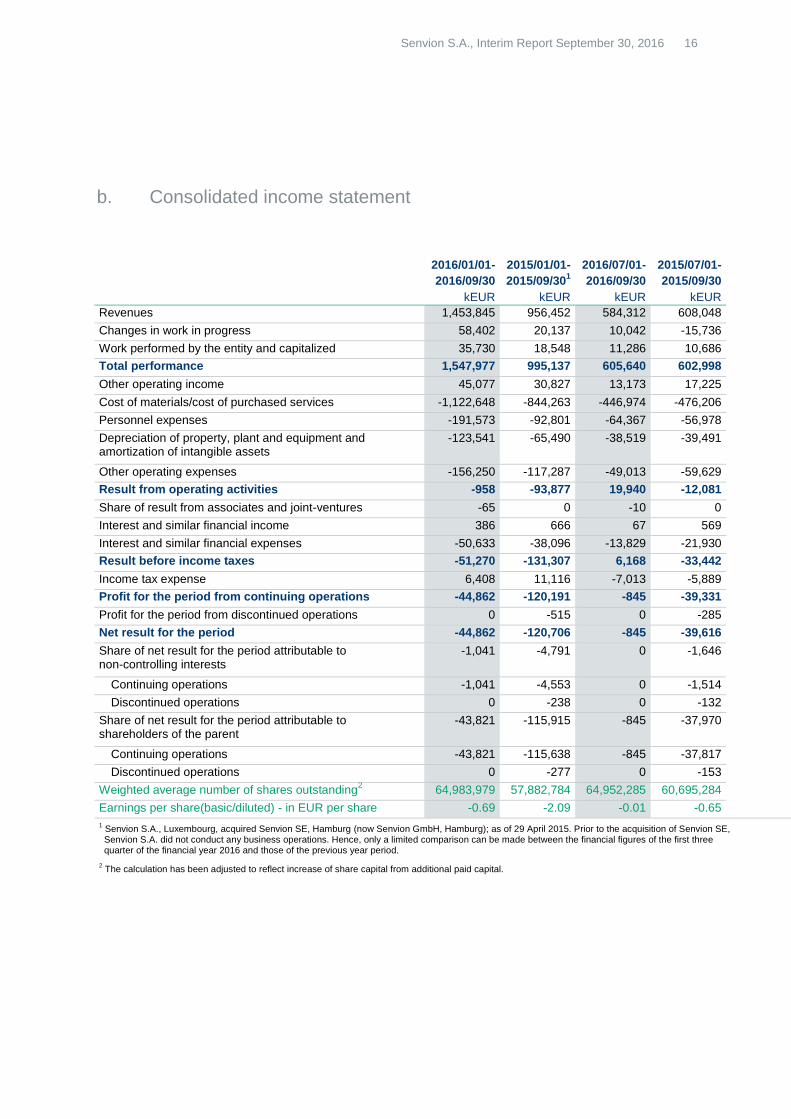
2016/01/01- 2015/01/01- 2016/07/01- 2015/07/01-
2016/09/30 2015/09/30
1 2016/09/30 2015/09/30
kEUR kEUR kEUR kEUR
Revenues 1,453,845 956,452 584,312 608,048
Changes in work in progress 58,402 20,137 10,042 -15,736
Work performed by the entity and capitalized 35,730 18,548 11,286 10,686
Total performance 1,547,977 995,137 605,640 602,998
Other operating income 45,077 30,827 13,173 17,225
Cost of materials/cost of purchased services -1,122,648 -844,263 -446,974 -476,206
Personnel expenses -191,573 -92,801 -64,367 -56,978
Depreciation of property, plant and equipment and amortization of intangible assets
-123,541 -65,490 -38,519 -39,491
Other operating expenses -156,250 -117,287 -49,013 -59,629
Result from operating activities -958 -93,877 19,940 -12,081
Share of result from associates and joint-ventures -65 0 -10 0
Interest and similar financial income 386 666 67 569
Interest and similar financial expenses -50,633 -38,096 -13,829 -21,930
Result before income taxes -51,270 -131,307 6,168 -33,442
Income tax expense 6,408 11,116 -7,013 -5,889
Profit for the period from continuing operations -44,862 -120,191 -845 -39,331
Profit for the period from discontinued operations 0 -515 0 -285
Net result for the period -44,862 -120,706 -845 -39,616
Share of net result for the period attributable to non-controlling interests
-1,041 -4,791 0 -1,646
Continuing operations -1,041 -4,553 0 -1,514
Discontinued operations 0 -238 0 -132
Share of net result for the period attributable to shareholders of the parent
-43,821 -115,915 -845 -37,970
Continuing operations -43,821 -115,638 -845 -37,817
Discontinued operations 0 -277 0 -153
Weighted average number of shares outstanding2 64,983,979 57,882,784 64,952,285 60,695,284
Earnings per share(basic/diluted) - in EUR per share -0.69 -2.09 -0.01 -0.65
1 Senvion S.A., Luxembourg, acquired Senvion SE, Hamburg (now Senvion GmbH, Hamburg); as of 29 April 2015. Prior to the acquisition of Senvion SE,
Senvion S.A. did not conduct any business operations. Hence, only a limited comparison can be made between the financial figures of the first three quarter of the financial year 2016 and those of the previous year period.
2 The calculation has been adjusted to reflect increase of share capital from additional paid capital.
b. Consolidated income statement
Senvion S.A., Interim Report September 30, 2016 17
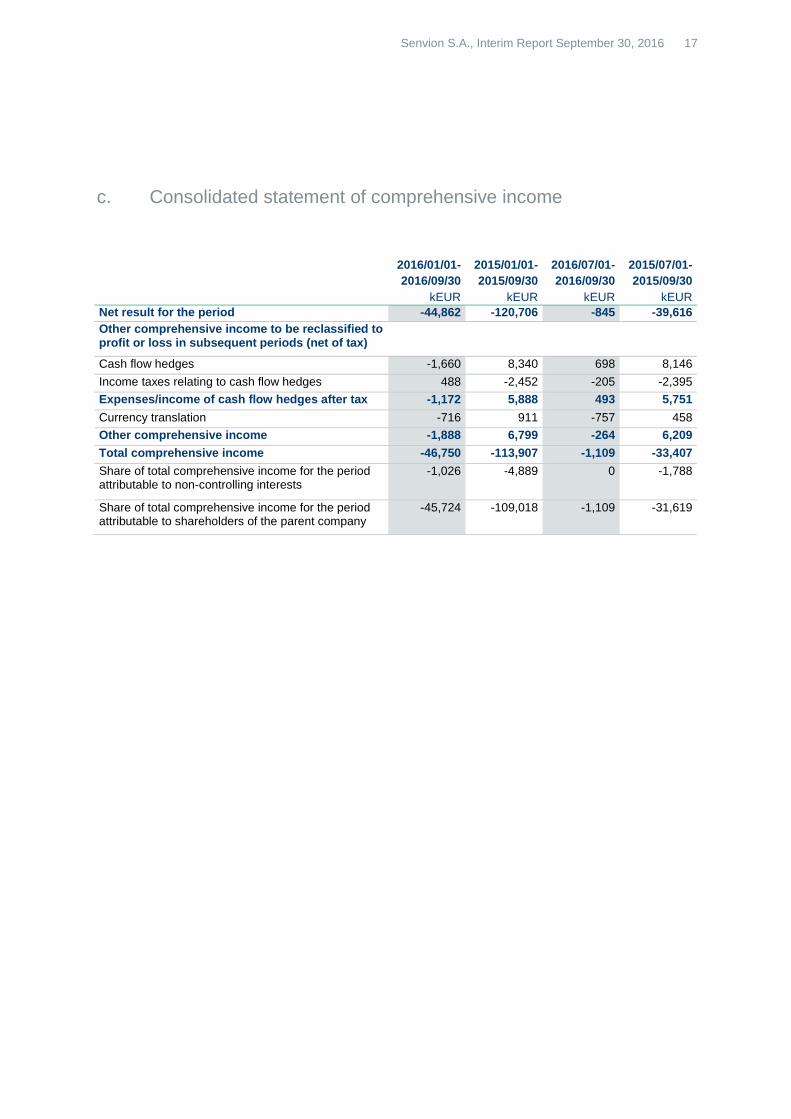
2016/01/01- 2015/01/01- 2016/07/01- 2015/07/01-
2016/09/30 2015/09/30 2016/09/30 2015/09/30
kEUR kEUR kEUR kEUR
Net result for the period -44,862 -120,706 -845 -39,616
Other comprehensive income to be reclassified to profit or loss in subsequent periods (net of tax)
Cash flow hedges -1,660 8,340 698 8,146
Income taxes relating to cash flow hedges 488 -2,452 -205 -2,395
Expenses/income of cash flow hedges after tax -1,172 5,888 493 5,751
Currency translation -716 911 -757 458
Other comprehensive income -1,888 6,799 -264 6,209
Total comprehensive income -46,750 -113,907 -1,109 -33,407
Share of total comprehensive income for the period attributable to non-controlling interests
-1,026 -4,889 0 -1,788
Share of total comprehensive income for the period attributable to shareholders of the parent company
-45,724 -109,018 -1,109 -31,619
c. Consolidated statement of comprehensive income
Senvion S.A., Interim Report September 30, 2016 18
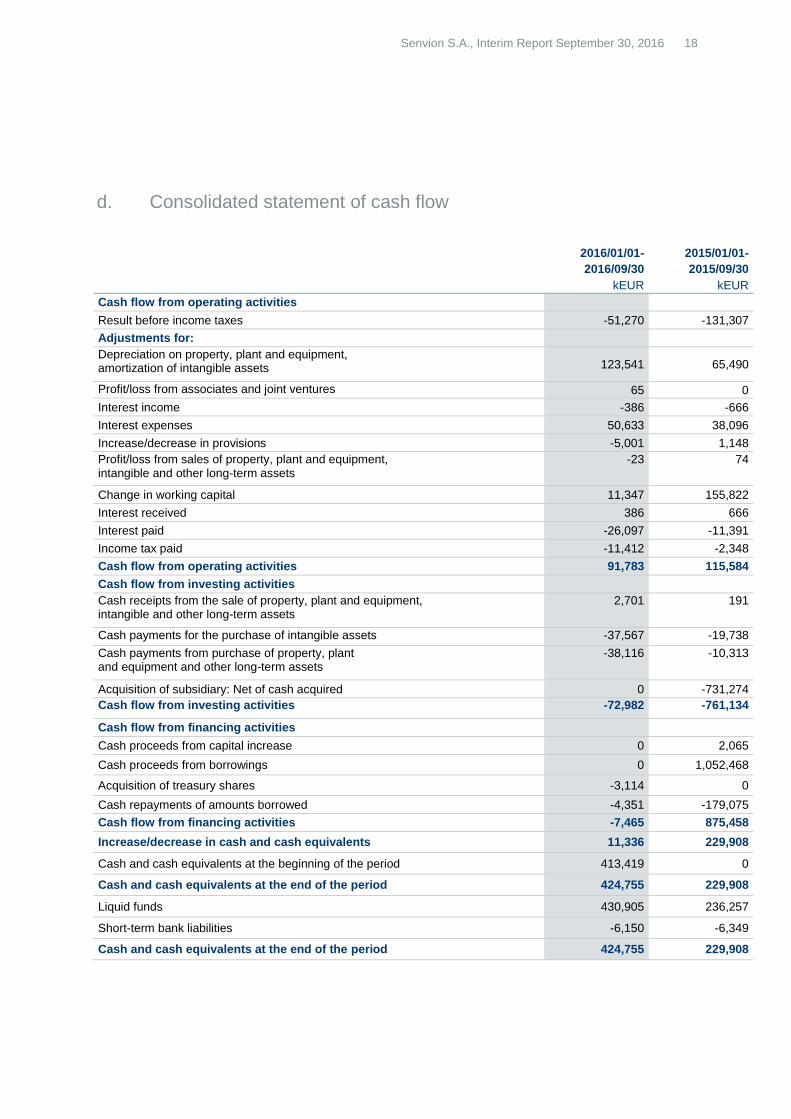
2016/01/01- 2015/01/01-
2016/09/30 2015/09/30
kEUR kEUR
Cash flow from operating activities
Result before income taxes -51,270 -131,307
Adjustments for:
Depreciation on property, plant and equipment, amortization of intangible assets 123,541 65,490
Profit/loss from associates and joint ventures 65 0
Interest income -386 -666
Interest expenses 50,633 38,096
Increase/decrease in provisions -5,001 1,148
Profit/loss from sales of property, plant and equipment, intangible and other long-term assets
-23 74
Change in working capital 11,347 155,822
Interest received 386 666
Interest paid -26,097 -11,391
Income tax paid -11,412 -2,348
Cash flow from operating activities 91,783 115,584
Cash flow from investing activities
Cash receipts from the sale of property, plant and equipment, intangible and other long-term assets
2,701 191
Cash payments for the purchase of intangible assets -37,567 -19,738
Cash payments from purchase of property, plant and equipment and other long-term assets
-38,116 -10,313
Acquisition of subsidiary: Net of cash acquired 0 -731,274
Cash flow from investing activities -72,982 -761,134
Cash flow from financing activities
Cash proceeds from capital increase 0 2,065
Cash proceeds from borrowings 0 1,052,468
Acquisition of treasury shares -3,114 0
Cash repayments of amounts borrowed -4,351 -179,075
Cash flow from financing activities -7,465 875,458
Increase/decrease in cash and cash equivalents 11,336 229,908
Cash and cash equivalents at the beginning of the period 413,419 0
Cash and cash equivalents at the end of the period 424,755 229,908
Liquid funds 430,905 236,257
Short-term bank liabilities -6,150 -6,349
Cash and cash equivalents at the end of the period 424,755 229,908
d. Consolidated statement of cash flow
Senvion S.A., Interim Report September 30, 2016 19
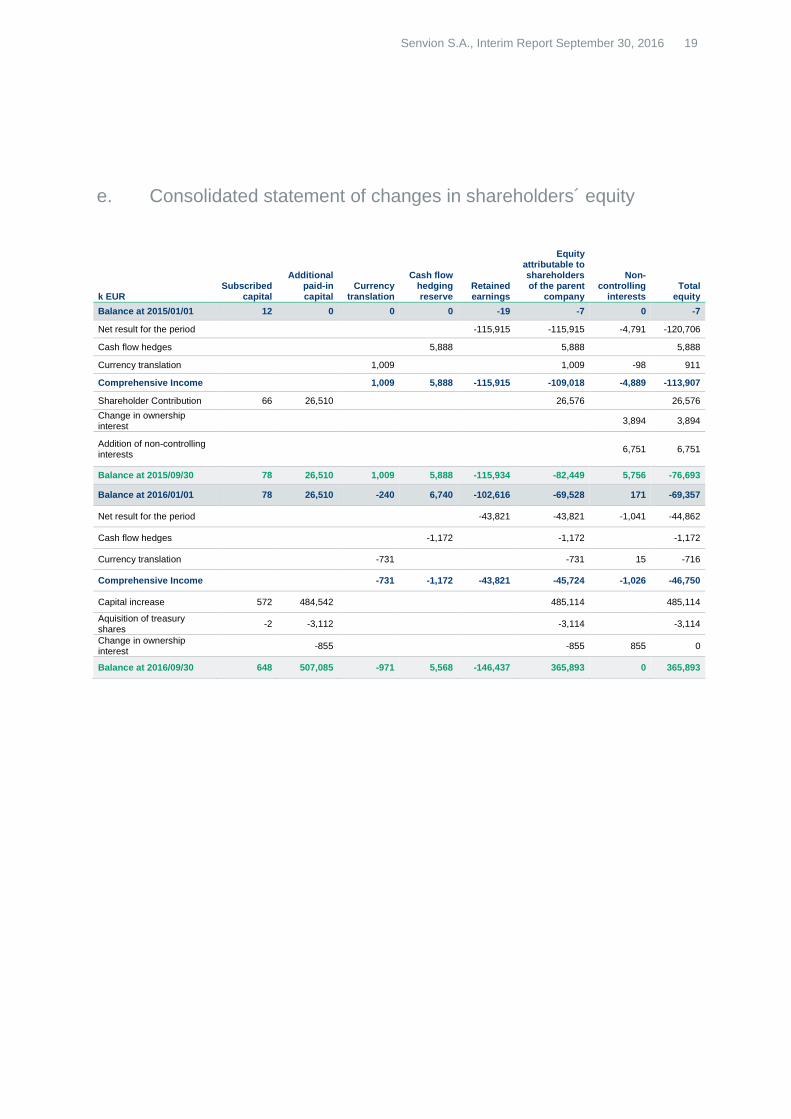
k EUR
Subscribed
capital
Additional paid-in capital
Currency translation
Cash flow hedging reserve
Retained earnings
Equity attributable to shareholders of the parent
company
Non-controlling
interests Total
equity
Balance at 2015/01/01 12 0 0 0 -19 -7 0 -7
Net result for the period -115,915 -115,915 -4,791 -120,706
Cash flow hedges 5,888 5,888 5,888
Currency translation 1,009 1,009 -98 911
Comprehensive Income 1,009 5,888 -115,915 -109,018 -4,889 -113,907
Shareholder Contribution 66 26,510 26,576 26,576
Change in ownership interest
3,894 3,894
Addition of non-controlling interests
6,751 6,751
Balance at 2015/09/30 78 26,510 1,009 5,888 -115,934 -82,449 5,756 -76,693
Balance at 2016/01/01 78 26,510 -240 6,740 -102,616 -69,528 171 -69,357
Net result for the period -43,821 -43,821 -1,041 -44,862
Cash flow hedges -1,172 -1,172 -1,172
Currency translation -731 -731 15 -716
Comprehensive Income -731 -1,172 -43,821 -45,724 -1,026 -46,750
Capital increase 572 484,542 485,114 485,114
Aquisition of treasury shares
-2 -3,112 -3,114 -3,114
Change in ownership interest
-855 -855 855 0
Balance at 2016/09/30 648 507,085 -971 5,568 -146,437 365,893 0 365,893
e. Consolidated statement of changes in shareholders´ equity

Senvion S.A., Interim Report September 30, 2016 20
Onshore Offshore Service and
Maintenance Segments
total Reconciliation
Senvion S.A. IFRS group
financials
m EUR 2016/01/01- 2016/09/30
2016/01/01- 2016/09/30
2016/01/01- 2016/09/30
Revenues 1,085.4 163.3 254.4 1,503.1 -49.3 1,453.8
> thereof external revenues 1,085.4 163.3 203.5 1,452.2 1.6
> thereof intersegment revenues 0.0 0.0 50.9 50.9 -50.9
Cost of materials/cost of purchased service
-806.2 -126.9 -83.3 -1,016.4
Personnel expenses -25.2 -4.0 -40.2 -69.4
Other operating expenses -33.1 -5.2 -14.2 -52.5
Contribution Margin I 220.9 27.2 116.7 364.8
Intersegment elemination and unallocated revenues
-49.3
Unallocated Changes in work in progress & cost of materials/cost of purchased services
-46.3
Work performed by the entity and capitalized
35.7
Other operating income 45.0
Unallocated personnel expenses -122.2
Unallocated other operating expenses
-95.4
Adjusted EBITDA 132.3
Depreciation and amortization -46.1
Adjusted EBIT 86.2
Other transaction costs -8.3
Effects from purchase price allocation -78.9
Result from operating activities (EBIT) -1.0 -1.0
Interest result -50.3
Result before income taxes (EBT) -51.3 -51.3
f. Information on Segment Reporting
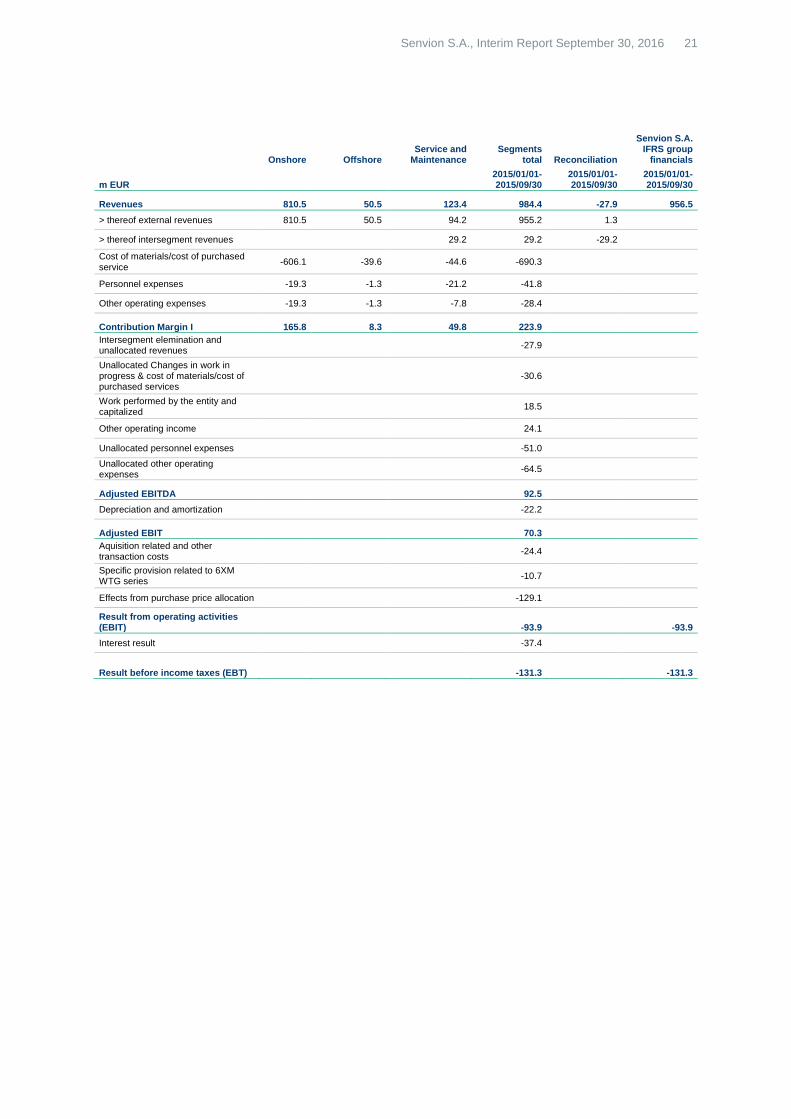
Senvion S.A., Interim Report September 30, 2016 21
Onshore Offshore Service and
Maintenance Segments
total Reconciliation
Senvion S.A. IFRS group
financials
m EUR 2015/01/01- 2015/09/30
2015/01/01- 2015/09/30
2015/01/01- 2015/09/30
Revenues 810.5 50.5 123.4 984.4 -27.9 956.5
> thereof external revenues 810.5 50.5 94.2 955.2 1.3
> thereof intersegment revenues 29.2 29.2 -29.2
Cost of materials/cost of purchased service
-606.1 -39.6 -44.6 -690.3
Personnel expenses -19.3 -1.3 -21.2 -41.8
Other operating expenses -19.3 -1.3 -7.8 -28.4
Contribution Margin I 165.8 8.3 49.8 223.9
Intersegment elemination and unallocated revenues
-27.9
Unallocated Changes in work in progress & cost of materials/cost of purchased services
-30.6
Work performed by the entity and capitalized
18.5
Other operating income 24.1
Unallocated personnel expenses -51.0
Unallocated other operating expenses
-64.5
Adjusted EBITDA 92.5
Depreciation and amortization -22.2
Adjusted EBIT 70.3
Aquisition related and other transaction costs
-24.4
Specific provision related to 6XM WTG series
-10.7
Effects from purchase price allocation -129.1
Result from operating activities (EBIT) -93.9 -93.9
Interest result -37.4
Result before income taxes (EBT) -131.3 -131.3

Senvion S.A., Interim Report September 30, 2016 22
Q3 2016 results 15 November 2016
Annual results 2016 March 2017
Annual general meeting
31 May 2017
3 Financial Calendar

Senvion S.A., Interim Report September 30, 2016 23
This presentation may contain forward-looking statements that are subject to risks and uncertainties, including those pertaining to the anticipated benefits to be realized from the proposals described herein. Forward-looking statements may include, in particular, statements about future events, future financial performance, plans, strategies, expectations, prospects, competitive environment, regulation and supply and demand. Senvion S.A. has based these forward-looking statements on its views and assumptions with respect to future events and financial performance. Actual financial performance could differ materially from that projected in the forward-looking statements due to the inherent uncertainty of estimates, forecasts and projections, and financial performance maybe better or worse than anticipated. Given these uncertainties, readers should not put undue reliance on any forward-looking statements. The information contained in this presentation is subject to change without notice and Senvion S.A. does not undertake any duty to update the forward-looking statements, and the estimates and assumptions associated with them, except to the extent required by applicable laws and regulations. Due to rounding, numbers presented through out this and other documents may not add up precisely to the totals provided and percentages may not precisely reflect the absolute figures.
4 Forward-Looking Statement

Senvion S.A., Interim Report September 30, 2016 24
Investor Relations Contacts
Dhaval Vakil
VP Capital Markets and M&A +44 20 7034 7992 [email protected] Anja Siehler
Sr. Manager Capital Markets +352 26 00 5285 [email protected] Julia Stargardt
Manager Capital Markets +49 40 5555 090 3517
Senvion S.A.
46a, Avenue John F. Kennedy
L-1855 Luxembourg
Grand Duchy of Luxembourg
T + 352 2600 5285
F + 352 2600 5301
www.senvion.com
Legal reference
This Financial Report for the first three month of fiscal year 2016 contains statements oriented to
future developments which are based on our current assumptions and prognoses. As a result of
known as well as unknown risks, uncertainty and influences, the actual results, financial situation or
development may deviate from the assumptions presented in this document. We shall not assume
any obligation to update any statements tuned to future developments.
For our international contacts, please visit:
www.senvion.com