senticart: cartography and geo-contextualization for
TRANSCRIPT
SentiCart: Cartography and Geo-contextualizationfor Multilingual Visual Sentiment
Brendan Jou∗
Electrical EngineeringColumbia UniversityNew York, NY 10027
Margaret Yuying Qian∗
Computer ScienceColumbia UniversityNew York, NY 10027
Shih-Fu ChangElectrical EngineeringColumbia UniversityNew York, NY 10027
ABSTRACTWhere in the world are pictures of cute animals or ancientarchitecture most shared from? And are they equally senti-mentally perceived across different languages? We demon-strate a series of visualization tools, that we collectively callSentiCart, for answering such questions and navigating thelandscape of how sentiment-biased images are shared aroundthe world in multiple languages. We present visualizationsusing a large-scale, self-gathered geodata corpus of >1.54Mgeo-references coming from over 235 countries mined from>15K visual concepts over 12 languages. We also highlightseveral compelling data-driven findings about multilingualvisual sentiment in geo-social interactions.
CCS Concepts•Information systems→Geographic information sys-tems; Multimedia databases; Data mining; Web in-terfaces; •Human-centered computing → Visualiza-tion; •Applied computing → Psychology; Sociology;
Keywordsaffective computing; geodata; multilingual; visual affect; sen-timent; ontology; visualization; GIS
1. INTRODUCTIONHow geographically diverse are our sentiments in social
multimedia? And specifically, how diverse (or localized)are our sentiments in the images and concepts we use ev-eryday along linguistic and geographical lines? Followingtrends of other fields, the advent of high-volume and weakly-supervised data are driving increased interest in large-scalesentiment studies in affective computing. These two dataproperties, sometimes referred to as “volume” and “verac-ity” respectively, are key elements of any Big Data problem.
∗Denotes equal contribution.
Permission to make digital or hard copies of all or part of this work for personal orclassroom use is granted without fee provided that copies are not made or distributedfor profit or commercial advantage and that copies bear this notice and the full cita-tion on the first page. Copyrights for components of this work owned by others thanACM must be honored. Abstracting with credit is permitted. To copy otherwise, or re-publish, to post on servers or to redistribute to lists, requires prior specific permissionand/or a fee. Request permissions from [email protected].
ICMR’16, June 6–9, 2016, New York, NY, USAc© 2016 ACM. ISBN 978-1-4503-4359-6/16/06. . . $15.00
DOI: http://dx.doi.org/10.1145/2911996.2912022
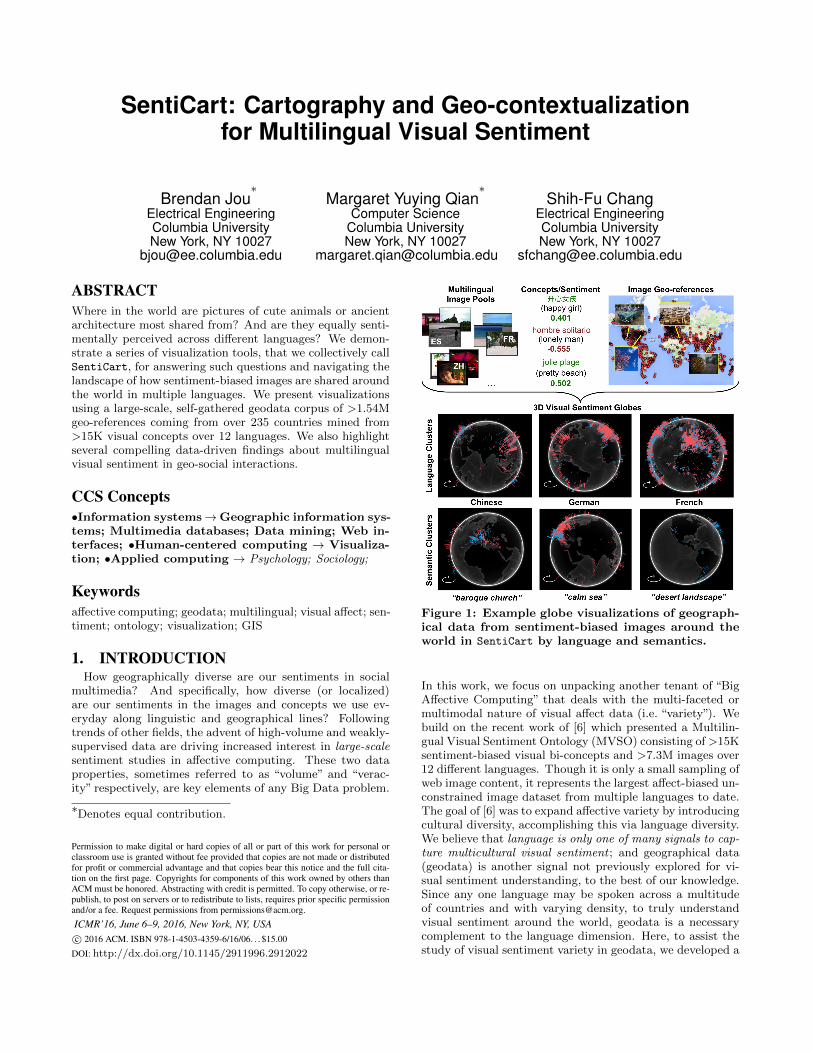
Figure 1: Example globe visualizations of geograph-ical data from sentiment-biased images around theworld in SentiCart by language and semantics.
In this work, we focus on unpacking another tenant of “BigAffective Computing” that deals with the multi-faceted ormultimodal nature of visual affect data (i.e. “variety”). Webuild on the recent work of [6] which presented a Multilin-gual Visual Sentiment Ontology (MVSO) consisting of >15Ksentiment-biased visual bi-concepts and >7.3M images over12 different languages. Though it is only a small sampling ofweb image content, it represents the largest affect-biased un-constrained image dataset from multiple languages to date.The goal of [6] was to expand affective variety by introducingcultural diversity, accomplishing this via language diversity.We believe that language is only one of many signals to cap-ture multicultural visual sentiment ; and geographical data(geodata) is another signal not previously explored for vi-sual sentiment understanding, to the best of our knowledge.Since any one language may be spoken across a multitudeof countries and with varying density, to truly understandvisual sentiment around the world, geodata is a necessarycomplement to the language dimension. Here, to assist thestudy of visual sentiment variety in geodata, we developed a

visualization system called SentiCart to chart the landscapeof multilingual visual sentiment around the world.
Contextualizing social multimedia with explicit locationor implicit geographical metadata has been a topic of re-search interest for over a decade [1][5][7]. Among the firstfor digital photography, [10] presented several frameworksfor location tag acquisition, geo-referencing and image me-dia browsing interfaces. In computer vision, [12] used geo-tagged photos to assist visual landmark detection over about20M images. In [4] and [8], Twitter posts are used to studygeographic sentiment and music preference differences, re-spectively, while in [9], Twitter and Flickr posts are analyzedspatiotemporally to map out social visual interests. Thesegeographical information systems (GIS) each lack a multi-lingual, visual grounding, or sentiment biasing componentwe seek here.
One close relative to our system is [11] where a large-scalecollection of >1.5M facial expression videos sourcing fromover 94 countries was presented. Subjects were shown oneof about 8K online videos as stimuli and their reactions werecaptured via a web camera. Although there is a wide varietyin originating locations of subjects, this study focuses moreon region-based differences rather than cultural differences.In addition, [11] also relies on explicit sentiment in facialexpression videos as a form of sentiment feedback while weuse weakly supervised semantic cues for sentiment.
In [6], an ontology of 15,630 visual concepts coming from12 different languages was presented along with accompany-ing social photos and metadata called Multilingual VisualSentiment Ontology (MVSO). Each visual concept in theontology is semantically structured and sentimentally biasedusing a construct called adjective-noun pairs (ANPs). Thenoun component provides a visual grounding to the conceptand the adjective defines a sentimental attribute, e.g. fluffydog or abandoned railroad. MVSO aimed at gathering cul-turally diverse visual concepts for studying sentiment andemotion in social multimedia; however, the ontology onlystrikes at one aspect of cultural diversity: language. Weaugment the work in [6] by also incorporating geographicaldata signals toward multicultural affect research.
The contributions of our work include: (1) an intuitive, in-teractive and fluid browsing visualization system called Sen-
tiCart for uncovering geographical insights in visual senti-ment data, (2) an implementation using large-scale visualsentiment geographical data with over 1.54M geo-referencescovering 237 countries, and (3) the public release of this ge-ographical data over a multilingual ontology.
2. GEODATA ACQUISITIONIn order to collect geo-localization data for social pho-
tos, we use a combination of two multi-source methods –one with high reliability, but low coverage and another withlower reliability, but higher coverage. We root our geodatacollection and analysis on top of MVSO [6] because of pub-licly available auxiliary data streams that can be mined fromthe same social media platform, i.e. Flickr. The multilingualnature of the data also lends itself toward being geographi-cally spread, and the large-scale nature of over 7.3M imagesmaximizes our opportunity to also study language and cul-ture together on a significant geographic scale.
2.1 GPS Coordinate DataGlobal positioning system (GPS) geo-localization provides
Language #ANPs #Georefs Language #ANPs #GeorefsArabic 22 99 Italian 3,184 206,315Chinese 395 11,553 Persian 10 92Dutch 315 16,292 Polish 67 3,873English 4,407 707,846 Russian 95 2,014French 2,241 163,193 Spanish 3,241 259,138German 717 38,544 Turkish 137 1,933
Table 1: Number of GPS-based geo-references (geo-refs) collected from MVSO [6] images by language.Since not every visual concept (ANP) had imageswith GPS data, we also show the number of remain-ing ANPs with at least one geo-referenced image.
highly reliable latitude-longitude coordinates (usually withinseveral meters worst-case depending on satellite-receiver pre-cision) and may be encoded in image headers of some digitalphotos. In November 2015, we queried the Flickr API1 overthe entire MVSO corpus [6] of 7,368,364 images and acquiredGPS coordinate data for 1,410,892 images. The remain-ing images were either not GPS-tagged or privacy permis-sions were not granted for public querying. The top threelanguages with GPS-tagged images in order are: Persian(32.24%), French (25.35%) and Italian (24.40%). Althoughthe largest language by image count is English (4,049,507),it only had a 17.48% coverage in GPS-tagged images.
2.2 Metadata-inferred Location DataIn most social media platforms, including our setting on
Flickr, users can and do often provide image title and de-scriptions to add additional context for their media posts.Locations are commonly found in these user metadata be-cause they provided a concrete grounding for where an eventor memory took place. For geo-localization though, thisdata can often be very uninformative, e.g. user input textlike “our new house,” as well as arbitrary, e.g. “Little Rock”could refer to a literal small rock in the image content ora town in Arkansas, USA. These two streams of user textfrom title and description offer greater coverage of imagesthan depending on the presence of GPS data, but introducesnoise is less reliable in localizing. As result, when GPS datais available, we always use it to geo-localize a given imageregardless of user-provided metadata. Otherwise, we pre-fer automatically extracted locations in the image title overthose in descriptions.
Using image metadata streams, we extracted location fieldsby performing named entity recognition (NER) [2] on user-provided text. We translated all text into English2 and usedonly English NER models. We note that translation allowedus to get a higher recall of tagged locations compared tonative-language NER models due to the frequency at whichusers posted descriptions with mixed languages, e.g. an im-age title “Small Alley in 香港”. We extracted metadata-inferred locations for all languages with under 100K GPS-tagged images to bolster their geo-reference count.
We applied NER-tagged locations as queries to GoogleMaps’ Geocoding API3 to retrieve latitude-longitude coordi-nates as well as to filter incorrect NER detections or ambigu-ous locations. Since geocoding queries can be region-biased,we performed multiple searches over all relevant country
1https://www.flickr.com/services/api2https://translate.google.com3https://developers.google.com/maps
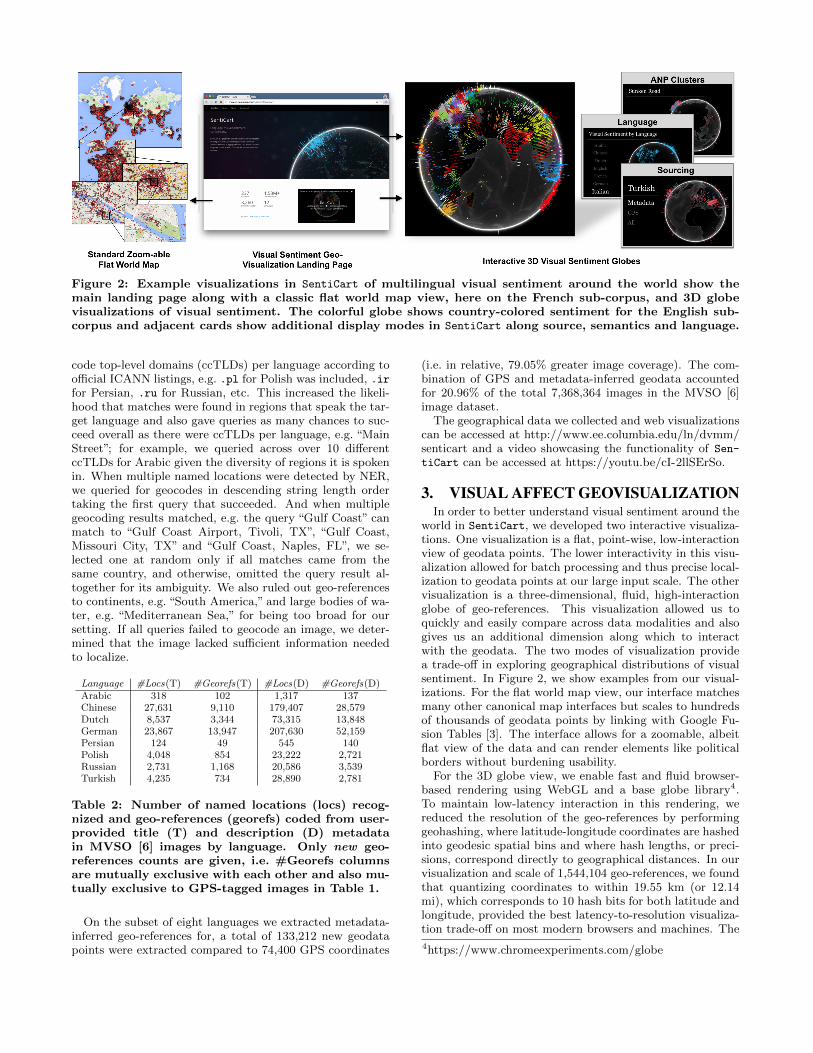
Figure 2: Example visualizations in SentiCart of multilingual visual sentiment around the world show themain landing page along with a classic flat world map view, here on the French sub-corpus, and 3D globevisualizations of visual sentiment. The colorful globe shows country-colored sentiment for the English sub-corpus and adjacent cards show additional display modes in SentiCart along source, semantics and language.
code top-level domains (ccTLDs) per language according toofficial ICANN listings, e.g. .pl for Polish was included, .irfor Persian, .ru for Russian, etc. This increased the likeli-hood that matches were found in regions that speak the tar-get language and also gave queries as many chances to suc-ceed overall as there were ccTLDs per language, e.g. “MainStreet”; for example, we queried across over 10 differentccTLDs for Arabic given the diversity of regions it is spokenin. When multiple named locations were detected by NER,we queried for geocodes in descending string length ordertaking the first query that succeeded. And when multiplegeocoding results matched, e.g. the query “Gulf Coast” canmatch to “Gulf Coast Airport, Tivoli, TX”, “Gulf Coast,Missouri City, TX” and “Gulf Coast, Naples, FL”, we se-lected one at random only if all matches came from thesame country, and otherwise, omitted the query result al-together for its ambiguity. We also ruled out geo-referencesto continents, e.g. “South America,” and large bodies of wa-ter, e.g. “Mediterranean Sea,” for being too broad for oursetting. If all queries failed to geocode an image, we deter-mined that the image lacked sufficient information neededto localize.
Language #Locs(T) #Georefs(T) #Locs(D) #Georefs(D)Arabic 318 102 1,317 137Chinese 27,631 9,110 179,407 28,579Dutch 8,537 3,344 73,315 13,848German 23,867 13,947 207,630 52,159Persian 124 49 545 140Polish 4,048 854 23,222 2,721Russian 2,731 1,168 20,586 3,539Turkish 4,235 734 28,890 2,781
Table 2: Number of named locations (locs) recog-nized and geo-references (georefs) coded from user-provided title (T) and description (D) metadatain MVSO [6] images by language. Only new geo-references counts are given, i.e. #Georefs columnsare mutually exclusive with each other and also mu-tually exclusive to GPS-tagged images in Table 1.
On the subset of eight languages we extracted metadata-inferred geo-references for, a total of 133,212 new geodatapoints were extracted compared to 74,400 GPS coordinates
(i.e. in relative, 79.05% greater image coverage). The com-bination of GPS and metadata-inferred geodata accountedfor 20.96% of the total 7,368,364 images in the MVSO [6]image dataset.
The geographical data we collected and web visualizationscan be accessed at http://www.ee.columbia.edu/ln/dvmm/senticart and a video showcasing the functionality of Sen-
tiCart can be accessed at https://youtu.be/cI-2llSErSo.
3. VISUAL AFFECT GEOVISUALIZATIONIn order to better understand visual sentiment around the
world in SentiCart, we developed two interactive visualiza-tions. One visualization is a flat, point-wise, low-interactionview of geodata points. The lower interactivity in this visu-alization allowed for batch processing and thus precise local-ization to geodata points at our large input scale. The othervisualization is a three-dimensional, fluid, high-interactionglobe of geo-references. This visualization allowed us toquickly and easily compare across data modalities and alsogives us an additional dimension along which to interactwith the geodata. The two modes of visualization providea trade-off in exploring geographical distributions of visualsentiment. In Figure 2, we show examples from our visual-izations. For the flat world map view, our interface matchesmany other canonical map interfaces but scales to hundredsof thousands of geodata points by linking with Google Fu-sion Tables [3]. The interface allows for a zoomable, albeitflat view of the data and can render elements like politicalborders without burdening usability.
For the 3D globe view, we enable fast and fluid browser-based rendering using WebGL and a base globe library4.To maintain low-latency interaction in this rendering, wereduced the resolution of the geo-references by performinggeohashing, where latitude-longitude coordinates are hashedinto geodesic spatial bins and where hash lengths, or preci-sions, correspond directly to geographical distances. In ourvisualization and scale of 1,544,104 geo-references, we foundthat quantizing coordinates to within 19.55 km (or 12.14mi), which corresponds to 10 hash bits for both latitude andlongitude, provided the best latency-to-resolution visualiza-tion trade-off on most modern browsers and machines. The
4https://www.chromeexperiments.com/globe

added dimension of the 3D globe visualization compared tothe flat world map, also allowed us to visualize the sentimentmagnitudes at given geo-localization points. Since we per-form geohashing, to aggregate sentiment in a given spatialbin, we take the weighted average of the image sentimentvalues from adjective-noun pairs.
In the globe view, we provide multiple slice views of theontology and geodata we collected. We can visualize senti-ment by language around the world and easily compare re-gional differences. On the surface of the globe, bar heightscorrespond to sentiment strengths scaled [0, h ∈ R] wherecolors represent positive or negative (usually red/“hot” andblue/“cool”). In addition, since we had multiple sources forour geodata, we can visualize each source’s geographical ori-gins to compare localization consistency. We also enable vi-sualization along ANP clusters using the ontology structurein MVSO [6] where ANPs were gathered into semanticallycoherent groups, e.g. we can visualize geodata and sentimentof images in the multilingual cluster “old town square.”
Given our geodata visualizations, we highlight several pre-liminary insights from the geo-social data we collected usingMultilingual Visual Sentiment Ontology [6] imagery. Onestriking, but in retrospect, intuitive phenomena we observedabout geodata in [6] is that despite its focus on multilingualbreadth, most language’s geodata were not as geographicallyconstrained as we expected. In fact, while there were indeedgeo-references that originated from countries where the pri-mary language was the same as the corresponding languagesource, there were also a sizable number of geo-referencesthat originated from regions outside. We hypothesize thatbecause MVSO collected its imagery from a social multi-media platform, the phenomena is due to photo tourism –that is, photos are geographically tagged in countries thatusers are just visiting and when posting on social media,they unsurprisingly still use their native tongue to describethe image. As an example, many images from the Chineseontology branch actually geo-localized to locations in Japanwith ANP tags such as 古建築 (ancient architecture)5. Yet,it is unclear how pervasive this tourism phenomena is in [6]and whether it is stronger in some languages than others,e.g. geo-references for the Spanish ANP for tropical land-scape (paisaje tropical) mostly localized to places in Mexico,Brazil, Spain and Colombia as one might expect.
In general, we found that geo-localizations for many mul-tilingual ANP clusters and their sentiments coincided withintuition. For example, clusters referring to bodies of waterlike seas and lagoons did mostly geo-localize along coast-lines and were composed of positive sentiment ANPs. Someweather-related clusters like rainy day and cloudy landscapetended to be geographically diverse and overwhelmingly neg-ative in sentiment across languages. In some cases, wheregeo-references did not occur was also telling, e.g. the ANPcluster stray cat had fewer points in Asia than Western coun-tries, likely owing to more domesticated cats in the West.
4. CONCLUSIONSWe presented a fluid and interactive visualization system
called SentiCart for visual sentiment geodata, implementedwith 1.54M latitude-longitude points over more than 235countries originating from visual concepts across 12 lan-
5Despite these two cultures sharing character sets, we veri-fied from image metadata text that users did use Chinese.
guages. We aggregated geodata from multiple sources in-cluding native GPS tagging as well as automatically ex-tracted geo-references from image metadata using naturallanguage processing and geocoding. Two modes of visualiza-tion were demonstrated in SentiCart: a flat world map viewand a 3D globe view. We also presented evidence that themultilingual ontology presented in [6] is affected by phototourism, and suggest that this is consistent with social mul-timedia and language usage phenomena. Overall, SentiCarthas provided concrete visual confirmation that multiculturalvisual sentiment is a deeply geographic-dependent entity asmuch as it is a semantically-dependent one.
In the future, we seek to expand our geo-reference cover-age by training our own or applying higher fidelity nativelanguage NER models and incorporate implicit signals fromuser profiles to better localize social photos. We also plan tomake our sentiment scores more fine-grained and accurate.In addition, we will investigate using geodata for regularizingthe training of models for culture and language prediction.
5. ACKNOWLEDGMENTSWe would like to thank Miriam Redi, Mercan Topkara,
Nikolaos Pappas and Tao Chen from the MVSO team fortheir support and insightful discussions. We especially thankNikolaos Pappas for providing English metadata translationsfor our implicit location extraction.
6. REFERENCES[1] L. Backstrom, E. Sun, and C. Marlow. Find me if you can:
Improving geographical prediction with social and spatialproximity. In WWW, 2010.
[2] J. R. Finkel, T. Grenager, and C. Manning. Incorporatingnon-local information into information extraction systemsby gibbs sampling. In ACL, 2005.
[3] H. Gonzalez, A. Halevy, C. S. Jensen, A. Langen,J. Madhavan, R. Shapley, and W. Shen. Google FusionTables: Data management, integration, and collaborationin the cloud. In ACM SOCC, 2010.
[4] M. Hao, C. Rohrdantz, H. Janetzko, U. Dayal, D. A. Keim,L.-E. Haug, and M.-C. Hsu. Visual sentiment analysis onTwitter data streams. In IEEE VAST, 2011.
[5] R. Ji, Y. Gao, W. Liu, X. Xie, Q. Tian, and X. Li. Whenlocation meets social multimedia: A survey on vision-basedrecognition and mining for geo-social multimedia analytics.ACM TIST, 6(1), 2015.
[6] B. Jou, T. Chen, N. Pappas, M. Redi, M. Topkara, andS.-F. Chang. Visual affect around the world: A large-scalemultilingual visual sentiment ontology. In ACM MM, 2015.
[7] J. Luo, D. Joshi, J. Yu, and A. Gallagher. Geotagging inmultimedia and computer vision - A survey. MultimediaTools and Applications, 51(1), 2011.
[8] J. L. Moore, T. Joachims, and D. Turnbull. Taste spaceversus the world: An embedding analysis of listening habitsand geography. In ISMIR, 2014.
[9] V. K. Singh, M. Gao, and R. Jain. Social pixels: Genesisand evaluation. In ACM MM, 2010.
[10] K. Toyama, R. Logan, A. Roseway, and P. Anandan.Geographic location tags on digital images. In ACM MM,2003.
[11] T. Vandal, D. McDuff, and R. E. Kaliouby. Eventdetection: Ultra large-scale clustering of facial expressions.In FG, 2015.
[12] Y.-T. Zheng, M. Zhao, Y. Song, H. Adam, U. Buddemeier,A. Bissacco, F. Brucher, T.-S. Chua, and H. Neven. Tourthe world: Building a web-scale landmark recognitionengine. In CVPR, 2009.