sensors and materials mary mccarrick b
TRANSCRIPT

Sensors and Materials
Mary McCarrick B.Sc
Thesis for the degree of
Doctor of Philosophy
submitted to
Dublin City University
School of Chemical Sciences
January 1995
Supervisor Dr Dermot Diamond

I hereby certify that this material, which I n o w submit for assessment on the
pro g r a m m e of study leading to the award of Doctor of Philosophy is entirely m y
o w n work and has not been taken from the work of others save and to the extent
that such work has been cited and acknowledged within the text of m y work.
Signed:
M a r y ivicCarrick
I D No.: 9 17005 15

T o m y Parents
Denis a n d Agnes.

Acknowledgements
Primarily I thank m y supervisor D r D e r m o t D i a m o n d for his patience, enthusiasm and good humoured support throughout the last three years and especially during the preparation of this thesis. M a n y thanks to D r Steve Harris for synthesising the majority of compounds on which I worked, and for his amenability to m y m a n y questions on calixarenes.
I would also like to thank Prof. M.A. M c K e r v e y and his students G. Barrett and M . M o r a n for the synthesis of three of the compounds examined and for their collaboration on this work. Thanks to D r Padraig James for his help with the N M R studies.
M y time spent in A b o A k a d e m i in Finland, on the Erasmus P r ogramme wa s a beneficial period thanks to the supervision of Prof. Ari Ivaska, Prof. A. L ew e n s t a m and D r Johan Bobacka. I also appreciate the help of Annette, Illka, Mikael, Johan, Anna-Lenna Marit and Pia w h o contributed to making the “Finland Experience” such a memorable time for me.
Thanks to all of the technical staff of the chemistry department and especially M i c k Burke and D a m i e n M c G u i r k for their help with the N M R studies.
Thanks to Amagruss Electrodes, Eolas, and Louth County Council for financial support.
This is the tricky bit- anyone w h o I should mention and d o n ’t, I’ll see you on court. Thanks to all of the postgrads past and present, for all of the interesting discussions. Here’s to the socialites from those mind-bending A g 2 2 days, Catherine, Eithne, Eva, Aisling, Ann-Sofi (the honorary Paddy) and of course to the radiator, with special thanks to Fiona and Teresa for the laughs and cries (not
mentioning anyone in particular) and for all of their help in getting this thesis together. J118 where spontaneity wa s the n a m e of the game, was m a d e conducive to work! with the help of Mickey and Declan. Thanks also to the other m e m b e r s of m y group, Patxi, Suzanne, T o m , Paddy, Margaret and the one-man group, Joe. The Friday basketball people, Dave, Mark, Stina, John, Orla and Farmer were only deadly. M a n y thanks for the friendship and entertainment value provided by Adrienne, Siobhan, Helen, Sean, Elaine, Kevin, Mags, Miriam and M a r y O ’.
Finally I would like to thank m y parents Denis and Agnes for their love, friendship and tireless encouragement throughout m y years in education, and m y brothers Ian, Denis and Kevin for helping out and putting up with m e over the last few months, (I promise I’ll be nice from n o w on).
iv
Table of ContentsPage No.
Title Page iDeclaration iiDedication iiiAcknowledgements ivTable o f Contents vAbstract xPublications xi
Chapter 1:- Literature
1.1 N eutral Carrier Ionophores 11.1.1 M o d e of Complexation 11.1.2 Neutral Ionophores 21.1.3 Cro wn-Ether s 31.1.4 Cryptands 41.1.5 Spherands 4
1.2 Calixarenes 6
1.2.1 Historical 71.2.2 Calixarene Nomenclature 91.2.3 Modified Calixarenes 101.2.4 Calixarenes and Complexation 11
1.3 Optical Sensors 131.4 Chromoionophores 14
1.4.1 Neutral Chromoionophores 151.4.2 Ionisable Chromoionophores 161.4.3 Chromogenic Crown Ethers 161.4.4 Chromogenic Spherands 201.4.5 Chromogenic Calixarenes 21
1.5 M ethods Em ployed with Chromophores 241.5.1 Cation Inclusion Examination by * H N M R Spectroscopy 241.5.2 Cation Induced Colour Change Examination by UV-Vis 24
Spectroscopy1.5.3 Cation Selectivity Determination 251.5.4 p K a Determination 26
1.6 Importance o f L i+Analysis 271 .7 Trimethylamine 291.8 References 30
v

Chapter 2:-Methods and Materials
2.1 M aterials 362.2 Instrumentation 362.3 N itrophenol Chromoionophores (Ligands 1, 2, & 3) 36
2.3.1 Effect of Complexation on U V - V I S Absorbance 362.3.2 S electivity C o efficient Determination 3 72.3.3 Optimum Base Concentration Determination 382.3.4 Effect of Solvent Variation on UV-Vis Spectra 382.3.5 T w o Phase Examination of Ligands 382.3.6 Complexation Studies 39
2.4 Calix[4]arene with Chromophore Within Cavity (Ligand 4) 392.4.1 Effect of Complexation on UV-Vis Spectra 392.4.2 Selectivity coefficient Determination 402.4.3 1h N M R Complexation Studies 40
2.5 Nitrophenylazophenol Ionophor es (Ligands 5, 6, 7, 8, & 9) 402.5.1 Effect UV-Vis Absorbance Spectra of Ligand 40
Complexation2.5.2 Selectivity Coefficient Determination 412.5.3 Solvent Choice for T w o Phase Examinations 412 .5 .4 T w o Phase Examination of Ligands 412.5.5 Complexation Studies 41
2.6 Assessm ent o f L igand 4 fo r The R apid Colorimetric Detection o f 42 Trimethylamine
2.6.1 Liquid Phase Experiments 422.6.2 Preparation of Test Strips based on the Ligand 422.6.3 Preparation of Sealed Test Strips 43
Chapter 3:- Nitrophenol Ligands
3.1 Introduction 453.2 M echanism o f Colour Generation:- 483.3 Base Concentration Optimisation 503.4 E ffect o f D ifferent Concentrations o f A lkali M etals on Absorbance 51
Spectra.
3.4.1 Ligand 1 513.4.2 Ligand 2 Monochromogenic Ligand 56
v i

3.4.3 Ligand 3 (Cjg) One Phase Examination 593.5 Selectivity Coefficient Determination 633.6 Solvent Variation 653.7 NM R Complexation Studies 6 8
3.8 T w o Phase Studies 763.9 L igand 4 84
3.9.1 Base Optimisation 843.9.2 Effect of Metal Ion Concentration Variation (Single- 84
Phase)3.9.3 Interference Studies 903.9.4 N M R Complexation Study 92
3.10 Discussion 983.11 Conclusion 111
3.12 References 113
Chapter 4:- Nitrophenylazophenol Calix[4]arenes
4.1 Introduction 1164.2 Structures o f Compounds Under Examination 120
4.3 M ode o f Action 122
4.4 Absorbance Spectra o f Ligands 5-9 122
4.4.1 Introduction 122
4.4.2 Ligand 5 1234.4.3 Ligand 6 . 1254.4.4 Ligand 7 1284.4.5 Ligand 8 and 9 131
4.5 Selectivity Determination 1344.6 Two Phase Analysis o f Nitrophenylazophenol Ligands 5 to 9 138
4.6.1 Choice of Water Immiscible Solvent 1384.7 NM R Complexation Studies 1434.8 Discussion 1464.9 Gaseous A mine Detection 1554.10 L iqu id Phase Experiments 1564.11 Test Strip Results 1614.12 Covered Test Strips 1644.13 Discussion 1654.14 Overall Conclusion 1664.15 References 167
vii

Chapter 5:-The Development of Novel Solid Contact Ion- Selective Electrodes5.1 Project A im 1705.2 Theory and Literature 1705.2.1 Introduction 17 05.2.2 Potentiometry 1705.2.3 Conventional Ion-Selective Electrodes 1715.2.4 Activity Coefficients 1735.2.5 M embrane Potentials 174
5.2.5.1 Boundary Potential 1755 2.5.2 Diffusion Potential 1775.2.5.3 The Complete Membrane Potential 178
5.2.6 Ion-Selective M em brane Components 17 85.2.7 Cation Selectivity 1795.2.8 Neutral Carrier ISEs 1795.2.9 Coated Wire Electrodes (CWE) 1805.2.10 Solid Contact ISEs 1845.2.11 Conducting Polymers 185
5.2.11.1 Introduction 1855.2.11.2 Charge Conduction in Metals and Semiconductors 1885.2.11.3 Doping 1895 .2.11.4 Synthesis of Conducting Polymers 189
5.2.12 Analytical Applications o f Conducting Polymers 1925.3 Experimental 1965.3.1 Reagents 1965.3.2 Electrode Nomenclature 1965.3.3 Electrode Fabrication a nd M easurements:- 197
5.3.3.1 Electropolymerisation of P T and P O T 1975.3.3.2 Application of ISE Cocktail to the Solid Contact 1985.3.3.3 Preparation of Coated Wire Electrodes 1995.3 3.4 Preparation of Single Piece Ion-Selective Electrodes 199
5.3.4 Potentiometric M easurements 2005.3.4.1 Potentiometric Measurements of Polymer Electrodes 2005.3.4 2 Potentiometric Measurements of P V C Coated 201
Electrodes5.3.4 3 Single-Piece Ion-Selective Electrodes 201
5.3.5 Estimation o f Selectivity Coefficients 202
5.3.5.1 Separate Solution Method 203
v i i i

5.3.5.2 Mixed Solution Method 2065.3.5.3 Selectivity Coefficient Determination for SCISEs, 206
CWE s , and Single Piece Electrodes5.3.6 Redox Responses 2065.4 Results and Discussion 2085.4.1 Comparison o f Lithium Selective Solid-Contact 208
Electrodes and Coated Wire Electrodes.5 4.1.1 Pt/PT and Pt/POT 2085.41.2 Ionic Response of Pt/PT/PVC(Li+ ), Pt/POT/PVC(Li+) 210
and Pt/PVC(Li+ )5.4.2 Time Response 2135.4.3 Stability 2135.4.4 Oxygen Dependence 2175.4.5 Redox Response 2185.4.6 E ffect o f Conditioning Solution on Electrode Response 2195.4.7 Conclusion 220
5.5 Comparison o f Chloride Selective Solid Contact Electrodes and 2 21Coated Wire Electrodes
5.5.1 Ionic Response 2215.5.2 Stability 2245.5.3 Oxygen Study 2275.5.4 Redox Response 2275.5.5 Conclusion 2285.6 Discussion to sections 5.4 and 5.5, Solid Contact Lithium 229
and Chloride Selective Electrodes.
5.7 Hybrid-Film Electrodes 2335.7.1 Ionic Response 234
5.7.1.1 Single Piece Electrodes on Platinum. 2345.7.1.2 Single Piece P O T Electrodes Using Glassy Carbon 236
as Substrate.5.7.2 Stability 2415.7.3 Oxygen Dependence 2435.7.4 Redox Response 2445.8 Hybrid-Film Electrode containing Chloride ionophore, 245
GC/15%POT, 85%PVC(Cl~).5.9 Overall Discussion 2465.10 Conclusion 2485.11 References 249
IX

Sensors and Materials
M ary M cCarrick School of Chemical Sciences,Dublin City University.
Abstract
The development of ionophores offering alternative m o d e s of transduction of cation inclusion has evoked m u c h recent interest. T h e first four chapters of this thesis deal with one such set of ionophores, namely chromogenic calix[4]arenes, which can exhibit a significant change in optical properties upon complexation with metal cations in the presence of a suitable base. All of the chromogenic compounds examined are ionisable chromoionophores which rely on the deprotonation of a phenolic group for colour generation.
C hapter 1:- This chapter offers a comprehensive introduction to ionophores with particular attention being paid to chromoionophores.
C hap ter 2 :- This chapter outlines the methods and materials used in the examination of the novel chromogenic calixarenes.
C hap ter 3:- This chapter describes four novel calix[4]arenes bearing either one or four nitrophenol chromogenic groups. All co mpounds were examined as cation selective ionophores capable of exhibiting significant colour changes upon complexation with Li+, and to a lesser extent with N a +, in the presence of a suitable base.
C hap ter 4:- This chapter concentrates on assessing another series of novel chromogenic calix[4]arenes bearing from one to four nitrophenylazophenol chromophores as optical signalling moieties. Li+ selectivity over N a + wa s again exhibited. T h e lithium complex of the tetranitrophenylazophenol ligand was additionally examined as a solid phase gaseous trimethylamine ( T M A ) indicator.
C hapter 5:- This chapter deals with novel solid-state ion-selective electrodes. Both coated wire electrodes ( C W E ) and solid contact (SC) electrodes, which combined the electronically conducting nature of electropolymerised polythiophene (PT) or polyoctylthiophene (POT) with an ionically conducting PVC/ionophore layer, were assessed as lithium- and chloride-selective electrodes. Hybrid-film electrodes (HFE) which were m a d e by mixing chemically polymerised P O T and a PVC/ionophore cocktail in T H F and applying this mixture to a glassy carbon substrate were also examined as Li+ selective electrodes.

Publications Arising From This ThesisThe w o r k presented in this thesis has formed the basis of a number of publications, (P apers I to VI), and one patent application (P atent I). Chapters 1 to 4 deal with the subject of neutral carrier ionophores and their ability to be modified to allow cation inclusion to be transduced by a spectral change. The experimental results reported in Chapters 3 and 4 formed the basis of an initial screening project, to determine the main properties of nine novel chromogenic calix[4]arenes. The w o r k described in Chapter 3 has been published in P apers I and II. The contents of Chapter 4 formed the basis of P apers I I I and I V A s a result of the findings on these compounds, one patent application wa s filed, (P atent I). Chapter 5 is an examination of novel solid state lithium and chloride selective electrodes and s o m e of the results obtained have been published in P a p er V, and are being used in the preparation of another paper, P aper VI. Other w o r k carried out during this research on a novel reference electrode material (Refex), but which is not included in the thesis has been published in P a p er VII.
Publications
P a p er I:- “Novel Chromogenic Ligands for Lithium and Sodium Based on Calix[4]arene Tetraesters”. M . McCarrick, Bei W u , S.J. Harris, D.Diamond, G. Barrett, and M.A. McKervey, J. Che m . Soc., Che m . C o m m u n . , (1992) 1287.
P a p er II:- “Chromogenic Ligands for Lithium Based Calix[4]arenes Tetraesters Bearing Nitrophenol Residues” . M. McCarrick, Bei W u , S.J. Harris, D.Diamond, G. Barrett, and M.A. McKervey, J. Chem. Soc., Perkin Trans. 3, (1993) 1963.
P a p er III:- “Assessment of Three AzophenolCalix[4]arenes as Chromogenic Ligands for Optical Detection of Alkali Metal Ions”. M . McCarrick, S.J. Harris, a n d D . Diamond, Analyst, 118 (1993) 1127.
P a p er IV :- “Assessment of a Chromogenic Calix[4]arene for the Rapid Colorimetric Detection of trimethylamine”. M . McCarrick, S.J. Harris, and D. Diamond, J. Mater. Chem., 4,2, (1994) 217.
P a p er V:- “All Solid-State Poly(vinyl chloride) M e m b r a n e Ion-Selective Electrodes With Poly(3-octylthiophene) Solid Internal Contact”. J. Bobacka, M. McCarrick, A. Lewenstam, and A. Ivaska, Analyst, 119 (1994) 1985.
P a p er VI:- ”. J. Bobacka, M . McCarrick, A. Lewenstam, D. Diamond, and A. Ivaska. In preparation.
Patent
P a ten t I:- “Chromogenic Ligands and U s e Thereof in Optical Sensors, S.J. Harris, M.A. McKervey, and D. Diamond, European Patent Application, lodged 6 th August 1993, No. S922577.

Chapter 1 Literature
There has been increasing interest in the development of analytical methods for determining alkali metal ions because of their importance in biological processes, clinical applications, the susceptibility of rubidium and caesium to neutron activation, the production of radioactive caesium during nuclear fission processes and the possible use of lithium as a fusion fuel. T h e traditional methods for alkali metal analysis has been flame photometry or atomic absorption/emission spectrometry with inductively coupled plasma spectrometry being used more recently for caesium analysis [1]. Flame photometric measurements are subject to ceratin disadvantages such as speed, maintenance and cost. Th e development of analytical techniques for cation analysis which could offer an improvement to this method has been sought.
1.1 Neutral Carrier Ionophores
The discovery of the ionophoric capabilities of neutral carrier molecules for alkali metal cations such as N a + and K + in clinical assays has led to their determination by potentiometry using ion-selective electrodes. Ionophores are molecular receptors which are capable of forming stable lipophilic complexes with charged hydrophilic species such as Li+, N a +, K +, C a 2+, etc. and which are capable of transporting them into lipophilic phases across natural or artificial membranes. Neutral carrier ionophores are uncharged lipophilic molecules capable of selectively transporting metal ions across a hydrophobic membrane.
1.1.1 Mode of Complexation
A num b e r of principles have been developed from the study of macrocyclic cationic receptive molecules like those described earlier. The structural recognition between host and guest is controlled by:i. T h e Complementarity Principle [2], which states that "in order to complex,
hosts must have binding sites which co-operatively contact and attract binding sites of guests without generating strong non-bonded repulsions".
ii. The Principle of Preorganisation, which in its original formulation states that "the smaller the changes in organisation of host, guest, and solvent required for complexation the stronger will be the binding".
1

C o m m o n to all of the macrocycles used in the cationic recognition is the electrostatic interaction of the cation and the free electrons of heteroatoms such as oxygen, sulphur and nitrogen which form a hydrophilic cavity a w a y from the lipophilic remainder of the molecule. T h e nu m b e r of heteroatoms available for such interaction is dependent on the class of macromolecule and the relative conformation which it assumes either during synthesis or upon contact with the metal cation.
1.1.2 Neutral Ionophores
Th e first reference to neutral carriers w a s by M o o r e and Pressman in 1964 [3], where they reported the potassium ion binding ability of the naturally occurring antibiotic Valinomycin. Almost a decade later the huge analytical potential of the molecules as a highly selective potassium complexing agent was realised by Stefanac and S i mon [4],
Other similar natural systems investigated during the early stages of this n e w area of chemistry include the macrotetrolides which are N H 4+ specific. A selection of these is s h o w n in Figure 1.1.
R i = R 2 = R3 = R 4 = C H 3
R i = R 2 = R3 = C H 3 R 4 = C 2H 5
R l = R 3 = C H 3 R 2 = R 4 = C 2H 5
R 1 = C H 3 R 2 = R3 = R 4 = C 2H 5 R 1 = R 2 = r3 = R 4 = C 2H 5
1.0) Nonactin 1.(11) Monactin 1 (iii) Dinactin 1 (iv) Trinactin 1 (v) Tetranactin
Figure 1.1:- A selection o f macrotetrolides.
2

1.1.3 Crown-Ethers
While the naturally occurring antibiotics were being investigated synthetic c o m pounds with alkali and alkaline earth metal ion complexing properties were obtained by Pedersen in 1967, and were called crown ethers [5], because of the resemblance of the molecular model of the first m e m b e r of this series to a crown. The [18]crown-6 macrocycle (Figure 1.2) binds potassium in preference to the other alkali metal ions.
O
Ô Q
Figure 1.2:- [18]crown-6 [5].
Crystal structures of [18]crown-6 and its K +S C N ‘ complex have been obtained [6 ] and s h o w that the host and its complex have different conformational organisations. Th e free host does not have a cavity or a "crown" shape as the potential cavity is filled with two inward turning C H 2 groups only. However, upon interaction with the K + guest the cavity becomes organised and an interaction occurs between the oxygen atoms and the guest. Cation selectivity is dependent on charge, size and electronic structure of the cations as well as the nature of the counterion [7]-
1 (vii) 1 (viii)Figure 1.3:- [18]crown-6 and its K +SCN- complex, [7].
3

1.1.4 Cryptands
Th e first purpose built molecules to mimic the ionophoric properties of the antibiotics were the cryptands synthesised by L e h n [8 ], The cryptands differ from most crown ethers in their bicyclic nature, containing intramolecular cavities with 3 dimensional shaped "crypts" in which the bridges contain oxygen or sulphur atoms with nitrogen atoms acting as the bridgeheads e.g. [2 ,2 ,2 ] cryptand does not have a cavity in its uncomplexed state but reorganises upon complex formation with K + so that a potassium ion-occupied cavity develops lined with 28 electrons [6 ], (Figure 1.4). Complexes formed between these macrobicyclic ligands and alkaline earth metals [9] display enhanced stabilities with respect to the corresponding crown ether complexes [1 0 ],
• y \ V ••< O o ' ■.
1 Qx)
H «H N + Kl -► N ....... K+■
1(X) l(xi)
Figure 1.4:- l( ix ) A [2 .2 .2 ] cryptand, l(x ) its conformation, and l(x i) its K +I~
complex, [6],
1.1.5 Spherands
In the 1970’s C r a m and co-workers developed a class of rigid hosts which were highly preorganised for complexation during synthesis. The first set of molecules in this class are k n o w n as spherands [11]. These are very powerful and highly
4

discriminating binders of N a + and Li+ [12], Figure 1.5 shows the structure of a six m e m b e r e d spherand and its Li+ complex. The six oxygens of the six methoxy groups are held in a perfect octahedral arrangement by their attachment of six interconnected aromatic rings each attached to one another at their 2 ,6 - positions. Their cavities are too small to be filled either by parts of the host itself or solvent molecules and can only be filled by simple monatomic ions. Another class of molecules stemming from the spherands is the hemispherand [13], Hemispherands are hosts in which at least half of its structure is composed of units unable to fill their o w n potential cavities by conformational reorganisation.
1 (xii) 1 (xiiDFigure 1.5:- A sp h e ra n d a n d a sp h era n d lith ium sa lt com plex [12J.
Other hosts have been reported which have varying degrees of structural organisation, including podands [14], lariat ethers [15], cryptophanes [16], and the related speleands [17]. See Figure 1.6. O n the "picrate salt extraction scale" defined by C r a m [18], the complexing p o wer of synthetic receptors towards the alkali metal cations falls in the following order, spherands > cryptaspherands > cryptands > hemispherands > coronands > crown ethers > podands > solvents.
T h e focus of our attention with macrocyclic ionophores was on calixarenes which are defined as [In] metacyclophanes [19] and are products of phenol formaldehyde condensations.
5

P o d a n d [14]
CH3 1 (xv)
Hemispherand [13]1 (xvi)Lariat Ether [15]
Figure 1.6:- Selection o f neutral-carrier ionophores
1.2 Calixarenes
The term calixarene was coined in 1975 by David Gutsche who perceived a similarity between the shape of a Greek vase called a calix crater and the molecular model o f the cyclic oligomers produced by the condensation of p - substituted phenols with formaldehyde.
6

1.2.1 Historical
Th e study of phenol formaldehyde chemistry first appeared in the literature in 1872 w h e n Adolph V o n Baeyer published his work describing that phenol condenses with formaldehyde in the presence of a mineral acid to produce a resinous tar [20], His inability to isolate pure materials from these reactions prevented a characterisation of these materials.
t-Bu
OH
1 (xvii)Figure 1 . 7 Genera l s truc tu re o f calixarenes.
A number of other chemists attempted to elucidate the structures of the resinous tars and find practical applications for their interesting properties, but it was not until Leo Baekeland discovered the preparation of the tough, resilient resin (marketed under the tradename "Bakelite") from this phenol-formaldehyde reaction [2 1 ] that interest in this area grew substantially again owing to the tremendous success of this phenoplast.
In 1942 an investigation of the "curing" phase of the phenol formaldehyde process b y Alois Zinke and his co-worker Erich Ziegler wa s begun. The study involved simplifying the problem of variability in product conformations, by looking not at phenol but at -substituted phenols. Phenol itself reacts at the ortho and p a r a positions to form highly cross-linked polymers in which each phenolic residue is attached to three other residues. A p a ra alkyl phenol, can react only at the two ortho positions thereby reducing the cross-linking possibilities of the formation of a linear polymer. The base induced reaction of formaldehyde and p - te r t-b u iy l phenol first described in 1941 [22] yielded a crystalline product that decomposed above 300 °C and in 1944 [23] a cyclic tetrameric structure wa s postulated for this product, (Figure 1 .8 ).
7

1 (xviii)
Figure 1.8 p -te r t-b u ty l ca lix[4]arene, [23].
Zinke and co-workers in the following years produced a series of compounds from /?-methyl, p - te r t-butyl, p -te r t-pentyl, p -{ 1,1,3,3 tetramethylbutyl)-phenol, to which cyclic tetrameric conformation w a s attributed.
In 1955 John W . Comforth wa s interested in the preparation of tuberculostatic substances and a m o n g the compounds tested were the Zinke products which had been presented in the literature in 1944 [23] . H o w e v e r on repeating Zinke's reaction starting with /?-/er/-butylphenol, two materials rather than a single product were isolated. Both possessed the physical and chemical properties of a cyclic oligomer but with somewhat different melting points. Comforth proposed that the c o mpounds are diasterioisomers arising from hindered rotation of the phenolic nuclei around the methylene linkage [24]. H e therefore concluded that the Zinke reaction produces only cyclic tetramers. This however was later disproved in the 1970's with a combination of !H, 13C N M R and mass spectroscopy to be in fact a combination of cyclic octamer and hexamer [25-27].
David Gutsche's association with the Petrolite Corporation in Missouri, which w a s involved in the development of cyclic oligomers for use as demulsifiers for crude oil, led to an awareness of phenol-formaldehyde chemistry in general and cyclic oligomeric chemistry in particular. So w h e n Gutsche became interested in the newly emerging area of bioorganic chemistry, in the 1970's, k n o w n as enz y m e mimics, the Zinke cyclic tetramers sprang to mind as potential molecular
8

baskets. Initially Gutsche's group set about dealing with the scope of the phenol- formaldehyde cyclisation reaction to determine which phenols reacted to yield high melting products and which did not. Following the reassignment of the Zinke products to cyclic hexamers and octamers, further examination of the one- step process of the /?-/er/-butyl-phenol reaction wa s carried out by the group [28], Reaction variables such as changes in solvents, bases, and reactant ratios led to the development of a nu m b e r of recipes that n o w permit the cyclic tetramer, cyclic hexamer and cyclic octomer from p - te r t-butyl phenol to be easily prepared in good yield.
These c o mpounds are n o w a m o n g the most accessible synthetic macrocyclic baskets and have c o m m a n d e d the attention of m a n y research groups worldwide. The recent publication of two books devoted solely to the subject of calixarenes and their applications [29, 30] and the host of journal publications and patent applications on the subject illustrate the huge potential envisaged by this class of macrocycles.
1.2.2 Calixarene Nomenclature
The n u m b e r of aryl groups is indicated by the insertion of the n umber between the calix and the arene e.g. calix[4]arene, denotes the cyclic tetramer. T h e n to indicate from which phenol the calixarene is derived the /»-substituent is designated by n a m e e.g. the cyclic tetramer from p-/er/-butylphenol is called p -
tert-butylcalix[4]arenc. There are five m e m b e r s of the series ranging from the relatively rigid calix[4]arene to the m u c h larger and more flexible octameric calix[8 ]arene. The odd numbered pentamers and heptamers are however m u c h less accessible than the other three.
The parent p - te r t-butyl calix[n]arenes are white crystalline materials characterised by high melting points e.g. p - te r t-butyl calix[4]arene m.p. 342- 344°C and low solubility in organic solvents. It was Comforth w h o first suggested that four discrete conformational isomer forms of the calix[4]arene exist [24]. It is n o w recognised that the various conformations of a calix[4]arene are readily inter-convertible and Gutsche has designated them as "cone", "partial cone", "1, 2 -alternate cone" and "1, 3 - alternate cone" [31], (Figure 1.9). The 1, 2 alternate cone conformation is encountered m u c h less frequently [32].
9

C o n e1 (xix) 1 (XX)
Partial C o n e1 (xxi)
1,2 -Altemate 1,3-Alternate1 (xxii)
Figure 1 .9:- P seudo 3-d im ensiona l represen ta tion o f the con form ers o f
ca lix[4]arenes [29].
1.2.3 M odified Calixarenes
The parent p-/-butylcalixarenes have veiy little ionophoric activity for alkali metal cations, s h o w n by their inability to transport these ions from neutral aqueous solution through a chloroform m e m b r a n e [33, 34, 35] because there are not sufficient numbers of electron rich heteroatoms available for binding. Only w h e n the source phase is the basic metal hydroxide is transport observed, phase transfer then being coupled to phenoxide ion formation [35], However, these structures m a y be used as a platform onto which groups of ion-binding substructures m a y be assembled. The "lower" rims of phenol derived calixarenes are already functionalised with hydroxyl groups which provide excellent sites for the introduction of other moieties which have been found to increase the ionophoric nature of the molecules [36],
M c K e r v e y et al., introduced methyl and ethyl esters to calix[4, 6 and 8 ] arenes at this phenolic position and found a size related selectivity pattern, with the calix[4]arenes being selective for N a + and the calix[6 ]arenes preferentially extracting K +, R b +, and C s + ions. The introduction of the ester groups in the presence of excess acylating agents, lowered the conformational mobility of the molecules thereby freezing the molecule into one of the four conformations i.e. the cone. The melting point of the molecules can also in s o m e cases be lowered significantly by lower rim substitution e.g. the tetramethyl (and tetrabenzyl ethers

of p - te r t-butyl calix[4]arene have m.p. 226-228 °C and 230-231 °C respectively compared to m.p. 342-344'C for the unsubstituted p - te r t-butyl calix[4]arene.
Substituents have also been introduced onto the "upper rim" of calixarenes via modification of the /7-alkyl group by several methods [29], Modification of the p-sustituents has been s h o w n to increase the solubility in a variety of organic solvents and in extreme cases render them soluble in water e.g. sulphonated, and trimethylammmonium chloride calixarenes [37, 38],
1.2.4 Calixarenes and Com plexation
It w a s hoped that lower rim phenolic functional group modification of calix[4]arenes, to produce derivatives containing carbonyl groups, in the form of pendent ester and ketone groups w o uld result in efficient ligating groups in m u c h the same w a y that ester groups participate in ion-binding with natural receptors such as valinomycin. A m a u d - N e u et al. [39] successfully synthesised a n u m b e r of tetrameric derivatives containing either ester or ketone pendants, (Figure 1.10) and characterised them by X-ray crystallography.
1 (xxiiO R = C H 2C O C H 3 Ketone.1 (xxiv) R = C H 2C O O C H 3 Ester
Figure 1 .10 :- L ow er-rim fu n c tio n a lise d calix[4]arenes, [39].
T h e tetrameric structures exist in a very rigid cone conformation with the polar substituents mutually "syn" with respect to the macro ring i.e. grouped together at one end of the cavity, and the hydrophobic moieties directed towards the upper rim thus conferring a high degree of preorganisation on the molecules l(xxv). Th e molecules are frozen into the cone conformation during synthesis. X-ray crystal structures for a calix[4]arene and a calix[6 ]arene are sho w n below.
11

1 (jytv) 1 (xxvi)
Figure 1.11:- X-ray crytal structures o f (a) the p-t-butyl-tetraethylester calix[4Jarene and (b) the hexaethylester calix[6]arene. Carbon and oxygen atoms are shown as spheres o f arbitary radius, oxygen atoms are larger and m arked with a cross [39].
The i-butyl-tetraethyl ester calix[4]arene exhibits a distorted cone structure with two of the opposing aromatic rings essentially parallel, while the other two rings are almost normal to one another. This can be seen in 1 (xxv) where the aromatic rings B and D are almost parallel to each other and rings C and A are tilted at an angle away from the plane B and D. The same sort of distorted cone shape is observed in the p-/-butyl-tetramethylketone calix[4]arene. These molecules were found to exhibit cation binding properties. The encapsulation of an alkali metal occurs with the cation being centrally located within the hydrophilic cavity defined by the four ester/ketone groups and supported electrostatically by the four ethereal oxygen atoms and the four carbonyl oxygen atoms [39, 40] (Figure 1.12).
12

1-Na+ Complex: R=Et, R'=H or t-Su
Figure 1.12:- Encapsulation o f an alkali-metal cation by a tetrameric calixarene ester or ketone, R = Et, R ' = H or t-But
Further modifications of the phenolic groups and changes in the substituents bonded to the heteroatoms used have been carried out by numerous groups verifying the role played by phenolic and carbonyl oxygen atoms as receptor sites in forming complexes with alkali and alkaline earth metals. Variations in cation selectivity occur with modifications of both the lower rim phenolic groups and upper rim /-butyl group and have been described in depth in a number of publications [41-43],
1.3 Optical Sensors
Traditionally the transduction of metal ions using calixarenes has been by potentiometry where the first attempts to produce a sodium ion-selective electrode (ISE) involved the use of methyl and ethyl esters in liquid membrane electrodes [44] containing the methyl ester [45], However recently increasing interest has been shown in the development of sensors utilising optical transduction. The term optrode or optode has been given to such devices, which offer attractive features relative to conventional electrodes which were outlined by Seitz in 1984 [46] and Narayanaswamy and Russell in 1986 [47],
The increased interest in optical sensors was sparked both by the progress in the development of optical hardware and by the hope of eliminating certain disadvantages of electrochemical sensors. They allow continuous remote
13

monitoring and can measure concentrations without significantly perturbing the sample, a very useful feature for process control applications. Because the signal is optical it is not subject to electrical interferences. No "reference electrode" is required since internal referencing can be carried out by ratioing the signal at the optimum analytical wavelength with that of a reference wavelength at which the analyte does not absorb. The ratio of the two wavelength intensity signals can be used to conect for any optical variations. The reagent phase does not have to physically contact the fibre optic, so the use o f the reagent phase on a disposable basis could be practical.
The main stumbling block to the development o f optical chemical sensors so far has been finding suitable immobilisable layers which have the potential to change their optical properties upon interaction with the analyte of interest. Numerous types of chemical sensing layers have been developed. A ligand (ion carrier, ionophore, indicator, complexing agent) is used as the sensing or analyte binding layer and the optical signal is generated upon interaction of the carrier with the analyte, whereupon the carrier itself or an additional compound (chromoionophore, fluoroionophore, indicator dye), changes its optical properties upon complexation with a different ion. To date, the electrically neutral and lipophilic ionophores which are widely used as the selective compounds in ion- selective electrodes, have commanded most attention for ion-selective optodes.
With the mode of complexation of the macrocycles established it became clear that by varying the nature of the pendant groups other properties could be built into these molecules. Among the neutral carrier ionophores examined for chromogenic applications were crown ethers, spherands, hemispherands and corands with calix[4]arenes only recently being synthesised with chromogenic indicator systems attached.
1.4 Chromoionophores
The strategy for designing a cation-responsive dye has been outlined in reviews and can involve cation extraction by a neutral dye [48], or an ionisable dye [49], Chromoionophores for cation complexation are of two types, neutral and ionisable, and are summarised in the following equations [50],
14

Ion + Chromoionophore —----- Complex Colour ChangeNeutral: Cl + M+ ■- ^ CI.M+ »Ionisable: CIH + M+ CI\M+ + H+
Figure 1.13:- Different types o f chromoionophores.
Neutral chromoionophores (Cl) contain a polarised chromophore linked to the ionophore. The positive cation charge influences the donor heteroatoms (O, N, S) as previously discussed and their electronic surroundings by ion-dipole forces. If one of the heteroatoms is a constituent of a mesomeric system such as the N atom in l (xxviii), the electronic disturbance propagates through the whole (n and n) system. Due to different influences on the ground and photoexcited states of the neutral chromoionophoric compounds by cations, changes occur in the absorption spectra. These "dyes" have electron donor and acceptor sites within a molecule so that the charge transfer from the donor to acceptor according to electronic excitation gives rise to their strong visible light absorption [48], The interaction of metal ions with the dye molecule in a manner to stabilise the localised charge on the donor site leads to hypsochromic shifts of the charge transfer band. Conversely the interaction to stabilise the charge on the acceptor site results in a bathochromic shift.
Ionisable chromoionophores (CIH) ionise in the presence of a bound cation if the pH is appropriate with the resulting change in absorption spectrum usually greater than for a neutral chromoionophore and the absorption spectrum of the complex CI'.M+ shows a shift to longer wavelength compared with the spectrum of the ionisable chromophore CIH.
1.4.1 Neutral Chromoionophores
The development of molecular combined neutral carrier dyes with high "colour sensitivity" to complexed cations began with crown ethers in the 1970's with Dix and Vogtle [51] synthesising a series of neutral chromoionophores and Takagi et al. synthesising a series of ionisable chromophoric crown ethers [52],
15

In Dix and Vogtle's work the electron donor or acceptor part of the chromophore was actually incorporated into the crown ether ring with one such example shown below in Figure 1.14.
1 (xxviii)
Figure 1.14:- Neutral crown ether chromoionophore [51].
Changes in the absorption spectra occur due to electrostatic interactions between the complexed cations and the chromophore dipoles with different A.max. values being observed for different extents of complexation. The largest band shifts are produced by the cation which optimally fills out the ligand cavity.
1.4.2 lonisable Chromoionophores
Nine ionisable chromogenic calix[4]arenes are examined in the work to be presented here, all of which possess ionisable phenolic groups, (Chapter 3 and 4).
1.4.3 Chromogenic Crown Ethers
Takagi et al. in 1977 synthesised the first coloured crown ether anions [52, 53], where mono (Figure 1.15) and diprotonic chromophores were set into a crown skeleton in such a way that the complexation of positively charged metal ions was accompanied by the dissociation of protons of the chromophore. The colour effect with such chromoionophores is primarily due to the spectral differences of
16

the protonated and deprotonated species with very little difference being observed between the absorption spectra o f different cations. Extraction studies of metal ions from an aqueous phase into a basic-chloroform layer which housed the chromogenic ligands resulted in an ease of extraction order of K+ > Rb+ > Cs+ >Na+ » Li+ being obtained and resulted in a method for the photometric determination of 10-800 ppm of K+.
1 (xxix) R=H 1 (xxx): R=N 0 2
1 (xxxi) R=Br= Labile proton
Figure 1.15:- Picrylaminobenzene[l 5]crown-5 derivatives [49],
Further work on the examination o f the effect of variation in chromophore substituents e.g. nitrile or trifluoromethyl for nitro, of these picrylaminobenzene[15]crown-5 derivatives was carried out by Pacey et al. [54] to try and increase the spectral separation of the HL and L' species making the effective molar absorptivity for L ' greater and improving the reagent sensitivity. The addition of a trifluoromethyl group was found to improve aqueous solubility and one of the molecules bearing this group was found to behave as a potassium selective colorimetric crown ether. The analytical range which the analysis covered was within the normal 137-207 ppm K+ range for human blood serum. The results obtained with this system were comparable with those obtained by atomic absorption spectrometry of the same sample.
Lariat ethers bearing a similar monobasic amine linkage were also examined and proved to have better extraction ability for alkali metal cations, however this was at the expense of reduced cation selectivity [55],
In 1981 Misumi et al. incorporated a second type of ionisable chromophore into a crown ether system [56], namely a dinitrophenylazophenol group, (xxxi]) with in this instance, the ionisable phenolic proton, being sited within the crown cavity.
17

Æ \ v-o ° "An
Figure 1.16:- "Crowned" dinitrophenylazophenol [56].
Pyridine was the base used in this work to facilitate the uptake of the phenolic proton upon preferential lithium complexation. A colour change from yellow to purple-red was observed upon complexation, with Li+, when n =1. A number of factors were deemed to be crucial for lithium induced colour generation, such as1. cavity size of the crown ether unit,2 . acidity constant o f the azophenol group,3. basicity o f the added amine and4. polarity of solvent.Coordination o f the dissociated phenol with the Li+ cation, along with the restrictive cavity size, were thought to be the main reasons why complexation with other metal alkali metal salts was precluded.
Alder et al. [57] developed a similar system for the determination of K+ in the presence of sodium by increasing n to 2 and attaching this reagent to an optical fibre, by dipping the fibre (which had been coated with Amberlite XAD-2 resin and encapsulated with porous PTFE membrane), in a 0.1 % methanol solution of the crown compound. A potassium sensor capable of determining aqueous potassium ions in the range 10-3 -10- 1 M aqueous resulted. However the K+/Na+ selectivity of 6.4 was not sufficient for clinical use. Further work by Sutherland et al. has been carried out on K+ and Na+ determination in the presence of other clinically important cations by optical methods, using other macrocycles and will be referred to later.
Work on chromoionophores bearing the dinitrophenylazophenol chromophore continued with Misumi et al. [58], with the aim of obtaining an amine selective complexation coloration. The coloured complexes of these crowns with metal or
18

ammonium ion are differentiated from simple ion-dipole type complexes by an additional binding force, namely, coulombic interaction between the phenolate anion, housed in the central hydrophilic crown cavity and the guest cation. A number of these nitrophenylazophenol crowns were found to be capable of producing colour changes with primary, secondary and tertiary amines. Coloration was found to be related to the structure o f the complex rather than to the relative basicity of the amines. Figure 1.17 shows one of the dinitrophenylazophenol crowns described in this paper which apart from the chromophore also contains the nitrogen of a pyridine ring in the crown cavity. Variations in absorption A.max were observed for the different classes of amines i.e. primary amines result in absorption between 574-586 nm while secondary and tertiary amine systems absorbed between 602-606 nm.
Figure 1.17:- Am ine selective "crowned" dinitrophenylazophenol [58],
In 1988 Van Gent et al. [59] used a [15]crown-5 incorporating a phenol, onto which was attached an ethenylmethylquinolonium iodide moiety, with again a phenolic hydroxyl group sited in the crown cavity. In this work the importance of the coulombic interaction between the phenolate anion, along with electrostatic interaction with the crown oxygens, for cation selectivity was expressed. Complexation with Ca2+ caused the greatest Xmax shift in the absence of a base and was suggested as being indicative of the Ca2+ ion being compatible with the cavity size and thereby in close contact with the phenolate anion. Such cation anion interactions in the cavity of macrocycles have been described as saltexes [60],
19

1.4.4 Chromogenic Spherands
In 1986 Cram et al. introduced the highly preorganised spherands to the world of chromogenic cation analysis. A chromogenic spherand which acted as a lithium- specific chromogenic indicator system for solid lithium salts of soft anions such as LiBr, Lil or LiC104 but was too weak for that of solid LiF, L iN 0 3 and Li2 S 0 4, was described [18]. This compound bore a dinitrophenylazophenol chromophore with the chromophoric phenol group acting as part o f the spherand backbone. Subsequently a six membered spherand incorporating a dinitrophenylazophenol moiety was synthesised and its high Li+ binding power seen by its non- chromogenic analogue was found to be maintained [61]- The pKa of the phenolic proton varied depending on which cation was complexed with the ligand. The lowest pKa of 5.9 was found for the Li+ complex compared to values of 6.9, 12.7, and 13 for the Na+, K+ complexes and the free ligand respectively. The sodium complex of one such chromogenic spherand is shown in Figure 1.18.
NO 2
l (xxxiv)Figure 1.18:- Complex fo rm ed between metal cation and dinitrophenylazophenol
spherand [61].
Cram et al.'s interest in chromoionophores continued with results for Na+ and K+ selective cryptaspherands published in 1989 [62]. The molecules synthesised were targeted because of the selective nature of their analogous non-chromogenic cryptaspherands for either Na+ or K+. The picrylamine groups attached to one of
20
i

the spherand rings acted as the chromophore with the inclusion of a cation in the central cavity being sufficient to increase the acidity of the monobasic amine proton selectivities o f greater than 1000 for both [K+]/[Na+] and [Na+]/[K+] were obtained with these new compounds.
In 1992 two groups described chromogenic cryptands which showed excellent lithium over sodium selectivities [63, 64], Sholl et al. reported a Li+:Na+ selectivity ratio o f ca. 104 on the basis o f the spectroscopic response at pH 9. No response to Na+ was seen even at a 1M NaCl concentration. Zazulak et al. reported an association constant of 3200 M _1 in 10 % DEGMEE/TMA(OH) (diethylene glycol monoethyl ether / tetramethyl ammonium hydroxide) for a lithium chromgenic cryptand complex, but could not obtain a value for Na+ or K+ due to the lack of a chromogenic response. Both sets of compounds contained a phenolic hydroxy group in the central cavity, attached to a nitrophenylazophenol group.
1.4.5 Chromogenic Calixarenes
In 1984 Bohmer et al. described a lithium specific colour change for a calix[4]arene which had not been functionalised at the hydroxyl group on the phenolic units. However, the calixarenes examined contained one hydroxylnitrophenylene unit [65],
The first report o f the incorporation of the nitrophenylazophenol into a calix[4]arene structure appeared in 1989 [6 6 ] (Figure 1.19a). The pKa values ofeach of the phenolic protons of a tetrachromogenic derivative were evaluated.
CalixH4 CalixH3- + H+ pKal = 0.5
CalixH3- Calix H22- + H+ pK ^ = 2.0
Calix H22- Calix H3_ + H+ pK^ = 10.0
Calix H3- Calix 4' + H+ pKa4=13.0where H+ is the acid proton removed from the phenol groups.The marked pKa split was explained by the strong hydrogen-bonding interactions characteristic o f calix[4]arenes. The cation binding capabilities o f a monochromogenic calix[4]arene bearing one nitrophenylazophenol group with
21

the phenolic hydroxyl group sited in the central hydrophilic cavity was later examined by the same group [67] ( l xxxvi).
CH:
OH OR
CH'
oNO-
l (xxxvi)Figure 1.19:-(a) Tetra-nitrophenylazophenol Calix[4]arene and (b) Mono- nitrophenylazophenol Calix[4]arene.
This compound displayed Li+ over Na+ selectivity in the presence of imidazole which was added to facilitate the metal induced proton dissociation. Complexation was again thought to occur with Li+ acting as a counter-cation for the azophenolate anion as well as interacting by electrostatic interaction with the three phenolic and carboxylic oxygens. A similar molecule which contained a 2,4-dinitrophenylazophenol group rather than a 4-nitrophenylazophenol group was described by Nakamoto et al. and was also found to display Li+ specific coloration in the presence o f triethylamine [6 8 ],
Sutherland et al. used the same chromophore in a tetrameric bridged structure (lxxxi) [69, 70] which had previously been shown to display K+ selectivity in its purely ionophoric form [71]. The sensitivity to K+ at a given pH was found to be susceptible to alteration by varying the pKa of the azophenol chromophore through a change in the substitution pattern of the chromogenic aromatic group. It was found that improved extraction ability for K+ from a buffered pH aqueous solution to CHCI3 was demonstrated when the chromogenic moiety was a dinitrophenylazophenol as opposed to the nitrophenylazophenol. The addition of a second electron withdrawing N 0 2 group would appear to have the ability to give further stabilisation to the deprotonated phenolic form of the chromogenic
22

moiety [69], A reduction in the size of the bridge of the calix[4]arene from 5 to 4 (OCH2) groups was found to change the cation for which the molecule was selective, to Na+, with very little response to K+ [70], K+ over Na+ selectivity which was adequate for physiological samples was obtained.
Figure 1.20:- Bridged chromogenic calix[4]arene [69].
The neutral indoaniline chromophore has been used most recently in conjunction with calixarenes for cation analysis [72, 73], Kubo et al. described a Na+ selective calix[4]arene tetraester. A bathochromic shift was observed upon complexation with the Na+ cation and was explained in terms of the well tailorerd electrostatic interactions existing between Na+ cation surrounded by OCH2COO groups and the indoaniline carbonyl oxygen segment [72], A 1, 3 bis indoaniline calix[4]arene has been found to display Ca2+ induced colour change with greater than a 100 nm bathochromic wavelength upon interaction with Ca2+, [73], The preferential binding of Ca2+ compared to Na+ which have similar ionic radii is attributed to the higher charge density o f the Ca2+ which should interact more strongly with polar donor groups, especially those of the two quinone oxygens.
Y = 0CH2(CH20CH2)3CH20
l (xxxvii)
N
KxxxviiOFigure 1.21:- 1,3-Bis(indoaniline) derived Calix[4]arene [73].
R = CH2C 02Et
23
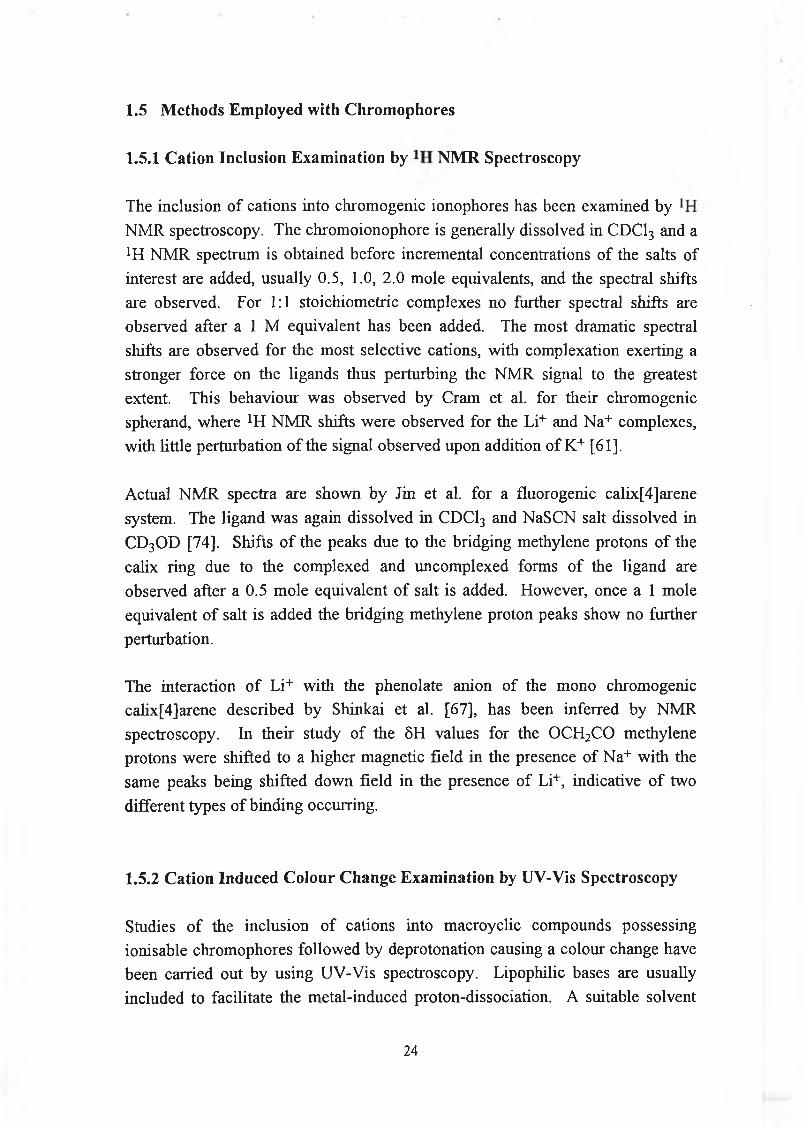
1.5 Methods Employed with Chromophores
1.5.1 Cation Inclusion Examination by NMR Spectroscopy
The inclusion of cations into chromogenic ionophores has been examined by NMR spectroscopy. The chromoionophore is generally dissolved in CDC13 and a !H NMR spectrum is obtained before incremental concentrations of the salts of interest are added, usually 0.5, 1.0, 2.0 mole equivalents, and the spectral shifts are observed. For 1:1 stoichiometric complexes no further spectral shifts are observed after a 1 M equivalent has been added. The most dramatic spectral shifts are observed for the most selective cations, with complexation exerting a stronger force on the ligands thus perturbing the NMR signal to the greatest extent. This behaviour was observed by Cram et al. for their chromogenic spherand, where *H NMR shifts were observed for the Li+ and Na+ complexes, with little perturbation of the signal observed upon addition of K+ [61].
Actual NMR spectra are shown by Jin et al. for a fluorogenic calix[4]arene system. The ligand was again dissolved in CDC13 and NaSCN salt dissolved in CD3OD [74], Shifts of the peaks due to the bridging methylene protons of the calix ring due to the complexed and uncomplexed forms of the ligand are observed after a 0.5 mole equivalent of salt is added. However, once a 1 mole equivalent of salt is added the bridging methylene proton peaks show no further perturbation.
The interaction o f Li+ with the phenolate anion of the mono chromogenic calix[4]arene described by Shinkai et al. [67], has been inferred by NMR spectroscopy. In their study of the 8H values for the OCH2CO methylene protons were shifted to a higher magnetic field in the presence of Na+ with the same peaks being shifted down field in the presence of Li+, indicative of two different types of binding occurring.
1.5.2 Cation Induced Colour Change Examination by UV-Vis Spectroscopy
Studies of the inclusion of cations into macroyclic compounds possessing ionisable chromophores followed by deprotonation causing a colour change have been carried out by using UV-Vis spectroscopy. Lipophilic bases are usually included to facilitate the metal-induced proton-dissociation. A suitable solvent
24

system is chosen to dissolve the ligand. To this the base i.e. imidazole, pyridine, trimethylamine, etc., is added and finally varying concentrations of metal salts are added and the UV-Vis spectrum is recorded in the range 200 - 800 nm. From this wavelength absorbance maxima (Xmax) and extinction coefficient (s) values can be calculated for complexed and uncomplexed forms of the cations. The solvent employed can be critical due to the nature of the transitions involved in generating the spectrum. Because the chromophores employed are conjugated n
systems and their absorbance spectra occur in the visible region of the spectrum, two types of transitions namely n - > n * and i t -» 7r*, are responsible for generating the signal with n —> i t * transitions generated from the movement of unshared electrons from the heteroatoms into the conjugated ring, more polar solvents result in hypsochromic shifts. This can be explained in terms of nonbonding electrons in the ground state being stabilised relative to the excited state, by hydrogen bonding or electrostatic interaction with polar solvents and thus a higher energy input is required to move electrons to the excited state. In i t -» n *
transitions the excited state is more polar than the ground state and therefore dipole-dipole interactions with polar solvents will lower the energy of the excited state more than that o f the ground state, resulting in bathochromic shifts in some cases (but not all), with increasing polarity. This solvent dependence is illustrated clearly by Zazulak et al. [64], and Cram et al. [61]. Solvents used for one phase examinations include methylene chloride [75], methanol [59], chloroform [58], chloroform/pyridine [56], THF/methanol [76], 10% Aqueous DEGMEE [64],
1.5.3 Cation Selectivity Determination
The selectivity of different chromogenic ligands for different cations has been determined by a number of methods. Complexation constants determined by the Benesi-Hildebrand [77] method have been employed in one phase systems [61], Helgeson et al. [62], obtained actual selectivity values for their cryptaspherands for K+ over Na+ by ratioing the slope of the curve obtained with aqueous solutions of 140 mM NaCL and varying concentrations of KC1 between 1 and 10 mM, and the curve obtained with a background concentration of 4 mM KC1 with varying NaCl concentrations between 0 and 200 mM.
In two phase systems where the ligand is dissolved in an organic phase and the metal salt is introduced in an immiscible aqueous phase, extraction coefficients
25

have been employed for determining cation selectivity. Sutherland et al. [71], calculated the extraction coefficient (see equations 1.1 and 1.2) of cations from an aqueous phase into chloroform in a pH controlled environment and ratioed the interfering ion Kg with that of the primary ion, to obtain a selectivity measurement.
[M+]aq + [CIH]org [H+]aq + [M+CI']org (1.1)
Ke = [H+1 anfM+CI~]orp (1.2)
[M+]aq [CIH]org
where M+ = primary ion.The various parameters were measured by UV-Vis spectroscopy at the protonated and deprotonated
1.5.4 pKa Determination
The evaluation of the pKa of the dissociating protons with various metal cations is also a useful indicator of cation selectivity. The lower the pKa of these protons to a particular metal cation, the more easily the dissociating proton will be removed and hence less basic conditions can be used to facilitate proton dissociation for select cations. A number of publications have described a variation in pKa values for the dissociating protons of ionisable chromoionophores. Cram et al. found with their chromoionophore l (xxxiv) that the HL.Na+ and HL.Li+ were much stronger acids than the free, uncomplexed ligand HL and there was also a difference in the acidity of both of these complexes, i.e. HL.Li+, pKa = 5.9, HL.Na+, pKa = 6.9, HL pKa = 13.0, [61], The different forms of the ligand are• HL = protonated ligand,• L" = deprotonated ligand,• L'.M+ = deprotonated complex,• LH.M+ = protonated complex.pKa measurements were carried out in 80% dioxane-20% water. In these pKa determinations the concentrations of protonated and deprotonated indicator were adjusted by incremental additions of solutions of HC1 or base where necessary until concentrations of the protonated and deprotonated indicators equalled one
26

another. The pH’s of the resulting solutions were taken. The observed readings were adjusted with ionic activity factors that correct for ionic strength changes in water-dioxane mixtures. Further pKa studies involving some of the same authors [62, 78] were based on the following equations, (1.3-1.6),
pKa = pH + log (HL/L') (1.3)
HL = AaXSL, bX - AbXSL.aX (1.4)
L AaXSHL, aX - A bX8HL,bX
AaX _ 8hl,aX [HL] + El, aX [L’] (1.5)1
Ab>. = 8HUbX [HL] + £l, bX [L'] (1.6)1
where HL is the protonated chromoionophore, L' is the deprotonated chromoionophore, A is the observed absorbance at aA. (wavelength maxima of HL) or bA. (wavelength maxima of L’), S is the molar absorptivity and 1 is the light path length in centimeters. Spectra were obtained for solutions of the ligand in its completely protonated form i.e. 0.02 M HC1 added to suppress ionisation of the dissociating proton, and in its completely ionised form i.e. in the presence of0.02 M TMAOH, and also in media buffered to known pH’s. From the spectral data the pKa values were calculated.
1.6 Importance of Li+Analysis
Lithium therapy is the most widely used treatment for the control of recurrent depression or manic depression. It is administered as Li2C 03 and monitoring of lithium concentration during treatment is required in order to secure a therapeutic effect and to avoid an overdose of lithium which could lead to fatal poisoning [79], There is a narrow gap between therapeutic and toxic levels, see Figure 1.22 .
27

Consecutive controls
Figure 1.22 Example o f serum Lithium Concentration Control Chart, fo r monitoring o f L i+ levels during therapy [89],
For the treatment to be therapeutic serum lithium levels should be maintained between 0.5 and 1.0 mM. At between 2.0 and 2.5 mM, adverse side-effects appear and at higher levels death. The effect of doses of Li2 C 0 3 are patient specific and therefore serum levels must be constantly monitored. A facile assay for blood samples from patients receiving lithium salts is clinically desirable to eliminate the use of AA which is more time consuming and expensive. A clinical lithium analyser based on ISEs is available for potentiometric analysis, but there is room for improvement [80],
There has been much recent interest in the development of a neutral carrier ionophore which could be applied to this application. Sodium is the main ionic interferent in blood fluid assays, being present at 1400 times higher concentrations than the lowest level of 0.1 mM lithium. Along with the neutral
28

chromoionophores exhibiting Li+ selectivity [56, 61, 63-68] a number of other ionophores have been examined for ISE electrode capabilities.
The ionophores used have been the cyclic crown-ethers or the non-cyclic polyether diamide carriers and polypropoxylate adducts and these have been reviewed [81]. Work has continued with all types of ionophores [82-86] including the natural antibiotics [87, 8 8 ], Parker et al. in 1991 described a di-«- butylamidel4-crown-4 derivative which had superior Li+ over Na+ selectivitiesi.e. Log kuNa = ‘ 3-25 and -2.92, to anything previously reported [89], The
electrode also functioned satisfactorily in serum, exhibiting a fast response time (10-15s), had minimal protein interference and had a lifetime of 50 d which is acceptable for such an electrode.
1.7 T rim e th y lam in e (T M A )
TMA is a degradation product of the reaction of bacteria such as Pseudomanas upon trimethylamine oxide in marine fish after death [90], Its detection, along with other amines, has been used as a means of determining fish freshness. Traditionally fish freshness has been assessed by olfactory analysis [91], but this is both time consuming and expensive. Colorimetric methods have also been employed and developed successfully, and can distingiush between TMA and dimethyl amine (DMA) [92-94], both of which are generated (along with other volatile amines and sulphides) as the fish spoils [90], However, these methods require time consuming mincing of the fish followed by solvent extraction before analysis. More recently Gastec detector tubes, containing crystals which change colour as they react with a specific gas or vapour, have been developed and used in amine analysis of the gill air of fish [95], with amines being determined in a concentration range of 0.05 to 5 ppm. These tubes are attached to a pump and a specific volume of gas is analysed. GC analysis of amines produced by fish has also been used to distinguish between TMA and DMA and to quantify the levels at which each are present [96], Another approach investigated for TMA analysis involves the use of semiconductor gas sensors containing ruthenium. Such sensors were found to respond well to 50 ppm TMA and were used to determine the freshness of Japanese saurel [97, 98], All of these methods, while not all destructive, do involve a certain degree of handling of the samples or involve some form of instrumentation. The development of a non-instrumental indicator system which would respond quickly to gaseous amines could obviously be of great benefit to the food industry.
29

1.8 References
1. H. Vanhoes, C. Vandecasteele, J. Versieck and R. Dans, Anal. Chem., 61 (1989) 1851.
2. D.J. Cram, G.M. Lein, J. Am. Chem. Soc.r 107 (1985) 3657.
3. C. Moore and B.C. Pressman, Biochem., Biophys. Res. Commun., 15 (1964) 562.
4. Z. Stefanac and W. Simon, Microchem. J., 12 (1967) 125.
5. C. J. Pedersen, J.Am. Chem. Soc., 89 (1967) 7017.
6 . D.J. Cram and K.N. Trueblood, Top. Curr. Chem., 98 (1981) 43.
7. C.J. Pedersen and H.K. Frensdorf, Angew. Chem. Int. Ed. Engl., 11 (1972) 16.
8 . B. Dietrich, J.M. Lehn, J.P Sauvage, Tett. Lett., (1969) 2885.
9. B. Dietrich, J.M Lehn, and J.P. Sauvage, Tett. Lett., (1969) 2889.
10. J.M. Lehn and J.P. Sauvage, J. Am. Chem. Soc., 97 (1975) 6700.
11. G.M. Lein, D.J. Cram, T. Kaneda, R.C. Helgeson, G.M. Lein, J. Am. Chem. Soc., 101 (1979) 6752.
12. D.J. Cram, T. Kaneda, R.C. Helgeson, S.B. Brown, C.B. Knobler, E. Maverick, K.N. Trueblood, J. Am. Chem. Soc., 107 (1985) 3645.
13. K.E. Koenig, G.M Lein, P. Stuckler, T. Kaneda, D.J. Cram, J. Am. Chem. Soc., 101 (1979)3553.
14. F. Vogtle and E. Weber, Angew. Chem., Int. Ed.Engl., 18 (1979) 753.
15. G. W. Gokel, D.M. Dishong and C. J. Diamond, J. Chem. Soc., Chem. Commun., (1980) 1053.
16. J. Canceill, L. Lancombe and A. Collet, J. Am. Chem. Soc., 107 (1985) 6993.
17. J. Canceill, A. Collet, J. Gabard, F. Kotzyba-Hibert and J.M Lehn, Helv. Chim. Acta, 65 (1982) 1894.
18. D.J. Cram, Angew. Chem., Int. Ed. Engl., 25 (1986) 1039.
19. D.J. Cram and H. Steinberg, J. Am Chem. Soc., 73 (1951) 5691.
20. A. Baeyer, Ber., 5 (1872) 25.
21. L.H. Baekeland, U.S. Patent 942, October (1908) 699.
22. A. Zinke and E. Ziegler, Ber., B74 (1941) 1729.
23. A. Zinke and E. Ziegler, Ber., 77 (1944) 264.
24. J.W. Comforth, P. D'Arcy Hart, G.A. Nicholls, R.J.W. Rees and J.A. Stock, Br. J. Pharmacol., 10 (1955) 73.
30

25. H. Kammerer, G. Hapel and F. Caesar, Makromol. Chem., 162 (1972) 179.
26. G. Happel, B. Mathiasch, and H. Kammerer, Makromol. Chem., 176 (1975) 3317.
27. J.H. Munch, Makromol. Chem., 178 (1977) 69.
28. C.D. Gutsche and R. Muthukrishnan, J. Org. Chem., 43 (1978) 4905.
29. C. D. Gutsche “Calixarenes ”, Monographs in Supramolecular Chemistry, Vol. 1, R.S.C. Cambridge (1989).
30. J. Vicens and V. Bohmer, (edts.), "Calixarenes - A Versatile Class o f Macrocyclic Compounds", Topics in Inclusion Science, Kluwer Academic Publishers, (1991).
31. C.D. Gutsche, B. Dhawam, J.A. Levine, K.H. No, L.J Bauer, Tetrahedron, 39(1983) 409.
32. L.C. Groenen, J.D. Van Loon, W. Verboom, S. Harkema, A. Casnati, R. Ungaro, A. Pochini, F. Ugozzoli , R.N. Reinhoudt, J. Am. Chem. Soc., 113(1991)2385.
33. R.M. Izatt, J.D. Lamb, R.T. Hawkins, P.R. Brown, S.R. Izatt and J.J. Christensen, J. Am. Chem. Soc., 105 (1983) 1782.
34. A. Arduini, A. Pochini, S. Reverberi, and R. Ungaro, J. Chem. Soc., Chem. Commun., (1984) 981.
35. C. Alfieri, E. Dradi, A. Pochini, R. Ungaro, and G.D. Andreetti, J. Chem. Soc., Chem. Commun., (1983) 1075.
36. M.A. McKervey, E M. Seward, G. Ferguson, B. Ruhl, S.J. Harris, J. Chem. Soc., Chem. Commun., (1985), 389.
37. S. Shinkai, H. Kawabata, T. Arimura, T. Matsuda, H. Satoh and O. Manabe, J. Chem. Soc. Perkin Trans. 1, (1989) 1073.
38. S. Shinkai, Y. Shirahama, T. Tsubaki and O. Manabe, J. Chem. Soc. Perkin Trans. 1, (1989) 1859.
39. F. Amaud-Neu, E.M. Collins, M. Deasy, G. Ferguson, S.J. Harris, B. Kaitner, A.J. Lough, M.A. McKervey, E. Marques, B.L. Ruhl, M.J. Schwing -Weill, E.M. Seward, J. Am. Chem. Soc., I l l (1989) 8681.
40. A. Arduini, A. Pochini, S. Reverberi, R. Ungaro, C.D. Andreetti, F. Ugozzoli, Tetrahedron, 42 (1986) 2089.
41. G. Barrett, V. Bohmer, G. Ferguson, J.F.Gallagher, S.J. Harris, R.G. Leonard, M.A. McKervey, M. Owens, M. Tabatabai, A. Vierengel, W. Vogt, J. Chem. Soc., Perkin Trans 2, (1992) 1595.
42. F. Amaud-Neu, G. Barrett, S. Cremin, M. Deasy, G. Ferguson, S.J. Harris, A.J. Lough, L. Guerra, M.A. Me Kervey, M.J. Schwing-Weil, P. Schwinte, J. Chem. Soc., Perkin Trans 2, (1992) 1119.
31

43. E.M. Collins, M.A. McKervey, E. Madigan, M.B. Moran, M.Owens, G. Ferguson, S.J. Harris, J. Chem. Soc., Perkin Trans 1, (1991) 3137.
44. D. Diamond, in M.R. Smyth and J.G. Vos, (edts.), "Electrochemistry, Sensors and Analysis", Analytical Chemistry Symposium Series, Volume 25, Elsevier, Amsterdam, (1986) 155.
45. D. Diamond, G. Svehla, E.M. Seward, M.A. McKervey, Anal. Chim. Acta, 204(1988) 223.
46. W.R. Seitz, Anal. Chem., 56 (1984) 16A.
47. R. Narayanaswamy, D.A. Russell, Proc. of the 2nd Int. Meeting on Chem.Sensors, Bordeaux (1986).
48. H.G. Lohr, and F. Vogtle, Acc. Chem. Res., 18 (1985) 65.
49. M. Takagi and K. Ueno, Top. Curr. Chem., 121 (1984) 39.
50. R.E. Moss, I.O. Sutherland, Anal. Proc., 25 (1988) 272.
51. J. P. Dix, and F. Vogtle, Angew. Chem. Int. Ed. Engl., 17 (1978) 857.
52. M. Takagi, H. Nakamura, and K. Ueno, Anal. Lett., 10 (1977) 1115.
53. H. Nakamura, M. Takagi, and K. Ueno, Talanta, 26 (1979) 921
54. B.P. Bubnis, J.L. Steger, Y.P. Wu, L.A. Meyers and G.E. Pacey, Anal. Chim. Acta, 139 (1982) 307.
55. B. P. Bubnis, and G. E. Pacey, Tett. Lett., 25, 11 (1984) 1107.
56. T. Kaneda, K. Sugihara, H. Kamiya, and S. Misumi, Tett. Lett., 22, 44 (1981)4407.
57. J.F. Alder, D.C. Ashworth, R. Narayanaswamy, R.E. Moss and I.O. Sutherland, Analyst, 112(1987) 1191.
58. S. Misumi, and T. Kaneda, J. Incl. Phenom. and Molec. Rec. in Chem., 7 (1989) 83.
59. J. Van Gent, E.J.R. Sudholter, P.V. Lambeck, T.J.A. Popma, G. J. Gerritsma, and D.N. Reinhoudt, J. Chem. Soc., Chem. Commun., (1988) 893.
60. T. Kaneda, Y. Ishizaki, S. Misumi, Y. Kai, G. Hirao, and N. Kasai, J. Am. Chem. Soc., 110(1988) 2970.
61. D.J. Cram, R.A. Carmack and R.C. Helgeson, J. Am. Chem. Soc., 110 (1988) 571.
62. R.C. Helgeson, B.P. Czech, E. Chapoteau, C.R. Gebauer, A. Kumar and D.J. Cram, J. Am. Chem. Soc., I l l (1989) 6339.
63. A.F. Sholl, I.O. Sutherland, J. Chem. Soc., Chem. Commun., (1992) 1716.
64. W. Zazulak, E. Chapoteau, B.P. Czech, and A. Kumar, J. Org. Chem., 57(1992) 6720.
32

65. V. Bohmer, E. Schade, and W. Vogt, Makromol. Chem., Rapid Commun. 5,(1984), 221.
6 6 . S. Shinkai, K. Araki, J. Shibata, D. Tsugawa and O. Manabe, Chem. Lett., (1989) 931.
67. H. Shimizu, K. Iwamoto, K. Fujimoto and S. Shinkai, Chem. Lett., (1991) 2147.
6 8 . Y. Nakamoto, T. Nakayama, T. Yamagishi, S. Ishida, Workshop on Calixarenes and Related Compounds, Mainz, Germany, August 28-30, (1991) Posterl.
69. A.M. King, C.P. Moore, K.R.A. Sandanayke and I.O. Sutherland, J. Chem. Soc., Chem. Commun., (1992) 582.
70. K.R.A.S. Sandanayake, and I.O. Sutherland, Sens, and Act. B, 11, (1993) 331.
71. E. Ghidini, F. Ugozzoli, R. Ungaro, S. Harkema, A. Abu El-Fadl and D. N. Reinhoudt, J. Am. Chem. Soc., 112 (1990) 6979.
72. Y. Kubo, S. Hamaguchi, K. Kotani, K. Yoshida, Tett. Lett., 32, 50 (1991) 7419.
73. Y. Kubo, S. Hamaguchi, K. Yoshida and S. Tokita, J. Chem . Soc., Chem. Commun., (1993) 305.
74. J. Jin, K. Ichikawa, T. Koyana, J. Chem. Soc., Chem. Commun., (1992) 499.
75. S. Ogawa, R. Narushin^a, Y. Arai, J. Am. Chem. Soc., 106 (1984) 5760.
76. S. Shinkai, K. Araki, J. Shibata, D. Tsugawa and O. Manabe, J. Chem. Soc., Perkin Trans. 1, (1990) 3333.
77. H. Benesi, J. H. Hildebrand, J. Am. Chem. Soc., 71 (1949) 2703.
78. B.P. Czech, E. Chapoteau, W. Zazulak, C.R. Gebauer, and A. Kumar, Anal. Chim. Acta, 241 (1990) 127.
79. A. Amdisen, in "Handbook o f Lithium Therapy", edt. F.N. Johnson, M.T. P. Press Lancaster, (1986) Ch. 2.
80. W. Me Curdy, Clin. Chem., 34 (1988) 476.
81. V.P.Y. Gadzekpo, G.J. Moody, J.D.R. Thomas, and G.D. Christian, IonSelective Electrode Rev., 8 (1986) 173.
82. H. Sugihara, T. Okada, and K. Hiratini, Anal. Chim. Acta, 182 (1986) 275.
83. A.S. Attiyat, G.D. Christian, R.Y. Xie, X. Wen, and R.A. Bartsch, Anal.Chem., 60(1988) 2561.
84. .E. Metzger, R. Bohmer, W. Simon, D. J. Vonderschmitt and K. Gautschi, Anal. Chem., 59 (1987) 1600.
85. K. Kimura, H. Oishi, T. Miura and T. Shono, Anal. Chem., 59 (1987) 223.
33

8 6 . C.W. Beswick, G.J. Moody, and J.D.R. Thomas, Anal. Proc., 26 (1989) 2.
87. K. Suzuki, K. Tohda, M. Tominaga, K. Tatsuta, and T. Shirai, Anal. Lett., 20, 6 (1989) 927.
8 8 . K. Tohda, K. Suzuki, N. Kosuge, K. Watanabe, H. Nagashima, H. Inoue, and T. Shirai, Anal. Chem., 62 (1990) 936.
89. R. Kataky, P. E. Nicholson, D. Parker, and A.K. Covington, Analyst, 116 (1991) 135.
90. C.K. Simmonds, and E.C. Lamprecht, in "Microbiology o f Frozen Foods" edt. R K . Robinson, Elsevier Applied Science Publishers London and New York, (1985), pp 169-208.
91. J.M Shewan, R.G. McIntosh, C.G. Tucker, and A.S.C. Ehrenburg, J. of the Science o f Food and Agriculture, 4 (1953) 283.
92. W.J. Dyer, J. o f the Fisheries research Board of Canada, 6 (1945) 351.
93. W.J. Dyer, J. of the Fisheries research Board of Canada, 7 (1950) 576.
94. W.J. Dyer, Journal of the Association of Official Agricultural Chemists, 42 (1959) 292.
95. N.J.C. Strachan, and F.J. Nicholson, Int. J. Food Sc. and Tech., 27 (1992) 261.
96. R.I. Perez Martin, J.M. Franco, P. Molist, and J.M. Gallardo, Int. J.of Food Sc. and Tech., 22(1987) 509.
97. M. Egashira, Y. Shimizu, and Y. Takao, Chem. Lett., (1988) 389.
98. M. Egashira, Y. Shimizu, and Y. Takao, Sens, and Act., B, 1, (1990) 108.
34

Chapter 2
Methods and Materials
35

2.1 Materials
The reagents and materials were obtained from the following sources: Analar grade chlorides of lithium, sodium and potassium were supplied by Riedel De Haen, perchlorate salts of the same cations were supplied by Aldrich, sodium thiocyanate was obtained from Riedel De Haen, lithium thiocyanate from Aldrich and potassium thiocyanate from Merck. The lipophilic bases triethylamine (TEA), tridodecylamine (TDDA), and morpholine were purchased from Merck, Riedel De Haen and Aldrich respectively. Spectroscopic grade tetrahydrofuran (THF) was supplied either by Fluka, Romil, or Aldrich, whereas HPLC grade solvents, acetonitrile, methanol, butan-l-ol, butanone, butan-2 -ol, 1 , 1 , 1
trichloroethane were obtained from Labscan. The deuterated solvents of chloroform and methanol were obtained from Aldrich. All salt solutions were made up in distilled, deionised (Milli-Q grade) water.
2.2. Instrumentation
The ultraviolet-visible (UV-Vis), nuclear magnetic resonance (NMR) and infrared (IR) spectra were obtained with a Hewlett Packard 8452A diode array spectrophotometer, a Brucker AC-400 spectrometer, and a Perkin-Elmer 983G spectrophotometer, respectively. All UV-Vis experiments were carried out in a quartz cuvette and the instrument was blanked in the solvent in which the ligands had been dissolved.
2.3 Nitrophenol Chromoionophores (Ligands 1, 2, & 3)
2.3.1 Effect of Complexation on UV-VIS Absorbance
Solutions of the ligands were made up in THF, (Ligand 1. and 3 at 5xlO'5 M, and Ligand 2 at 7xlO'5 M). 2.5 mL aliquots of these solutions were taken and liquid morpholine was added in the following amounts, 20 ¡xL for Ligands 1, and 3, 45 [iT. for Ligand 2. Incremental concentrations of the aqueous metal perchlorates of lithium and sodium were added to give final concentrations in the range 1 0 _1
to 10“6 M. Potassium perchlorate was added to give concentrations in the range 1 0 ' 6 to 4 x 1 0 "3 m. The exact volumes and concentrations of MCIO4 (where M =
36

Li, Na, or K) to give the required final concentrations are shown in Table 2.1. The UV-Vis spectra o f the solutions were obtained between 800 and 300 nm.
Table 2.1:- Table of volumes of aqueous MC104 added to 2.5 mL aliquots of Ligands 1 - 9 dissolved in organic solvents (THF, butanol, MeOH - see individual experiments for details) to give the desired final MC104 concentration in the aliquot for UV-Vis spectroscopy experiments.
Initial [MClC>4](aq)
mol dm'3 M=Na, Li
Volume (nL) M C I04(aq) added to
Ligand Soln.
M=Na, Li
Initial [KC104](aq)*
mol dm’3
Volume (^L) KC104(aq) added to
Ligand Soln.
[M CI04] in Ligand Soln.
mol dm"3 M = Na, Li, K.
10-3 2.5 10-3 2.5 jo-6
IO" 2 2.5 1 0 - 2 2.5 10-5
IO" 1 2.5 io -i 2.5 10-4
1 2.5 io -i 2.5 10-3io -i 50 2 x l0 -3io -i 1 0 0 4 x l0 -3
5 5 ----- ¡O'2
5 50 ----- io -J
* Limited solubility o f KC104 necessitated a different experimental design. While this complicated the interpretation o f the results it is unfortunately unavoidable.
2.3.2 Selectivity Coefficient Determination
In order to determine selectivity coefficients in this one phase system, a series of experiments was set up as above, with the final lithium perchlorate concentration being varied in the range 10_1 to 1 0 - 6 M, in a fixed background concentration i.e. 10' 2 or 10' 3 M, of interfering ion in the form of sodium perchlorate. Spectra were obtained from 800-300 nm and graphs of absorbance at 424 nm (the ^max of the deprotonated complex) versus the log of the concentration of lithium perchlorate concentration drawn. At high concentrations, the sodium ion has the effect of reducing the response of the ligand to lithium at lower concentrations as it dominates the complexation process with the ligand and swamps any lithium ion effects. However, at higher lithium ion concentrations, a response will be
37

observed because of greater affinity of the ligand for lithium ions. From these graphs, selectivity coefficients can be estimated from the ratio of the sodium and lithium ion concentrations at the intersection of the sodium and lithium dominant response regions of the curves.
2.3.3 Optimum Base Concentration Determination
To solutions of the ligands in THF at the concentrations previously mentioned, aqueous lithium perchlorate was added to give a final concentration of 10~3 M, i.e. 2.5 p.L of 1 M UCIO 4 was added to 2.5 mL of sample. Morpholine was then added with incremental increases in concentration to give final morpholine concentraions in the range 0.023 M to 0.597 M. Spectra were recorded in the range 800 - 300 nm. A graph of absorbance at 424 nm versus the log of morpholine concentration was plotted and the end point of the titration calculated.
2.3.4 Effect of Solvent Variation on UV-Vis Spectra
Ligand i was examined for spectral changes with a variation in the solvent in which the ligand was dissolved. Method 2.3.1. was followed as before with methanol being used in place of THF as the solvent. Changes in the spectra between the two different solvents were noted and A.max changes were calculated.
2.3.5 Two Phase Examination of Ligands
For two-phase experiments, 20 piL of TDDA were added to 2.5 mL aliquots of 5x l0 - 5 M solutions of each of the ligands made up in butan-l-ol. To these, 2.5 mL of water were added. Incremental concentrations of metal perchlorates were then added to the lower, aqueous phase to give final aqueous phase concentrations in the range 10_1 to 10-6 M (see Table 2.1 for volumes used). Spectra were taken of both phases after the two layers had been allowed to separate (i.e. approximately 15 minutes). Preliminary examinations of suitable water immiscible solvents will be described with the nitrophenylazophenol ligands.
38

2.3.6 Complexation Studies
An investigation of cation inclusion in the calix[4]arene ring was carried out by •H NMR titrations. The lH NMR spectra of the free and complexed forms of the ligands were obtained in CDC13 at room temperature. Sodium thiocyanate was added as aliquots from a 1.0 M solution in CD3OD directly to the CDC13 solution of the ligand in an NMR tube to give the metal:ligand ratios shown in Table 2.2.
Table 2.2 NMR Titrations
R (R=[NaSCN]/[Lig]*) Total Vol. NaSCN** Added
(a )R = 0 . 0 0 . 0 0
(b) R = 0.5 1.25(c )R = 1 . 0 2.50(d) R = 2.0 5.00
* [Lig] = 5x10*3 m dissolved in CDCI3.
** NaSCN dissolved in CD3OD
Shifts in certain NMR signals are associated with cation complexation with calix[4]arenes and these were examined with the spectra obtained. These will be discussed in detail later.
2.4 Calix[4]arene with Chrom ophore Within Cavity (Ligand 4)
2.4.1 Effect of Complexation on UV-Vis Spectra
A 5 x 1 0"5 M solution of ligand 4 was made up in THF. To 2.5 mL aliquots of this solution 12.5 \xL o f morpholine were added i.e. 6 x 10- 2 M morpholine. This concentration was arrived at by following Method 2.3.3. Incremental changes of aqueous metal perchlorates o f lithium, sodium and potassium were added, with the volumes used in Table 2.1 again being used. Spectra were recorded from 800-300 nm.
39

2.4.2 Selectivity Coefficient Determination
Selectivity coefficients were obtained using method 2.3.2 for lithium over sodium selectivity, with 10_3M lithium perchlorate being used as the interfering ion concentration. Sodium over lithium selectivity studies were also carried out, using a constant background lithium perchlorate concentration of 10- 3 M. Sodium over potassium selectivity was examined by introducing a fixed volume of KCIO4 made up in acetonitrile, to give a final KC104 concentration of 1 0 - 2 M, or a fixed volume of aqueous KC104 to give final KC104 concentration of 4 mM.
2.4.3 1H NMR Complexation Studies
NMR complexation studies were carried out by method 2.3.7 with the concentration of Ligand 9 being 2.5 x 10*3 M. Sodium was introduced as its perchlorate salt, and similar studies were conducted for lithium and potassium using perchlorate and thiocyanate salts respectively. KSCN was used in place of KCIO4 because of the lack of solubility of KC104 in CD3 OD.
2.5 Nitrophenylazophenol Ionophores (Ligands 5, 6, 7, 8, & 9)
2.5.1 Effect UV-Vis Absorbance Spectra of Ligand Complexation
5x1 O' 5 M solutions of ligands 5, 7, 8 , and a 6x l0 ' 5 M solution of ligand 6 , were made up in THF. A 1CH M solution of Ligand 9 was also examined. 2.5 mL aliquots of each ligand solution were taken and to this 1 0 0 jiL of tri-n- dodecylamine (TDDA) was added, (50 jiL in the case of Ligand 6 ). Incremental concentrations of aqueous metal perchlorates of lithium, and sodium were added as before to give final metal perchlorate concentrations of lO"6 M to 0.1 M. The same volumes of aqueous solutions described in table 2.1 were used. After gently shaking, the clear yellow ligand solution changed colour to red immediately, with the intensity of the resultant colour being dependent on the metal perchlorate concentration. This colour change was examined using UV- Vis spectroscopy in the range 800-300 nm.
40

2.5.2 Selectivity Coefficient Determination
In order to determine selectivity coefficients for lithium against sodium, a series of experiments was set up as above, with the final lithium perchlorate concentration being varied in the range 10' 6 to 10' 1 M, in a fixed background concentration of interferent (0.05 M and 0.1 M sodium perchlorate). Spectra were obtained from 300-800 nm and graphs of absorbance at 520 nm versus the log of the concentration of lithium perchlorate concentration drawn.
2.5.3 Solvent Choice for Two Phase Examinations
To 2.5 mL of 5 x 10- 5 ligand 4 in each of the following solvents: dichloroethane, butan-l-ol, butanone, 1 , 1 , 1 trichloroethane, butan-2 -ol, 2 0 jiL of triethylamine (TEA) were added. Any colour changes which occured were noted. 2.5 mL of water were added and again any resulting colour changes in either layer were noted. Finally 2.5 jiL of 1 M LiC1 0 4 were added to the aqueous phase. After the two phases had been shaken and subsequently allowed to re-separate, colour changes in each layer were observed. For comparative purposes, blank experiments were carried out for each solvent containing everything except the lithium perchlorate.
2.5.4 Two Phase Examination of Ligands
After butan-l-ol had been chosen as the most suitable water immiscible solvent, two-phase experiments were carried out where 100 jiL of TDDA was added to2.5 mL aliquots o f 5x l0 - 5 M solutions of each of the ligands made up in butan-l- ol. To these, 2.5 mL o f water were added. Incremental concentrations of metal perchlorates were then added to either the upper organic layer or to the lower, aqueous phase to give final concentrations in the range 1 0 ~l to lO^M for the phase into which the salt was introduced. Spectra were taken of both phases.
2.5.5 Complexation Studies
An investigation of cation inclusion in the calix[4]arene ring was carried out by *H NMR titrations using the method outlined in method 2.3.7.
41

2.6 Assessment of Ligand 4 for The Rapid Colorimetric Detection of Trimethylamine
2.6.1 Liquid Phase Experiments
2.5 mL of a solution containing 5x l0 ' 5 M of 5 and 1 M LiC104 in butan-l-ol was placed in a test tube in a gas tight vessel. Fixed volumes between 0.2 and 50 pL o f a 25% w/v aqueous TMA solution were injected into a 550 mL capacity vessel through a supa seal cap, ensuring that none of the liquid entered the test tube containing the indicator solution, giving maximum final TMA concentrations in the approximate range of 0.1 to 25.0 ppm*, assuming all TMA passes into the gas phase. The vessel was heated gently in a 50°C oven to aid the evolution of TMA from the aqueous solution into the gaseous form. After reaction, samples of the solution were removed in order to obtain the UV-Vis spectra. For TMA concentrations below 1 ppm, injections were made from a 1 / 1 0 , or a 1 / 1 0 0
dilution of the 25% TMA(aq) stock solution.
2.6.2 Preparation of Test Strips based on the Ligand
Using filter paper as the support (Whatman no .l, 4.25 cm disc), the complexed calixarene was immobilised by carefully adding 0.2 mL of a tetrahydrofuran (THF) solution which was 6x1 O' 4 M in ligand 5 and 0.1M in LiC104 onto the paper. Evaporation of the THF yielded a paper with a yellowish tinge. Test strips prepared in this manner were placed in a gas-tight vessel of capacity 2.71 L, and varying volumes of TMA were injected through a supa-seal cap to give final TMA concentrations of 0.010 to 50 ppm.
* Gaseous TMA concentrations were calculated as follows
1. 25% w/v aqueous TMA = 25 g of TMA /100 mL aqueous TMA solution = 0.25 mg/ pL
2. 1 mg TMA = 4 (J.L of 25 % TMA<aq)3. 1 ppm TMA = 4 pL of 25% TMA(aq) /L of gas tight chamber4. 1 ppm TMA in 550 mL (Capacity of gas tight chamber) = 4 pL x (550mL/1000 mL)
42

Method 2.6.2 was followed, and after evaporation of THF, the strips were covered with a film of low density polyethylene (LDPE).
2.6.3 Preparation of Sealed Test Strips
43

Chapter 3
Nitrophenol Ligands
44

3.1 Introduction
In both this chapter and in Chapter 4, nine chromogenic calix[4]arenes are characterised as part of an initial screening process to determine the feasibility of using some of these chromogenic calixarenes as optical cation or amine sensor components and thereby allow patenting of any class of compound which was seen to have the desired analytical characteristics. Ligands J.> and 1 were synthesised by Geraldine Barrett, and Ligand 4 was synthesised by Mary Moran, under the supervision of Prof. M.A. McKervey, at the Queen’s University, Belfast. Ligand 3 was synthesised by Dr Stephen J. Harris at D.C.U.
The cation binding and extraction ability of calix[4]arenes is well known [ 1 ], Calix[4]arenes, the subjects of this work have been shown to display preferential uptake o f the smaller cations of the alkali metal series, such as sodium, potassium and to a certain extent lithium [2], The incorporation of known chromophores into the calixarene structure or the attachment of such moieties as pendent groups to the calixarenes is an approach which can offer an effective means of cation inclusion transduction in the form of a spectral/colour change. Amaud-Neu et al [2 ] carried out an extensive study of alkyl calixaryl esters and ketones with a number of variations of R and R' groups (see structure 3 (i)).
3 (i) Calix[4]arene tetraester.
Even relatively minor changes in the R' groups produced changes in cation extraction abilities of the calixarenes. One example of this was the attachment of a tert-butyl group in place o f an ethyl group in the R' position, which resulted in the ability of the molecule to extract K+ increasing with no significant decrease in Na+ extraction. A possible explanation for this phenomenon was the enlargement
45

of the polar cavity due to steric interference between the bulky tert-butyl substituents [2], So the attachment of nitrophenol chromophores in this R' position will result in a selectivity pattern which is difficult to predict exactly. Since all the molecules are tetramers of the tetraester type, complexation ability would be expected with the smaller cations i.e Li+, Na+ and K+ as opposed to Cs+ or Rb+ which have shown preferential uptake by calix[6 ]arenes.
Ligands 1 to 3 have ester groups attached to the phenolic oxygens of the calixarene backbone, with either 1 or 4 nitrophenol chromogenic moieties attached as pendent groups to the CH2 of these ester groups. Ligand 4 unlike ligands 1 and 3 actually has the chromogenic moeity built into the calix[4]arene structure with the nitrophenol group making up one of the aromatic rings of the calix[4]arene annulus. In Ligands I to 3 the nitro group of the nitrophenol chromogenic moiety is ortho to the dissociating phenolic group whereas in Ligand 4 it is in the para position. The nitrophenol moiety with the phenol group in the ortho position relative to the nitro group, has been used as an indicator [3]
and shows a colour change from colourless to yellow in the pH range 5.0 to 7.0 (pKa 7.17). The para nitrophenol molecule has been found to change colour over a pH range of 5.6 to 7.6 (pKa 7.15) [3],
In both Ligands 1. and 2, the tetra and monochromogenic ligands respectively, tert-butyl groups occupy the para position of the calixarene backbone. With Ligand 3 (another tetrachromogenic ligand), a long-chain C 1 8 group, introduced to enhance the lipophilicity of the molecule, occupies this position. Ligand 4 is another monochromogenic compound, with three i-butyl groups occupying the para position of the remaining aromatic rings, and as was previously stated, the chromogenic portion of the molecule forms an integral part of the calix[4]arene backbone. Like the other monochromogenic ligand (Ligand 2) the remaining aromatic rings of the calixarene backbone possess ethyl ester moieties. The ethyl ester moieties attached to the phenolic oxygens of the calixarene backbone offer the heteroatoms (in particular carbonyl oxygen atoms), required for electrostatic interaction with the complexing cation as described in Chapter 1 section 1.3.4.
46

3 (ii) Ligand 1
3 (ill) Ligand 2
3 (iv) Ligand 3
47

3(v) Ligand 4
3.2 Mechanism of Colour Generation
All of the above ligands, and those to be discussed in Chapter 4 belong to a series of ionisable chromogenic materials in which the colour generation process essentially arises from deprotonation of the acidic chromophore (-COH), where C represents the chromogenic portion of the ligand and OH represents the ionisable phenolic group on this moiety, attached near the ligand (L-) polar cavity (see equation (3.1) below. In previous experiments [4-11] it has been demonstrated that this approach could be used to detect a variety of alkali metal cations, represented here as (M+) in solution and therefore have the potential for incorporation into an optical sensor for these ions. In all of the previously mentioned ionisable chromoionophores [4-11] the dissociating phenolic group was actually sited within the hydrophobic cavity of the calixarene [8 - 1 1 ], the spherand [5], the crown ether [6 , 7] and the cryptand [4]. Usually with these materials, formation of the metal-ligand complex by itself does not generate the colour change because a proton receptor is required for the acid-base colour generating reaction:
L-COH + M+ ^ LM+-COH (3.1)
(3 = [LM+-COH] (3.2)[L-COH] [M+]
where 0 is the stability constant for complexation.
Complexation in the absence of any chromogenic indication of deprotonation can be confirmed by JH NMR spectroscopy. However, the positively charged metal
48

ion in the ligand cavity increases the acidity of the ionisable chromophores and in the presence of a suitable base (B) these are more easily deprotonated, shifting their absorbance maxima to longer wavelengths in the process:
LM+-COH + B LM+-CO- + BH+ (3.3)
Ka(C) = [LM+-C O j [BH+] (3.4)[LM+-COH] [B]
where K a(C ) is the acid dissociation constant for the deprotonation of the complex.
Hence for metal-ion detection, the base must be chosen carefully because if it is too strong, deprotonation of the ligand may occur independently of the presence of metal ion:
L-COH + B ^ L-CO + BH+ (3.5)
K a (L ) = fL-CO-] [BH+] (3.6)[L-COH] [B]
where K a (L ) is the acid dissociation constant for the deprotonation of the free ligand.
The ideal base will therefore react with the complex but not with the free ligand, hence enabling the metal ion to be detected optically.
As the inclusion of a cation in the ligand cavity will render the phenolic proton more labile the acidity of the phenolic proton o f the chromophore will increase,i.e.. K a (C ) > K a (L )
49

3.3 Base Concentration Optimisation
A base titration was carried out as in Method 2.3.3, with 7xl0 - 5 M Ligand 2, 10- 3
M LiC104 with the concentration of morpholine being varied between 0.023 and 0.597 M. The following spectra were obtained. From this a graph of absorbance versus [Morpholine] was drawn (Figure 3.2) and a morpholine optimum concentration of 0.2 M was obtained. The optimum base concentration was considered to be the concentration which gave the greatest absorbance in the presence of 10’3 M LiC104, and above which no further increase in absorbance was seen.
Figure 3.1:-UV-Vis spectra showing the effect o f increasing morpholine concentration on the UV-Vis spectrum o f 5 x 10'5 M Ligand / with 10'3 M H C 104, using with 0.23 M (1), 0.046 M (2), 0.069 M (3), 0.092 M (4), 0.115M (5), 0.138 M (6), 0.161 M (7), 0.207 M (8), 0.253 M (9), 0.298 M (10), 0.390 M (10) 0.482 M (11), 0.666 M (12). M ethod 2.3.3.
50

0.35 -
0.3 oo
o1 0.25
^rCN 0.2 o
o°<§>rO
0.15
< 0.1 o
0.05 *
0 ------------1------------ 1------------1-------— H------------1------------ 1------------1
0 0.1 0.2 0.3 0.4 0.5 0.6 0.7
[Morph]
F igure 3.2:-Graph o f absorbance at 424 nm versus [morpholine] fo r Ligand 2, drawn from data obtainedfrom Figure 3.1.
Similarly for Ligands 1 and 3, the tetrachromogenic ligand and its C 1 8 analogue of respectively, the optimum morpholine concentration was evaluated and found to be around 0.1 M for each under the conditions of the experiment.
3.4 Effect of Different Concentrations of Alkali Metals on Absorbance Spectra, in One Phase Experiments.
3.4.1 Ligand 1, One Phase.
A series o f experiments was set up using the optimum morpholine concentrations to determine the ligand's spectroscopic responses to varying concentrations of the perchlorates o f lithium, sodium and potassium. Method 2.3.1 was followed with incremental increases in metal perchlorate concentration in the range 10- 6 M and 0.1 M being examined. Figures 3.3(a), (b) and (c) show the spectral response achieved for lithium, sodium and potassium respectively.
51

Free DeprotonatedProtonated Ligand Complex
~ l=j51oj
rt-a0. B £_
S b . eXI£ E.4
1--7 0 04 Q 0 j B B E B B
W a v e 1 e n ^ t h C n m JB 0B
F igure 3 .3 (a):- L igand 7, lithium response
4 0 0 5 0 0 E Ö Q 7 0 0 B 0 0 H a v/ b ! E n p t h C n r n ' J ________________________________________
Figure 3.3 (b ):-L igan d L, sodium response.
52

Free DeprotonatedProlonated Ligand Complex
Figure 3.3 (c):-L igand Jj potassium response.
Figure 3.3:- One-phase investigation o f changes in the absorbance spectrum o f 2.5 mL o f a 5x10~5 M solution o f Ligand / in THF, with 20 pL o f morpholine, upon addition o f aqueous (a) I AC-10 4, (b) NaC/O4, with fin a l concentrations o f 0.1 (1), 10'- M (2), 10-3 M (S), JO-4 M (4), 10-5 M (5), J0~6 M (6) 0 M (7) and (c) KCIO4, with fin a l concentrations o f , 4x10⁻³ m 2 x J0 '3 M (2), J0~3 M (3), 10-4 (4) jq - 5 m(5), JO' 6 M (6), See Table 2.1.
U pon addition o f m orpholine to the ligand solution, a very slight colour change was observed indicating that the bulk o f the ligand rem ained in the protonated
form. U pon addition o f the m etal perchlorates a clear yellow colour was im m ediately observed, w ith the intensity o f the colour being dependent on the
concentration and nature o f the perchlorate added. From the U V -V is spectra in Figure 3.3 it can be seen that a Amax for the protonated form o f this ligand exists at 350 nm, w ith an extinction coefficient (e) o f 11400 L m ol'1 cm-1. The absorbance at this w avelength decreases w ith increasing concentrations o f lithium and sodium perchlorate w hich coincides w ith an increase in absorbance at 424 nm. This w avelength corresponds to the deprotonated AInax for the com plexes o f all three metals. Isobestic points are observed at 390 nm for all three complexes indicating the presence o f two absorbing species in equilibrium with each other [12], Since the same wavelength m axim a exist for all three com plexes, it
indicates that lithium , sodium and potassium interact with the ligand in a similar
m anner w ith no significant differences existing in the excited states o f the
53

different complexes, as this would result in a slight shift in the Xmax of the complex. This is the case with the neutral chromoionophores in which the chromogenic moiety is sited either within or in close proximity to the ionophoric cavity [13], or with ionisable chromoionophores such as Ligand 4 to be discussed here, where the dissociating phenol makes up part of the hydrophilic cavity. Inclusion of a cation results in an electronic disturbance which propagates through the whole n and n systems, with variations in the extent of interaction between different cations resulting in variations in the resulting A.max of the complexes formed.
A comparison of the response of the ligands to lithium, sodium and potassium is shown in Figure 3.4, where a graph of absorbance at 424 nm versus log [metal perchlorate] is drawn.
Log[MC104]
Figure 3.4:- Comparison o f absorbance at 424 nm o f the lithium, sodium and potassium metal complexes o f Ligand 1. Data from Figures 3.3(a), (b) and (c).
From this graph it can be seen that a superior response to the presence of lithium compared to sodium is achieved, with practically no response to potassium attained prior to the addition of 4 mM potassium. A detection range of 1 0 ' 4 to 10’ 2 M and a limit of detection (L.O.D.) of c. 6xl0 ' 5 M is obtained for lithium. With sodium a linear range between lO- 4 and 10' 2 M is also observed. However, a much reduced slope is seen in this range. The slope for the lithium response in
54

this region is 0.325 a.u./dec. compared to 0.178 a.u./dec. for sodium. This in effect means that small changes in lithium concentration in this range will cause larger colour/spectral changes than similar changes in sodium concentration. The lithium curve suggests a slight levelling off effect or a decrease in slope above 10' 2 M, whereas the slope of the sodium response curve increases above 1 0 ‘ 2 M.
Ligand 1 exhibits practically no response to potassium prior to the addition of 2 mM KC104. The minimal solubility of KC104 in water precluded an examination of a KC104 concentration above 4 mM. A maximum of 0.1 M KCIO4 could be dissolved in water, compared to the possibility of making 5 M solutions of both lithium and sodium perchlorate. Thus to obtain a final lithium perchlorate concentration of 0.1 M in a 2.5 mL solution of ligand the required volume of 5 M LiC104 was 50 fiL, which constitutes less than a 2% overall volume increase. To obtain even a 10- 2 M KC104 final concentration in 2.5 mL of ligand solution 0.25 mL would be required and this is equivalent to a 10% change in volume. Such a large introduction of an aqueous solution is likely to generate numerous problems which would render the data obtained difficult to compare with the data for LiC104 or NaC104.
• Firstly the combined H 2 0/THF solvent would be more polar than THF on its own and therefore a A.max shift would be inevitable.
• Secondly as the nature of the solvent would have been altered, the pKa of the base (morpholine) along with the overall polarity of the solvent will be enhanced and thus deprotonation of the phenolic moieties of the chromophore would be increasingly favoured.
Control experiments carried out as above, with the exception that the same volume of water used to obtain 2xl0 ‘ 3 and 4x l0 - 3 M i.e. 0.050 and 0.100 mL, was added in place of KCIO4 , showed an absorbance at 424 nm of 0.210 and 0.274 a.u. respectively. Therefore, part of the response seen for K+ especially in Spectrum (1) o f Figure 3.3 (c) is due to an enhanced proton exchange environment arising from the increase in the percentage of water. Therefore the point due to 4x1 O' 3 M KC104 cannot be seen as being entirely due to the occurrence of K+ complexation but is due in part to solvent environment changes, as the volume of water added to obtain this point is much larger than any of the others. Despite these complications, it is clear that the overall order of response for Ligand 1 in these initial screening experiments is Li+ > Na+ > K+.
55

The follow ing spectra w ere obtained with 7xl0*5 M Ligand 2 and 0.2 M m orpholine w ith the metal perchlorate concentrations again being varied from 10'6 M to lO^M . The spectra obtained for the response to lithium, sodium and potassium are shown in Figure 3.5 (a), (b) and (c) respectively.
3.4.2 Ligand 2 ,Monochromogenic Ligand
pree DeprolonatedProtonated Ligand Complex
Figure 3.5 (a) :-Ligand 2j lithium response.
56

Free DeprolonaledProlonated Ligand Complex
F igure 3.5 (b):- L igand 2j sodium response.
F igure 3.5 (c):- L igand 2, potassium response.
F igure 3 . 5 One-phase investigation o f changes in the absorbance spectrum o f2.5 m L o f a 7x1 O'5 M solution o f L igand 2, in THF, with 45 fiL o f morpholine, upon addition o f aqueous (a) IJC 104, (b) N a C l0 4, with fin a l concentrations o f 0. ! (I), iO' 2 M (2), IO-3 M (3), I(H M (4), 10~5 M (5), 10~6 M (6), 0 M (7) and (c) K C104 with fin a l concentrations o f 4x1 O' 3 (1), 2x1 O’ 3 M (2), 10~3 M (3), 10~4 M (4), I O'5 M (5), 10-6 M (6), See Table 2.1.
57

The bulk of Ligand 2 remains in the protonated form upon addition of morpholine. This is observed as a very slight colour change to barely yellow, with deprotonation again occuring upon complexation with the metal cations. Deprotonation upon complexation is signalled by a colour change from colourless to yellow with intensity being dependent on metal perchlorate concentration. This is witnessed in the UV-Vis spectra as an increase in absorbance at the deprotonated complex A.max of 424 nm. An isobestic point is observed at 375 nm. The actual absorbance values for Ligand 2 compared to those for Ligand 1_ are lower due to the presence of only one chromogenic group in Ligand 2 compared to the four of Ligand 1. However, the cation induced deprotonation observed for Ligand 2 is indicative of one deprotonation being sufficient for the effect to be observed.
Figure 3.6 shows a comparison of the absorbance at 424 nm for varying concentrations of the three metal perchlorates. Again superior cation uptake is observed for lithium perchlorate. The response curves observed for Ligand 2 with Li+ and Na+ are quite similar to those observed for Ligand 1. There is a rapid increase in intensity observed after 10' 4 M LiC104 has been added.
However, the response levels off more quickly with this ligand after the initial large increase in intensity above 10- 3 M. This levelling off in intensity is a possible indication of complete ligand deprotonation or ligand saturation. Looking more closely at spectrum 1 in Figure 3.5 (a) it can be seen that the absorbance at the protonated A,max of 350 nm has depreciated to such an extent that it is now the lowest point o f a trough. The possibility of a further decrease in intensity appears to be quite unlikely. Since the absorbance at this level of LiC104 is less than 0.05 a.u. This enables e to be estimated to be 8166 L mol' 1
cm ' 1 , if the concentration of deprotonated ligand at this concentration is estimated to be 6 x 1 0 ' 5 M.
With NaC104 (Figure 3.6) no major change in absorbance occurs before 10- 3 M NaC104 is reached and again the change in absorbance is largest between 10‘ 2
and 1 0 ' 1 M NaC104 indicating a difference in the maximum response region for both cations. From both Figure 3.6 and 3.5 (b) where a levelling off o f the response to Na+ is not evident at 350 nm, it would appear that saturation point has not been reached between the ligand and Na+ at an NaC104 concentration of 0.1 M, but that the system may tolerate a further increase in NaC104
concentration. The LOD for the Li+ complex is c. 6xl0 - 5 M and for the Na+
58

complex c. 10' 4 M. The preferential order o f cation uptake is again Li+ > Na+ > K+.
Log [MCIO4]
Figure 3.6:- Comparison o f the spectral response at 424 nm o f each o f the lithium, sodium and potassium metal complexes o f Ligand 2. Data obtained from Figure 3.5 (a), (b) and (c).
3.4.3 Ligand 3 (Cjg) One Phase UV-Vis Examination.
Ligand 3, a tetra-chromogenic ligand which possesses Cjg groups in the para position of the calixarene as opposed to the tert-butyl groups which are contained in Ligands 1 and 2 was examined as before for cation induced UV-Vis spectroscopic changes. 0.1 M morpholine in 2.5 mL of 5x l0 - 5 M ligand was found to be the optimum base concentration. The following spectra were recorded for metal perchlorates of lithium and sodium in the concentration range 10' 1 to 10- 6 M, (Figure 3.7 (a), (b) and (c)).
59

Free DeprotonatedProtonated Ligand Complex
l . BAD IBÎ1 -4“ 1 . Z c 1 . 0
2ö. B<■0.6□M 0 - 4
Œ0 - 2 B. 5 B0 B 0 0
Navel ength C n m )70 0
—1B004BB
Figure 3.7 (a):- Ligand 3, lithium response.
700 B00
Figure 3.7 (b):- Ligand 3, sodium response.
60

Free DeproionatedProtonated Ligand Complex
F igure 3 .7 (c):- L igand 5, potassium response.
F igure 3.7:- O ne-phase investigation o f changes in the absorbance spectrum o f2.5 mL o f a 5x10~5 M solution o f L igand 3, in TH F with 20 /jL o f morpholine, upon addition o f aqueous (a) L iC l0 4, (b) N a C l0 4, with fin a l concentrations o f 0.1 (I), I O'2 M (2), 10 ' 3 M (3), 10-4 M( 4) , JO’ 5 M (5), I0 ' 6 M (6), 0 M (7) an d (c) K C I0 4 with f in a l concentrations o f 4x1 O' 3 (I), 2x1 O' 3 M (2), I O'3 M (3), 10-4 M (4), 10~5 M (5), 10~6 K4 (6), 0 M (7), 0 M an d 0 M morpholine (8) see table 2.1.
The protonated Pimax o f this com pound appears at 350 nm, (s = 2.16 x 10⁴ L m ol'1 cm '1 ), w ith the deprotonated com plex Xmax occuring at 424 nm. The absorbance at this w avelength increases upon addition o f increasingly m ore concentrated
solutions o f m etal perchlorates. A n isobestic point occurs at 380 nm. The same Amax o f 424 nm occurs for the com plexes o f all three cations.
A com parison o f the responses o f 424 nm for the different cations in the concentration range o f 10'6 M to 10_1 M is seen in Figure 3.8. From this curve it can be seen that Ligand 3 responds m ost favourably to the presence o f lithium perchlorate. An L.O .D . o f c. 3 x 10~5 M was obtained for LiC104 com pared to
that o f 7 x 10’4 M for N aC104. A large increase in absorbance is observed betw een 10*4 M and 10'2 M LiC 104 before a levelling o ff is seen. The greatest change in absorbance occurs betw een 10‘4 and 10-3 M w here a slope o f 0.9
a.u./dec. is observed. For N aC 104 a substantial absorbance change is not observed prior to the addition o f 10"3 M N aC 104 indicating a different linear range for these tw o cations. Saturation is again observed for the LiC104 curve
indicating com plete ligand deprotonation and a m inim um e o f 3.70 x 10⁴ L
61

m ol'1 cm '1 was estim ated, for a deprotonated com plex com plex concentration o f 5 x 10 '5 M. There is a difference o f approxim ately 1 a.u. betw een Li+, and N a+ at
10"3 M M C104 w hich indicates that the ligand has the ability to distinguish
betw een the two cations at this concentration level.
The N aC104 response curve has obviously no t reached saturation point but from the depth o f the trough at the protonated Amax o f spectrum 1 o f Figure 3.7 (b) it w ould appear to be close to it. The largest absorbance change occurs for the N a+ com plex betw een 10_2 and 10_1 M, w ith the final absorbance w ith 10_1 M N aC 104 approaching the same value observed for 10_1 M LiC104
There is a slight change in absorbance for the K C104 com plex betw een 2 and 4
m M K C104, and this is seen in the low est curve o f Figure 3.8. H ow ever the intensity rem ains low er than for the N aC 104 com plex response at similar
concentrations and the ro le played by the changing nature o f the solvent cannot be discounted. N o change in the protonated Amax at 350 nm is observed in this K C 104 concentration range indicating poor selectivity for this ligand to K +. The order o f com plexation for Ligand 3 is therefore again the same as it was for
Ligands 1, and 2 o f Li+ > N a+ > K+.
Log[MC104]
Figure 3.8:-Comparison o f the spectral response at 424 nm o f each o f the lithium, sodium and potassium metal complexes o f Ligand 3. Data obtained from Figs. 3.7 (a), (b) and (c).
62

3.5 Selectivity Coefficient Determination
A fter the establishm ent o f preferential lithium uptake by all three ligands the next
phase o f the w ork w as to determ ine selectivity coefficients for Li+ over N a+.
These values w ere determ ined using M ethod 2.3.2 by exam ining the spectral response o f LiC104 from 10-6 M to 10_1 M as before, except this time fixed
background concentrations o f the interferent were also included. Fixed interfering N aC 104 concentrations o f 10-2 and 10'3 M were exam ined. 0.1 M N aC104 w as also exam ined as the interfering cation concentration for the determ ination o f a selectivity coefficient for lithium over sodium. However, the absorbance o f the ligands in the presence o f 0.1 M N aC104 is quite sim ilar to that o f the ligands in the presence o f 0.1 M LiC104, and this is clearly seen in Figures 3.4, 3.6 and 3.8. So in effect this concentration o f sodium com pletely swam ped the response o f low er levels o f lithium and hence no selectivity coefficient could
be determ ined.
Figures 3.9 (a), (b) and (c) show the interference study graphs o f absorbance at
the deprotonated com plex Amax o f Ligands 1, 2 and 3 respectively in the presence
o f 10-2 M and 10‘3 M N aC 104.
Log [LiC104]
F igure 3 .9(a):- L igand I selectivity
63

Log[LiC104]
Figure 3.9 (b):- L igand 2 selectivity
Log[LiC104]
Figure 3.9:- L igand3 selectivity
F igure 3.9:- One-phase studies o f the optical response of: (a) 5x1 (h5 M Ligand / in THF with 20 pL morpholine, (b) 7x1 O'5 M Ligand 2 in THF with 45 fiL morpholin, (c) 5x 1 O'5 M Ligand 3 in THF with 20 pL morpholine - to additions o f L iC l0 4 in the presence o f fixed (10'2, 10~3 M ) concentrations o fN a C l0 4, see M ethod 2.3.2.
64

From these data approxim ate selectivity coefficients (K y Na) were calculated from the intercept betw een the lithium response curve and the sodium
interference curves via the expression Na ^ N a ^ L i ani* are shown in table 3.1.
Table 3.1:- Selectivity Coefficients for Ligands 1,-3
L igand [Na+] / M K l .¡Na1 10-2 25.11 10-3 11.22 ¡O'2 34.7
2 10-3 14.7
3 10-2 43.13 IQ'3 23.2
There is very little difference in selectivity coefficients betw een the mono and tetra chrom ogenic ligands bearing tertiary butyl groups in the para position,
(Ligands 1 and 2 respectively). A slight enhancem ent o f selectivity is observed
for the tetrachrom ogenic ligand, Ligand 3, w hich bears C 18 groups in the para
position o f the phenolic calixarene backbone. D ue to the difficulties in defining
accurately the straight line portions o f the curves in this type o f diagram (and
hence the intercept), it is difficult to estim ate selectivity precisely. However, it does give an approxim ate quantification o f the relative affinity o f the ligands with these ions. All three ligands show slight selectivity for lithium over sodium in
the same order o f m agnitude.
3.6 Solvent V ariation
The effect o f solvent variation on the U V -V is spectra o f the deprotonated com plex and protonated forms o f Ligand \ was exam ined to gain an insight into
the types o f electronic transitions involved in generating the spectra. M ethod2.3.5 was follow ed w ith the solvent being varied from 100% THF to 100%
m ethanol. A hypsochrom ic shift o f 16 nm was observed on going from THF to
m ethanol, see Figure 3.10(a) and (b). Figure 3.11 shows a com parison o f the
intensity achieved over the LiC104 concentration range at the Xmax o f
65

deprotonated complex in both solvents. As well as a Amax shift with increasing polarity, (dielectric constants for THF and methanol at 20° C are 7.6 and 32.63 respectively) [3], it was also noted that a stronger yellow colour was observed with the addition of morpholine, in the absence of any metal perchlorate and this is seen clearly in spectrum 3.10(b), traces (7) and (6 ) which are spectra of the ligand in the absence and presence of morpholine respectively, without any metal. This is indicative of a greater proportion of the ligand being in the deprotonated form (equtaion 3.1) and that the lipophilic base, morpholine, has a lower pKa in this solvent than it had in THF. Only above 1 0 _3 M LiC104 is a more intense peak observed than that achieved with the ligand and base.
66

1- rcc UcprotonalcdProtonated Ligand Complex
F igure 3 .10 (a)'.-Ligand 7 in 100% THF
F igure 3 .10 (b):- L igand 7 in 100% M ethanol.
F igure 3.10:- UV-Vis spectra o f 5x1 O' 5 M L igand 7 and 0.1 M morpholine in (a) THF, with 10' 1 M (1), JO'2 M (2), 10 '3 M (3), 10'4 M (4), 10'5 M (5), 10'6 M (6), 0 M (7), and (b) m ethanol with lO' 1 M (I), 1 O'2 M (2), 1 0 3 M (3), 10 4 M (4), 1 0 5
M (5), 0 M (6), 0 M an d 0 M m orpholine (7), See table 2.1 fo r details.
67

1.2
x03
rCtJD13£
0.8
0.6
cn<:
0 4
0.2
-5 -4 -3
Log [LiC104]-1
F ig u re 3 .1 1 '.-Comparison o f the spectral response o f L igand 7 to changes in L iC l0 4 concentration in TH F (424 nm) and M eO H (408 nm),with data taken fro m F ig 3.10(a) an d (b) respectively.
3.7 N M R Com plexation Studies
To confirm that com plexation o f the ligand w ith the m etal cation was occurring in the absence o f colour generation, as outlined in equation (3.1)
L-CO H + M + LM +-COH (3.1)
N M R com plexation experim ents were carried out. Sodium thiocyanate was used
as the com plexing salt and M ethod 2.3.6 was followed. Calix[4]arene tetraesters o f the type used in this study undergo several very characteristic changes in proton chem ical shifts on com plexation w ith alkali metal cations [14-16],
Figure 3.12 shows a series o f N M R spectra obtained by Arduini et al. [16], dem onstrating the effect o f sodium com plexation w ith a i-butyl calix[4]arene tetra-i-butyl ester 3(vi) w hich is in a rigid cone conform ation in solution. Two
features are very im portant w ith cone shaped p - t-butyl calix[4]arenes. These are
the tw o sets o f 4H doublets associated w ith the non-equivalence o f the bridging
m ethylene protons H A and H B o f the calixarene annulus (see structure 3(vii)),
X THF (424 nm)
D MeOH (408 nm)
6 8
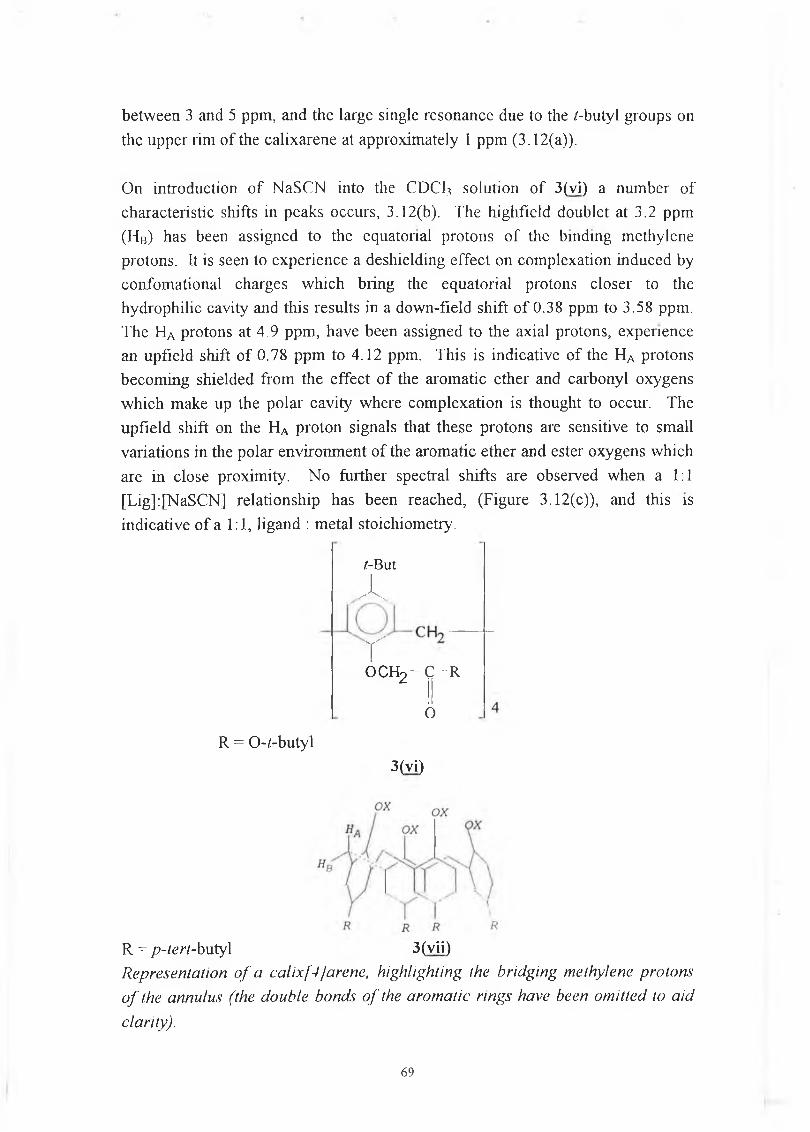
betw een 3 and 5 ppm, and the large single resonance due to the /-butyl groups on
the upper rim o f the calixarene at approxim ately 1 ppm (3 .12(a)).
On introduction o f NaSCN into the CDCl.i solution o f 3(vi) a num ber o f
characteristic shifts in peaks occurs, 3.12(b). The highfield doublet at 3.2 ppm (H b) has been assigned to the equatorial protons o f the binding m ethylene protons. It is seen to experience a deshielding effect on com plexation induced by confom ational charges w hich bring the equatorial protons closer to the hydrophilic cavity and this results in a dow n-field shift o f 0.38 ppm to 3.58 ppm. The Ha protons at 4.9 ppm, have been assigned to the axial protons, experience an upfield shift o f 0.78 ppm to 4.12 ppm. This is indicative o f the HA protons becom ing shielded from the effect o f the arom atic ether and carbonyl oxygens w hich m ake up the polar cavity where com plexation is thought to occur. The
upfield shift on the HA proton signals that these protons are sensitive to small
variations in the polar environm ent o f the arom atic ether and ester oxygens which
are in close proxim ity. N o further spectral shifts are observed w hen a 1:1 [Lig]:[NaSCN] relationship has been reached, (Figure 3.12(c)), and this is
indicative o f a 1:1, ligand : m etal stoichiometry.
/-But
X
ro c h 2 - c - r
o
R = 0 -/-b u ty l
3(vi)
R = p -iert-butyl 3(vii)Representation o f a calix[4]arene, highlighting the bridging methylene protons
o f the annulus (the double bonds o f the arom atic rings have been om itted to a id
clarity).
69

TMS
<•)
JLl t I I I I 1 « i I » « « j « « I- 1 I I I I 1 I 1 L » I j j 1 JL-J- * 1 I 1 I I 4 1. 1 I j I 1 -i 1 1 1 t I i I t 1 1 J J I 1 I I I I I J « i. I 1
7 0 5 4 3 2 1 0
Figure 3.12:- Encapsulation o f NaSCN by 3(vi). lH NM R spectra (200 MHz) in CDCl3 at 25° C: (a) = free ligand; (b) = 4 0 % complex; (c) = 100 % complex;
[Ligand]cdci3 = 5 x 10'2 M, [16].
70

Ligands 1. to 3_are believed to possess the cone conform ation 3(viii) in which all
four arom atic rings are pointing in the same direction in solution since their
im m ediate precursors, viz. acid chlorides 3(ix) and 3(x) are know n to have this
conform ation, and the N M R spectra in Figure 3.13 confirm this for Ligand 1.
3(v|ii)3-dim ensional representation o f a calix[4Jarene in the cone conform ation
/-But
c h 2
/-But
CH.JC1L T ^ yOCHoCOEt O C H o - C - C l
II IIo O
3(ix) 3(x)R = ButR = (CH2) 17CH3Structures o f the a c id chloride precursors to the chrom ogenic calix[4]arenes.
Figure 3.13 shows the spectra obtained w ith Ligand 1 in (a) the absence o f metal cation and (b) in the presence o f a 1 mole equivalent o f NaSCN. From these spectra, it appears that Ligand 1. is a distorted cone in solution since the !H N M R spectrum reveals a cluster o f peaks at betw een 0.84 and 1.33 ppm for the /-butyl
groups o f the upper rim. A com pletely sym m etrical m olecule would have yielded
only one signal for the /-butyl groups, as was the case if Figure 3.12 (a). An x-
ray crystal structure o f a distorted cone conform ational tetraam ide, 3(xi), is
71

shown in structure 3 (xii), [17], In this free ligand two opposite arom atic rings
(A, C) are alm ost parallel to each other, and the other two (B, D) are alm ost
perpendicular. This non-sym m etrical arrangem ent renders the /-butyl groups o f the para position o f the upper calixarene rim, non-equivalent. The splitting o f the /-butyl resonance is seen for Ligand _1 in Figure 3.13(a) at approxim ately 1 ppm. Prelim inaiy m olecular m odelling using H yperchem 3(xiii) corroborates this finding. The bond distances betw een A and C was estimated to be 5.31 A, w hereas the bond distance betw een B and D was estim ated to be 9.25 A.
Calix[4]arene tetraam ide 3(xi), and an x-ray crystal structure o f this com pound ,
3(xii), [17].
3(xi) 3(xii),
72

3(xüi)M olecular M odel o f L igand ¿ u s in g Hyperchem *
* Molecular Modelling performed by P. Kane at D.C.U.
Light Blue = C-C Bonds Red = Oxygen Atoms Dark Blue = Nitrogen Atoms
On addition of NaSCN to Ligand 1 the cluster of signals at approximately 1 ppm is replaced by a single resonance at 1.20 ppm, (Figure 3.13(b)). This simplification in the signal to a singlet is synonomous with complexation of the cation conferring a more ordered symmetry on the molecule, in which all of the t- butyl groups are in a similar environment. On complexation, the carbonyl oxygen atoms form part of a rigid polar cavity encapsulating the metal-ion whereas with the free ligand, the pendent groups are much more mobile, while the macrocycle itself adopts a 2 -in/ 2 -out conformation in which the in/out groups are dynamically changing [17].
The NMR spectrum(Figure 3 .13(a)) shows a number of complex signals between 3 and 6 ppm, the region in which the characteristic HA and H0 signals
73

would be expected to lie. At 3.2 ppm the identification of a HB doublet is difficult as it would appear that signals from at least one other set of protons is occurring here. However, upon introduction of NaSCN, both a shift in these peaks to 3.4 ppm and a simplification of the signal is observed. As this is the region in which the equatorial proton HB would be expected to appear this gives some indication that the inclusion of a cation has the effect of perturbing the positioning of the HB proton in relation to the aromatic-ether and ester oxygens of the hydrophilic cavity and thereby deshielding it. Similarly, it is equally difficult to assign a doublet to the axial HA protons. A set of peaks at 4.5 ppm in Figure 3.13 (A) is seen to shift to 4.3 ppm upon interaction of 1 mole equivalent of NaSCN, and this could possibly be as a result of some shielding of the HA proton, similar to that observed in Figure 3.12 by Arduini et al. [16], Although these assignments are only tentative, it is clear from the two spectra that the introduction of NaSCN causes a change in the environment o f many of the protons of this ligand. The most convincing piece of evidence for cation inclusion was the simplification of the signals for the /-butyl hydrogens discussed above which indicated a more ordered symmetry for the molecule after complexation.
It must be noted that during these 'H NMR experiments no colour change was observed, indicating that complexation occurs in the absence of base and thus without deprotonation and that the equilibrium in (3.1) is effectively being forced to the right. This lack of of colour/spectral change when complexation occurs in the absence of morpholine is indicative of the deprotonation of the nitrophenol being a prerequisite for colour generation. A colour change is observed only if a suitable base is available for the uptake of the phenolic proton or if the equilibrium in (3.3) is forced to the right. No further spectral shifts were observed after a 1 mole equivalent of NaSCN had been added and therefore it can be deduced that a 1:1 stoichiometry for the NaSCN with Ligand 1 exists and that equation (3.1) favours the right hand side. Other changes in the position of the aromatic protons upon complexation are consistent with data from other studies with calixarene esters [14].
74

l-But( a )
8.0 7.0 6.0 5.0 4.0 3.0 2.0 1.0 0.0S
Figure 3.13:- 'H NMR spectra o f the free and complexed form o f Ligand ¿ in CD Clj at room temperature: (a) [NaSCN]/[l] = 0; (b) [NaSCN]/[lJ = 1; where [ y = 5x¡O -3 M in CDCl ? An aliquoí from 1.0 M solution o fN aSC N in C D 30D was added directly lo a CDCl3 solution o f l in an NMR tube. p-tertbutyl H; HA , a n d H b. = A rC H 2Ár. See table 2.2.
75

3.8 Two Phase Studies
On introducing a second, (aqueous), phase of deionised water into the system, it is imperative from a sensor point of view that conditions are optimised so that partition coefficients for the base and all forms of the chromogenic calixarene (complexed, complexed and deprotonated, uncomplexed) greatly favour the organic phase, as leaching of the membrane components into the aqueous phase leads to poor sensor response characteristics. A transfer of metal ions from the aqueous to the organic phase is however required. The system involves a number o f equilibria with the partition coefficient of the deprotonated complex determining the extent to which the coloured species enters the aqueous phase.
TDDA, which is a more lipophilic base than morpholine, was used in the two phase work in order to maintain the base in the organic phase, thus reducing the tendency of the base to partition out into the aqueous phase and ensuring that the deprotonation of the nitrophenol group would occur in the organic phase. Method 2.3.5 was followed for the two phase examination of the ligands. The organic phase used was butan-l-ol, and the choice of this solvent will be described in Chapter 4, with the nitrophenylazophenol ligands. The ligands at concentrations of 5xl0 ' 5 M were dissolved in this organic phase, along with 20 pi, of TDDA. Upon addition of 2.5 mL of water to the system (without metal perchlorates), the formation o f a faint yellow colour at the interface of the water and the butan-l-ol was observed which is indicative of the deionised water (which has a much higher dielectric constant than THF) being able to support the existence of the ions formed and hence favour ligand deprotonation.
Upon addition of the metal perchlorates to the aqueous phase, an increase in colour intensity was noted in the organic phase at the higher lithium perchlorate concentrations. This colour change was monitored by UV-Vis spectroscopy with an absorbance maximum being noted at 420 nm and an isobestic point at 350 nm, (Figures 3.14 (a) and (b) for ligands 1. and 2 respectively). This strongly suggests that the metal perchlorate has been taken up from the aqueous phase and the Li+ ion has complexed with the calixarene.
With both ligands 1 and 2, a transfer of colour due to the deprotonated complex into the aqueous phase was noted at lithium and sodium perchlorate concentrations o f 10' 1 to 10' 3 M, with the yellow colour diffusing into and throughout the aqueous layer within minutes of addition of the LiC104 and
76

subsequent settling out o f the two layers. UV-Vis spectra of the yellow aqueous phase gave peaks at 420 nm up to 80% the size of those obtained for the organic layer for ligand 3 (Figure 3.15(b)) and up to 20% for ligand 1, (Figure 3.25(a)) with measurements being taken 15 minutes after the addition of the LiC1 0 4
suggesting that significant leaching of the deprotonated complex into the aqueous phase was occurring. In contrast to calix[4]arene esters which are extremely water insoluble, the movement o f colour due to the complexed form of the molecule into the aqueous phase was surprising. The zwitterionic nature of the deprotonated complex, is probably an important factor influencing the transfer of colour from the organic to the aqueous phase, as the deprotonated complex possesses positive charge centred on the metal ion in the cavity, and a negative charge at the deprotonated nitrophenol chromophore, see structure (3(xiv)).
3(xiv)M olecu lar M odel o f L igand 1 using H yperchem *
Light Blue = C-C bonds Red = Oxygen atoms Dark Blue = Nitrogen atoms
* Molecular Modelling performed by P. Kane at D.C.U
77
The variable solubility of these ligands is of some interest, as most calixarenes are very water-insoluble, even when complexed with a cation. An examination of a two phase system was carried out as above using 10~2 M LiC104 in the absence of the base TDDA. UV-Vis spectra were taken of both phases after 24 hours and it was found that none of the protonated complex had transferred to the aqueous phase. This demonstrates the importance of the deprotonation of the chromophore in determining overall solubility.
However, with Ligands 1 and 2, it seems that the aqueous solubility can be dramatically altered, for example by variation of the pH of the aqueous phase. This was demonstrated with Ligand 1 by using 2.5 mL of 1 M HC1 as the aqueous phase, in contact with 2.5 mL of an organic butanol phase, which contained TDDA, and the ligand-Li+ complex. No colour transfer was noticed and a spectrum of the aqueous phase showed peaks for neither form of the ligand after 1 hr, (see Figure 3.16), as the complex would be predominantly in the protonated form at the aquo-butanol boundary and would hence remain insoluble in the aquo-phase. Any reprotonation of the aquo-butanol interface may also have resulted in a certain degree of decomplexation of the ligand, with the metal entering the aqueous phase.
Another experiment was carried out in which a typical two phase experiment was carried out with lO' 2 M LiC104 added to the aqueous phase and after mixing of the two layers to generate the deprotonated complex in the organic phase HC1 was added to the bottom aqueous phase to make it 10' M m HC1 . Any colour which had traversed the organic/aqueous phase disappeared from the aqueous phase. On examination of the spectrum of the aqueous phase the presence of protonated ligand was found, with no trace of any of the deprotonated complexed ligand, (see Figure 3.17). This means a mode of conferring a certain degree of water solubility on these calixarenes has been obtained. Water soluble calixarenes are o f interest because of their ability to interact with ions and molecules and to perform catalysis [ 1 ],
This type of pH or ion dependent solubility raises interesting possibilities for switching ion or ligand transport between phases. As deprotonation of these calixarenes is also a function of the electrochemical environment (the nitrophenol groups can be readily oxidised-reduced, and have well-defined voltammetric behaviour [18]), phase transport could in principle be controlled by means of an externally applied potential or as was demonstrated here by pH variation.
78

Free DcprotonaiedProtonated Ligand Complex
0 . 93 b . b
* 0. ? wai 0 B
jj“ * -*-0. 3
£ 0.1B . 0
- < 7 )1 - -— 1— ■ * 1— —— - . - —. ì
4 0 0 5 B B E B B 7 0 0 6(30_____________ Ha velengthCnni?______ ___________ ______________
Figure 3.14 (a):- Two-phase Ligand 7, organic phase.
i . Br\3 1 . 4 IT <_• 1 - £ 01£i 1 - BSo- b£ b - EE0- 4£ 0.2
0. 04 0 0 5 0 0 EBB
W a v e ! B n g t h C r m J7 0 0
i mB 0 0
Figure 3.14 (b):-Two Phase Ligand 2 , organic phase.
79

Free DeprotonatedProtonated Ligand Complex
Figure 3.14 (c):- Two-phase Ligand 3, organic phase.
Figure 3.14:- Two-phase studies showing changes in absorbance spectrum o f the organic (butan-J-ol) phase fo r 5x1 O' 5 M (a) Ligand ±, (b) Ligand 2 and (c) Ligand 3, with 20 ¡jL ofTD D A, when LiClG 4 was added to the aqueous phase o f the two-phase system to give the follow ing aqueous-phase concentrations: 0 . 1
(1), JO- 2 (2), 10- 3 (3), JO- 4 (4), JO- 5 (5), JO- 6 (6), 0 M (7). See method 2.3.5.
Figure 3.15(a):-T w o-phase L igand / aqueous phase.
80

Free DcprotonatedProtonated Ligand Complex
Figure 3.15(b):- Two-phase Ligand 2 aqueous phase.
Figure 3.15(c):- Two-phase Ligand 3 aqueous phase.
Figure 3.15:- Two-phase studies showing changes in absorbance spectrum o f the aqueous- phase fo r 5x1 O' 5 M (a) Ligand 7, (b) Ligand 2 and (c) Ligand 3, with 20 /uL ofTD D A, when L iC l0 4 was added to the aqueous phase o f the two-phase system to give the fo llow ing aqueous-phase concentrations: 0.1 (I), ¡O' 2 (2), 10' 3
(3), 10- 4 (4), 10- 5 (5), 10- 6 (6 ), O M (7). See method 2.3.5.

Figure 3.16:- Spectrum o f the aqueous phase o f a 2 phase experiment which was carried out by carefully adding 2.5 mL o f a solution which was 5x1 O' 5 M in Ligand I O' 2 M in LiC.l04 and 20 pL ofTD D A to 2.5 mL o f 1 M HC.I.
F igure 3.17:- Aqueous phase spectra, o f 2 phase experiments in which (1) 2.5 mL o f 5x1 O' 5 M Ligand 1_ and 20pL o fTD D A were mixed with 2.5 mL o f 10' 2 M L iC l0 4 (aq) and (2) where after the two phases had settled, HCl was added to the aqueous phase to give a fin a l HCl concentration o f 10'2 M.
82

However, for sensor applications involving the immobilisation of the ligand on a fibre optic cable, leaching of the complex into the aqueous phase is undesirable. In order to try and prevent or reduce this effect, a more lipophilic analogue (Ligand 3) bearing Cjg groups at the para position in place of the tert-butyl groups was investigated. Unfortunately, the waxy nature of the product arising from the C 1 8 groups precluded the generation of good crystals for confirmation of this molecular arrangement. However, the complexing ability, IR spectra, UV- Vis spectral changes on complexation and lack of aqueous solubility as described below is convincing evidence that the desired compound has been obtained.
Ligand 3 also demonstrated the ability to facilitate cation-transfer from the aqueous phase as illustrated in Figure 3.12c. In contrast to Ligands 1, and 2, no colour transfer from the organic (butan-l-ol) phase to the aqueous phase was noted even at the higher concentrations. From UV-Vis spectra of the aqueous phase at the three highest lithium perchlorate concentrations, peaks at 420 nm were observed with heights less than 5% of the corresponding organic phase peaks(Figure 3.15(c)). This suggests that the substitution of more lipophilic groups on the upper rim of the calix[4]arene for the /-butyl groups has the predictable effect of stabilising the molecule in an organic phase. Colour transfer into the aqueous phase was noticed after a few days indicating a slow, gradual leaching of the coloured complex from the organic phase.
83

The final ligand, Ligand 4, of the "nitrophenol" group of chromogenic calixarenes, was different from the previous three ligands in that the chromogenic nitrophenol group was actually part of the central calix[4]arene cavity, rather than a pendent arm as in the other ligands examined.
3.9 Ligand 4
3.9.1 Base Optimisation
A 5 x 10 _5 M solution of Ligand 4 in THF, in the presence of 10' 2 M NaC104
was used to examine the variation in absorbance at the deprotonated Xmax with varying morpholine concentration. A base concentration in the range 10' 5 to 10' 1
M was used. The optimum morpholine concentration for this system was found to be 6 x 10*2 M using the method described in Method 2.3.3.
3.9.2 Effect of Metal Ion Concentration Variation (Single Phase)
Method 2.4.1 was followed to examine the effect cation complexation had on the UV-Vis spectrum of this ligand. Figure 3.18(a) and (b) shows the spectra obtained with 5x l0 ' 5 M Ligand 4 when the LiC1 0 4 and NaC104 concentrations were incrementally increased from lO"6 M to 10* 1 M in the presence of 6x1 O' 2 M morpholine. Figure 3.18 (c) shows the response of Ligand 4 to KC104 in the concentration range of 10- 6 to 4x10 ‘ 3 M.
84

Visually, complexation is signalled by a colour change from colourless to yellow in the presence of morpholine. A very slight colour change to light yellow is
perchlorates . This again demonstrates that equilibrium (3.5) is primarily on the left hand side and that the pKa of the nitrophenol is too high for significant deprotonation by the base morpholine to occur at this point. The subsequent addition of the metal perchlorates initiates deprotonation and a colour change, through the effective lowering of the pKa of the nitrophenolic proton upon complexation with the metal ion.
From examination of the spectra of Figure 3.18 it becomes apparent that a fundamental difference in the behaviour of this chromoionophore compared to Ligands 1 to 3 exists. A variation in A.max is observed for the three different complexes. The deprotonated form of the Li+ complex [L(Li+)CO ] is seen at 416 nm compared to a Àmax of 430 nm for the deprotonated form of the Na+ [L(Na+)C O ] and K+ complexes. The A.max of the protonated complex of Ligand 4 exists at 330 nm which is 20 nm less than that of Ligands 1 to 3, and isobestic points are observed at 360 and 370 nm for LiC104 and NaC104 respectively This deviation in Xmax is possibly related to a number of factors, with the positioning of the nitro group in relation to the phenol group being of particular significance. In Ligand 4 as was stated earlier the ionisable phenolic group is para to the nitro group whereas ligands i to 3 it is in the ortho position. The nitrophenol chromophores have been found to show variations in Xmax i.e. para A,max 317.5, e
In Ligands I to 4 however, the aromatic chromogenic moiety is not simply di- substituted but they also have either one (Ligands 1 to 3) or 2 (Ligand 4) carbons of the aromatic rings occupied via their attachment to the calixarene backbone, which can also have an effect on the A.max of the chromogenic group.
observed when the morpholine is added prior to the addition of metal
= 10,000; ortho Xmax 350, e = 3,200, [19],
N02
Oi/zo-nitrophenol 3 (xv)
OH
Para-nitrophenol3(xvi)
85

Free DeprotonatedProlonaled Ligand Complex
Figure 3.18(a) .'-Lithium response with Ligand 4.
Figure 3.18(b):- Sodium response with Ligand 4
86

Free DeprotonatedProtonated Ligand Complex
Figure 3.18(c):-Potassium response with L igand 4
Figure 3.18:- O ne-phase investigation o f changes in the absorbance spectrum o f 2.5 mL o f a 5x1 O' 5 M solution o f L igand 4 w ith 6x1 O'2 M morpholine, upon addition o f aqueous (a) L iC l0 4, (b) N a C l0 4, w ith f in a l concentrations o f 0.1 (1), 10-2 M (2), 10 '3 M (3), 10-4 M (4), 10' 5 M (5), 10~6 M (6) and (c) with fin a l concentrations o f 4 x l0 '3M (1), 2xl0~3M (2), 10 ' 3 M (3), 10'4(4), 10-5 (5), 10~6 (6), 0 M (7), 0 M a n d O M TDDA (8). See table 2.1.
Another difference in the spectra stems from a spectroscopic change for much lower LiC104 and NaC104 concentrations. A comparison of the response of Ligand 4 to the presence of Li+, Na+, and K+ at the Xmax of each cation is shown in Figure 3.19. For both LiC104 and NaC104 there is a marked increase in absorbance between 10' 5 and 1(H M salt, with a change in absorbance of approximately 0.65 a.u. between these two concentrations. Above 10‘ 3 M there is very little further change in absorbance and a decrease is seen above 10' 2 M. For NaC104 the absorbance intensity again increases up to a concentration of 10- 3 M before it levels off and eventually begins to decrease after a concentration of 10‘ 2 M salt had been added. Another ^max shift is observed for the Na+ complex at 1 0 " 1 M to 436 nm. The actual form of the Li+ and Na+ curves is quite similar with a response to both of the cations occurring at the same concentration. A
87

limit of detection o f less than 10- 5 M MC104 exists (where M = Li or Na) indicating almost a 10 fold decrease in L.O.D. over Ligands I to 3 for Li+ and almost a 100 fold decrease in L.O.D. for Na+. Therefore this ligand at a concentration of 5x1 O' 5 M is much more sensitive to both cations. Either cation could therefore be detected in the absence of the other at concentrations between ~ 1 0 ' 5 and 1 0 ' 3 M.
This is unlike the situation observed with Ligands 1 to 3 where a response was seen initially for LiC104 above a concentration of 10’ 4 M but no substantial response was seen for NaC104 prior to the addition of 10- 3 M. Where an almost exponential increase in absorbance was then seen.
No clear selectivity can be seen for Ligand 4 between lithium and sodium from these response curves. However, it is clear from the curve for KC104 that in the concentration range examined there is virtually no detectable interaction between the ligand and K+. A slight decrease in absorbance is observed but the fact that a variation in baseline is attained at the different concentration levels does cause anomalies in the results and such a small decrease may be attributed to this baseline variation. The lack of an isobestic point may also be an indication of the lack of any equilibrium being set up between the ligand and the potassium salt.
Log [MC104]
F igure 3.19:- C om parison o f the absorbance at the Amax o f the lithium, sodium and potassium m etal com plexes o f L igand £ i.e 416 nm fo r L iC l0 4 and 430 nm
fo r N a C l0 4 an d K C 104, with data fro m F ig 3.18 (a), (b) and (c) respectively.
88

The difference in A,max between the L ir-C O ' and the LNa -CO' complexes opens up further possibilities of monitoring for different cations at different wavelengths. Figure 3.20 and 3.21 show the differences in response obtained when measurements for the presence of Li+ and Na were taken at 400 and 450 nm. At 400 nm a clear selectivity for Li+ over N af and K+ emerges, (Figure 3.20). These results suggest that it should be possible to use thischromoionophore for either Li+ or Na' analysis depending on the wavelength(s) monitored. Furthermore, it may be possible to simultaneously analyse both Na+ and Li+ by monitoring the wavelength regions where both dominate the absorbance spectrum. In contrast, Figure 3.21 shows that at 450 nm the Li+ response is negligible and a sharp increase in intensity is observed for Na+ between 10"5 and 10"3 M. Again K+ shows no substantial response at this level.
Log [MC104]
Figure 3.20:- C om parison o f the absorbance o f the lithium, sodium and potassium m etal com plexes o f L igand £ at 400 nm, with data fro m Fig 3 .18(a),
(b) and (c) respectively.
89

Log [MCIO4 ]
Figure 3.21:- Com parison o f the absorbance o f the lithium, sodium and potassium m etal com plexes o f L igand £ at 450 nm, with data fro m Fig 3 .18(a),
(b) an d (c) respectively.
3.9.3 Interference Studies
Interference studies were carried out in which fixed concentrations of either Na+ or Li+ were added to the solutions of the corresponding primary ions. Figure 3.22 shows the spectra of solutions of 10' 6 to 10_1 M NaC1 0 4 in the presence of a constant LiC1 0 4 background of 10' 3 M. Lithium would appear to be dominating the complexation process up to 10' 3 M with an absorbance maximum at 416 nm being observed from 10- 6 to 10' 3 M NaC104 Above 10' 3 M NaC1 0 4 sodium becomes the predominant species of uptake by the ligand with a shift in A.max to that o f the sodium complex (430 nm). Again the 0.1M Na+ sample shows a further bathochromic shift to 436 nm.
When a constant background of Na+ in the presence of a varying concentration of Li+ primary ion is examined (Figure 3.23) for standards from 10- 6 to 10- 4 M LiC104 the spectrum is the characteristic spectrum of a 10' 3 M solution of NaC104, however above this lithium concentration the compound would appear to be oblivious to the presence of Na+ and responds solely to the higher concentrations of Li+ with a shift to the lithium complex A.max at 416 nm A complete exchange of Na+ for Li+ would have appeared to have occurred in the
90
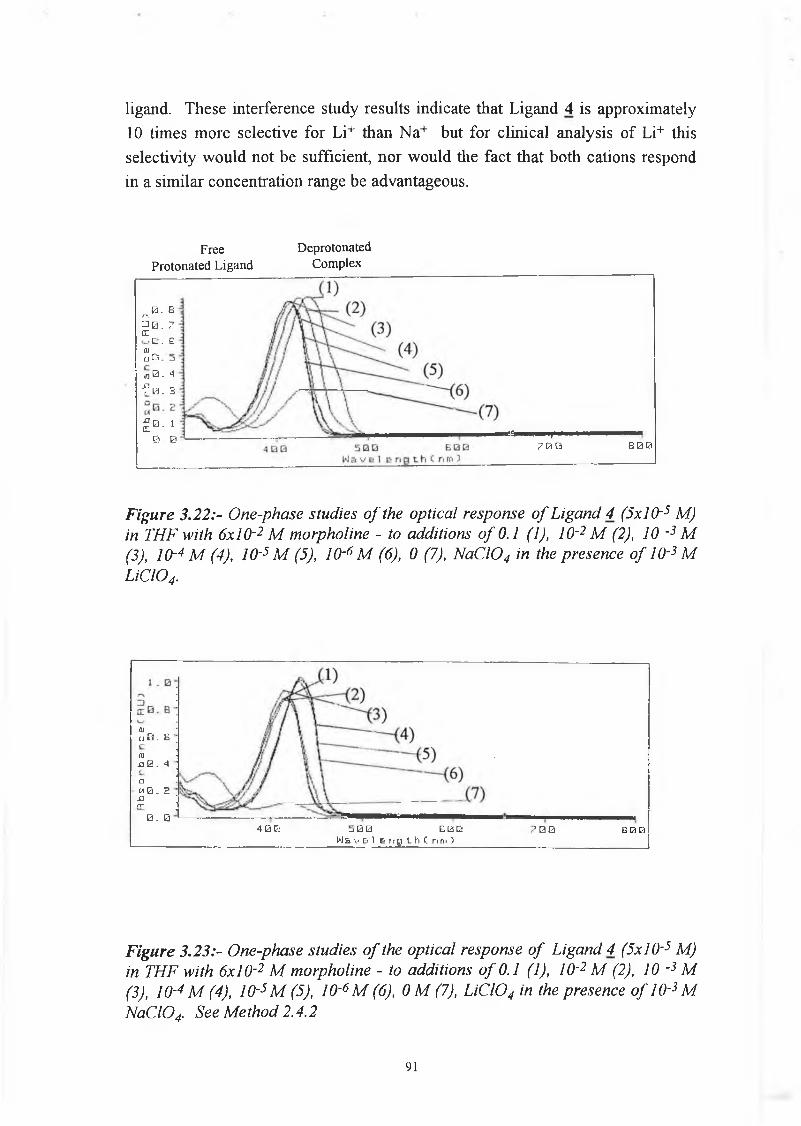
ligand. These interference study results indicate that Ligand 4 is approximately 10 times m ore selective for Li+ than N a+ but for clinical analysis o f Li+ this
selectivity would not be sufficient, nor w ould the fact that both cations respond
in a sim ilar concentration range be advantageous.
Free DeprotonatedProtonated Ligand Complex
B- G
3 b . 7lTEj . E01üß- j *0- 4 f EL 3
¿ a . i0- B ¿a i f
7 0 0 E B B
F igure 3 .22:- O ne-phase studies o f the optical response o f L igand 4 (5x1 O' 5 M) in TH F with 6x1 O' 2 M m orpholine - to additions o f 0.1 (1), 10~2 M (2), JO ~3 M(3), JO' 4 M (4), JO' 5 M (5), JO' 6 M (6), 0 (7), N a C l0 4 in the presence o f 10-3 M L iC l0 4.
fljuB. BinÜ 0 . 4
aM 0 . 2 XIcr
0 . 04 0 0 jQG E ß 0
W a v e 1 & n g t h C n m 3’00 60Q
F igure 3 .23:- O ne-phase studies o f the optical response o f L igand 4 (5x1 O'5 M ) in TH F with 6x1 O' 2 M m orpholine - to additions o f 0.1 (1), 10-2 M (2), JO -3 M(3), JO' 4 M (4), 10'5 M (5), I O'6 M (6), 0 M (7), L iC l0 4 in the presence o f 10-3 M N a C l0 4. See M ethod 2.4.2
91

KCIO4 was then examined as an interferent. A final concentration of 4 mM KCIO4 was examined. This was obtained by the addition of 100 \xL o f aqueous0 .1 M KCIO4 to 2.5 mL of 6x l0 -5 M Ligand 4. Figure 3.24 shows graphs of abs. at 430 nm vs. log[NaC1 0 4 ] in a constant background of 0 M K+ and 4 mM K+. A reduction in absorbance intensity was noted for all samples containing the 4 mM K+ interferent and an actual selectivity coefficient could not be calculated. The reduction in intensity at the deprotonated complex A,max when the aqueous KCIO4 solution was introduced again highlights the importance the choice of solvent in terms of its polarity or its ability to support ions, has on the components of the system and that it must be carefully considered.
Log [NaC104]
F ig u re 3.24:- G raphs o f absorbance at 430 nm vs. log[NaC lO 4] in a constant background o f 0 M K + a n d 4 m M K +.
3.9.4 N M R C om plexation S tudy
NMR studies were carried out with Ligand 4 in the presence of varying concentrations of LiC1 0 4 , NaC1 0 4 and KSCN. Method 2.4.3 was followed. To a ligand concentration of 25 mM in CDCI3 , 0, 0.5, 1.0 and 2.0 mole equivalents of metal salt in CD3OD were added. The ligand solution at this concentration was yellow and it was observed that upon addition of CD3 OD the colour changed to light yellow. Again this is indicative of the substantial role played by the solvent on colour generation.
92

The N M R spectrum o f Ligand 4 before the introduction o f any m etal salt was as
expected quite sim ilar to that obtained for the triester m onoacid [2], another
tetrachrom ogenic m olecule w ith three ester m oieties and one acidic group on the rem aining arom atic rings, with a quartet observed at 3.3 ppm and a doublet at 4.5
ppm and 4.8 ppm due to the AB system o f the m ethylene protons. The bridging m ethylene protons o f this calix[4]arene cannot be divided into two sets o f equivalent protons, i.e HA and H B, as was the case with Ligand 1 . This is due to the fact that one o f the aromatic rings m aking up the calixarene has an NO2 group on place o f /-but in the para position on the upper rim, and an unsubstituted phenol on the low er rim and would be expected to result in a m ore complex A, B
system. A m ore com plicated signal w ould also be envisaged for the /-but protons since, as w as stated above, one o f the para positions is occupied by an N 0 2 group.
U pon com plexation w ith Li+ a num ber o f peaks are shifted. Figure 3.25 (a) and (b) show the N M R spectra o f Ligand 4 upon addition o f (a) 0, and (b) 1.0 mole equivalents o f L iC 104 respectively. The four peaks at 3.3 ppm are split into 2 distinct doublets w ith a dow n-field shift being observed for one o f these doublets.
A nother doublet associated w ith the AB system o f the m ethylene protons at 4.8 ppm undergoes an upfield shift to 4.7 ppm. A num ber o f peaks due to the arom atic protons also experience dow n field shifts. No further shifts in peaks are noticed after the addition o f a 1 M equivalent o f LiClC>4 indicating a 1:1 com plexation stoichiom etry. A sim ilar explanation o f the shielding and
deshielding effects o f the AB system offered for Ligand 1 m ay also be applied to
these observed shifts. (See section 3.8).
Figure 3.26 (a) and (b) show the N M R spectra o f Ligand 4 upon addition o f (a) 0, (b) 1.0 m ole equivalents o f NaClC>4 respectively. W hen the ligand is com plexed w ith N a+, the protons o f the m ethylene AB proton system are again shifted. The shifts observed fo r the aromatic protons are once again observed, how ever there is a further upfield shift o f the doublet associated w ith the m ethylene AB system to 4.5 ppm w here it m erges w ith the peaks o f the ester C H 2 protons w hen a 2
m ole equivalent o f N aC 104 is added. This introduces the possibility that more than a 1:1 stoichiom etry exists for the calixarene-N a+ complex. This however, would be unusual since 1:1 stoichiom etry has previously been found for sodium com plexes o f calix[4]arenes [16], The continuation o f spectral change after a 1 mole equivalent o f N aC104 had been added m ay be as a result o f a solvent effect
on the ligand or an ionic strength effect. Previously, it has been shown that
93

dissim ilar solvent affects can occur upon com plexation w ith different cations o f
the same ligand [24],
For the com plexation study with potassium the salt used was KSCN because o f
the lack o f solubility o f KCIO4 in C D 3OD. Figure 3.27 (a), and (b) show the N M R spectra o f Ligand 4 upon addition o f (a) 0, and (b) 1.0 m ole equivalents o f KSCN respectively. U pon com plexation w ith K+ the quartet rem ains in the same
position, bu t the doublets at 4.5 ppm and 4.8 ppm are shifted slightly upfield. H ow ever there is very little shift in the position o f the arom atic protons indicating
that there is less interaction betw een the calix[4]arene and potassium than there was for lithium and sodium. It m ust be noted that some o f the KSCN began
precipitating out o f solution alm ost as soon as it had been added to the N M R tube at the 0.5 m ole equivalent level indicating a lack o f solubility o f KSCN in CDCI3 at these levels. The apparent lack o f com patibility o f K + w ith the calixarene
cavity shown in the *H N M R signal changes suggests that it is not being encapsulated by the m olecule. For both Li+ and N a+ at concentrations less than a 1 m ole equivalent signals for both the com plexed and com plexed forms o f the AB system are seen in the spectrum , indicating that at room tem perature, the exchange rate betw een the tw o species is slow on the N M R tim e scale [16],
94

Ô (ppm)
Figure 3 .25:-1 H NM R spectra o f the free and complexed fo rm o f Ligand 4 in CDCl3 at room temperature: (a) [LiC.l04]/[4] = 0: (b) [L iC l0 4]/[4] = 1; where [4] = 5x10 -3 M in CDCI3 A n aliquot from 1.0 M solution o f L iC l0 4 in CD 3 OD was added directly to a CDCI3 solution o f 4 in an NM R tube, p-tert-butyl H; HA and Hb A r C H ^ r .
95

5 (ppm)
JL l/J
8 7 6 5 4 3 2 J 0F igure 3 .26:-lH N M R spectra o f the fr e e a nd com plexed fo rm o f L igand 4 in CD Cl3 a t room tem perature: (a) R = [N a C l0 4] /[4 f =0: (b) [N a C l0 4j / [ £ / = 1 ; where [4] = 5x1 O' 3 M in CD Cl3 A n aliquot fro m 1.0 M solution o f N a C l0 4 in CD 3OD was added directly to a CD Cl3 solution o f 7 in an N M R tube, p-tert- butyl H; H A, a n d H B = A r C H ^ r .
96

F ig u re 3 .27 :-JH N M R spectra oj the fr e e and com plexed fo rm o f L igand 4 in C D C l3 a t room temperature: (a) [KSCN]/[4J = 0: (b) [KSCN]/[4J - 1; where [4] - 5x1 O' 3 M in C D C l3 A n aliquot fro m 1.0 M solution o f 'K SC N in C.D3OD was added directly to a C D C l3 solution o f 4 in an N M R tube, p-tertbutyl H; HA and H b = A rC H yir .
6 (ppm)

Ligand 4 is capable o f com plexing both lithium and sodium, with a slightly more
selective response for lithium, resulting in a colour change from colourless to yellow in the presence o f a lipophilic base. It is m ore sensitive to both Li+ and
N a+ than any o f the previously exam ined ligands, Ligands 1 to 3. The ^ max for
the two different com plexes varies from 430 nm for sodium to 416 nra for
lithium , w hich could be an indication o f a d irect interaction betw een Li+ and the phenolate anion o f the chrom ogenic nitrophenol w hich is making up part o f
calixarene ring. The presence o f 4 mM potassium introduced in aqueous solution decreases the intensity o f the colour produced in the presence o f sodium indicating that the ligand is highly susceptible to variations in solvent character. At 1 O'4 M potassium there would appear to be no interference by the presence o f K+ on the ligands response to N a+.
3.10 Discussion
The main features o f the four calix[4]arene nitrophenol ligands obtained from the
U V -V is spectroscopy experim ents are sum m arised in Table 3.1.
Table 3.1:- C om parison o f the main fea tu res o f L igands i to 4 obta ined by UV-
Vis spectroscopy.
Ligand Cone.
(M )
Prot.
^max
Deprot.Cplx.
^-max
Li+ Linear Range (M )
N a+ Linear
Range (M)
Li+slopea.u./dec
K-LiNa at 10-2 M
1 5x1 O’ 5 350 nm 424 nm 10-4-5x10⁻² 10-4-10-2 0.325 25.1
2 7x1 O’ 5 350 nm 424 nm 10-4-10-2 — 0.250 34 7
3 5 x l0 '5 350 nm 424 nm 10-4-5 x l O '3 — 0.900 43.1
4 5 x I0 -5 330 nm 416
(Li+)430
(Na+)
10-5-5 x l0 -3 10’ 5- 10-3 0.420 ~ 10
98

From these results it can be seen that ligands 1 to 3 w hich have either one or four chrom ogenic nitrophenol m oieties in w hich the ionisable phenolic group is ortho to the nitrogroup, all give sim ilar spectral responses. No variations exist betw een protonated and deprotonated ¡Vmax values betw een the m onochrom ogenic Ligand
2 and the tetrachrom ogenic Ligands 1. and 3. They each have a protonated A,max at 350 nm and a deprotonated com plex Xmax at 424 nm.
Cause o f C olour
The ?„max o f both the protonated and deprotonated com plex are synonom ous w ith nitrophenol and subsequent nitrophenolate anion production under sufficiently basic conditions. C olour changes or bathochrom ic shifts in A.max with nitrophenol chrom ogenic m oieties were confirm ed as long ago as 1949 by C oogeshall et al [20] to be due to the form ation o f the phenolate anion i f the pH o f the solution in w hich they w ere housed w as increased sufficiently. A subsequent increase in acidity was found to resu lt in a regeneration o f the
original colour (colourless). Sim ilarly w ith all o f the chrom ogenic ligands described here, an introduction o f an acid such as HC1 into the ligand-m etal-base solution resulted in a return to a colourless solution. The yellow colour could be
restored by subsequent addition o f a base. Therefore the m ain cause o f colour change w ith these calix[4]arenes, (Ligands 1 to 4) bearing nitrophenol chrom ogenic m oieties is through proton exchange at the chrom ophoric group.
M ode o f Com plexation
The variation in intensity observed w ith the different cations for Ligands I to 3 seen in section 3.4, is m ost likely to be related both to cation size and to the effect each cation has on the chrom ogenic m oieties. The processes described in equilibria (3.1) and (3.3) are responsible for colour generation. The equilibrium in equation (3.1) w ill proceed to the right i.e. form ation o f the complex, if the cation is capable o f efficiently entering the calixarene, or simply if the ligand is a
good ionophore. Therefore both equilibria com bined give the observed stability
constant o f the system. The overall reaction from equations (3.1) and (3.3) is
99

constant o f the system. The overall reaction from equations (3.1) and (3.3) is
therefore the product o f the stabilities o f both the com plexation and deprotonation reactions
L-COH + M+ + B ^ LM+CO- + BH+ (3.8)
Kst = [LM+CQ-] [BH+1 (3.9)[L-COH] [M+]
This stability constant can be calculated using equation (3.9) assum ing that the base concentration is effectively constant because it is present in a large excess. The pH o f the system is o f great im portance since spontaneous phenolate anion
production is undesirable. U nder the conditions used in this research, the
equilibrium in (3.5) is predom inantly on the left i.e. prevention o f phenolate anion production in the absence o f m etal, since no colour change or only a very
slight colour change is observed upon addition o f m orpholine to the solutions in
the absence o f metal. The base on its own in the aprotic solvent THF is notstrong enough to cause deprotonation.
U pon addition o f a suitable m etal-ion (e.g. L i+), the value o f (3 (Eqn. 3.2) is sufficiently large to ensure that the equilibrium in (3.1) forced to the right encouraging m etal ion inclusion in the calixarene cavity. Once the metal cation (Li+ or N a+) is introduced into the system deprotonation is seen alm ost instantaneously, indicating that the equilibrium in equation (3.3) is also forced to
the right. This is indicative o f the introduction o f the positively charged metal
ion into the ligand cavity effecting a lowering o f the pK a o f the ionisable phenolic
group w hich makes proton removal easier.
In the event that a cation, such as potassium , w hich is not efficiently taken up by the ligand, the population o f complexes w ill be small and the equilibrium in (3.1) w ill not favour the righ t hand size, resulting in a very low (3 value. The lack o f interaction or colour change with K+ may be due to a size restriction o f the hydrophilic cavity, w hich excludes com plexation w ith this cation.
However, w hen the ionophore is capable o f interacting with a cation (such as is the case w ith Li+ and N a+) the effect exerted by the cation on the chrom ophore
becom es very im portant to the overall picture. The cation which effects the
chrom ophore to the greatest extent should show an earlier response (i.e. at low er
100

c o n c e n tra tio n s ) . T h e p K a o f th e d is so c ia tin g p ro to n s o f io n isa b le c h ro m o p h o re s
has previously been shown to be affected to different extents by the presence o f
different cations. C zech et al [21] found w ith chrom ogenic cryptaspherands,
which had been prepared as their sodium brom ide complexes, that a decrease in pK a value o f the com pounds occurred on com plexation with K+ i.e. 8.27 to 6.58
± 0 .1 5 , w ith values obtained in diethylene glycol m onoethyl ether (DEGM EE). No values were obtained for uncom plexed m olecules since sodium was present during synthesis, and the ligand was hence obtained as the N a+ complex.
A difference in pK a values was also observed for com plexation w ith different cations [22] for chrom ogenic spherands. The pK a o f the phenolic proton o f the dinitrophenylazophenol changed from 6.9 for the N a+ complex to 5.9 for the Li+ com plex which displayed superior extraction ability. These m easurem ents were
carried out in 80% dioxane, 20% w ater at 30 ± 2° C. pK a m easurem ents were
calculated using a pH titration. W ith Ligands 1 to 3, the dissociating phenol is
no t actually m aking up part o f the hydrophilic cavity but an interaction betw een the cation and the ionisable chrom ogenic m oiety is possible (as w ill be discussed below ) and a sim ilar pK a variation is attributed to the colour generation in this work. A n exam ple o f an ionisable chrom ophore positioned m ore than a single bond away from the ionophoric part o f the m olecule is described by Takagi et al [23], Alkali m etal-ion selectivity in this system is dependent on tw o critical
factorsj_" size selectivity" by the crown ether m acrocycle andii the coordination interaction or the ion-pair interaction o f the anionic site
o f the deprotonated phenol w ith the crow n ether-bound m etal ion.X
X = N 02 Y =
/ //N — N
101

So overall com plexation occurs as follows1. C om patible cation inclusion —» pK a change
2. Low ering o f pK a —> phenolic proton exchange with suitable base.
3. V ariation in pK a change caused by different cations —» Selectivity.
It is not clear as to w hether one or more o f the chrom ogenic m oieties is being
deprotonated in the two tetrachrom ogenic ligands examined, (Ligands 1 and 3). This will depend on the nature o f the interaction betw een the Li+ or N a+ cations and the actual chrom ogenic ligands. The cations may not be within contact distance or m ay not interact to the same extent with all four o f the chromogenic groups o f the tetrachrom ogenic ligand. The higher initial absorbance o f both o f these com pounds in the free protonated form com pared to Ligand 2 is not surprising, since they each contain three extra chrom ogenic m oieties which will
add to the overall absorbance seen. The same overall spectral form s are observed for varying Li+ concentrations for the tetra and m onochrom ogenic ligands in
term s o f an approxim ate doubling o f intensity or 8 on going from the protonated absorbance m axim um to the deprotonated absorbance m axim um seen for the
com plex obtained w hen 0.1 M LiC104 had been added. This m ay be an
indication that the presence o f a sim ilar deprotonation process for both types o f ligand i.e. only one deprotonation is occurring. A second deprotonation, with delocalisations o f the negative charges over the chrom ogenic k systems however,
cannot be ruled out. The determ ination o f the pK a o f each individual phenolic proton o f the tetrachrom ogenic ligands m ay lead to m ore conclusive inform ation on this po in t (eg. by non-aqueous titration).
Interaction o f Cations with the Chrom oionophoresLigands 1 to 3 o f the new chrom ogenic calix[4]arene tetraesters were found to exhibit a slight Li+ over N a+ selectivity with a much low er concentration o f
LiC104 required to see the response than for N aC 104, w hereas Ligand 4 exhibited a strong response to both Li+ and N a+ perchlorates betw een 10'5 and 10'3 M. N either ligand showed any significant response to K ‘
The exact nature o f the interaction, or the effect the Li+ cation has on the chrom ogenic m oiety is not know n since no crystals o f either the ligand or its com plex could be obtained for x-ray crystal analysis. However, from prelim inary
m olecular m odelling, a m odel o f Ligand 1 was obtained using Hyperchem,
102

structure 3(xiiT). The distances between the carbonyl oxygens,(C=0) [see (1) in 3(xm)], which have previously been considered to make up part of the hydrophilic cavity capable of encapsulating cations [2], and the carbon (C) [see (2) in 3(xiii)l of the chromogenic aromatic ring bonded directly to the ester groups of the calix backbone were estimated to be between 3.6 and 4.14 A. From these values it is conceivable that the inclusion of a positive charge in the cavity made up of the four phenolic oxygens of the calixarene and the four carbonyl oxygens will exert an effect on the % system of the chromogenic moiety which translates into an alteration of the pKa of the labile phenolic protons. Atomic distances of this order of magnitude have previously been found to be sufficient for the inclusion of a cation by electrostatic interaction to occur. Amaud-Neu et al found phenolate O—O intramolecular contacts to be between3.03 and 5.16 A for a calix[4]arene tetraester molecule, and this was found to be sufficient for sodium cation inclusion [2 ],
3(xiii)M olecular model o f Ligand I obtained using Hyperchem.,
Light Blue = C-C bonds Red = Oxygen atoms Dark Blue = Nitrogen atoms
103

Interaction betw een the cation and the chrom ogenic m oiety may also occur via an
interaction betw een the phenolic oxygen o f the chrom ogenic m oiety and the eight oxygens o f the hydrophilic cavity or w ith the ethereal oxygens. An atomic distance o f betw een 5.30 and 6.07 A w as estim ated from Hyperchem , to be
between the ionisable phenolic oxygens o f the chrom ogenic m oiety (OH) [see (3)
in 3(xiii)] and the corresponding ethereal oxygens (O) [see (4) in 3(xiii)]. These
ethereal oxygens have previously been found to take up a position exo to the hydrophilic cavity m ade up o f the carbonyl and aromatic oxygens o f the pendent
ester groups w hich has been found to encapsulate alkai metal cations on com plexation [2, 17, 24], The neutral uncom plexed ligand m ay show some electrostatic in teraction betw een the hydrophilic cavity and the phenolic groups o f the chrom ogenic nitrophenol. However, since we are dealing w ith essentially neutral m olecular com ponents and the energy o f interaction o f tw o neutral m olecules due to Van D er W aals forces falls o ff as R -6 [25], (where R is their separation), any such interaction can be predicted to be insignficant. W ith the
inclusion o f a positive charge i.e. Li+ or N a+ cation, the possibility o f an electrostatic interaction arises. Ions can in teract over m uch longer distances than
neutral atoms w ith electrostatic interactions falling o ff only as R '2. Therefore, an
electrostatic interaction betw een the positively charged cation and the phenolic
group o f the chrom ogenic m oiety becom es possible. Rotation about the -0 -C H 2- [C*-OH] bonds (w here C*-OH sym bolises the chromogenic nitrophenol), on Li+ inclusion m ay reduce the distance betw een the ionisable phenolic oxygens and the hydrophilic cavity, w ith any such interaction having the effect o f reducing the
pK a o f the phenolic proton, through a d irect interaction with the chrom ogenic n system. An in teraction between the positively charged Li+ alm ost certainly occurs w ith the n electron systems o f the nitrophenol chrom ogenic m oieties, (the distance estim ated to be 3.6 and 4.14 A), and thereby stabilising the negatively charged phenolic oxygen o f the chrom ophore by drawing charge density towards the positive charge. This effectively causes a delocalisation o f the negative
charge over the k system.
The overall energy o f both the ligands and their deprotonated com plexes can be described in term s o f Gibbs free energy -AG°. The more negative the value o f - AG° the m ore stable the complex. Bohm er et al. [26] stated that in their work w ith structure 3(xvi), the pK a values w ere a reflection o f the difference in Gibbs
free energy betw een the protonated m olecule and the deprotonated m onoanion o f
104

the monochromogenic calix[4]arene. If both are stabilised to the same extent, no change in pKa value occurs.
1 r = c h 3
2 R = C (C H 3)3
(xvl)C alix[4]arene m ononitrophenol [26]
In Ligands 1. to 4, the fact that phenolic dissociation does not occur in the presence of morpholine but does once a cation is included is indicative of an increase in the -AG° value or a decrease of the energy of the whole system occurring with cation inclusion. The whole system favours a reduction in total energy or a stabilisation in energy occurs when the molecule returns to an overall a neutral state following metal-ion complexation, caused by the deprotonation of the chromophore.
AG,(3)L -C O H
+
M +
(3)L C O
+
M +
+ H
(1 ) AG(i) ( 2 )
L M + COH(4)
AG,(2)
— w L M + CCT
a g (4)
AG(2 ) more negative than AG(1) AG(4 ) more negative than AG(3)
105

In energy terms, it w ould be predicted from the experim ental evidence, that AG(4) has the m ost negative value and that the production o f the deprotonated com plex is favoured in the presence o f a suitable base.
Confirm ation o f C om plexationEquilibrium (3.1) i.e. w here the ligand takes up the metal ion, m ust occur in order
for a lowering o f the pK a o f the chrom ogenic m oiety to occur. The ability o f the ligand to take up Li+ or N a+ cations in the absence o f a base was dem onstrated by
'H N M R spectroscopic experim ents (Figure 3.13). The !H N M R com plexation studies w ith NaSCN, revealed an ordering o f the distorted cone conform ation
upon com plexation w ith N a+. A lthough the assignm ent o f peaks in the N M R
spectra was difficult due to their com plex nature, it was clear that the introduction o f N a+ resulted in shifts in the position o f a num ber o f peaks. M ore ordered symmetry on com plexation was confirm ed by a sim plification o f the spectrum o f the /-butyl hydrogens, w hich after com plexation to exist in an equivalent environm ent, as shown by the singlet at 1.0 ppm. M olecular dynamics results along with x-ray crystal data for calix[4]arenes bearing both phenolic and carbonyl oxygens on the low er rim concur w ith the 'H N M R results. M olecular
dynamics work [24] w ith a calix[4]arene tetraam ide suggested that the hydrophilic part o f the m olecule is not well preorganised for com plexation in solution but rearrangem ent to a m ore rigid structure occurs on com plexation at
the low er rim.
NEt23(xi)
Top-bottom coupling i.e. betw een the upper hydrophobic part o f the m olecule
and the low er hydrophillic portion, in the LLi+ com plex (where L is the ligand) was described. The rigidness o f the hydrophillic part leads to the m ost asym m etrical cone, w here tw o opposite /er/-butyl groups are on average m uch
closer (5.7) A than in the other LNa+ and LK + com plexes (9.5-9.7) A. This
indicates that the w hole m olecule has becom e m ore ordered on com plexation
106

with different cations conferring different degrees o f order depending on how well it fits the cavity. It also indicates that the ordering or reduction in m obility
o f the hydrophilic part o f the m olecule caused by cation inclusion affects the
w hole structure. The *NMR spectra obtained for Ligand 4 w ith Li+, N a+, and K +,
concur w ith this explanation since the HA and H B protons along w ith some o f the arom atic protons were found to shift by varying am ounts, depending on the com plexing cations. The sm allest shifts were observed for K+, which is generally
considered to be too large to com plex w ith the calix[4]arenes.
Calestani et al [17] reported the x-ray crystal structures o f a calix [4]arene tetraacetam ide in both its free and com plexed states, 3(xii) and 3 (xvii).
3 (xii) 3(xvii)
The conform ation o f the four amide chains in the com plex was found to be m ore sym m etrical than that o f the free ligand. In addition to this increase in sym m etry o f the hydrophilic part o f the m oiety upon com plexation it was found that the arom atic hydrophobic part o f the m olecule was also affected. In the free ligand, as w as previously stated, tw o opposite arom atic rings (A, C) are alm ost parallel to each other, and the other two (B, D) are alm ost perpendicular. A fter
com plexation, the dihedral angles betw een the arom atic rings and the plane o f the
m ethylene groups are all equivalent. This is again indicative o f com plexation
conferring a m ore ordered structure on the calixarene molecule.
107

Effect o f Solvent
The choice o f solvent was found to be very im portant as the com parison o f spectra betw een Ligand 1 in TH F and M eOH illustrated (Figure 3.10). The effect
a variation o f solvent has on the acidity o f solute m olecules is well known.
M ethanol is an am phiprotic polar solvent w ith a dielectric constant o f 32.63 [3]
and a pK a o f 15.5 [27], TH F on the other hand has a m uch low er dielectric constant o f 7.6 and w ould be classed as an aprotic protophillic solvent or in other
words it has some basic properties but is a non-ionisable solvent [28],
Two param eters are im portant in assessing the cause o f the substantial deprotonation o f the ligand in m ethanol. Firstly the acid-base character o f the
m ethanol itse lf and secondly, its ability to facilitate deprotonation o f the ligand by m orpholine m ust be assessed. M orpholine is a stronger base than MeOH, and therefore m ethanol w ill not have the ability to deprotonate the ligand on its own. This is seen in spectrum (7) o f Figure 3.10(b), where no deprotonation occurs w hen the ligand is dissolved in M eO H in the absence o f a base.
Therefore w e can conclude that the acidity o f the solvent is not the property o f
m ethanol w hich is resulting in a m uch greater level o f deprotonation in the presence o f m orpholine. The next property to look at is the polarity o f the
solvent w here M eO H has a dielectric constant o f 32.63. This value is much
greater than the value o f TH F i.e. 7.6 and therefore m ethanol is much more capable o f supporting the existence o f ions than THF. The Ka in equation (3.6)
w ill be enhanced as a result o f this increased polarity and a colour change is seen even in the absence o f m etal-ions.
THF w ith its low dissociating abilities cannot sustain the presence o f ions as well as m ethanol. The presence o f m orpholine in the Ligand-THF solution cannot force the equilibrium o f equation (3.5) to the right sufficiently for a colour
change to be observed in the absence o f metals. So the TH F-m orpholine mixture
is more discerning to changes in LiC104 concentrations.
The hypsochrom ic effect observed on going from THF to m ethanol is again an illustration o f the effect a solvent variation has on the system, a point alluded to
previously by M isum i et al [8], This indicates that not only m ust the base be carefully chosen so as spontaneous deprotonation in the absence o f the metal ion
does no t occur (3.5) but the m edium in w hich all o f the com ponents are situated
is also crucial to controlling the direction o f this equilibrium . The effect o f the
108

solvent on the basicity o f the base used, or the ionising ability o f the system cannot be neglected i f a clear spectral difference is going to be obtained over the
relatively large range o f metal ion concentrations observed w ith the ligands in THF i.e 2 to 3 orders o f m agnitude. Further optim isation studies o f both base and solvent are clearly needed in order to investigate w hether the linear range,
LOD or selectivity can be improved.
A t an electronic level the hypsochrom ic ^ max shift on increasing the polarity o f
solvent from THF to m ethanol suggests that the peak produced for the deprotonated ligand is due to an n —> n* transition as there is electrostatic
interaction betw een polar solvents and polar chrom ophores such as the nitrophenol groups. These solvents tend to stabilise both the non-bonding electronic states and the n * excited states, causing the n —> k * transitions to
move to higher energy [12]. However, the Xmax change is quite small i.e. 6 nm and therefore conclusive p ro o f o f one sort o f transition over another i.e. n -» %* or 7i —> , is not available. The high intensity or extinction coefficient o f thepeaks observed in this w ork is generally associated w ith n —> it* transitions
w hich are allow ed transitions com pared to the n —> it* transitions which are
considered to be forbidden and therefore exist as peaks o f low intensity [29],
Two-Phase Experim entsThe tw o phase experim ents y ielded some interesting results. Ligands 1 to 3 were
all found to be capable o f extracting m etal cations from an aqueous phase into an organic phase (bu tan -l-o l) in w hich the ligand and the lipophilic base TDD A
w ere dissolved. H ow ever, the zw itterionic nature o f the deprotonated com plex
appeared to facilitate diffusion o f this otherw ise w ater insoluble ligand into the aqueous phase. The replacem ent o f the t-butyl groups in the para position o f the
calixarene backbone by long chain C 18 groups i.e. Ligand 3 was found to reduce this phenom enon considerably by m aking the ligand m uch more lipophilic overall. pH variations o f the aqueous phase w ere found to affect the solubility o f both the protonated and deprotonated com plexes and further studies o f switching solubility o f the different com ponents are warranted.
109

Ligand 4In Ligand 4 the ionisable phenol is part o f the calixarene cavity itse lf (see
3(xviii)), and w hich is p a ra to the electron w ithdraw ing nitro group rather than
ortho as w ith Ligands i to 3. From w ork on sim ple p a ra nitrophenols, it w ould
be predicted that this chrom ogenic m oiety w ould absorb at wavelengths o f higher energy than the ortho nitrophenol [19]. The fact that the dissociating phenol is
part o f the hydrophillic cavity w hich is deem ed to be responsible for cation
uptake [2 ] is an initial indication that a d ifferent process is going to be involved fo r com plexation. B ohm er et al. [26] found a phenom enon occurring w ith 3(xvi) which was sim ilar to that w hich was observed in this work. A hypsochrom ic shift in Xmax o f approxim ately 20 nm is observed on going from com plexation w ith N a+ to Li+ . B ohm er et al. attributed this to a possible Li+ phenolate interaction occurring w hich they declare is not possible for the less charge dense N a+ or K +, although a response is observed for both. So w ith N a+ an
electrostatic in teraction w ith the phenolic oxygen and the rem aining carbonyl and arom atic oxygens is m ost likely to be the cause o f the UV-Vis changes. W ith Li+ a coulom bic in teraction occurs w ith the phenolate anion o f the chrom ogenic nitrophenol, w hich m akes up part o f the calixarene backbone, accom panied by
electrostatic interactions w ith the above m entioned oxygens, thus reducing the ease w ith w hich an electron can be m oved from its n or n level up to a k * level
and this is seen as a hypsochrom ic shift. A sim ilar phenolate interaction resulting in a hypsochrom ic shift w as observed fo r the interaction betw een Ca2+ and a
chrom ogenic crow n ether [7]. Ca2+ like Li+ has a high charge density and therefore interaction w ith these cations and a phenolate anion o f a chrom ogenic
m oiety sited in the hydrophilic cavity is thought to be possible. Such an interaction w ith the phenoxy ion o f Ligands 1 to 3 is not thought to be possible due to the rem oteness o f the ion from the central hydrophilic cavity into which the cation is likely to fit 3(xix).
This ^max variation betw een different com plexes offers the possibility o f m ultiw avelength analysis for determ ining the presence o f either N a+ or L i+ in a
sample. Figures 3.20 and 3.21 dem onstrated that at 400 nm a selective response to Li+ can be obtained w ith very little response to N a+, whereas at 450 nm N a+ can be determ ined w ith a little response to Li+, and neglible response to K +.
n o

3(xviii) 3(xix).Representation o f the relative positions o f the cation and anion after
com plexation and deprotonation with L igand 7, (3(xviii)), a nd L igand 4, (3(xix)).
3.11 Conclusion
Four novel chrom ogenic calix[4]arenes have been exam ined and the following
charcteristics have been found:• A colour change from colourless to yellow occurs, upon com plexation with
Li+, or N a+, and to a lesser extent K+, in the presence o f a suitable base, with the intensity o f the colour being cation concentration dependent.
• Ligands 1 to 3 display betw een a 10 and 50 fold Li+ selectivity over N a+, w hereas Ligand 4 shows a sim ilar response to both cations, but a variation in
A.max betw een the tw o com plexes can be used as a means o f indentifying the presence o f either cation in a simple one cation solution.
• In the presence o f a suitable base i.e. TDD A or m orpholine, no colour change is seen in the absence o f the com plexing metal ion. Com plexation has the effect o f low ering the pK a o f the dissociating proton o f the phenolic group o f
the chrom ogenic moiety.• Com plexation occurs in the absence o f a base but no change in colour is
produced. This w as dem onstrated by *H N M R spectroscopy w hich revealed shifts in the position o f certain protons in the spectrum which have previously
been determ ined to be synonom ous w ith cation complexation.
C2H5OC
111

• Ligands I to 3 were found to be capable of extracting Li+ cations from an aqueous phase into an organic (butan-l-ol) phase. Subsequent leaching of the colour due to the complexed form into the aqueous phase was attributed to the zwitterionic nature of the deprotonated complex. This phenomenon was reduced in the case of Ligand 3 which had bulky Cig groups in the para position of the calixarene backbone which rendered the molecule more lipophilic and thus stabilised it in the lipophilic organic phase.
112

3.12 References
1. C.D. Gutsche, (edt.) "Calixarenes", M onographs in Supram olecular Chem .,Vol. 1, R.S.C, Cam bridge, (1989).
2. F. A m aud-N eu, E.M. Collins, M. D easy, G. Ferguson, S.J. Harris, B. Kaitner, A.J. Lough, M.A. M cKervey, M.J. Schwing-W eill and E.M. Seward, J. Am. Chem. Soc., 111 (1989) 8681.
3. R. Lide, (Ed.), "Handbook o f Chemistry and Physics", 74th edition, CRC Press, B oca R aton, Florida, (1993)
4. A.F. Sholl, I. O. Sutherland, J. Chem. Soc., Chem. Commun., (1992) 1716.
5. D.J. Cram, R .A. Carm ack, R.C. Helgeson, J.Am . Chem. Soc., 110 (1988) 571.
6. S. M isumi, T. K aneda, J. o f Inc. Phenom. and M olec. Rec. in C hem 7, (1989) 83.
7. J. Van Gent, E .J.R . Sudholter, P.V. Lambeck, T.J.A. Popma, G.J.Gerritsma, D .N. Reinhoudt, J.Chem. Soc., Chem. Commun., (1988) 893.
8. T. Kaneda, K. Sugihara, H. Kam iya, S. M isum i, Tet. Lett., 22 (1981) 4407.
9. Y. Kubo, S. H am aguchi, A. Niimi, K. Yoshida, S. Tokita, J. Chem. Soc., Chem. Com m un., (1993) 305.
10. M.A. King, C.P. M oore, K.R.A. Sam ankum ara Sandanayake, 1.0 Sutherland, J. Chem ., Soc., Chem. Com m un., (1992) 583.
11. H. Shimizu, K. Iwam oto, K. Fujimoto, S. Shinkai, Chem. Lett., (1991) 2147.
12. E.D. Olsen, "M odem Optical Methods o f Analysis", M cGraw-Hill, USA, (1975).
13. H.G. Lohr, and F. V ogtle, Acc. Chem. Res., 18 (1985) 65.
14. G. Barrett, V. Bohm er, G. Ferguson, J. F. Gallagher, S.J. Harris, R.G. Leonard, M .A. M cK ervey, M. Owens, M. Tabatabi, A. Vierengel, and W. Vogt, J. Chem . Soc., Perkin Trans 2, (1992) 1595.
15. R. U ngaro, and A. Pochini in "Calixarenes: A Versatile Class o f M acrocyclic Compounds", eds. J. V icens and V. Bohm er (1991) K luw er Academ ic Publishers, D ordrecht / Boston / London, p. 127-147
16. A. Arduini, A. Pochini, S. Reverberi, R. U ngaro, C.D. Andereetti, and F. U gozzoli, Tetrahedron 42 (1986) 2089
17. G. Calestani, F. U gozzoli, A. Arduini, E. Ghidini, and R. Ungaro, J. Chem. Soc., Chem. C om m un., (1987) 345.
18. J. W ang, (Personal Com m unication )
113
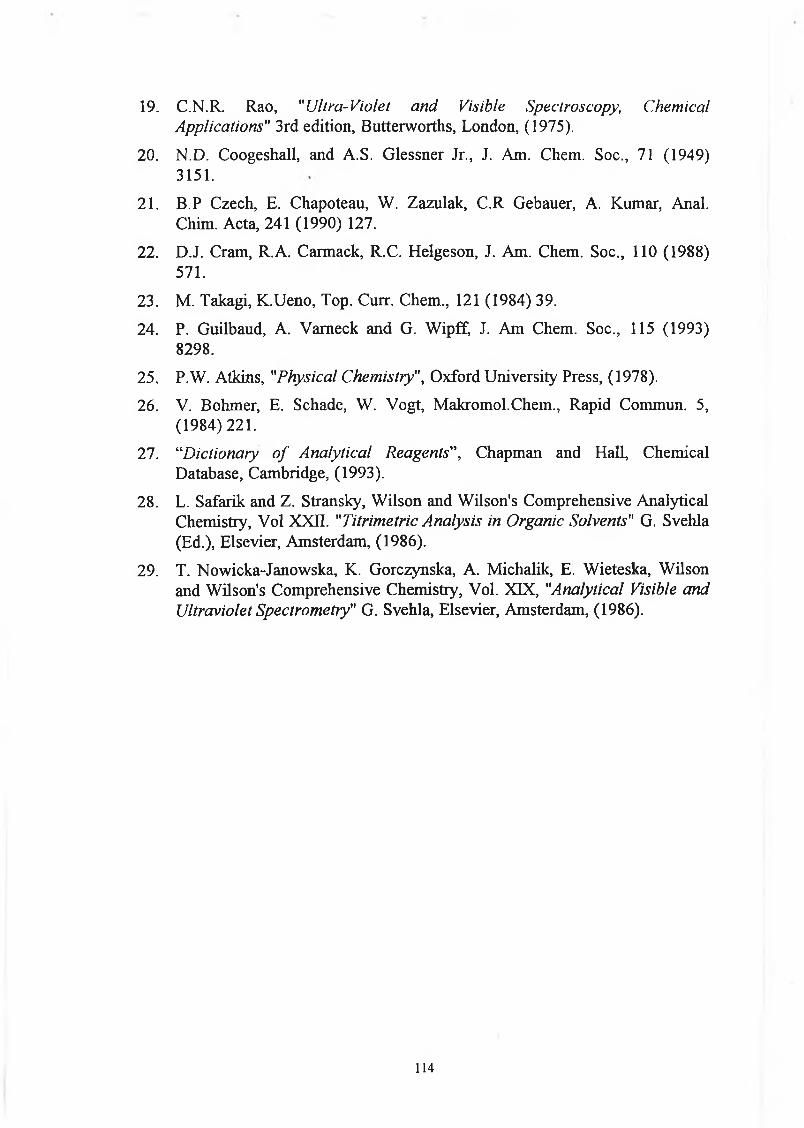
19. C.N.R. Rao, "Ultra-Violet and Visible Spectroscopy, Chemical Applications" 3rd edition, Butterw orths, London, (1975).
20. N.D. Coogeshall, and A.S. G lessner Jr., J. Am. Chem. Soc., 71 (1949) 3151.
21. B.P Czech, E. Chapoteau, W. Zazulak, C .R Gebauer, A. Kumar, Anal. Chim. Acta, 241 (1990) 127.
22. D.J. Cram, R.A. Carmack, R.C. Helgeson, J. Am. Chem. Soc., 110 (1988) 571.
23. M. Takagi, K .Ueno, Top. Curr. Chem ., 121 (1984) 39.
24. P. Guilbaud, A. V am eck and G. W ipff, J. Am Chem. Soc., 115 (1993) 8298.
25. P.W . Atkins, "Physical Chemistry", O xford U niversity Press, (1978).
26. V. Bohmer, E. Schade, W. Vogt, M akrom ol.Chem ., Rapid Commun. 5, (1984) 221.
27. “Dictionary o f Analytical Reagents” , Chapm an and Hall, Chem ical Database, Cam bridge, (1993).
28. L. Safarik and Z. Stransky, W ilson and W ilson's Com prehensive Analytical Chem istry, Vol XXII. "Titrimetric Analysis in Organic Solvents" G. Svehla (Ed.), Elsevier, A m sterdam , (1986).
29. T. N ow icka-Janow ska, K. G orczynska, A. M ichalik, E. W ieteska, W ilson and W ilson's Com prehensive Chem istry, Vol. XIX, "Analytical Visible and Ultraviolet Spectrometry" G. Svehla, Elsevier, Am sterdam , (1986).
114

Chapter 4
Nitrophenylazophenol Calix[4] arenes
115

4.1 Introduction
This chapter deals w ith another set o f novel chrom ogenic calix[4]arenes, which
possess the larger nitrophenylazophenol chrom ophores instead o f the nitrophenol group discussed in C hapter 3. Five novel com pounds, all synthesised by Dr Stephen J. Harris at D .C.U. are discussed. For synthetic details see references [1,
2 ]-
This chrom ophore was chosen in an attem pt to create com pounds whose deprotonated form w ould have a longer w avelength absorbance maxim um than the com pounds containing the nitrophenol group. W e have synthesised several tetram eric calix[4]arenes w hich incorporate a nitrophenylazophenol group as the chrom ogenic m oiety in the ester portion o f the m olecule. Com pounds w ith
longer absorbance m axim a such as these are m ore applicable from an optical sensor point o f view due to the cheap availability o f blue (A,max 470 nm) or green
(^max 565 nm ) LEDs, w hich em it light in the range o f the absorbance m axim a o f
the azophenol group. H ence instrum entation developm ent for these sensors w ould be m uch sim pler than for shorter w avelength analogues as m ore com plex
excitation sources are required in the latter case.
The nitrophenylazophenol group has been used as the chrom ogenic m oiety in m any different cation binding systems. A crow ned azophenol was shown to exhibit lithium specific colour changes in the presence o f an amine [3], structure
4 Q).
/ - K
° >
Com plexation w ith L i+ is thought to occur as outlined in structure 4(ii) [4]. The
Li+ com plexation occurs by m eans o f both the traditional electrostatic interaction
116

Complexation with Li+ is thought to occur as outlined in structure 4(ii) [4], TheLi+ complexation occurs by means of both the traditional electrostatic interaction between the positively charged cation and the 8 ' of the oxygen atoms which make up the spherand ring but also a coulombic interaction with the phenolate anion is thought to be significant since no other cations were found to show any interaction.
A number of amine selective azophenol crown ethers have also been described, with the nature of the amine (i.e. primary, secondary or tertiary) determining the wavelength of the absorbance maximum of the complex with some of the compounds [4], Structure 4(iii) which is a nitrophenylazophenol crowncompound incorporating an amine is one such compound. With this molecule there is utilisation of the phenolate anion and an electrostatic interaction between the oxygens of the spherand ring and the hydrogen atoms of the amine.
0 O- ' ' o
4(11) Crown dinitrophenylazophenol complex, [4],
/ h -~ n ^ h \
\ H
4(iii) Crown dinitrophenylazophenol amine complex [5],
117

A four membered spherand containing the p-nitrophenylazophenol chromogenic group has been shown to display lithium selectivity under hydrophobic conditions with no interaction with any other metals being observed [6 ], The six- membered analogue of this spherand was found to respond to sodium and lithium ions with very little response to any other metal ions [7], (structure 4(iv)). Molecular models (CPK) of the Li+ and Na+ complexes of structure 4(iv) showed both of them to be capsular, an arrangement which would be very difficult to form with K+ due to the larger size of the cation.
4(]v) Dinitrophenylazophenol spherand Li+ complex [7]
Calixarene derivatives, another major class of macrocyclic receptor molecules, have recently evoked interest as a source of novel colorimetric sensors. Two calix[4]arenes bearing azophenol moieties as the chromogenic component have been recently described in the literature [8 , 9], and one has been found to display lithium selectivity in a solid-liquid two phase extraction [8 ], Shimizu et al. deduced from 'H NMR experiments that Li+ is bound to 4(v) as a cation of the azophenolate anion and also interacts electrostatically with the three remaining phenolic oxygens. A dinitrophenylazophenol with a similar calixarene backbone was synthesised and found to respond to the lithium ion in the presence of a number of amines [9].
118

4(v), Nitrophenylazophenol Calix[4]arene, [8 ]
Another calixarene bearing the nitrophenylazophenol chromophore which showed excellent selectivity for potassium against sodium has also been described [10], structure 4(vi). In all three o f these compounds, the phenol group (which is deprotonated to give the colour change upon complexation) is sited within the cavity into which the metal ion fits and complexation actually involves the phenolic oxygen atoms.
x= no2
N = N
Y = CH2(CH20CH2) 3c h 2
4(vi) Dinitrophenylazophenol bridged calix[4]arene, [10].

The five compounds examined in this work are as follows:-
4.2 Structures o f Compounds Under Examination
4 (vii) Ligand 5
:N
OH
o c h 2c o c h 2
0
4 (vii!) Ligand 6
N = N
4 (ix) Ligand 7

4 (x) L ig an d 8
OCH^COEto
9 U r -OCH2COCH2
o
4 (xi) L ig an d 9
All five ligands possess either one, two or four nitrophenylazophenol chromogenic moieties and as in the case o f the nitrophenol moieties, these are classified as ionisable chromophores. In Ligands 5, 6 , and 7 the methylene group of the ester portion of the calixarene is attached in the ortho position of the chromophore, whereas in ligands 8 and 9, the calixarene is attached in the meta position relative to the phenol group. All ligands except ligand 6 , the dichromogenic ligand, have tertiary butyl groups in the para position of the calixarene backbone. Ligand 6 is peculiar to the other non-tetrachromogenic ligands 7 and 9 in that it has two allyl groups attached to the calixarene "arms" rather than ester groups which are seen in Ligands 7 and 9. It also has hydrogen atoms in place o f /-butyl groups in the para position of the calix[4]arene backbone.
121

4.3 Mode of Action
Because all five ligands possess ionisable chrom ophores the m ode o f action described in C hapter 3 w ould be expected to also be applicable to these ligands. The nitrophenylazophenol chrom ogenic m oiety again depends on deprotonation
for a change in colour or an increase in absorbance at the ^ max o f the deprotonated form. The phenolic group is part o f a m uch larger conjugated % system w ith this m oiety than it was in the nitrophenol chrom ogenic ligands. A larger % system bearing azo, phenolic and nitro chrom ophores attached to the arom atic rings w ould be expected to absorb radiation at longer wavelengths than the nitrophenol m oieties [11]. The fundam ental requirem ent o f the presence o f a base to cause a cation induced colour change was exam ined for Ligand 5. No colour change is seen for 2.5 m L o f a 5x10 -5 M solution o f Ligand 5 in THF
upon the addition o f 10‘2 M LiC104. A colour change from yellow to red was noticed im m ediately upon the addition o f TD D A. So again it can be seen that the presence o f a base is required for the uptake o f the phenolic proton.
4.4 Absorbance Spectra of Ligands 5-9
4.4.1 Introduction
M ethod 2.5.1 was used to assess changes in absorbance spectra upon interaction
o f the ligands w ith alkali m etal cations. Solutions (5 x 10⁻⁵ M ) o f Ligand 5, 7, 8 and 9 and 6 x 10~5 M Ligand 6 were m ade up in THF. A 2.5 mL aliquot o f each solution o f ligand w as taken and to this 100 ^iL o f TDD A (tridodecylam ine) were
added to give a final TD D A concentration o f 6x1 O'2 M. This volume o f TDDA was found to be the optim um in studies sim ilar to those described in Chapter 3. Increm ental concentrations o f aqueous lithium perchlorate w ere added to give final m etal perchlorate concentrations o f 10-6 M to 0.1 M in the sample. A fter gentle shaking, the clear yellow ligand solution changed colour to red im m ediately w ith the intensity o f the resultant colour being dependent on the m etal perchlorate concentration. This colour change was exam ined using UV-
Vis spectroscopy in the range 300-800 nm.
A veiy slight colour change to barely orange is seen upon introduction o f the
TDDA to the free ligand and this is seen as a very slight increase in absorbance intensity at 520 nm. H ow ever the bulk o f the ligand remains protonated until the
122

introduction of the metal perchlorate when the colour change to red occurs. This can be explained in terms of equations 3.4 and 3.6 where again Ka(L) < K3 (q. The dissociation constant o f the ligand appears to be reduced sufficiently in the presence of the metal to allow the base to cause deprotonation of the phenolic proton.
4.4.2 Ligand 5, Single-Phase Examination.
Figures 4.1(a) and 4.1(b) show the change in absorbance spectra of Ligand 5 at a concentration of 5x1 O' 5 M with increasing concentrations of lithium perchlorate and sodium perchlorate respectively. No colour change was observed in the absence of base for any of the ligands on addition of LiC104 in control experiments where identical amounts o f the metal perchlorates were added. This is indicative of the deprotonation of the azophenol group upon metal ion complexation being the cause of the colour change, as the presence of the base facilitates the removal of the phenolic proton. A slight colour change from yellow to bronze was noted upon addition of the TDDA, but this is barely discernible as an increase in intensity at the deprotonated >.max.
The protonated form o f Ligand 5 shows ?imax at 380 nm, with an 8 value of 5xl0 4
L mol ' 1 cm'1. As the concentration of LiC104 is increased in the presence of TDDA, the intensity of the absorbance at 380 nm decreases and simultaneously a new peak is observed at 520 nm which is attributed to the formation of the deprotonated complex. This peak increases in intensity with increasing LiC104
concentration. An isobestic point is observed at 424 nm indicating the presence of two absorbing species in equilibrium with each other. As well as the bathochromic Xmax shift seen on deprotonation, a hypochromic shift is also observed. A minimum s value of 3.2xl0 4 L mol' 1 cm ' 1 was estimated from the absorbance obtained for a 0.1 M solution of LiC104. From Figure 4.2 it can be seen that the absorbance is continuing to increase so a lower concentration of the deprotonated form o f the ligand actually exists and therefore this value is an underestimation. A linear range from 10- 4 to 1 0 ' 1 M for LiC104 is obtained (Figure 4.2) with this ligand along with a L.O.D. of c. 5.8 x 10- 5 M LiC104. A slope of 0.519 a.u./dec was found in this range.
A moderate response to NaC104 was observed for 10- 3 and 10- 2 M before a large increase in intensity was seen for 0.1 M. However the actual absorbance for 0.1 M NaC104 was approximately 0.65 a.u. less than that seen for 0.1 M LiC104.
123

This is an immediate indication that higher levels of sodium interferent will be tolerated by this ligand compared to the previously discussed nitrophenol ligands of Chapter 3, which showed comparable LiC104 and NaC104 absorbance at this highest level.
Free Protonated Ligand Deprotonated Complex
Figure 4.1(a):- Lithium Response, L igand 5.
Figure 4.1 (b):- Sodium response, L igand 5.
F igure 4.1:-One-phase investigation o f changes in the absorbance spectrum o f2.5 mL solutions o f 5.0x1 O' 5M ligand 5, in THF with 100 /¿L TDDA, upon addition o f aqueous (a) lithium perchlorate, and (b) sodium perchlorate with fin a l metal perchlorate concentrations o f ; 0.1M (1), IQ-2M (2), 10~3M (3), 10~4M(4), 10'5M (5), 10'6M (6). See Table 2.1.
124

Figure 4.2, a graph of absorbance at 520 nm versus the log of metal perchlorate concentration shows clearly the difference in response of the ligand to the two different cations.
Log [MC104]
Figure 4.2:- Comparison o f absorbance at 520 nm o f the lithium and sodium metal complexes o f L igand 5.
4.4.3 Ligand 6 , Single-Phase Examination.
The absorbance spectra of Ligand 6, the dichromogenic ligand, with incremental increases in LiC104 and NaC104 in the presence of 100 j L of TDDA are shown in Figure 4.3(a) and 4.3(b) respectively.
125

Free Protonated Ligand Deprotonated Com plex
Figure 4.3 (a):- Lithium Response, Ligand 6 .
F igure 4.3 (b):- Sodium response, Ligand 6 .
F igure 4 .3 :-One-phase investigation o f changes in the absorbance spectrum o f2.5 mL solutions o f 6.0x1 O'5M ligand 6 , in THF with 100 juL o f TDDA, upon addition o f aqueous (a) lithium perchlorate, and (b) sodium perchlorate with fin a l metal perchlorate concentrations of; 0.1M (1), 10-2M (2), 10-3M (3), 10r4M(4), 10~5M (5), 10'6M (6). See Table 2.1.
126

The protonated and deprotonated absorbance m axim a for both com plexes occur
at 380 and 520 nm respectively, w ith an isobestic point at 420 nm. For the
protonated form o f the Ligand 380 nm e was calculated to be 2 .5 x l0 4 L
m ol'1 cm"1, w hich corresponds to an approxim ate halving o f e w hen the num ber o f chrom ogenic groups is halved. An underestim ation o f e for the deprotonated
com plex was carried out for the reasons outlined above to be approxim ately 104 L m ol"1 cm '1. The actual m axim um intensity o f the initial protonated ligand is approxim ately 1.4 a.u. com pared to approxim ately 3.0 a.u. for the tetrachrom ogenic Ligand 5. This reduction in absorbance corresponds to the decrease in the num ber o f chrom ogenic m oieties in the two m olecules and is com parable w ith the decrease in intensity observed on exam ining Ligands 1 and
2, the tetra and m onochrom ogenic nitrophenol ligands respectively. The ligand responds to increases in LiC104 above a concentration o f 10'4 M w ith a change in absorbance o f 0.5 a.u. betw een this concentration and 0.1 M. Com plexation w ith
N a+ exhibits an inferior response to that o f LiC104 w ith very little change in
absorbance seen prio r to the addition o f a final N aC 104 concentration o f 0.1 M.
The absorbance o f this h ighest N aC 104 concentration once again is considerably low er than that observed for LiC104 and is seen clearly in Figure 4.4, a graph o f absorbance at 520 nm versus the log o f the m etal perchlorate concentration.
Log [M C104]
Figure 4.4:- Comparison o f absorbance at 520 nm o f the lithium and sodium metal complexes o f L igand 6 , with data obtained from the spectra in figure 4.3.
i l l

The monochromogenic ligand, Ligand 7, the fmal ligand of this series o f ligands possessing the nitrophenylazophenol chromophore with the calixarene attached ortho to the chromogenic phenolic group produced the following spectra. Figures 4.5 (a) and 4.5 (b) show the spectral changes of Ligand 7 in the presence of TDDA, to increases in LiC104 and NaC104 respectively.
4.4.4 Ligand 7, Single-Phase Examination
Free Protonated Ligand Deprotonated Complex
Figure 4.5 (a) .--Lithium response, Ligand 7.
Figure 4.5 (b):- Sodium response, Ligand 7.
F igure 4.5:-One phase investigation o f changes in the absorbance spectrum o f2.5 mL solutions o f 5.0x10'5M ligand 7, in THF with 100 jjL o f TDDA, upon addition o f aqueous (a) lithium perchlorate, and (b) sodium perchlorate with fina l metal perchlorate concentrations of; 0.1M (1), 10'2M (2), 10'3M (3), I0~4M(4), 10~5M (5), 10~6M (6 )
128

The protonated Xmax again occurs at 380 nm, e (1 .3 2 x l0 4 L m ol'1 cm '1). This again corresponds to a halving o f s as the num ber o f chrom ogenic groups is halved. The same A,max is observed for both the lithium and sodium com plexes at
3 1 1 * *520 nm, (smin 4x10 L m ol’ c m ') . Isobestic points are observed at 430 nm. The
superior response o f Ligand 7 to lithium over sodium is illustrated in Figure 4.6.
A linear range for LiC104 is seen from 10~4 to 0.1 M com pared to a range o f 10-3 to 0.1 M seen for N aC 104. A slope o f 0.107 a.u./dec is seen in the range 10-4 to 10' 1 M for LiC104. N o real response is observed for N aC104 until after 10-3 M
N aC 104 has been added and m axim um absorbance reached at 0.1 M N aC104 the h ighest concentration is a m ere 0.2 a.u. The reduction in intensity o f the protonated form o f this ligand com pared to that o f Ligand 6 is again due to the fact that the num ber o f chrom ogenic m oieties has been reduced to one and therefore a reduction in intensity is expected. The absorbance due to a num ber o f separate chrom ogenic groups w hich are not conjugated on a m olecule is additive and therefore a reduction in the num ber o f chrom ogenic moieties avaliable for absorption w ill decrease the observed absorbance [ 12 ],
A slope o f 0.059 a.u./dec is seen for the three points in the range 10-2 M, 5 x l0 ‘2 M and 0.1 M N aC 104 This signifies a slight departure from the behaviour o f
Ligands 5 and 6 tow ards LiC104, w here there w as no significant response until a final N aC104 concentration o f 10-2 M had been added. However, the actual total absorbance change in the concentration range in w hich the ligand appears to be responding to the presence o f N aC 104 is only 0.1 a.u., w hich would be a m ajor lim iting factor for its application as a N a+ sensing m aterial in the absence o f Li+.
Figure 4 .7 shows the large increase in intensity observed as the num ber o f chrom ogenic groups on the m olecule is increased. The large absorbance change o f Ligand 5 w ith increasing LiC104 would render it m ore useful as a visual indicator than the m ore subtle colour changes exhibited by Ligands 6 and 7.
129

Log [MCIO4 ]
Figure 4.6:- Comparison o f absorbance a t 520 nm o f the lithium and sodium metal complexes o f L igand 7, with data obtainedfrom spectra in figure 4.5.
Log [LiC104]
Figure 4 .7:-Comparison o f the response o f Ligand 5, 6 , and 7 to the presence o f varying concentrations o f LiClO*
130

Ligands 8 and 9 are the tetrachrom ogenic and m onochrom ogenic ligands o f
another class o f chrom oionophore. The chrom ogenic m oiety is attached to the
calixarene backbone m eta to the phenolic group o f the nitrophenylazophenol.
Figure 4.8 shows the absorbance spectrum for Ligand 8 in the presence o f 100
H-L o f TDD A w ith increasing concentration o f LiC104 from 10'6 to 10' 1 M.
Ligand 8 does not have a clear protonated Amax in the visible region because the absorbance continues to increase as it approaches the ultraviolet region o f the spectrum. There is very little difference in intensity betw een the peaks in the region below 400 nm w here absorbance o f the protonated form would be expected. The deprotonated com plex A.max occurs at approxim ately 540 nm w ith broad flat peaks being visible, m aking an exact Xmax determ ination difficult.
Figure 4.9 shows the response o f this ligand to LiC104. A linear range o f three orders o f m agnitude from 10~3 M to 0.1 M is again evident w ith an increase in
absorbance above 10*4 M , indicating an LOD betw een 10-3 and 10-4 M LiC104.
The absorbance response range o f 0.2 a.u. obtained is how ever very small
com pared to the range o f 1.6 a.u. seen for the other tetrachrom ogenic ligand,
L igand 5, over a sim ilar concentration range The slope o f the response from 10'3
to 10_1 M is 0.096 a.u./dec.
4.4.5 Ligand 8 and 9, Single-Phase Examination.
131
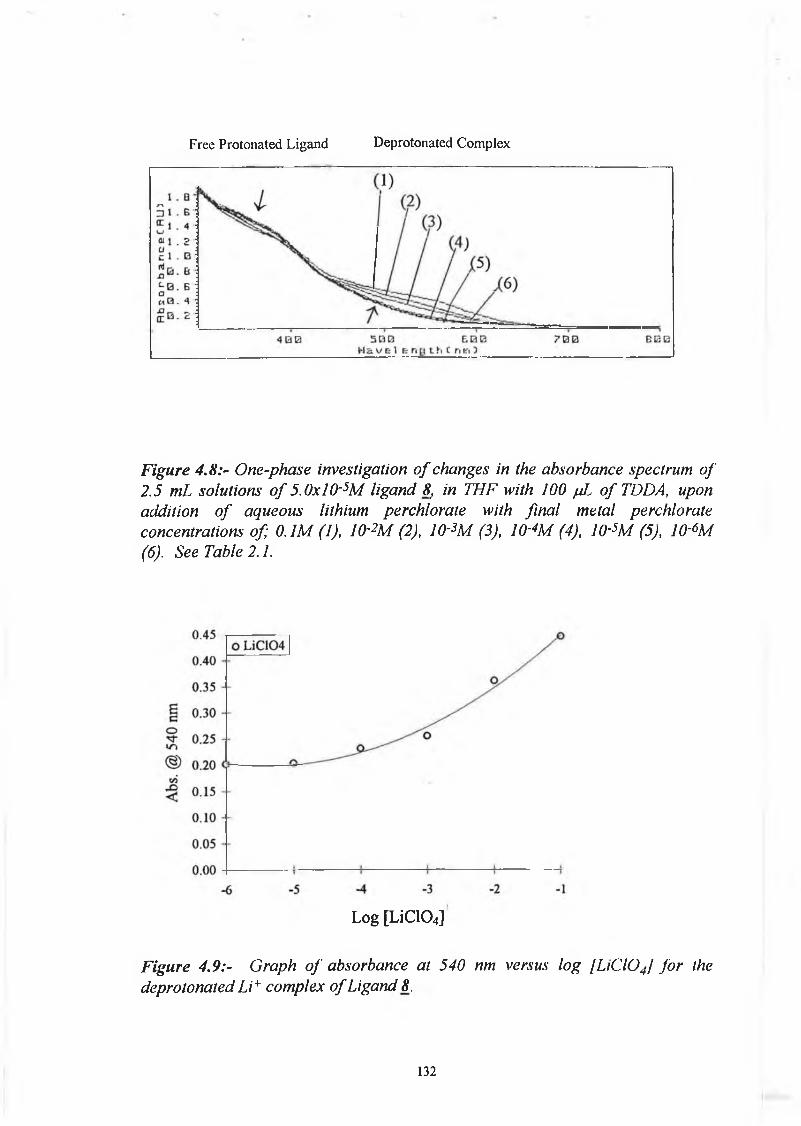
Free Protonated Ligand Deprotonated Com plex
F igure 4.8:- O ne-phase investigation o f changes in the absorbance spectrum o f2 .5 m L solutions o f 5 .0x10~5M ligand 8, in T H F with 100 ¿iL o f TDDA, upon addition o f aqueous lithium perchlorate with fin a l m etal perchlorate concentrations of; 0 .1M (1), 10'2M (2), 10'3M (3), 10'4M (4), 10'5M (5), 10'6M (6). See Table 2.1.
Log [LiC104]
F igure 4.9:- G raph o f absorbance at 540 nm versus log [L iC lO J fo r the deprotonated L i+ com plex o f L igand 8.
132

The spectra obtained for the LiC104 interaction w ith Ligand 9, the m onochrom ogenic ligand o f this series are shown in Figure 4.10. Ligand 9 shows a clearer protonated XmaK at 380 nm than that seen with Ligand 8. The
deprotonated Li+ com plex has a Xmax o f 540 nm in the presence o f TDDA. The
response curve for this ligand is seen in Figure 4.11.
Free Protonated Ligand Deprotonated Complex
Figure 4.10:- One-phase investigation o f changes in the absorbance spectrum o f 2.5 mL solutions o f 5.0x10'5M ligand 9, in THF with 100 juL o f TDDA, upon addition o f aqueous lithium perchlorate with fina l metal perchlorate concentrations of; 0.1M (1), 10~2M (2), 10~3M (3), 10'4M (4), 10~5M (5), 10~6M (6). See Table 2.1.
Log [LiC104]
Figure 4.11:- Graph o f absorbance at 540 nm versus log [H C104] fo r the
deprotonated L i+ complex o f Ligand 9.
133

The absorbance change with this ligand is the poorest observed extending from0.15 to 0.28 a.u. but inspite of this a discemable linear range from 10'3 M to 0.1 M is again observed with practically no change in absorbance seen, prior to the addition of 10'4 M LiC104.
4.5 Selectivity Determination
Selectivity coefficients were determined using Method 2.5.2 described in Chapter 2, with fixed background interferents of 0.05 and 0.1 M NaC104. These higher interferent levels were used with this set of ligands compared to those used with the nitrophenol ligands because of the poorer response observed in the presence of NaC104 for the nitrophenylazophenol ligands seen in section 4.4. Spectra were obtained from 300-800 nm and graphs of absorbance at 520 nm for Ligands 5, 6 and 7, and 540 nm for Ligands 8 and 9 versus the log of the concentration of lithium perchlorate drawn. At high concentrations, the sodium ion has the effect of reducing the response of the ligand to the lower concentrations of LiC104 as it dominates the complexation process with the ligand and swamps any lithium ion effects. However, at higher lithium ion concentrations, a response will be observed because of greater affinity of the ligand for lithium ions. From these graphs, selectivity coefficients can be estimated from the ratio of the sodium and lithium ion concentrations at the intersection of the sodium and lithium dominant response regions of the curves.
Figure 4.12 (a), (b) and (c) shows the absorbance at 520 nm versus the log of the lithium perchlorate concentration for Ligands 5, 6 and 7 respectively at each level of sodium perchlorate interferent.
134

Log [LiCICX,]
Figure 4.12 (a):- Selectivity, Ligand 5.
LogfLiClCU] \
Figure 4.12 (b):- Selectivity, Ligand 6.
135

Log [LiC104]Figure 4.12 (c)¡-Selectivity, Ligand 7.Figure 4.12:- One-phase studies of the optical response of solutions at 520 nm of (a) 5x10~5 M Ligand 5 , (b) 5x1 O'5 M Ligand 6, and (c) 6x1 O'5 M Ligand 7, in THF with 100 fjL TDDA, with varying concentrations of lithium perchlorate in the presence offixed concentrations of sodium perchlorate (0.1 and 5x1 O'2 M)
The monochromogenic ligand, Ligand 7, displayed the best lithium against sodium selectivity. Selectivity coefficients of 73.5, 50.0 and 31.6 against 0.05 M sodium and 73.3, 36.8 and 31.5 against 0.1 M sodium for Ligand 7, 6 and 5 respectively were estimated. These values are an improvement on those obtained previously with the nitrophenol ligands [Chapter 3], but since different interfering ion concentrations were used, and as can be observed from the results obtained, selectivity is a function of the concentration of the interfering ion, the values cannot be compared directly.
Figure 4.13 (a) and (b) show the selectivity diagrams at 540 nm for Ligands 8 and9. Inspite of the narrow absorbance change seen over the LiC104 concentration range for both ligands it was still possible to observe the effect of fixed NaC104 concentration of 10*2 M and 0.5 M on the LiC104 response curve and thereby calculate selectivity coefficients. Again the monochromogenic ligand of the series, Ligand 9, demonstrated slightly superior selectivity over its tetra chromogenic counterpart. The selectivity coefficients KLiNa of 50 and 12.5 were
136

obtained for Ligands 9 and 8 respectively with a fixed background interference of 5 x IO-2 M NaC104.
Log [LiC104]
Figure 4.13(a).'-Selectivity, Ligand 8.
Log [LÌCIO4] 1
Figure 4.13 (b):- Selectivity, Ligand 9.Figure 4.13:- One-phase studies of the optical response at 540 nm of solutions of 5x1 O'5 M solutions of (a) Ligand 8 , and (b) Ligand 9, in THF with 100 fiL TDDA, with varying concentrations of lithium perchlorate in the presence of fixed concentrations of sodium perchlorate (a) 0.01 & 0.05 M, (b) 0.05 & 0.1M.
137

A comparison of KLiNa selectivity coefficients for all of the nitrophenylazophenol ligands is shown in table 4.1.
Table 4.1:-Selectivity Coefficients for Ligands 5-9.
Ligand fNa+l / M KLiNa5 0.1 31.55 0.05 31.66 0.1 36.86 0.05 50.07 0.1 73.37 0.05 73.58 0.05 12.58 0.01 10.09 0.1 23.49 0.05 50.0
4.6 Two Phase Analysis of Nitrophenylazophenol Ligands 5 to 9
4.6.1 Choice of Water Immiscible Solvent
Prior to the examination of the ability of the nitrophenylazophenol ligands to extract cations from an aqueous layer into an immiscible organic layer, a suitable organic solvent had to be found. A suitable organic phase is one which can maintain both the complexed and uncomplexed form of the ligand in it, and prevent any leaching of either form of the ligand into the aqueous phase.
A number of solvents were examined by making up 5x1 O'5 M solutions of Ligand 5 in each of a range of solvents. 20 pL of triethylamine (TEA) was added followed by 10 pL of 1 M LiClC>4 to give a final LiC104 concentration of 4xl0‘3 M. Finally 2.5 mL of water was added. Any colour changes upon each addition were noted as was the ability of any colour generated to remain in the organic layer. Blank experiments were carried out for each solvent containing eveiything except the lithium perchlorate for comparison purposes. The colorimetric response observed for each solvent is summarised in Table 4.2.
138

Table 4.2:- Examination o f water immiscible solvents for two phase
experiments.Solvent Colour upon addition
o f TEAColour upon addition ofL iC lO j
Colour upon addition o f water
1 .Dichloromethane Yellow -> orange Increase in orange colour
Org. Increase in orangeAq .Orange and cloudy
2. Butan-l-ol Yellow -> orange Slight increase in orange
Org. Red Aq. Colourless,
3. Butanone Yellow -> bronze Red/ Purple Org. No changc in colour. Cloudy Aq. Red/purple
41,1,1T richloroethane Remained yellow Orange Org. No change in colour. Cloudy.Aq. Orange
5. Butan-2-ol Yellow -> orange Red/purple Org. RedAq. Clear colourless
Due to the fact that butan-l-ol was capable of retaining all of the colour produced by the ligand-metal-base reaction, it was chosen as the solvent to further examine all three ligands. Butan-2-ol was also tested and although it gave similar results it was found to take up to 30 minutes for it to settle out from the aqueous phase after the two phases had been mixed. Butan-l-ol took approximately 15 minutes to separate from water after the two phases had been mixed. It was found that by using TEA, a large increase in colour intensity which was independent of metal perchlorate concentration was noticed upon addition of water to the system. It was therefore decided to use a weaker and more hydrophobic base. TDDA was examined as an alternative base. The pKa of TEA in water is 11.01 [13] whereas TDDA has a lower value of 10.6 [14]. Although a different, less polar solventi.e. butan-l-ol, is being used, it would appear that relative to each other TEA is also a stronger base than TDDA in this solvent.
Upon addition of TDDA a colour change from yellow to barely orange was noted. This colour was stronger than that observed when TDDA was added to solutions of the ligand in THF.
Figure 4.14 shows the change in the single-phase UV-Vis absorbance spectra of Ligand 5 dissolved in butan-l-ol in the presence of TDDA, produced by varying concentrations of LiC104 using Method 2.5.4 In butanol the maximum absorbance wavelengths were observed at 500 nm for Ligands 5, 6 and 7 with isobestic points at 425 nm. Upon addition of water to the system no colour transfer to the aqueous phase was noted even after a number of days.
139

Ligand 5 demonstrated the ability to extract LiC104 from an aqueous phase into the butan-l-ol phase which contained the ligand and the lipophilic base TDD A. The following spectra, shown in Figure 4.15, were obtained when the concentration of LiC104 was incrementaly increased from 10-6 to 10-1 M in the aqueous phase using Method 2.5.4.
Free Protonated Ligand Deprotonated Complex
Figure 4.14:- One-phase investigation of changes in the absorbance spectrum of 2.5 mL of a 5x1 O'5 M solution of Ligand 5 in butan-l-ol with 100 pL ofTDDA, upon addition of lithium perchlorate, to give final concentrations of (I) 0.1 M, (2) 10~2 M, (3) 10-3M, (4) 10'4M, (5) 10~5 M, (6) 10~6 M. See Table 2.1.
Figure 4.15:- Two phase study showing changes in the absorbance spectrum of the organic (butan-l-ol) phase for 5 xlO'5 M Ligand 5 , with 20 pL of TDDA, when lithium perchlorate was added to the aqueous phase of the two phase system to give the following aqueous phase concentrations (1) 0.1 M, (2) 10~2 M, (3) 10~4 M, (4) 10-5M, (5) 10'6 M.
140

Although the same absorbance changes observed in the one phase work are not achieved, a discemable difference in absorbance is observed above 10-4 M LiC104. A higher initial absorbance is seen for the ligand-TDDA mixture in the two-phase system compared to that of the one-phase system in butanol. Visually there is an increase in the colour seen when TDDA is added to the two phase system compared to when it is added to the one phase system. This could be attributed to a greater degree of hydration of the ligand-base-solvent mixture which would make the overall medium more polar resulting in an easier deprotonation of the phenolic hydrogen in the presence of the base.
For Ligands 6 and 7, no colour transfer into the aqueous phase was observed after complexation, however the ability to distinguish between the different levels of L1CIO4 has been lost with an even more intense initial TDDA-ligand peak at 500 nm (see Figure 4.16 and 4.17) being observed. None of the ligands was found to undergo significant deprotonation in just the presence of TDDA. However, the lack of transfer of the deprotonated complex to the aqueous phase is significant from a sensor point of view. Ligand 5 has the ability as was mentioned to extract Li+ from the aqueous phase and further modifications of the properties i.e. basicity of both phases, could result in larger spectral variations beteween the different LiClC>4 concentrations.
141

Free Protonaled Ligand Deprotonated Complex
Figure 4.16:- Two-phase study showing changes in the absorbance spectrum of the organic (butan-l-ol) phase for 5 xlO'5 M Ligand 6 , with 20 fjL of TDDA, when lithium perchlorate was added to the aqueous phase of the two phase system to give the following aqueous phase concentrations (1) 0.1 M, (2) 10~2 M, (3) 10-3 M' (4) 10-4 M, (5) j o - 5 m , (6) 0 M, (7) 0 M, 0 M TDDA.
Figure 4.17:- Two-phase study showing changes in the absorbance spectrum of the organic (butan-l-ol) phase for 5 xJ0~5 M Ligand 7_, with 20 ¡jL of TDDA, when lithium perchlorate was added to the aqueous phase of the two phase system to give the following aqueous phase concentrations (1) 0.1 M, (2) 10-2 M, (3) 10-3M, (4) 1(HM, (5) 10* M, (6) JO^MJ OM, 0 M TDDA (7), .
142

4.7 NMR Complexation Studies
JH-NMR experiments were carried out using Method 2.5.5. The ‘H-NMR spectrum (Figure 4.18(a)) of the ligand between 0 and 0.5 ppm, is not as complicated in this region as the spectrum obtained for Ligand 1_ (Figure 3.13(a)). It shows the typical tetrameric calixarene single AB system at 3.2 and 4.75 ppm arising from the non-equivalence of the protons in the Ar-CH2-Ar methylene bridging groups forming the calixarene annulus, and the strong resonance of the para-t-butyl groups at 1.1-1.2 ppm [15]. The high-field doublet at 3.2 ppm as was stated in Chapter 3 was previously assigned to the equatorial protons Hg and the low-field doublet at 4.75 ppm has been assigned to the axial protons HA (4(xiv)) [16]. The complex features around 1.0-1.5 ppm are thought to arise from a distorted cone structure in the calixarene, i.e. the annulus is twisted possibly by intra molecular hydrogen bonding which render the para-t-butyl groups nonequivalent [17].
R = /M-butyl4(xii) Cone shaped Calix[4]arene Showing the Bridging Methylene Protons, (the double bonds of the aromatic rings have been omitted to aid clarity).
iH-NMR spectra (Figure 4.18a-c) of different molar ratios of NaSCN to 5 (both in CD3OD) strongly suggest that the molecular conformation of the ligand becomes much more ordered on complexation. Figure 4.18 (b) shows the effect of adding 0.5 mole equivalent of sodium thiocyanate to the ligand (where [Na+]/[ligand] = 0.5). Two new doublets associated with the AB system have appeared at 3.4 and 4.3 ppm. The reduction in separation of these doublets is caused by changes in the environment of the bridging methylene protons brought about by the presence of M+ which has the effect of changing the angle of the CH2 protons. The upfield shift of the HA protons to 4.3 ppm indicates that these protons are very sensitive to small variations in the polar environment of the aromatic ether and ester oxygens which are in close proximity and that they have become more shielded from the effects of this hydrophilic cavity made up of the
143

oxygen heteroatoms. The HB protons experience a down-field shift to 3.4 ppm as they become less shielded from the effects of the hydrophilic cavity. This is due to a slight change in the angle of the HB protons upon metal ion inclusion. The convergence of the HA and HB protons is indicative of the occurrence of complexation with the cation [15-17],
Another important spectral change occurs at this level of NaSCN. A simplification of the signals due to the /-butyl protons is evident and is indicative of a more ordered structure being conferred on the whole molecule with complexation [15-17], Such an interpretation is consistent with both x-ray crystal studies of calixarenes and their complexes [18] and with molecular dynamics studies [19] which were discussed in Chapter 3.
Addition of a 1.0 mol equivalent of sodium (R=1.0, Figure 4.18(c)) leads to the complete disappearance of the complex feature at 1.0-1.5 ppm, replaced by a single, strong resonance at 1.2 ppm, and the full development of the new doublets of the AB system at 3.4 and 4.3 ppm. Further change in the metal-to-ligand ratio has no effect on the JH-NMR spectrum. No colour change was noted during any of the above experiments in contrast to the experiments performed in the presence of a base discussed earlier (section 4.2.2). Above a concentration of 1 mole equivalent, any subsequent addition of NaSCN resulted in no further positional shifts in the ^ NMR spectrum. This is indicative of a 1:1 metal- ligand stoichiometry.
144

AJA_A•1 ........... ■ ' , ■ ■ » ■ , ■ ■ ■ i ■ ■ ■ .. ..................................
4 .0 3 .0 2 .0 1 .05
Figure 4.18:-The effect of complexation with Na*on the lNMR spectrum of 5. Aliquots from a CD3OD solution of 1.0 M NASCN were added directly to a 2.3 mM solution of 5 in CDCl3 in an NMR tube, p-tert-butyl H; HA, Hn =ArCH2Ar. Conditions: (a) [NaSCN]/[S] = 0 (no metal added); (b) [NaSCN]/[5] =0.50; (c) [NaSCN]/[5J =1.00. See Method 2.5.5.

4.8 Discussion
Five novel chromogenic calix[4]arenes bearing nitrophenylazophenol groups have been examined and (like three of their nitrophenol counterparts, see Chapter 3) they all displayed lithium selectivity over sodium.
Table 4.3:- Comparison of Data obtained for Ligands 1 to 9 obtained from UV- _________________________ Vis experiments_________________________
Ligand [Ligand] Prot.
^max
Deprot.Li+
m:n.
Li+ Lin. range
Li+Slopea.u./dec
L.O.D.(M )
K Li,N a
1 5 x l0 -5 350 424 10-4 - 5x10⁻² 0.325 < 10-4 25.1 a
2 7x10⁻⁵ 350 424 0 I 1 o 1 LO 0.250 < 10-4 34.7 a
3 5x10⁻⁵ 350 424 10-4- 5 x l 0 '3 0.900 < 10-4 43 \ a
4 5x10⁻⁵ 330 416 10-5-10-3 w .o < lO ’ 5 ~ 10 ^
5 5x10⁻⁵ 380 520 i o - M o - 1 0.519 < lO '4 31.6 b
6 6x10*5 380 520 l O - M x l O ' 2 0.66 < l O '4 50.0 b
7 5x10⁻⁵ 380 520 i o - M o - 1 0.059 < lO '4 73.5 b
8 5x10⁻⁵ n.d * 540 i o - M o - 1 0.096 < lO '3 12.5 b
9 5 x l0 -5 n.d.* 540 S x l O - M O - 1 0.039 < lO ’ 3 50.0 b
* n.d. - not determinable
a Selectivity determined w ith a N a C104 interfèrent concentration o f 10*2 M
b Selectivity determined w ith a N a C104 interfèrent concentration o f 5x10"^ M
The absorbance maximum for both the Li+ and Na+ complexes appears at the same wavelength, for all of the ligands i.e. 520 nm for Ligands 5 to 7 and 540 nm for Ligand 8 and 9, suggesting the existence of a similar mode of complexation for both cations. A variation in Xmax with the complexation of different cations is seen in the case of neutral chromoionophores in which the chromogenic moiety is sited either within or in close proximity to the ionophoric cavity [20], structure 40011) For example, inclusion of a cation into the cavity of this structure, (part of which was made up of the neutral chromogenic moiety), resulted in an electronic disturbance which propagated through the whole n and k system. Thus variations in the extent of interaction between the chromogenic moiety and the various cations, resulted in variations in the resulting Xmax of the complexes formed. A similar situation was described in Chapter 3 for Ligand 4, in which the ionisable phenolic chromophore was housed within the calixarene cavity.
146

4(xii)Neutral Chromoionophore [20],
Ligands 8 and 9 showed two main differences to Ligand 5 to 7.• Firstly they displayed a deprotonated complex A,max at longer wavelengths i.e
540 nm vs. 520 nm.• Secondly, the actual intensity produced upon metal-ion complexation was
much lower than for Ligands 5 to 7 i.e. for the two tetrachromogenic Ligands 8 and 5, maximum absorbances of 0.45 a.u. and 2 a.u. respectively were obtained.
In both of these the calixarene backbone is attached in the meta position relative to the ionisable phenolic group of the chromogenic moiety whereas in Ligands 5 to 7 it is attached in the ortho position. This change in positions of the phenolic group may result in it being too remote from the hydrophilic cavity to allow significant interaction between the deprotonated chromophore and the cavity housing the metal cation. Therefore, the electronic transitions responsible for generating the deprotonated complex spectrum are not as favourable as before. This emphasises the difficulty in producing a successful “designer” molecule, since the interactions involved in generating the colour change are very subtle and impossible to predict.
The spectral peaks observed with these ligands were found to be much broader than those seen for the nitrophenol ligands (Ligands 1 to 4), This is possibly due to a more complex intramolecular energy being involved with these larger, more complex chromogenic groups [12].
Cause of ColourThe principle on which these molecules change colour on complexation in the presence of a base, is the same as that described for Ligands 1 to 3, since again we are dealing with ionisable chromoionophores. These ligands also depend on the dissociation of the phenolic hydrogen of the chromogenic moiety (in this case a nitrophenylazophenol) for colour generation.
147

Mode of ComplexationThe equations and equilibria outlined in Chapter 3 (3.1 to 3.9) are again fundamental to understanding the role played by the ligands, the base and the metal cations. No real colour change is observed with the addition of the base prior to the addition of LiC104 or NaC104. This again signals that the inclusion of a metal cation into the calixarene cavity is exerting an effect on the ionisable chromophore, thereby lowering its pKa and facilitating proton uptake by the base. The UV-Vis experiments in section 4.4 clearly indicate a spectral response to Li+ at lower concentrations than Na+, with the inclusion of the cations causing an increase in the absorbance of the deprotonated complex Xmax.
The variation in response to different cations, as was stated in Chapter 3, is a function of both the stability constant p of the complex, and of the effect the inclusion of a cation has on the pKa of the dissociating phenolic proton. Cavity size and level of preorganisation for cation inclusion is important in determining the magnitude of (3 as is the number of heteroatoms (in this case oxygen atoms) available for electrostatic interaction with the incoming cation by formation of the hydrophilic cavity [21]. Since calix[4]arenes tetraesters make up the ionophoric part of the molecule with Ligands 5, and 7 to 9 from the outset it would be expected that they would show optimum uptake of smaller cations i.e. Na+ and K+ as opposed to the larger Cs+ and Rb+ which have been found to be more likely to be complexed by the calix[6]arenes which have a much larger cavity available [25], In previous studies where calix[4]arene tetraesters [23, 24] and ketones [25] were incorporated into PVC membranes and used for potentiometric measurements selectivity was observed for Na+ over K+ with very little or no response to Li+. Similarly in extraction studies using similar calix[4]arenes [22], sodium selectivity over K+ and Li+ was again observed. Therefore as with the nitrophenol ligands of Chapter 3, the Li+ selectivity was quite surprising. Potentiometric studies with Ligand 4 were attempted but due to to solubility problems of the membrane components no conclusive results were obtained. The reduced spectral response observed with the introduction of NaC10 4 is likely to be associated more with the effect Na+ has on the pKa of the ionisable phenol compared to Li+ than it has to do with the stability constant P of its complex. Undoubtedly complexation occurs with Na+ (as shown by 'H NMR experiments to be discussed below) and Li+, but the less densely charged Na+ cation cannot quite exert the same effect on the pKa of the phenolic proton of the chromophore a phenomenon which has been reported by other workers [26, 27],
148
Therefore complexation with Li+ occurs at lower concentrations than Na+, although the Na+ cation may possibly be more suited to the size of the calix cavity, but the possibility that Li+ enters the cavity in its hydrated form, thus increasing its ionic radius may not be ruled out.
Therefore, both the pKa and stability constants of the complexes are both interrelated and interdependent when it comes to determining which cation will cause the greatest spectral change. Once complexation occurs, the relinquishing of the proton by the chromogenic moiety to give effectively a molecule which is overall neutral, is energetically more favourable than it would be for the molecule to remain with a single positive charge.
On examining the structures of the ligands 5 to 7 it can be seen that the deprotonating phenol group is potentially much closer to the ester groups directly attached to the calix[4]arene backbone than was the case with Ligands 1 to 3 and therefore there is greater potential for the inclusion of a cation in the hydrophilic cavity to exert an effect on the chromogenic moieties. A greater degree of preorganisation may even be afforded by the chromogenic phenolic oxygens. The lack of suitable crystals for the x-ray analysis of either the ligands or their complexes again precludes a definitive explanation of the exact interaction of the hydrophilic cavity containing the cation and the chromogenic moiety.
SelectivityA slight improvement in KLiNa was observed with these nitrophenylazophenol ligands compared to the nitrophenol ligands of Chapter 3, with a maximum of a 75-fold selectivity being seen for the monochromogenic ligand, Ligand 7. The reasons for Li+ selectivity were outlined above. Higher concentrations of sodium were tolerated with these ligands in the presence of lithium, which is a reflection on the difference in the shape of the response curves observed by the nitrophenylazophenol ligands compared to those observed for the nitrophenol ligands, see Figure 4.19 for comparison. With the nitrophenol ligands, although no significant response was observed before a final concentration of 10*3 M NaC104 had been added, the highest concentration of 0.1 M NaC104 exhibited an absorbance at the deprotonated A.max at approximately the same level as that exhibited by the 0.1 M LiC104 solutions. In contrast the response to 0.1 M NaC104 for the nitrophenylazophenol ligands was seen at much lower levels to that of 0.1 M LiC104.
149

0.5
0.45
0.4
0.35
0.3
0.25
0.20.15
0.10.05
0
Log [LiC104]
Figure 4.19'.-Comparison ofLi+ response for monochromogenic (1) Nitrophenol Ligand 2 and (2) nitrophenylazophenol Ligand 7.
In terms of chromogenic determination of Li+, an approximate 75 fold selectivity is a slight improvement on the nitrophenol ligands described in Chapter 3 but is still a good deal away from the ideal situation where a 1000 fold selectivity for Li+ over Na+ is the optimum.
The use of the nitrophenylazophenol ligands accomplished one of the aims set out at the start of this chapter, to achieve larger Xmax shifts and therefore move the deprotonated A,max into a more useful region of the spectrum in terms of instrumentaion development. A bathochromic shift on deprotonation from 380- 520 nm is observed for these ligands compared to a shift from 350-426 nm for the nitrophenol ligands, with the molar extiction coefficient values (e) being large enough (i.e 5 x 10³ - 105 L mol'1 cm'1) for use as the indicator components in optical sensors.
150

Solvent EffectsOn changing the solvent from THF to Butan-l-ol, a hypsochromic Xmax shift of 20 nm was observed. Butanol is a slightly more polar solvent than THF i.e. dielectric constant (butanol) =17.8, dielectric constant (THf) = 7.6 [13]. The greater ionising ability of butan-l-ol would be expected to result in a greater degree of phenolic dissociation in the presence of TDDA. Effectively the whole medium is slightly more polar than was the case with THF. This increased colour is indicative of a solvent dependency on coloration with (in this instance) butan-l- ol being a more polar solvent than THF and therefore a variation in A.max would be predicted in this new medium.
This decrease in A,max concurs with the behaviour seen for Ligands 1 to 3 on changing solvent from THF to either methanol or butan-l-ol. A hypsochromic shift like that observed here on going to a more polar solvent has been associated with n-»7t* transitions [28], Polar solvents tend to stabilise both the non-bonding electronic states and n* excited states of polar chromophores like those in Ligands 5 to 7 causing the transitions to move to higher energies. However, as with the Ligands 1 to 3 the intensity of these ligands is quite large i.e. protonated ligand at 5x1 O'5 M has an extinction coefficient of 2.8x10⁴ M_1cm_1. Such a strong absorbance is generally associated with the "allowed" n to n* transition.
Confirmation o f ComplexationConfirmation of metal ion complexation was again demonstrated in the absence of colour generation by !H NMR spectroscopy experiments in which characteristic peak shifts were observed upon addition of NaSCN to Ligand 5.A number of conclusions can be drawn from these experiments:-
• Complexation was judged to have occurred, as the signals for the HA and HB protons were seen to move towards each other on metal-ion inclusion.
• On formation of the complex, the ligand adopts a much more symmetrical conformation. This was seen in the simplification of the signals due to the t- butyl peaks into a singlet.
• No further spectral shifts were observed after a 1:1 metal:ligand ratio had been reached and therefore the metal-ligand complex was concluded to have a 1:1 stoichiometry, with the equilibrium favouring the formation of the complex.
151

• No deprotonation of the ligand occurs on complexation since no base was present. This again highlights the point that for colour generation two processes have to occur, namely
1. Cation inclusion depending on (32. Effect on pKa —> phenolic proton exchange with suitable base,
and that in the absence of either of these, a colour change will not occur. (See discussion earlier for processes).
Two-Phase StudiesThe two phase results for Ligand 5 were the best seen for all of the ligands examined in terms of combining two important properties i.e ability to extract Li+ from an aqueous phase causing a colour change in the organic phase, and also ability to maintain the deprotonated complexed form in the organic phase. Ligand 5 demonstrated the ability to extract Li+ from an aqueous phase causing a colour change, (Figure 4.15) with the intensity of the colour produced being dependent on the LiC104 concentration in the aqueous phase. Above 1CT4 M LiC104 (spectrum 4 of Figure 4.15) a discernible increase in absorbance at the deprotonated A.max was seen with increasing LiC104 No colour transfer due to the deprotonated complex transferred into the aqueous phase. Neither Ligand 6 nor Ligand 7 exhibited a transfer of colour into the aqueous phase, but the ability to distinguish between different concentrations of LiC104 had been lost. The lack of colour transfer with the nitrophenylazophenol ligands compared to the nitrophenol ligands is due to the much more lipophilic nature of this chromogenic moiety. The effect of a second aromatic ring seems to outweigh the effect of the hydrophilic nitro and phenolic chromophores and stabilises the molecule in the organic phase.
The increased absorbance seen for the deprotonated form of Ligands 6 and 7 in butanol compared to THF, (compare 4.16 with 4.3 (a) and 4.17 with 4.5 (a)) in the presence of only the base is indicative of the effect a change in solvent has on the pKa of the ionisable phenilic group. The higher dielectric constant of butan- l-ol compared to THF seems to effect the pKa of the Ligands 6 and 7 to a greater extent than Ligand 5 where only a slight change in absorbance was seen in the absence of Li+. Another factor which could be causing the high absorbance of Ligands 6 and 7, (Figure 4.16 and 4.17) in the two phase system is the influence the amphiprotic solvent, water, has on the polarity of the organic phase. Although two separate layers form when butan-l-ol and water are mixed, a
152

ceratin percentage of water is soluble in butan-l-ol i.e. 20.5% w/w, [29]. Therefore after mixing there will be a considerable water content in the organic phase. This will have the immediate effect of increasing the overall polarity of the solvent, thereby facilitating the existence of ions, and from the two-phase spectra of Ligand 6 and 7 it would appear that it is altered sufficiently to effect the dissociating phenolic proton of both of these molecules. Ligand 5 does not appear to be quite as susceptible to this potential effect and may be indicative of the four chromogenic moieties of this molecule taking up a conformation which reduces the effect of subtle solvent changes on the phenolic protons.
The higher intensity of the Ligand-TDDA peaks for both Ligand 6 and 7 may be a possible indication of a difference in initial pKa of the phenolic protons of both of these compared to Ligand 5. In Ligand 5, which has four chromogenic nitrophenylazophenol groups, there is a possibility of intramolecular H bonding between adjacent phenolic groups of the chromogenic groups, since rotation of these groups about the OCH2-(C*OH), (where C* represents the chromogenic moiety) bonds would be possible. With Ligands 6 and 7 this would not be possible as these ligands contain only one or two chromogenic moieties respectively, and the introduction of water may result in H bonding with the phenolic oxygens of the chromogenic moieties which could facilitate phenolic proton transfer to TDDA as the immediate environment around the phenols would be more polar leading to an increase in ionising ability. The degree of solvation of the ligands and their susceptibility to slight modifications in the polarity of the medium in which they are housed, by the introduction of small quantities of water, is not necessarily the same for all of the ligands. However no evidence was found during the one-phase experiments for the existence of a substantial difference in pKa values between the Ligands 5, 6 and 7.
No colour transfer of the deprotonated complex of Ligands 5 to 7 was observed from butanol into an aqueous phase, possibly due to the hydrophobic nature of the much bulkier chromogenic moieties on these compounds compared to those of Ligands 1 and 3. However only Ligand 5 displayed the ability to extract LiC104 from such an aqueous phase into the organic phase housing the ligand (Figure 4.15) and the base but the intensity of the response to each individual concentration was greatly diminished. This caused a bunching of the peaks for the various LiC104 concentrations although it is possible to distinguish between
3 *the peaks at concentrations above 10' M. This is due to the fact that in the two phase experiments, the Li+ cation has to be extracted from the aqueous phase and
153

therefore the concentration of Li+ in the organic phase will be lower than when the salt was added directly to the organic phase as it was in Figure 4.14.
The FutureFurther work on all of these compounds could include• Optimisation of the organic solvent and reaction conditions used.
The work described here displayed a large solvent dependency due to the varying ionising abilities of different solvents, which resulted in a variation in the ease with which the phenolic proton of the chromogenic moiety is removed.
• Measure accurately the fundamental properties of some of these materials (i.e pKa, P values, effect of pH on the compounds,)The results obtained demonstrated that different cations effect the chromogenic calix[4]arenes in different ways. A comparison of these values, for all of the ligands studied may lead to a clearer picture of the importance that subtle differences in ligand substituents have on the whole molecule.
• Fabrication/immobilisation of materials on substrates to produce an optical sensor.The ultimate application of this type of chromogenic ionophore is the development of an optical sensor for cation analysis. A suitable immobilisation technique for these materials on a substrate such as an optical fibre will be of primary importance if these compounds are to be utilised fully.
154

4.9 Gaseous Amine Detection
Introduction
The vital role played by a suitable base in the ionisable chromogenic system has been highlighted in both Chapters 3 and 4. The actual nature of the base is also very important, with different bases conferring slightly different properties, in terms of intensity, on the systems. A clear example of this was seen in section4.6.1 where a strong base such as TEA caused a colour change to red in the absence of metal perchlorate, but the slightly weaker base TDDA could not produce this clear change until metal perchlorate had been added. The equations outlined in Chapter 3 have been shown to hold true both in UV-Vis and NMR experiments and it is equation 3.5 which evoked the investigation of the potential of the Ligand-metal complex to produce a colour change upon reaction with gaseous amines.
P
L-COH + M+ ^ LM+-COH (3.3)
K a (c )
LM+-COH + B ^ LM+-CO- + BH+ (3.5)
K a (L )
L-COH+ B ^ L-CO- + BH+ (3.1)
As was previously stated a very strong base is required to cause phenolic-proton dissociation on its own, whereas the presence of a metal cation had the effect of rendering the chromophore phenolic proton more labile and thereby lowering the pKa value.
In this section Ligand 5, the tetra-nitrophenylazophenol ligand capable of producing the largest absorbance change (1.7 a.u. from 1(H to 10'1 M LiC104) upon interaction with LiC104 is assessed for its potential as a gaseous amine indicator system. Since the actual colour, rather than the intensity, produced in the one phase experiments with Ligand 5 did not vary from metal to metal or from base to base, it was envisaged that this new system would produce an indicator capable of detecting gaseous amines in a non-selective manner. Trimethylamine (TMA) concentrations in the range 0.05 to 5 ppm are currently
155

often measured using commercial Gastec amine indicator tubes [30], As was discussed in Chapter 1, certain gaseous amines such as TMA and DMA are produced as sea fish spoil [31]. The development of a rapid indicator system to monitor the freshness of fish by the monitoring of gaseous amines produced could be of major benefit to the food industry.
So in this section the ligand-metal-base system previously used to detect the presence of metal ion (M+) is being reversed i.e. using the complex to detect the base (B). As the sample would not normally contain volatile bases selectivity is not a prerequisite for the application envisaged.
4.10 Liquid Phase Experiments
For any visual indicator system to be effective, a large colour/spectral difference must exist between the indicator prior to interaction with the species of interest and after interaction. As was seen in section 4.2.2 , the higher the concentration of LiC104 added to the ligand base mixture, the more intense the colour obtained. A number of LiC104 concentrations were examined in order to optimise the analytical range of the method. Butanol was chosen as the solvent for the dissolution of the ligand in the liquid phase experiments due to its high boiling point which rendered heating of the gas tight vessel to enhance the release of TMA from aqueous solution possible.
Method 2.6.1 was followed for the liquid phase experiments. A 2.5 mL solution containing 5xl0-5 M of Ligand 5 of 0.5 M LiC104 in butanol was placed in a test tube in a gas tight vessel. Fixed volumes between 0.2 and 50 ^L of a 25% aqueous TMA solution were injected into a 550 mL capacity vessel through a supa-seal cap, ensuring that none of the liquid entered the test tube containing the indicator solution. This gave final TMA concentration in the approximate range0.1 to 25.0 ppm, assuming all TMA passes into the gas phase. A schematic of this experimental setup is shown in Figure 4.19. The vessel was heated gently inOa 50°C oven to aid the evolution of TMA (b.p.2.9 C) from the aqueous form. After reaction samples of the solution were removed in order to obtain the UV- Vis spectra between 300 and 800 nm.
156

detection.
On release of the TMA inside the gas tight vessel, the colour of the indicator solution changed from yellow to red. This colour change occurred instantaneously at the butan-l-ol gas interface and spread throughout the whole solution after the vessel was shaken. Since no base was added to the indicator solution prior to the introduction of the gaseous TMA, the initial colour of the ligand-metal complex was yellow rather than the bronze colour seen in section4.2.2. The colour change was simply due to the deprotonation of the complex. Figure 4.20 shows the spectra obtained for the above experiments. A A™ax of 500 nm is seen for the deprotonated Li+ complex of Ligand 5 in butanol with the kmaK of the protonated complex occurring at 376 nm and an isobestic point is visible at 420 nm
157

Free Protonaled Ligand Deprotonated Complex
Figure 4.21:- UV-Vis spectra showing the effect ofTMA on the UV-Vis spectrum of the complex. Changes in the absorbance spectrum of a 2.5 mL solution of 5x1 O'5 M Ligand 5 with 0.5 M LiCl04 in butanol, upon exposure to gaseous TMA in the following concentations: (1) 45.00 ppm , (2) 22.50 ppm, (3) 4.88 ppm, (4) 2.25, (5) 0.45 ppm, (6) 0 ppm.
Figure 4.22 shows a graph of the absorbance at 500 nm versus the concentration of TMA. A change in absorbance is observed even at the lowest concentration level of 0.45 ppm, and rises rapidly between this value and 4.88 ppm. A further increase is observed up to 22.5 ppm but the curve is no longer linear and no further increase in absorbance is seen above this level. The time taken for colour development ranged from under 10 seconds for concentrations above 4.5 ppm to 3 hrs for 0.45 ppm. However, these times are diffusion limited rather than a reflection of the reaction rate, as the TMA has to partition from the gas into the butanol phase, react with the ligand, and the coloured deprotonated complex, then has to diffuse throughout the bulk butanol phase. Reproducibility at sub ppm levels was difficult due to the very slight colour change which was involved and the time which it took for colour evolution. The high viscosity of butanol, 2.95 mN sec n r2 [11], may have contributed to the time delay between injection of the TMA sample and colour evolution at the lower concentration levels.
158

[TMA] ppm
Figure 4.22:- Graph of absorbance of Ligand 5 lithium complex at 500 nm versus [TMA],
Similar experiments were carried out in which either the ligand or LiC104 concentration was varied. Above a concentration of 5xl0-5 M Ligand 5 the absorbance of the protonated form of the ligand was above the range of the instrument i.e > 3 a.u. Sample dilution could have been carried out to bring the absorbance of the sample on to the scale of the instrument. In this system an equilibrium between the gaseous amine and the protonated complex is set up in the gas tight environment. Upon removal of the indicator solution from this environment the concentration of base in contact with the indicator solution is drastically reduced and in order to reestablish equilibrium some of the gaseous base will diffuse into the surrounding environment which resulted in a colour change back to the original yellow.
Variations in LiC104 concentration in the ligand solution, would be expected to result in different deprotonated spectra in the presence of the same concentration of TMA. This was seen in section 4.4 where with increasing LiC104 concentration an increase in absorbance at the deprotonated complex A,max was seen in the presence of fixed concentrations of TDDA. Such a variation could be
159

Abso
rban
ce
(A.U
.)used to vary the concentration range for which the complexed ligand could respond. Figure 4.23 shows the change in spectrum for 5xl0-5 M Ligand 5 , 2.5 M LiC104 added directly to the solution as a solid, to the presence of 2.25 ppm TMA. Comparing the response of the indicator solutions which had been made up with different LiC104 concentrations to the presence of 2.25 ppm in Figures 4.21 and 4.23 illustrates the point that the intensity of the colour change observed upon interaction with certain TMA concentrations can be controlled by the concentration of LiC104 in the indicator solution. This point is reiterated in Figure 4.24 where a 0.1 M LiC104 concentration, with LiC104 introduced into2.5 mL indicator samples as 20 jj.L of 3.3 M LiC104 (aq.), similar spectral shifts to that seen in Figure 4.21 is produced only after a final gaseous TMA concentration of 50 ppm is present.
Free Protonated Ligand Deprotonated Complex
W avelength (run)
Figure 4.23:-Spectra of 5x1 O'5 M Ligand 5 with 2.5 M LiCl04 in the presence of TMA concentrations of (1) 2.27ppm and (2) 0 ppm.
160

FibE
orha
nc»C
RU)
Free Prolonated Ligand Dcprolonated Complex
Figure 4.24:-Spectra of 5x1 O'5 M Ligand 5 with 0.1 M LiCl04 in the presence of TMA conentrations of (1) 50 ppm and (2) 0 ppm.
From the liquid phase experiments it can be concluded that the Ligand 5-Li+ complex is capable of detecting TMA, with the concentration of LiC104 having a large bearing on the concentration range of TMA concentrations which can be determined.
4.11 Test Strip Results
The above initial screening experiments established that the principle of using the ligand complex to determine gaseous amines was possible. The goal of the work was to develop a workable, quick test for such gases. One of the problems quoted in the last section for this system was that of reaction time especially at lower concentrations. One solution to the limitation induced by the necessary diffusion of the TMA throughout the butan-l-ol phase would be to increase the surface area of the ligand-complex exposed to the gaseous environment.
161

Ideally a solid support on which the chromogenic complex could be immobilised was sought. The support chosen was Whatman no. 1 filter paper, 4.25 cm diameter disc. Initial experiments were carried out by carefully adding 2.5 mL of a 5xl0’5 M solution of Ligand 5 which was also 0.1 M in LiC104 to a filter paper disc and allowing solvent evaporation before the next addition was made. The reduction in LiC104 concentration occurred due to the reduced solubility of this solute in THF compared to in butanol. This process resulted in a yellowish tinge being visible on the support. 2.5 mL of a 5xl0-5 M solution was chosen in order to keep the total weight of ligand constant between the liquid-phase and solid support work constant.
The disc was placed on a wire mesh which rested midway inside a 2.71 L capacity gas tight vessel. Upon introduction of 10.7 j L TMA, which is equivalent to 1.0 ppm TMA, into the vessel, ensuring none of the liquid TMA came in contact with the disc, an instantaneous colour change to pink/red was noticed. This indicated that the solid support system was capable of operating as a gaseous TMA indicator and with the complete surface area of the indicator being in contact with the gaseous environment a reduced analysis time was already evident.
A series of experiments was set up to determine the analytically useful range of the method and the LOD possible with this method. The experiments were set up as above except that a 0.5 mL solution which contained 0.235mg of ligand 5 was used. The solution remained 0.1 M with respect to LiC104. The final TMA concentration was varied from 0 to 50 ppm. The lowest TMA concentration for which a change in colour was noted was 0.04 ppm TMA, where a colour change from yellow to orange was observed. Above this concentration the colour intensity increased discemibly to red. The test discs were then immersed in 5 mL acetonitrile to extract the complex for UV-Vis analysis. The spectra obtained are shown in Figure 4.24. These extractions were carried out to demonstrate that the same processs of deprotonation of the complex was occurring in these stationary phase experiments.
162

Free Prolonated Ligand Deprotonaled Complex
Figure 4.25:- UV-Vis spectra showing the effect of 'TMA on the UV-Vis spectrum of the immobilised complex. Changes in the absorbance spectrum of a 5.0 mL acetonitrile extract of indicator discs coated with 0.5 mL of a 2.7x1 O'4 M Ligand 5 and 0.1 M LiCl04 solution in THF, upon exposure to gaseous TMA in the following concentations: (1) 50.00 ppm , (2) 10.00 ppm, (3) 1.00 ppm, (4) 0.1 ppm, (5) 0.05 ppm, (6) 0 ppm.
The intensity of the extract was less than that observed when the complex was in the immobilised state. This was partly due to the dilution factor imposed on the system by using 5 mL of acetonitrile but also due to the fact that all of the extracted discs still had a slight yellow tinge after extraction and drying. However, although the change in intensity at 500 nm is not that large it proves that essentially the same process which existed in the liquid phase experiments was occuring.
Disc coating conditions were optimised and are described in Method 2.6.2. With this system, striking colour changes from yellow to red were noted on the test discs for concentrations above 0.02 ppm, with a detectable difference in colour observed for TMA concentrations in the range 0.02 to 30 ppm. Plate 4.1 shows the colour change observed with 1 ppm TMA. Above 30 ppm no further change in colour density was visually discernible. Full colour development occurred very quickly after the introduction of TMA into the gas-tight system, with the lowest concentrations producing colour change in under 2 minutes, and shorter times being observed for higher concentrations. The process is completely
163

reversible, and test strips left in air returned to their original form within several minutes.
/T(Plate 4.1 .'-Colour change obtained in the presence of 1.0 ppm TMA using test strips made by carefully adding 0.2 mL of a THF solution which was 6x1 O'4 M in Ligand 5 amd 0.1 M in LiCl04 onto a Whatman No. 1 filter paper disc (4.25 cm radius) and allowing to dry. On the left is a control strip which was subjected to exactly the same conditions as the experimental strip but without exposure to TMA. A clear change in colour from yellow to red is evident.
4.12 Covered Test Strips
As we were intrested ultimately in the application of this indicator in the food industry, and most likely as a component of food packaging, experiments were subsequently carried out to determine whether the test strips could react to the presence of gaseous TMA when enclosed in a gas-permeable membrane such as low density polyethylene (LDPE). LDPE exhibits good barrier properties to water vapour but has high gas transmission capabilities [31], The test strips were prepared as before except that they were wrapped in LDPE before being placed in a gas-tight vessel. Visually, no colour change was observed below 0.4 ppm TMA for exposure times of up to 8 hours. The development time decreased with increasing TMA concentration with full colour changes being observed after 20 minutes for 2.5 ppm TMA and almost instantaneous colour changes being observed above 10 ppm TMA.
164

4.13 Discussion
As outlined in Chapter 1, a simple sensitive colorimetric indicator for TMA would be of great potential use in the food industry for the detection of spoilage in fish products. The ligand investigated in this research can provide such an indication, and can be used while separated from the foodstuff by a gas permeable membrane. Obviously, for applications of this system the conditions of storage should be such that the amine is available in gaseous form. Refrigeration is usually carried out at 4° C, a temperature above the boiling point of TMA, so under these conditions some evolution of TMA would be expected if the fish sample had begun to spoil. The method has attracted industrial interest and has been patented [33],
Interestingly, the colour density is much greater and reaction times are much shorter for the test strips compared to the liquid-phase experiments, despite a lower concentration of metal ions being available in the case of the former. This arises because in the liquid-phase experiments, the experimental design is such that the amine must partition into the butanol phase and diffuse throughout it in order to generate the colour; whereas with the test strip, only the coated surface of the paper is involved and its entire surface area is in contact with the gaseous environment. Hence in the absence of any bulk diffusion processes, colour generation is much faster. In addition, as the ligand-metal mixture is not dispersed throughout a bulk liquid phase in the case of the test strips, but rather concentrated into a thin layer adhering to the paper surface, the density of the colour observed is much greater than for equivalent concentrations of TMA in the liquid phase experiments. The experiments with the LDPE coated test strips suggest that a sealed test strip of this type could be used on the outside of packaged foods to indicate the onset of spoilage. However, much work remains to be done before anything of this nature could be realised in practice.
In conclusion, an extremely rapid and sensitive visual method for the detection of TMA has been developed. The range of detection possible so far is between 0.02 and 30 ppm (maximum values assuming total transfer of the TMA injected into the gas phase), although this may be further reduced through variation of the reaction conditions or the development of related chromoionophores with larger molar absorptivities. Although the deprotonation process is relatively non- selective, some degree of selectivity may be achieved on the basis of the Kb value
165

of the base through variations of the Ka of the ligand produced on complexation with different metal ions co-immobilised with the ligand on the test discs. However, as a variety of volatile amines are evolved during fish spoilage, a broad-band indicator such as the indicator described above is more appropriate.
4.14 Overall Conclusion
Five novel calix[4]arenes bearing nitrophenylazophenol chromogenic moietieshave been examined and their main features are summarised below:-
• A colour change from yellow to red is seen upon complexation with Li+ or Na+ in the presence of a suitable base. The intensity of the colour produced is dependent on the concentration of metal-cation added and a greater colour change is seen upon complexation with Li+ than Na+ at each concentration level.
• The positioning of the ionisable phenolic group relative to the hydrophilic cavity was found to be important with relation to the absorbance produced on complexation. Ligands 5 to 7 in which the hydrophilic cavity was attached in the ortho position relative to the ionisable phenol, produced much stronger absorbances than Ligands 8 and 9 in which the hydrophilic cavity was attached at the meta position.
• In the presence of a suitable base i.e TDD A, no colour change is observed in the absence of the complexing ion. This is again indicative of complexation effecting a lowering of the pKa of the dissociating proton.
• Complexation occurs in the absence of a base, but no colour change is produced. This was demonstrated by 'H NMR spectroscopy.
• Ligand 5 displayed the ability to extract Li+ cations from an aqueous to an organic phase producing a spectral change in the organic phase, which was dependent on metal-ion concentration. No subsequent leaching of the deprotonated complex to the aqueous phase occurred.
• Ligand 4 was used in the development of a solid-phase gaseous TMA detector. The Ligand-Li+ complex coated test strips showed rapid colour changes from yellow to red when it was exposed to gaseous TMA in a concentration range of 0.02 to 30 ppm.
166

4.15 References
1. M. McCarrick, S.J. Harris, and D. Diamond, Analyst, 118 (1993) 1127.
2. M. McCarrick, S.J. Harris, and D. Diamond, J. Mater. Science, 4, 2 (1994)217.
3. T. Kaneda, K. Sugihara, H. Kamiya, S. Misumi, Tet. Lett., 22 (1981) 4407.
4. R.E. Moss, I.O. Sutherland, Anal.Proc., 25 (1988), 272.5. S. Misumi, T. Kaneda, Journal of Inclusion Phenomena and Molecular
Recognition in Chemistry 7 (1989), 83.6. D.J. Cram, Angew. Chem., Int. Ed. Engl. 25 (1986) 1039.7. D.J. Cram, R.A. Carmack, R.C. Helgeson, J. Am. Chem. Soc., 110 (1988),
571.8. H. Shimizu, K. Iwamato, K. Fujimoto, S. Shinkai, The Chemical Society of
Japan, Chemistry Letters, (1991) 2147.
9. Y. Nakamoto, T. Nakayama, T. Yamagishi, S. Ishida, "Workshop on Calixarenes and Related Compounds", Johannes Gutenberg-Universitat, Mainz, Germany. August 28-30 (1991) Poster 1.
10. A.M. King, C.P. Moore, K.R.A. Samankumara Sandanayake, I.O. Sutherland, J. Chem. Soc., Chem. Commun., (1992) 582.
11. C.N.R. Rao, “Ultraviolet and Visible Spectroscopy , Chemical Applications” 3rd Edition, Buttersworths, London, (1975).
12. T. Nowicka-Jankowska, K. Gorczynska, A. Michalik, E. Wieteska, “Wilson and Wilson's Comprehensive Analytical Chemistry, Vol XIX, Analytical Visible and Ultraviolet Spectrometry”, G. Svehla (ed.), Elsevier, Amsterdam, (1986).
13. “CRC Handbookof Chemistry and Physics'', David R. Lide (Edt.), CRC Press, Boca Raton, Florida, (1993).
14. U. Oesch, Z. Brzozka, A. Xu, B. Rusterholz, G. Suter, H.V. Pham, D.H. Welti, D. Ammann, E. Pretsch, and W. Simon, Anal. Chem., 58 (1986) 2285.
15. A. Arduini, A. Pochini, S. Reverberi, R.Ungaro, C.D. Anderetti and F. Ugozzoli, Tetrahedron, 42 (1986) 2089.
16. R. Ungaro and A. Pochini in “Calixarenes: A Versatile Class ofMacrcyclic Compounds”, (edts.) J. Vicens, and V. Bohmer, Kluwer Academic Publishers, Dordrecht, (1991) 127-147.
17. G. Barrett, V. Bohmer, G. Ferguson, J.F. Gallagher, S.J. Harris, R.G. Leonard, M.A. McKervey, M. Owens, M. Tabatabi, A. Vierengel, and W. Vogt, J. Chem. Soc., Perkin Trans. 2, (1992) 1595.
167

18. G. Calestani, F. Ugozzoli, A. Arduini, E. Ghidini, and R. Ungaro, J. Chem. Soc., Chem. Commun., (1987) 345.
19. P. Guilbaud, A. Vemeck, and G. Wipff, J. Am Chem. Soc., 115 (1993) 8298.
20. H.G. Lohr and F. Vogtle, Acc. Chem., Res., 18 (1985) 65.21. D.J. Cram, G.M. Lein, J. Am.Chem. Soc., 107 (1985) 3657.22. F. Amaud-Neu, E.M. Collins, B. Laitner, M. Deasy, G. Ferguson, S.J.
Harris, A.J. Lough, M.A. Me Kervey, E. Marques, B.L Ruhl, M.J. Schwing- Weill, and E.M. Seward, J. Am Chem. Soc., 111 (1989).
23. A. Cadogan, D. Diamond, M.R. Smyth, M. Deasy, M.A. McKervey, andS.J. Harris, Analyst, 114 (1989) 1551.
24. D. Diamond, G. Svehla, E. Seward, and M.A. McKervey, Anal. Chim. Acta., 204(1988) 223.
25. M. Telting-Diaz, D. Diamond, M.R. Smyth, E.M. Seward, and M.A. McKervey, Electroanalysis, 3 (1991) 371.
26. B.P.Czech, E. Chapoteau, W. Zazulak, C.R. Gebauer, A. Kumar, Anal. Chim. Acta, 241 (1990) 127.
27. D.J. Cram, R.A. Carmack, and R.C. Helgeson, J, Am. Chem. Soc., 110 (1988)571.
28. E.D Olsen, “Modern Optical Methods of Analysis”, McGraw-Hill, USA, (1975).
29. L. Safarik, Z. Stransky, “Wilson and Wilson's Comprehensive Analytical Chemistry, Volume XXII, Titrimetric Analysis in Organic Solvents”, (edt.) G. Svehla, Elsevier, Amsterdam, (1986).
30. N.J.C. Strachan, F.J. Nicholson, Int. J. Food Sc. and Tech., 27 (1992) 261.31. C.K. Simmonds, E.C. Lamprecht, in “Microbiology of Frozen Foods” (edt.)
R.K. Robinson, Elsevier, London, (1985) 169-208.
32. N.T. Crosby, “Food Packaging Materials”, Applied Science Publishers Ltd., London, (1981).
33. Chromogenic Ligands and Use Thereof in Optical Sensors, S.J. Harris, M.A. McKervey, and D. Diamond, European Patent Application, lodged 6th August 1993, No. S922577.
168

Chapter 5
The Development of Novel Solid Contact Ion-SelectiveElectrodes
169

5.1 Project Aim
The aim of the work discussed in this chapter was to develop novel all solid-state ion-selective electrodes. This was a continuation of work carried out by Cadogan et al [1] where an intermediate layer of the conducting polymer, polypyrrole, which has both ionic and electronic conducting properties, is placed between an electronically conducting substrate such as platinum, and an ion-selective membrane. By using an alternative conducting polymer, polythiophene (PT) or polyoctylthiophene (POT), it was hoped that novel Li+ and Cl' detection systems could be fabricated and that the charge transfer mechanism previously proposed could be confirmed and further elucidated.
5.2 Theory and Literature
5.2.1 Introduction
This chapter deals with another means of transduction of ions, that of potentiometry. An introduction into the different components used in potentiometry, i.e. membrane with internal filling solution, coated wire and solid contact electrodes, and to conducting polymers and their applications in potentiometric sensors is given. This is followed by a section outlining all of the experimental procedures used in this work. Finally the results of the work carried out on the characterisation of a novel ISE system incorporating the semiconducting polymers polythiophene and polyoctylthiophene as a solid contact between a metallic substrate and a lipophilic neutral carrier are presented.
5.2.2 Potentiometry
Potentiometry is one of the most widely used electroanalytical methods. The term potentiometry pertains to the technique of measuring the potential of a galvanic cell or electromotive forces (emf). The simplest electrochemical cell, consists of two electrical conductors or electrodes immersed in a conducting electrolyte solution.
170

In potentiometry the voltage source is a form of galvanic cell in which electrochemical reactions occur spontaneously at the electrolyte/electrode interface when the electrodes are connected by a conductor. The two electrodes are known as the measuring and reference electrodes respectively. The overall cell potential is measured when the reversible electrode reactions have reached thermodynamic equilibrium. The true values of this potential can only be measured under zero current conditions. The main task in analytical potentiometry is to relate changes in cell potential to shifts in a particular ion activity arising from its reversible exchange at the ISE membrane/sample interface boundary. This can only be achieved if all other potentials arising in the cell are independent of the solution composition.
5.2.3 Conventional Ion-Selective Electrodes
The conventional cell arrangement for potentiometric measurements using an ion- selective electrode is [2]
internal internal ion-selective externalreference aqueous ref. membrane referenceelement solution electrode
and is shown in diagrammatic form in Figure 5.1 [3]EMF
INNERREFERENCE HALF CELL
INTERNALFILLINGSOLUTION
ELECTRODEBODY
ION SELECTIVE MEMBRANE
REFERENCE HALF CELL
REFERENCEELECTROLYTE
ELECTRODEBODY
DIAPHRAGM
ION SELECTIVE REFERENCEELECTRODE ELECTRODE
Figure 5.1 .’-Schematic diagram of a membrane electrode measuring circuit andcell assembly [3J.
171

The working electrode in this arrangement utilises an internal filling solution to make contact between the internal reference electrode and the permselective membrane in contact with the sample solution. This is in contrast to solid contact electrodes, which will be discussed later, where contact between the membrane and the internal electrode is made by a solid-state material. In the conventional configuration the internal aqueous reference solution, which contains the ions necessary to maintain constant potentials at both the reference element and the inner surface of the ion-selective membrane is held at a constant composition. In a simple system where the reference electrode does not have a liquid junction such as an Ag/AgCl reference electrode, the overall cell potential (Ecen) would be given by
Ecell = Eise — ERef (5.1)where E^e is the ion selective electrode potential and Eref is the reference electrode potential. If the sensing electrode responds in a Nemstian fashion to the analyte ion (iz+) then
RTE IS E = E ° + 2.303— loga, (5.2)XjP
where i is the analyte of interest, of charge zj and activity a,; R, T and F are the gas constant, the absolute temperature and the Faraday constant respectively and E° is the standard electrode potential, which is ideally constant under the conditions of use. If Eref is independent of the sample composition (i.e. constant) then by combining equation (5.1) and (5.2) the following equation can be written
RTEceM = eons tan t + 2.303——logaj (5.3)
zfF
Hence the cell will respond in a Nemstian manner to changes in aj.
However the reference electrode must often be separated from the sample solution because the reference electrode potential is affected by the sample composition or because of cell design considerations. This is the arrangement illustrated in Figure 5.1 where the electrical contact between the reference half- cell and the sample solution is achieved by means of a salt bridge. Such a bridge/solution boundary gives rise to the possibility of ionic diffussion which introduces a liquid-junction potential into the system (Ejn), thereby changing the overall cell-potential to>
172

RTwhere Ejn is the junction potential and S = 2.303——.
Liquid junction potentials are a direct result of the differences in ionic mobilities of the positive and negative ions constituting the bridge electrolyte resulting in a charge separation. For example if the postitive ions migrate faster into the sample solution than the negative ions, a charge separation soon develops at the sample/bridge junction. The magnitude of the resulting potential difference is dependent on a number of factors, such as the identity of the bridge ions, the composition of the sample solution, the geometry of the junction and the temperature.
As the junction potential contributes to the overall cell potential, it is important that it be as small as possible, or at least invariant during use. Due to the similar mobilities of K+ and Cl*, saturated KC1 solutions are frequently used in the preparation of bridges as only relatively small junction potentials will arise [4], A mathematical description of the junction potential is given by the Henderson Equation (5.5) [5]
Ece|, = constant + Slogai + Ejn (5.4)
Ed =£z,u,a,(0)-]£z,u,a,(d)") R T / Z ^ ¡ ^ ( 0 ) "
F A2z?U|a,-(d)(5.5)
The summation terms include contributions by all the ionic species (i) that are present within the membrane, the absolute value of the charge numbers z„ mobilities u and activities a, and assumes a linear diffusion gradient, and (d) and(o) are due to the diffusion layer between the internal reference solution and the external sample respectively.
5.2.4 Activity Coefficients
From the Nemst equation (equation 5.2) it can be seen that the electrode response is related to the activity of the ion of interest a,. Due to deviations from ideal behaviour, the activity of an ion in solution is not identical to its concentration but can be related to it by the equation
a, = f,c, (5.6)
where for an ion (i), a, is the activity, (Cj) is the concentration and (fj) is an activity coefficient. As c,-» 0, fj->l, and activity and concentration become
173

identical in infinitely dilute solutions. The activity coefficient (fj) quantifies the degree of deviation of an ideal solution from the ideal situation. Its value depends on the ionic strength of the solution.
(5.6)
where q = molar concentration of i.
One of the simplest methods for the calculation of activity coefficients is the Davies model [6],
where A is a solvent dependency constant (0.512 for water). This equation can only be used for solutions up to approximately I = 0.1 M.
5.2.5 Membrane Potentials
In an ideal potentiometric cell, where effectively the contributions from the reference electrode, and the junction potential are constant, changes in the membrane potential Em can be monitored as changes in overall cell potential. The membrane potential is determined by the boundary potentials at the two membrane/solution interfaces and any diffusion potential which arises as a result of variation in the ion composition through the membrane. This is shown diagramatically in Figure 5.2
(5.7)
174

i’(aq) -
SAMPLE
E b
INTE RNAL
5 i'(aq)
Figure 5.2:-Boundary and diffusion potentials of ion-selective liquid- membranes.
spontaneous transport of charged species across the membrane so that a potential
5.2.5.1 Boundary Potential
The phase boundary potential arises from the non-uniform distribution of electrically charged species between the two phases. Both chemical and electrical potential contributions must be taken into account in descriptions of ion transport or ion distribution. For an ion i of charge Zj exchanging reversibly across an aquo-liquid membrane boundary, the work done in establishing equilibrium can be described by
where E'B is the potential at the internal solution boundary, E"B the potential at the sample boundary and ED is the diffusion potential which arises from the
gradient is formed. The full membrane potential is then given by
(5.9)
- A G = ZjFEB (5.10)
175

where AG is the change in Gibb's free energy, F is the Faraday constant and EB is the electrical potential established over the boundary. The decrease in Gibb's free energy is given by the difference in the partial molar Gibb's free energy (ji) for the ion i in the membrane (m) and the aqueous (aq) phases
~AG = — Ml(m)
While measurements are usually carried out under a wide variety of conditions, these are conventionally related to the work done to bring about the same charge under standard conditions by
~AG° = Hi“,,) - |i"(m) = z.FE” (5.12)
and the standard state 0 is related to other states by
= |x" +RTInai (5.13)
So substituting into equation 5.11 above
-AG = < ., ,-K « +RTInTa3i (5-14)Km)
The electrical potential at the interface is thus
Eb =^ ¡ ( a q ) ^ K m ) l R T f a i ( a q ) ^
Z j F J Z j F ^ a i(m) J
If E° the standard potential =
particular membrane interface isZ|F
. Then the boundary potential at any
. RT. EB- E B + z F ln K»q)J (5.16)
As there are two membrane interfaces, (') the internal interface and (") the external interface. Two equations can be written for the boundary potentials EB and E’b from (5.16) above.
176

e b = e °b +RT fa!,
ziE \ ai(m) /(5.17)
RT ( a",e ; = e ; + — (5.18)
Combining (5.17) and (5.18) the net boundary potential across the membrane is
e ; - e > e ; - - K + ~ \ n/ .. a i(aq)a i(m)
Vai(aq)ai(m)y(5.19)
Assuming the activity of the ion a, is the same at both interfaces in the membrane i e aKm) = a”(m) then
e ; - e b = e ”" - e °r +RT
(5.20)
5.2.5.2. Diffusion Potential
Although the membrane is considered to be a uniform phase, the free energies of the membrane components undergo variation with time and this gives rise to diffusional fluxes of ions within the membrane. Although more commonly used for the estimation of junction potentials, the Henderson approximation can be used to describe the diffusion potential across the membrane. This allows easy and rather close characterisation of the diffusion potential in terms of boundary concentrations and mobilities of diffusing ions, (see equation (5.5)),
Relating this equtaion to Figure 5.2, x = 0 for the sample boundary ("), x = d at the internal boundary (') and the thickness of the membrane is d. If we assume there is a negligible drop in primary ion activity across the membrane i.e.
ai(o)~ai(d) (5.21)
and that there is virtually no penetration of the membrane by interfering ions (j)
aj ~ aj(d) ~ 0 (5‘22)
177
Ed ~ 0 (5.23)
then the substitution into the Henderson equation leads to the approximation
5.2.5.3 The Complete Membrane Potential
Since Ed can be approximated to zero or is at least constant, variations in the overall membrane potential will be determined by the values of the boundary potentials. As the internal electrolyte activity a'j is constant, substitution of equation (5.23) into equations (5.9) and (5.20) gives an expression for the overall membrane potential:
e m = e ^ +z,F
In a- (5.24)
where E“{ is a standard membrane potential and includes contributions from Ed, E°" and E„. Provided that the junction potential (Ejn) and the reference potential (Eref) remain constant the overall cell potential will depend on the activity of the primary ion ai”in solution and can be defined by
Eceii = constant + S log aj” (5.25)
RTFor a ten-fold change in primary ion activity (aj) the ideal slope (S) is 2.303 ——.
ZjF
This is 59.2 mV for a monovalent ion and 29.6 mV for a divalent ion at 25°C. Hence overall changes in cell potential will be ideally determined by changes in
5.2.6 Ion-Selective Membrane Components
Two main types of ion-selective compounds are used as dissolved components in liquid membrane sensors:(i) Organic ion-exchangers such as organophosphates or tetraphenylborate (cation exchanger) and tetraalkylammonium ions (anion exchangers).(ii) Uncharged molecules (neutral carriers) capable of complexing metal ions and drawing them into the membrane. Various classes of neutral carrier ionophores have been used in potentiometric ISE work such as crown ethers, spherands,
178

calixarenes and the naturally occuring macrotetrolides, all of which were discussed in Chapter 1. The mode of action of these macromolecules with cations discussed there remains applicable to the present discussion. The electrodes described in this chapter are neutral carrier ionophores, containing exchangers to improve response characteristics, and discussion here will be confined to this class of selective membrane component.
5.2.7 Cation Selectivity
In section 5.2.5 it was stated that the generation of a boundary potential at the membrane electrolyte interface requires the selective inclusion of ions of the same charge into the membrane phase and the simultaneous rejection of counterion. Therefore, a cation selective membrane selectively exchanges cations and vise versa. Thus far the change in electrode potential has been discussed in terms of the ideal situation where the electrode responds solely to the presence of the analyte ion. In reality all electrodes are exposed to interfering ions, both cationic and anionic in nature. The response of the electrode must also be considered in terms of these interfering ions, which will intract with the electrode to varying degrees. The Nikolskii equation [6] introduces a term for the presence of interfering ions into the Nemst equation:-
where a} = activity of the primary ion (i) in the sample solution, aj = the activity of the various interfering ions (j) in the sample solution, = a standardboundary potential of the membrane, incorporating other potentials besides the external boundary potential, kj”‘ ( the selectivity coefficient) is a weighting factorto include contributions from interfering ions (j) to the total membrane potential (Em). In the absence of other ions (aj = 0) or an ideal electrode (kPol= 0, for allinterferents j) the equation reduces to a Nemstian form for the primary ion.
5.2.8 Neutral Carrier ISEs
The traditional barrel configuration ISEs shown in Figure 5.1 containing neutral carrier ionophores as the membrane recognition components have been used in
(5.26)
numerous analytical situations over the last 30 years or so. The huge developments in ISE research over this period has been driven in part by the speed and ease of ISE use, the wide dynamic range possible and the relatively low cost of the devices.
Many of the compounds described in chapter 1 sections 1.2 and 1.3 were incorporated into potentiometric ion selective electrode. For an extensive list of neutral carrier based ISEs and their current applications one should look to the excellent reviews [7-15],
5.2.9 Coated Wire Electrodes (CWE)
The cumbersome nature of the traditional barrel configuration has proven to be problematic for some applications and attempts at miniaturisation brought about new sensing systems namely solid contact (SC) electrodes such as solid crystal membranes, conducting filled polymer electrodes and coated wire electrodes (CWE). In the context of the work to be described in this chapter where a novel solid-contact electrode incorporating a conducting polymer between the ion sensing membrane and the electronic contact, is compared to a CWE of the same ion sensing membrane, it is pertinent at this point to review the work previously done on CWEs.
In a CWE an electroactive species is incorporated in a thin polymeric film [2], usually poly(vinylchloride) (PVC) [although poly(methylmethacrylate) is often used], and subsequently dip-coated directly onto a conducting substrate. This electrode configuration results in the elimination of the conventional aqueous internal reference system found in conventional arrangements as depicted in Figure 5.1. This attribute provides new advantages of simplicity of design, lower costs, mechanical flexibility in terms of being able to use the electrode horizontally, vertically or inverted and the possibility of miniaturisation and microfabrication have widened the potential applications of CWEs. The basis of such solid contact electrodes is shown diagramatically in Figure 5.3
180
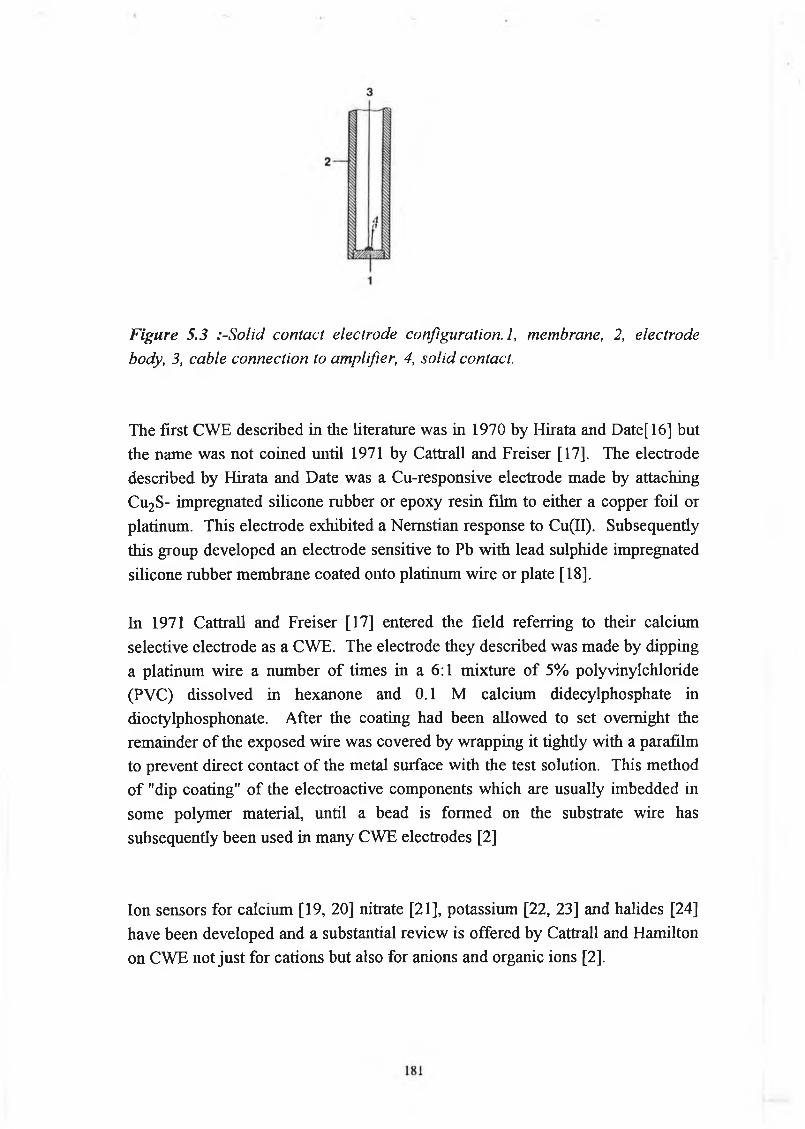
Figure 5.3 .‘-Solid contact electrode configuration. 1, membrane, 2, electrode body, 3, cable connection to amplifier, 4, solid contact.
The first CWE described in the literature was in 1970 by Hirata and Date[16] but the name was not coined until 1971 by Cattrall and Freiser [17], The electrode described by Hirata and Date was a Cu-responsive electrode made by attaching Cu2S- impregnated silicone rubber or epoxy resin film to either a copper foil or platinum. This electrode exhibited a Nemstian response to Cu(II). Subsequently this group developed an electrode sensitive to Pb with lead sulphide impregnated silicone rubber membrane coated onto platinum wire or plate [18].
In 1971 Cattrall and Freiser [17] entered the field referring to their calcium selective electrode as a CWE. The electrode they described was made by dipping a platinum wire a number of times in a 6:1 mixture of 5% polyvinylchloride (PVC) dissolved in hexanone and 0.1 M calcium didecylphosphate in dioctylphosphonate. After the coating had been allowed to set overnight the remainder of the exposed wire was covered by wrapping it tightly with a parafilm to prevent direct contact of the metal surface with the test solution. This method of "dip coating" of the electroactive components which are usually imbedded in some polymer material, until a bead is formed on the substrate wire has subsequently been used in many CWE electrodes [2]
Ion sensors for calcium [19, 20] nitrate [21], potassium [22, 23] and halides [24] have been developed and a substantial review is offered by Cattrall and Hamilton on CWE not just for cations but also for anions and organic ions [2].

Even from the earliest reports of ion-selective CWEs it became apparent that certain factors in the treatment of these electrodes had to be very carefully considered due to the unknown nature of the conduction mechanism at the internal boundary. The effect of various conditioning parameters were highlighted by Hirata and Date [16, 18] who concluded that the swelling of the polymer bed by an aqueous salt solution of the cation of interest was necessary to establish a stable potential. This swelling was considered to enhance the conduction process. Although equal and even superior selectivities have been claimed for the devices compared to their conventional counterparts [25], comparisons of selectivity coefficient data for different electrodes can be unreliable due to a number of different methods being employed for their determination and due to variations in electrode treatment prior to use [2], The standard potential of CWEs is often unstable varying for one electrode during its lifetime as well as differing between electrodes of the same type, and hence they require frequent recalibration.
In spite of the observed success of CWEs such problems raised fundamental questions concerning the charge conduction mechanism occuring in the membrane phase and at the polymer-substrate interface. As described earlier (section 5.2.3) in a conventional ISE the reversibility and equilibrium of transition from ionic to electronic conductivity is ensured by the reversible half cell at the silver-silver chloride wire in the internal filling solution. Such a mechanism would appear to be absent in CWEs since the ionically conducting polymer is in direct contact with the electronically conducting metallic substrate with no intermediary phase to bridge the gap.
The term ‘blocked interface” was introduced by Buck [26] who classified coated wire electrodes as being "completely blocked" because the membrane/substrate interface is blocked to a reversible electron or ion transfer. The lack of reproducible potentials can be justified if the coupling between the metal substrate and the membrane in CWEs is seen as capacitive which would by its sensitive nature be affected greatly by external substances penetrating between the two layers.
Cattrall and Hamilton in their review [2] state that in the absence of an internal reference solution, the composition of the sample solution and the extraction behaviour of any interfering ions will be the determining factor for the equilibrium composition of the membrane. No diffusion potential will occur
182

within the membrane because no ionic gradient will be set up across it, due to the absence of the internal filling solution, and therefore selectivity will be determined by the relevent distribution constants, and with the mole fraction of the lipophilic ion in the membrane also playing an important role.
However, this is only true when the diffusion layer reaches the inner surface region of the membrane; or in other words when the membrane has been conditioned sufficiently for its equilibrium composition throughout the membrane thickness to have been established. Before this equilibrium has been obtained an ionic gradient will occur as the ions establish themselves throughout the membrane and the ionic mobilities of the different ions must be considered. After equilibrium has been attained it may be envisaged that the CWEs would exhibit superior selectivity to their conventional counterparts since the selectivity with the CWEs depends solely on extraction constants. However, on a less positive note, the equilibrium time is crucial and is dependent on membrane thickness. This problem could be a cause of the inherent reproducibility problems. The response of the CWE, unlike conventional ISE’s, is also affected by the mole fraction of lipophilic ion in the membrane and thus CWEs are susceptible to drift problems due to leaching of reagent.
Returning to the problem of the "blocked" interface, a number of authors have carried out studies and suggested theories as to how the conversion from ionic to electronic conduction is occuring. Cattrall et al [19] first proposed the theory that fortuitously the coated wire electrodes contained a thermodynamically feasible process at the PVC-platinum interface in the form of an oxygen electrode. This theory stemmed from the fact that both oxygen and water can penetrate through PVC. Other factors have also been considered to be important in establishing an inner reference electrode such as oxidizable impurities from the membrane, such as hydroquinone which is present as a stabiliser in THF, the solvent used for the dissolution of the membrane components.
In principle there are many processes which are capable of explaining the relatively stable potentials at the metal/membrane interface implied by the successful construction and application of CWEs. However no one definitive mechanism has been proven to be responsible for their maintenance.
183

5.2.10 Solid Contact ISEs
Another route to producing electrodes which eliminate the internal liquid junction is to coat conducting substrates with a combination of both electronically and ionically conducting materials. The basic idea is illustrated in Figure 5.4.
Figure 5.4:- Solid-state connection of ion-selective membranes. The kind of conductivity is indicated on the left and the reaction at the critical interface on the right. "Ag" indicates a silver-filled epoxy glue which is mainly used for making the contact [27J.
In this F' sensor the ion-selective component of the membrane is LaF3. In order to provide a reversible interface, something which is not immediately apparent in the CWEs, an electron conducting silver and additional layer of AgF is provided. This system in the absence of a liquid junction provides a direct means of transmission of "ionic" information to the electronically conducting cable, via the equilibrium which is set up at the AgF/Ag boundary in a manner analogous to the well-known Ag/AgCl system i.e. F' + Ag <-> AgF + e‘.
Many solid internal contact ISEs have been designed and characterised. A number of different categories have emerged in this field, namely:1. Electrodes with solid crystal membranes,2. Glass electrodes with solid internal contact
184

3. PVC matrix electrodes with solid contact, and a substantial review is provided by Nikolskii and Materova [25],
5.2.11 Conducting Polymers
5.2.11.1 Introduction
Conducting polymers constitute a unique class of materials which combine the electrical and optical properties of metals and semiconductors with the good mechanical properties and processing advantages of polymers. This broad definition of the term is an immediate indication of the multidisciplinary nature of the field which has attracted the attention of a range of scientists, including physicists, chemists and materials scientists.
Three main categories exist in polymeric systems capable of conducting charge. These are ionically conducting polymers, redox polymers and electronically conducting polymers. In ionically conducting polymers the movement of ions through the polymer network is responsible for charge transport [28], Redox polymers comprise an electrically insulating polymer backbone to which individual electroactive groups are covalently attached [29], such as [Os(bipy)2(PVP)nCl]Cl, [30], Charge transport occurs by hopping of the charge carriers from one redox centre to another, while the backbone remains unaltered in the process. Both of these categories of polymers are outside the scope of this chapter and will not be discussed further.
The term "conducting polymer" is reserved here for conjugated organic polymers that can be made electrically conducting by a process called "doping". They have an anisotropic, quasi one-dimensional structure consisting of long conjugated chains and charge transport or electrical conductivity, is connected to electrical excitations within this backbone itself. Therefore they are sometimes referred to as "intrinsically conducting polymers" or synthetic metals [31].
The tremendous expansion in the field of conducting polymers since the late 1970's stems from the discovery in 1977 by Heeger and Mac Diarmid that doping polyacetylene (PA) with iodine endowed the polymer with metallic properties including an increase in conductivity of 10 orders of magnitude [32, 33]. B.A.S.F. have reported a conductivity of 147,000 S cm-1 (siemens per centimeter)
185

for polyacetylene [34]. Good insulators such as teflon and polystyrene have conductivity close to 10-18 S cm-1 and good conductors such as copper and silver have conductivities close to 106 S cm*1. Since their encouraging properties were discovered in 1977, a number of other organic polymers have been prepared and examined for the conducting ability. They all possess the structural characteristic which is synonomous with conducting polymers, namely conjugation of the chain linked electroactive monomeric units. Figure 5.5 shows a selection of the most frequently examined polymers.
186

polyacetylene (PA)
polyphenylene (PPP)
/ \ J \ - J \
N N N 'H H H polypyrrole (PPy)
(KM)b s s polythiophene (PT)
R R R
J T \poly(3-alkylthiophene) R = alkyl side-chain
(PAT)
N -N -
polyaniline (PANI)
/ \/ A J
poly(phenylene- vinylene) (PPV)
Figure 5.5:-Chemical structure of some common conducting polymers, with the names and abbreviations that are in general use in the literature.
187

5.2.11.2 C harge Conduction in M etals and Sem iconductors
According to the band theory of solids the highest occupied band in a material is called the valence band and the empty band above it is called the conduction band. In metals a half filled valence band facilitates the free movement of electrons resulting in conduction. Insulators and semiconductors are materials whose conduction band is completely or almost completely empty respectively. An energy gap exists between these filled valence bands and the conduction band with the size of the gap being the determining factor in whether any electrons will be able to leave this level to the conduction band and thereby result in conduction. Semiconductors have a narrow forbidden gap above the top filled valence band (VB). At normal temperature and pressure only a small percentage of electrons can cross the energy gap and populate the conduction band (CB). Insulators have a wide energy gap which is a barrier to the electrons and therefore excitation of carriers in insulators is impossible. The band structures are shown in diagramatic form in Figure 5.6 [35],
(a) Metal (b) Semiconductor (c) Insulator
Figure 5.6:-Band structures of (a) metal, (b) semiconductors, and (c) insulators[35].
An ordinary conjugated polymer is similar to an insulator or a semiconductor, in that there is an energy gap between the full valence band and the conduction band. In order to have a high electrical conductivity they have to be doped.
188

5.2.11.3 Doping
The term "doping" when applied to the field of conjugated polymers means to oxidise (p-doping) or reduce (n-doping) the conjugated polymer backbone with simultaneous incorporation of charge compensating ions (doping ions). Doping can be carried out either chemically or electrochemically and this is shown schematically by the following reactions:-
Chemicalp-doping P + A -> P+A'n-doping P + D ->■ P"D+
Electrochemicalp-doping P + X- -> P+X- + e- (5-29)n-doping P + N' -» P'N+ - e- (5.30)
(5.27)(5.28)
In chemical doping the conjugated polymer (P) is oxidised by an electron acceptor (A) or reduced by an electron donor (D). In electrochemical doping the conjugated polymer is oxidised or reduced by the applied electrical potential with simultaneous incorporation of an anion (X~) or a cation (N+) respectively. The inclusion of the doping ions (X* and N+) in electrochemical polymerisation is a means of charge compensation on the polymer. Therefore the doping reactions (5.29 to 5.32) result in the polymer becoming electrically conducting by the inducement of positive or negative charges that can move along between the polymer chains. Returning to the band theory of solids this means that the doping reaction induces new energy bands in the band gap, making it possible for electons to traverse this gap and move into the new bands, increasing the conductivity of these materials. High electrical conductivity can be obtained at high doping levels where the band structure of conjugated polymers approaches that of metals.
5.2.11.4 Synthesis of Conducting Polymers
Conducting polymers may be prepared either by chemical or electrochemical polymerisation from a monomer solution. A chemically synthesised polymer is produced in its undoped state. It can be subsequently doped chemically, by treating with a reducing or oxidising agent eg. iodine, bromine, ferric chloride or
189

arsenic pentafluoride (p-doped) or alkali metals e.g. sodium (n-doped), or electrochemically to its conducting state.
With the exception of polyacetylene (PA) it was observed that all important conducting polymers can be electrochemically produced by anodic oxidation[36], This method offers an immediate advantage over chemical methods in that the conducting films are formed directly on the electrode. Also, electrochemical polymerisation offers a versatile and easily controlled method of producing thin films of conductive polymers which can be characterised in situ both during and after polymerisation. In electrochemical polymerisation both polymer formation and doping occur simultaneously. The polymer can be returned to its neutral (undoped) state after polymerisation by electrochemical reduction. The polymer layer can then be redoped either chemically or electrochemically.
Three different methods exist for electrochemical polymerisation - potentiostatic, galvanostatic or potentiodynamic. A three electrode voltametric cell is used. The working electrode on which the polymer is formed is usually made of platinum, glassy carbon, gold or ITO glass (indium tin oxide). In galvanostatic methods a certain amount of curent is drawn through the cell and the polymer is formed as a film on the working electrode. In potentiostatic methods the electrode is kept at a constant potential at which the polymerisation reaction takes place. In the last method, potentiodynamic polymerisation, the potential is continuously swept in and out of the range where polymerisation takes place. New material is formed during each scan. During the reverse scan the new material formed will be reduced, and on the next scan the earlier layers will be reoxidised simultaneously with the formation of new polymer layers.
Anodic electropolymerisation of heterocyclic monomers has been widely used to synthesise conjugated polymers on electrode surfaces [31, 36], The mechanisms of the polymerisation reaction, nucleation and film growth are not fully understood. The following general mechanism gives an indication of how the polymerisation reaction is expected to proceed [36] and is shown in diagrammatic form in Figure 5.7.i Oxidation of the monomer to form a radical cation, by maintaining the
potential above the oxidation potential of the monomer [36, 37],ii Coupling of the two radical cations to form an a, a linkage,iii deprotonation giving the neutral dimer,
190

iv oxidation of the dimer, (dimers and higher oligomers generally have lower oxidation potentials than the corresponding monomers, resulting in immediate reoxidation [38], i.e. for thiophene Eoxmon = 1.65 V vs. SCE, and E0XP°[y = 1.1 V).
As the reaction continues, the average chain length of the oligomers increase, their solubility decreases and gradually a film of conjugated polymer is formed on the electrode surface. In order to maintain electrical neutrality in the material, negative ions, (so-called doping ions) enter the polymer membrane to counterbalance the positive charge of the polymer backbone. The occurence of side reactions in parallel with the polymerisation reaction can however complicate the picture, and possible side reactions must therefore be considered and measures to eliminate them taken.
Since the polymerisation reaction proceeds by a radical cation intermediate, it is clear that the reaction will be sensitive to the nucleophilicity of the environment in the region near the electrode surface. This necessitates the use of solvents which are poor nucleophiles i.e. aprotic solvents [31].
{ \ - r * f■ s ' - w X .
H
►
>n
Neutral undoped polymer
Figure 5.7:- General scheme for the electrochemical polymerisation of heterocycles such as polythiophene[31J.
191

From microanalytical studies [39], of a number of electrochemically synthesised polymers a polymeric structure containing 4 monomer units per counterion for polypyrrole, polythiophene and polyfuran and 2 monomeric units for polyindole, making the whole film electroactive.
From this it is clear that anions must be present in the oxidised polymer film inorder to satisfy the electroneutrality condition [31]. When the polymer is reduced to its undoped state, anions may be expelled from the film, cations may enter the film or both processes may occur together [40-44],
5.2.12 Analytical Applications of Conducting Polymers
The charge storage properties and spectral variation upon oxidation and reduction of conducting polymers have attracted many authors to their potential uses in rechargeable batteries and electrochromic devices, [31, 36], However, the ability to apply an electrically conductive layer onto a substrate surface by electropolymerisation and to subsequently control the level of conduction by doping or undoping has led to the widespread investigation of the analytical applications for these new materials. The most widely used conducting polymers to date in these applications are polypyrrole, polythiophene, poly-3- alkylthiophenes and polyaniline.
Conducting polymers are potentially extremely versatile molecular recognition systems. Their versatility stems from the fact that they have both inherent recognition properties and such properties can be built into them. These includei ability to exchange doping ionsii incorporation of further recognition/complexing molecules such as
ethylenediamine tetraacetic acid (EDTA) [45] or biorecognition molecules such as enzymes [46],
iii changes in electrical conductivity at the polymer membrane arising from the fact that ceratin vapours such as methanol cause a swelling of conducting polymers such as PPy, [47],
+
X = N , S, O
192
A number of general articles encompassing the wide range of applications and sensing techniques which have been used with conducting polymers have been published recently, [48-51], In the work presented here, the polymers PT and POT are used in potentiometric electrodes for the determination of both cations and anions. Compared with voltammetric applications, the use of conducting polymers for fabrication of potentiometric sensors is relatively rare.
Polypyrrole has been examined as an ion-sensing material by a number of authors [52-57], Dong et al. [52-54] have shown that there is a correlation between the open-circuit potential of doped polypyrrole and the concentration of inorganic anions such as Cl-, Br, N 03* and C104- in solution. Fast and stable potentiometric responses were given by all of these polypyrrole electrodes to their dopant anion. A response was also seen to other anions resulting in poor selectivity [53-55, 57], However, the selectivity order could be altered by the use of different dopant ions and another feature of these electrodes was their ability to perform in some non-aqueous solvents, a feature which is not possible with conventional PVC ISE’s. Low resistance and relatively fast response times were also quoted as encouraging characteristics in some of these electrodes [53],
Bobacka et al. [57] found that the conditions of electropolymerisation and in particular the nature of the dopant ion had a substantial effect on selectivity and electrode response. They doped polypyrrole with four different salts i.e sodium p-toluene sulphonate (NaTOS), NaBF4, sodium dodecylsulphate (NADS), and indigo carmine, and obtained a response to NaCl that went from anionic for NaTOS and NaBF4* to cationic for indigo carmine, with a very small anionic response when doped with DS*. These results bear a relationship with the mechanism of ionic and redox sensitivity of p-type conducting polymers offered by Lewenstam et al. [58],
The diversity in PPy response with different anions was seen in terms of the variation in dopant ion mobilities. TOS' and BF4* were found to be mobile in PPy allowing complete exchange with similarly mobile Cl*, and therefore an anionic response ensued.
Indigo carmine is practically immobile in PPy and as a result may act as a cation exchanger. Analogy was made with the cation sensitivity outlined by Okada et al. [59], In this work, napthalene sulphonates were used as the doping ions of PPy. Improved cation response was observed as the concentration of sulphonate
193

groups increased. They also suggested that not all of the sulphonate groups of the divalent and trivalent anions in PPy were required for charge compensation with the imino groups of the polymer backbone and that the excess sulphonate groups may act as cation exchange sites causing the cationic response. Bobacka et al. [57] suggested a similar explanation for this behaviour, that the amount of negative charges incorporated by indigo carmine during electropolymerisation of PPy exceeds the amount of positive charges on oxidised PPy, and the excess negative sites function as a cation exchanger.
The explanation given for the barely anionic response of the electrode doped with DS_ is that this anion diffuses at a very slow rate but after prolonged immersion in a solution of chloride salt, a certain degree of exchange with CP occurs.
Polythiophene and substituted polythiophenes have also been examined [60, 61], as potentiometric ion sensors. Karagozler et al. [60] produced a potentiometric iodide ion sensor using the conducting poly(3-methylthiophene). After electropolymerisation in the presence of the monomer and 100 mM Bu4NBF4, the electrode was transferred to an aqueous solution of KI, where the electrode was redoped by repeated potential cycles. Such electrodes were found to give a selective iodide response in the presence of a range of cations including CP, Br, N 03- and C104' but suffer from interference by iodine reducing species such as CN-.
Bobacka et al. [60] described cation sensitivity by PT and some of its 3' substituted derivatives i.e POT, when they were used in their undoped neutral state. The cation sensitivity was attributed to a possible interaction between the cations and the potentially electron donating sulphur atoms of the thiophene backbone. The cation response was non-selective and sub-Nemstian i.e slopes of approximately 45 mV/dec for POT, indicating a mixed ionic response [57, 58]. The lack of clear anion or cation selectivity demonstrated by a number of authors in the form of sub-Nemstian slopes has been explained recently [58], They say that the open circuit potential of their PPy electrode systems is determined by anions, cations and/or redox couples in solution, giving rise to the so called mixed response. Because both electron and ion-transfer frequently occur simultaneously in these conducting polymer systems they suggest that the use of PPy or analogous conducting polymers as an ion-selective electrode sensing materials may be limited.
194

However, conducting polymers may prove useful as intermediate layers in solid- state ion-selective electrodes. Cadogan et al. [1] have described an example of an application based on the mixed ionic and electronic conductivity of conjugated polymers. Polypyrrole is used as the solid contact between the metal substrate and the ion-selective membrane. It was suggested that the ionically and electronically conducting polypyrrole acts as a bridge between the electronically conducting metal and the ionically conducting membrane, and therefore the contact will not be blocked as is the case in CWEs which were discussed earlier.
In this work it was hoped that an analogous solid contact electrode, this time incorporating undoped polythiophene or polyoctylthiophene as the electronically conducting material could be used in conjunction with previously examined ionophores and thereby further elucidate the mechanism of action of these all solid state electrodes. As was previously mentioned PT and POT in their undoped state have been shown to exhibit non-selective cation responses [61],
195

5.3 Experimental
5.3.1 ReagentsThiophene and anhydrous propylene carbonate (PC) were used as obtained from the Aldrich Chemical Company. 3-octylthiophene was used as received from Neste Oy (Research Centre, SF-06850 Kulloo, Finland). Analytical grade reagent salts were obtained from Merck or Fluka and were used without further purification by dissolution in distilled deionized (millipore grade) water. Lithium tetra-fluoroborate (LiBF^ and tetrahydrofuran (THF) were obtained from Fluka. Both the lithium and chloride selective ion selective cocktails were obtained from KONE Corporation and contained ion-exchanger, plasticiser and PVC dissolved in THF. The names of the ionophores used were not disclosed due to company policy restrictions, but for lithium-selective electrodes, a lithium-selective neutral carrier ionophore was used, (see Chapter 1 for a general description). An anion exchanger was used as the chloride-selective component in the chloride-selective cocktail. Chemically synthesised polyoctylthiophene (POT)c received from Neste Oy, was placed in THF. A proportion of the (POT)c was dissolved in the THF. The solution was filtered and the THF allowed to evaporate giving POTc which was completely THF soluble.
5.3.2 Electrode N om enclatureTable 5.1 outlines the acronyms and their meanings for all of the electrodes which were examined.
Table 5.1;- Table o f acronyms fo r electodes to be described.Acronym Full Nam e and M eaning
(CPE) Conducting polymer electrodes which have only conducting polymer added/electropolymerised onto platinum (Pt) or Glassy Carbon (GC) substrate.
(CWE) Coated wire electrodes which have PVC ionophore layer directly in contact with Pt or GC substrate.
(SC) Solid-contact electrodes which have an intermediary conducting polymer layer i.e PT or POT, between the substrate and the PVC ionophore layer
(HFE) Hybrid film electrodes are prepared by mixing various quantities of (POT)c and PVC ionophore cocktail, and pipetting the mixture onto the substrate.
196

The following is an example o f an electrode name:-
(SC)Pt/PT/PVC(Lf)
The first term in this name (SC) reveals the type of electrode i.e. solid-contact. The next term (Pt) indicates what substrate is used i.e. platinum. The third term (PT) describes what conducting polymer is producing the solid contact and finally the last term indicates what cation the ionophore in the PVC cocktail is selective for i.e. PVC(Li+) contains a lithium selective ionophore.
5.3.3 E lectrode Fabrication and M easurem ents:-
5.3.3.1 Electropolym erisation of PT and PO T
The galvanostatic electropolymerisations were carried out using a Metrohm AG Herisau Coulometer, Type E211, with a Princeton Applied Research Model 174A Polarographic Analyzer being used to undope the polymer immediately after synthesis. The electrochemical cell was a conventional three-electrode system mounted on a Metrohm 663 VA Stand. The working electrode was a platinum (Pt) disk (Metrohm) (diameter 3 mm) set in teflon (overall diameter 7 mm) with a glassy carbon rod counter electrode (Metrohm). The reference electrode was a Ag/AgCl/KCl (3M) reference electrode (Metrohm) that was connected to the cell via a bridge filled with 0.1M LiBF^PC. All solutions were degassed by bubbling with high purity nitrogen. Electrodes were polished to a mirror finish with 0.3 fim of AI2 O3 paste and rinsed with water and chloroform.
Polythiophene (PT) and polyoctylthiophene (POT) were deposited by galvanostatic polymerisation of thiophene (0.1M) and 3-octylthiophene (0.1M) respectively in 0.1M LiBF^PC by passing a constant current of 0.1 mA (1.43 mA/cm2) through the system for 80 s. The amount of charge passed during polymerisation of PT and POT was previously found to be 8 mC [61]. The film thickness for POT prepared under these conditions has been estimated to be0.25±0.1 fim by using a Sloan Dektak II Profilometer [62], The electropolymerisation was performed at room temperature (23 ± 2°C) and the working electrode was rotated at about 1500 rpm during polymerisation.
The potential of the polymer electrodes was brought to 0 V and kept there for between 1 and 5 minutes immediately after polymerisation in order to reduce
197

(undope) the polymer films. After undoping, the electrodes were rinsed with PC and water and stored in aqueous solutions (lCH M LiCl) for 1 day for POT and for up to 4 days for PT prior to potentiometric measurements.
5.3.3.2 Application of ISE Cocktail to the Solid Contact
After checking that the polymers were giving a potentiometric cationic response similar to that previously obtained [61], the ion-selective cocktail was added. The electrode to be coated was clamped in an upright position and a 100 |_iL portion of the PVC cocktail containing the ionophore was pipetted on top. The electrode was protected from particulate contamination and allowed to dry for at least 10 hours resulting in an ion-selective membrane (ISM) on top of the PT or POT electrode. The resulting solid-contact ion selective electrode (SCISE) was conditioned for at least 12 hours in 0 . 1 M LiCl prior to being used for potentiometric measurements. Construction of the SCISE is shown schematically in Figure 5.8.
It has been shown that unlike PT or PPy, 3-alkyl substituted polythiophenes display solubility properties in a number of organic solvents [63]. Therefore it must be noted here that POT is slightly soluble in THF, the PVC cocktail solvent, and that a merger of the two polymeric layers inevitably occurred. After use the PVC layer was removed from the electrode and a complete coating of POT was still evident on the Pt surface, so it can be concluded that the interface between Pt and the rest of the electrode was entirely composed of POT.
198

2 3 3, 4, 5
41~ 1
5
SIDE VIEW TOP VIEW
Figure 5.8 Schematic description o f the active part (top) o f the solid contact ion-selective electrode (SCISE), with 1. teflon body, 2. ion-selective PVC based membrane, 3. PO T or PT solid contact, 4. Pt or GC substrate 5. electrical contact.
5.3.3.3 Preparation o f Coated W ire E lectrodes
The substrates used for the CWE i.e. platinum (Pt) and glassy carbon (GC), were polished and rinsed in the same way as for the SCISE. Thereafter 100 jj.L of ion- selective cocktail was applied on top of the bare electrode which was then allowed to dry overnight before being conditioned in 0.1 M LiCl.
5.3.3.4 Preparation o f H ybrid-Film Ion-Selective Electrodes
The working electrode was a glassy carbon (GC) disc, (Metrohm), diameter 3 mm set in Teflon with an overall diameter of 10 mm. Electrodes were polished with 0.3 jam alumina and rinsed with water and chloroform. A number of mixtures of chemically prepared polyoctylthiophene (POT)c and the ionophore PVC cocktail were prepared in 2 mL vials for application to the electrode (See Table 5.2). The total dry weight was kept constant at 12.27 mg, which is equivalent to the weight o f 100 fiL of the lithium ionophore PVC cocktail, after the THF had been allowed to evaporate. The (POT)c was dissolved in the ionophoric cocktail and THF was added to bring the volume to 120 j-iL.
199

Table 5.2 Hybrid Film Electrode (HFE) Compositions.
Electrode Name % POT Wt. of POT, ime) Vol. Cocktail (uL)(a) 0 0 1 0 0
(b) 5 0.61 95
(c) 1 0 1.23 90
(d) 15 1.84 85
(e) 2 0 2.45 80
(f) 25 3.07 75
(g) 50 6.14 50
00 75 9.20 25
- (i) 1 0 0 12.27 0
The electrode to be coated was clamped in an upright position and the PVC/POT solution was pipetted on top. The electrode was then protected from particulate contamination and allowed to dry for at least 7 hours. This left a black film (approximately 100-150 jam thick) on the glassy carbon substrate contact for all electrodes containing (POT)c. The electrode was then conditioned in a 0.1 M solution of LiCl for 12 hours before being examined for potentiometric cationic response.
5.3.4 Potentiom etric M easurem ents
5.3.4.1 Potentiom etric M easurem ents of Polym er Electrodes
All potentiometric measurements were carried out using a Metrohm 663VA Stand, connected to a Metrohm 632 pH Meter. The potentiometric response of the polymer electrodes, used as indicator electrodes, was obtained in conjunction with the Ag/AgCl/KCl (3M) reference electrode, connected to the cell via a bridge filled with the test solution (0.1M LiCl). No background salt was used since cationic sensitivity, not selectivity, is a feature of these polymer electrodes. The liquid junction potential arising from the concentration difference between the reference bridge (10_1 M) and the test solution (10_I - 10' 6 M) was taken into account and the potential values reported for the polymer electrodes have been corrected using the Henderson Equation [5] (equation 5.5). The polymer electrodes were equilibrated in each new solution for two minutes before a
200

reading was taken. The working electrode was rotated at 500 rpm during the first minute to enhance speed of equilibration and a value was taken 1 minute after the end of rotation. Film conditioning and potentiometric measurements were performed at room temperature in open air. The slope values quoted here have been calculated by linear regression using the three points spanning a concentration range of two decades (usually 10' 1 and 10' 3 M LiCl).
5.3.4.2 Potentiom etric M easurem ents of PVC Coated Electrodes
The potentiometric measurements of the SC polymer electrodes coated with PVC(Li+) and the lithium CWEs i.e (CWE)Pt/PVC(Li+)) were obtained in a similar manner to the polymer electrodes except that a background salt of KNO3
(0.1M) was used as the bridge solution and was also included in all of the LiCl standards from 10' 1 -10 ' 6 M. For the chloride selective CWE, i.e. (CWE)Pt/PVC(Cl‘) electrode no background salt was used in any of the measurements since N 0 3' and S 0 4_ were both found to interfere significantly with the chloride response. Therefore all values quoted are corrected for liquid junction potential using the Henderson equation (5.5). All slopes are calculated over the three decades from 10* 1 to 10- 4 M LiCl.
5.3.4.3 H ybrid Film Ion-Selective Electrodes
The hybrid-film polymer electrodes were used as the working electrodes and the reference electrode was an Ag/AgCl/KCl (3 M) electrode that was connected to the cell via a bridge containing 0.1 M K N 0 3 or 0.1 M LiCl depending on whether a background salt was present in the analyte solution.
For cationic response to LiCl measurements for electrodes 1-6 all LiCl solutions between 10_ 1 and 10' 6 M also contained a background salt of 0.1 M KNO3 . With electrodes 7 and 8 no background salt was used, since no cationic selectivity was being exhibited. Therefore the potentials shown have been corrected for liquid junction potential arising from the concentration difference between the reference bridge (10-1 M) and the test solutions (10_ 1 to 10- 6 M) by the Henderson Equation. The electrodes were equilibrated for two minutes in each cation solution prior to taking a reading. The solution was stirred with a magnetic stirrer for the first minute to increase speed of equilibration, and was then
201

allowed to rest for the second minute before a mV reading was taken. Film conditioning and potentiometric measurements were carried out at room temperature (23 + 2°C) in open air. The slopes presented have been calculated by linear regression using three points spanning a concentration of 2 decades from 1CH to 10' 3 M.
The limit of detection (LOD) was calculated as the concentration at which the response curve deviated from linearity by 18 mV. The response time is defined here as the time needed for the electrode to reach a stable potential value (within 1 mV of the steady state value) after a concentration step from 10- 4 to 1 0 - 3 M of the primary ion [64].
The stability o f all o f the electrodes was determined by examining the potential of each electrode in a solution of 10" 1 M LiCl over a 5-7 day period. The effect of nitrogen on the rest potential o f all o f the electrodes was examined. The electrodes were kept in open stirred solutions of 10" 1 M LiCl until a steady potential had been attained, and then purged with N 2 for 2 hours, with the potential being monitored continuously. The nitrogen was then removed and the potential once again monitored.
5.3.5 Estim ation o f Selectivity Coefficients
A selectivity constant or coefficient is used to indicate the extent to which an interfering ion (j), interferes with the response of an electrode to its primary ion (i) and has already been defined by the Nikolskii Equation (5.26)
Em = E ; + log [a, + I > r » r ] (5.26)
where z; and Zj are the charges on the ion i and j respectively and E° is the standard potential o f the electrode or a constant. The term selectivity coefficient can be misleading in several ways which are outlined below. This may result in coefficients that are not highly reproducible or precise being quoted a The selectivity coefficients for any interfering ions are dependent on the
ionic strength of the solution and the activity level at which the primary and interfering ions are measured,
202

b They depend on whether potentials are taken in mixed or separatesolutions containing the two ions,
ç The actual method/equation used to obtain the final result has an effect onthe calculated selectivity coefficient value,
d The membrane composition of the electrode e.g. the amount and type ofionophore, plasticiser and additives which is mainly determined by the membrane manufacturer, will affect the selectivity characteristics of a particular electrode.
Therefore it is crucial when quoting selectivity coefficient values that the composition of the electrode, the conditions under which the measurements were made and the methods used in the calculations are stated A number of methods have been outlined for obtaining estimates of kyPot, with the most frequently used methods being the separate and mixed solution methods which have been described in full by Moody and Thomas [6 ],
5.3.5.1 Separate Solution M ethod
A calibration curve is obtained for the primary ion (i) over the concentration range usually from 1 0 ' 1 to lO- 5 M. A similar curve is prepared for the interfering ion 0 ),see Figure 5.9, The selectivity coefficient can then be calculated by either of two methods (a) equal activities or (b) equal potentials.
(a) Equal Activities
The electrode potential, Ei, to the primary cation (i) only , is given by the Nemst equation
Ej =E° +S log ai (5.2)
where S = 2.303 RT/nFThe electrode response to a mixture o f cations is given by the Nikolskii equation(5.25) above. If the electrode is placed in a solution containing the interfering cation (j) only then can the potential (E2) to cation (j) be obtained from equation(5.25) by letting a = 0, and
203

e 2 = e° + s log k|“ ‘ a , (5.31).
When a; = aj and provided the valency o f the cations is the same i.e. zj = zj then
when the potentials Ej and E2 have been measured. Since the selectivity coefficients are activity dependent, for comparison purposes the chosen activity should always be reported (usually 10- 2 or 10_1 M).
(b) Equal Potentials.
Alternatively a method of equal potentials may be used. When = E2 equations (5.2) and (5.33) may be combined to give
The activities aj and aj can be read from the calibration curve (Figure 5.9), where the potentials Ei and E2 are equal. If the primary and interfering ions have different charges, the equation may be modified to
kPot can be calculated from
log k?;1= — - (5.32)
(5.34)
204

log activity
Figure 5.9:- Estimation o f the selectivity coefficient ki}Pot using separate solution method. (A) Response to primary ion (i) only; (B) response to interfering ion (j)
only [6].
lo g a c t i v i t y
Figure 5.10:- Estimation o f selectivity coefficient (kÿPot) using the mixed solution
method, [6].
205
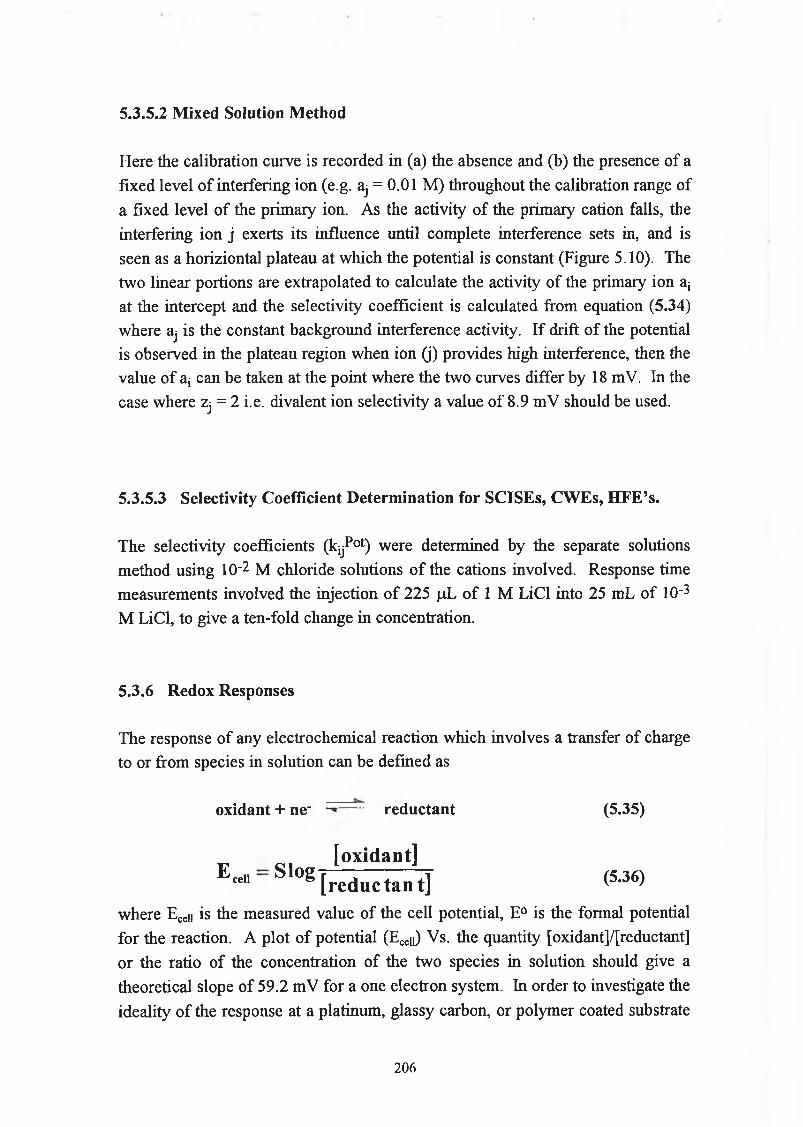
5.3.5.2 Mixed Solution Method
Here the calibration curve is recorded in (a) the absence and (b) the presence of a fixed level of interfering ion (e.g. aj = 0.01 M) throughout the calibration range of a fixed level of the primary ion. As the activity of the primary cation falls, the interfering ion j exerts its influence until complete interference sets in, and is seen as a horiziontal plateau at which the potential is constant (Figure 5.10). The two linear portions are extrapolated to calculate the activity of the primary ion aj at the intercept and the selectivity coefficient is calculated from equation (5.34) where aj is the constant background interference activity. If drift o f the potential is observed in the plateau region when ion (j) provides high interference, then the value of aj can be taken at the point where the two curves differ by 18 mV. In the case where Zj = 2 i.e. divalent ion selectivity a value of 8.9 mV should be used.
5.3.5.3 Selectivity Coefficient D eterm ination for SCISEs, CW Es, H FE ’s.
The selectivity coefficients (kjjPot) were determined by the separate solutions method using 10- 2 M chloride solutions o f the cations involved. Response time measurements involved the injection of 225 |iL o f 1 M LiCl into 25 mL of 10' 3
M LiCl, to give a ten-fold change in concentration.
5.3.6 Redox Responses
The response of any electrochemical reaction which involves a transfer of charge to or from species in solution can be defined as
oxidant + ne_ ----- reductant (5.35)
[oxidant]ECeii Slog [re(jUctant] 5’36
where Ecell is the measured value of the cell potential, E° is the formal potential for the reaction. A plot of potential (Eceu) Vs. the quantity [oxidant]/[reductant] or the ratio of the concentration of the two species in solution should give a theoretical slope of 59.2 mV for a one electron system. In order to investigate the ideality o f the response at a platinum, glassy carbon, or polymer coated substrate
206

electrodes, an oxidant/reductant couple was chosen whose standard potential falls within the semiconducting range of the polymers polythiophene or polyoctylthiophene i.e.less than approximately 0.9 V. The redox couple based on the potassium salts of iron ferric/ferro cyanate was found to be suitable.
Fe(C N )63' + e- Fe(CN)64* E° = 0.36V (5.37)(F e ll l) (F e ll)
The redox sensitivity of the different electrodes was examined by measuring the potential of the redox couple Fell/Felll in various ratios with the total Fe concentration being 10-3 M, and in the presence o f a constant background ionic concentration of 10'1 M LiCl. The potential vs. log ([Fe(HI)]/[Fe(II)]) was then plotted and the slope determined. The ratio was changed from 10/1 to 1/1 to 1/ 10.
207

5.4 Results and Discussion
5.4.1 Ionic R esponse o f Electrodes with Lithium Selective M em branes
5.4.1.1. (C PE)Pt/PT and (C PE)Pt/PO T
The cationic response of the galvanostatically polymerised platinum electrodes to LiCl was examined prior to coating with the lithium selective cocktail. Even after four days of conditioning of the (CPE)Pt/PT electrode in 0 .1M LiCl, a poor cationic response of 17.65 and 35.65 mV/dec was obtained. Hysteresis on measuring potentials from 10_1 to 10-4 M and then from 10-4 to 10_1M was significant with large differences in slope also being noted, (Figure 5.11a). Previously a slope of 39.4 mV/dec had been achieved for a similarly prepared electrode [61]. In order to reduce this hysteresis effect and to try and improve the electrode response, the electrode was conditioned for a further 16 hours in 10-4 M LiCl, (Figure 5.11b) The performance of a PPy electrode was previously shown to be affected by the concentration of conditioning solution, with a decrease in initial potential and an improvement of slope being seen with a decrease in concentration of conditioning solution [57],
This time a best slope of 39.6 mV/dec. was obtained and although hysteresis was still evident, it was decided at this stage to coat with the lithium selective PVC membrane. After allowing the PVC membrane to dry for 12 hours and subsequently conditioning for 12 hours in 0.1 M LiCl, the electrode's response to LiCl was measured.
208

Log[LiCl] / M
Figure 5.11 (a).'-Potentiometrie Response o f (CPE)PtZPT electrode to LiCl after 4 days conditioning in 0 .1M LiCl, in the presence o f no background electrolyte.
Log[LiCl] / M
Figure 5.11 (b) .'-Potentiometrie Response o f (CPE)PtZPT electrode to LiCl after a further 12 hours conditioning in 1 O'4 M LiCl, in the presence o f no background electrolyte.
* Analysis Order 10 1 - 10^ M
** Analysis Order IO-4- 10 1 M
209

The (CPE)Pt/POT electrode exhibited a slope of 41.1 mV/dec. after 20 hours conditioning in 0.1 M LiCl and was coated with the lithium selective cocktail at this stage (Figure 5.12).
Log[LiCl] / M
Figure 5.12:-Potentiometric Response o f (CPE)PtZPOT electrode to LiCl after 20 hrs. conditioning in 0.1M LiCl, in the presence o f no background electrolyte.
* Analysis Order 10 1 - 10 5 M
** Analysis Order 10 5 - 10 1 M
5.4.1.2 Ionic R esponse o f (SC)Pt/PT/PV C (Li+), (SC)Pt/PO T/PVC(Li+) and (C W E)Pt/PV C (Li+)
The response characteristics of the three different lithium selective electrodes measured at 23°C are outlined in Table 5.3. The coated wire electrode,(CWE)Pt/PVC(Li+), shows a slightly better cationic response, with a mean slopeof 56.5 mV/dec. compared to 56 mV/dec. for (SC)Pt/PT/PVC(Li+) and 56.25 mV/dec. for (SC)Pt/POT/PVC(Li+). However, slightly superior selectivity along with lower limits o f detection are displayed by the (SC)Pt/PT/PVC(Li+) electrode. The theoretical slope for a monovalent ion is 58.8 mV/dec. at 23°C Selectivity is generally in the order Li+>Na+>K+>NH4+>Mg2+. Improved selectivity has previously been described for PVC electrodes incorporating
210

polpyrrole (PPy) as the conducting polymeric solid contact [1], compared to corresponding conventional ISE’s.
Table 5.3 Cationic R esponse of Lithium Containing Electrodes.
Electrode SlopeCmV/dec.)
l o d nvn KLi+.Na+ KU+JÇ+ KLi+1NH4+ K L i+ M g2 +
Pt/PT 3 5 . 1 5 - - - - -
Pt/POT 41.15 - - - - -
Pt/PT/PVC(L i+ )
56.00 2.09X10⁻⁴ -1.28 -1.29 -1.30 -2.27
Pt/POT/PVC(L i+ )
56.25 2.09xl0~4 - 1.22 -1.28 -1.30 -2.32
Pt/PVC
(Li+)
56.50 3.25xl0'4 -1.24 -1.28 -1.28 -2.32
H y s t e r e s i s :- Both the (CWE)Pt/PVC(Li+) and the (SC)Pt/POT/PVC(Li+) electrode exhibited a difference between potential values on going from 10_I to 10~6 M LiCl (analysis order 1) and then returning from 10-6 to 10_I M (analysis order 2). On reading the potentials a third time (analysis order 3), very little further difference is noted between solutions o f the same concentration. This effect is not evident with the (SC)Pt/PT/PVC(Li+) electrode where potential values of solutions of the same concentration are very similar. This point is illustrated in Figure 5.13(a), 5.13(b) and 5.13(c) for (SC)Pt/PT/PVC(Li+), (SC)Pt/POT/PVC(Li+) and (CWE)Pt/PVC(Li+) electrodes respectively where the response to LiCl at varying concentrations is shown. The existence of hysteresis effects during initial electrode use should therefore be considered and the electrode should be calibrated prior to use with sufficient measurements of standards.
211

Log[LiCl] / M
Figure 5.13a:-Potentiometric response o f (SC)Pt/PT/PVC(Li+) electrode to LiCl in the presence o f 0 .1M K N 03 background electrolyte.
Log[LiCl] / M
F igure 5.13b:-Potentiometric response o f (SC) Pt/PO T/P VC (Li+) electrode to LiCl in the presence o f 0 .1M K N 03 background electrolyte.
* Analysis Order 10 1 - 10"6 M
** Analysis Order 10^ - 10 1 M
*** Analysis Order 10 1 - 10^ M
212

Log[LiCl] / M
Figure 5.13c:-Potentiometric response o f (CWE)Pt/PVC(Li+) electrode to LiC.l in the presence o f 0.1 M K N 03 background electrolyte
5.4.2 Tim e R esponse
Similar response times were observed for the SCISEs and the CWEs studied. The (SC)Pt/PT/PVC(Li+), (SC)Pt/POT/PVC(Li+) and the (CWE)Pt/PVC(Li+) showed response times o f under 10 s, including the time needed for mixing of the added solution. It is encouraging that the response times are similar to the corresponding CWEs , since an extra conduction process is envisaged for the SC electrodes.
5.4.3 Stability
The long term stability of the electrode potentials is of great importance in practical applications of ion-selective electrodes. Typically the performance of many CWEs is characterised by irreproducible potentials, noise and overshoot of potentials, with such problems generally occurring during the first few days. One of the main purposes of this work was thus to investigate the possibilities of producing a stable SCISE having PT or POT as the solid contact. The stability of
213

the electrode potentials for the (SC)Pt/PT/PVC(Li+), (SC)Pt/POT/PVC(Li+) and the (CWE)Pt/PVC(Li+) are shown in Figures 5.14(a), (b) and (c) respectively.For the (CWE)Pt/PVC(Li+) electrode, Figure 5.14(c), a continuous steady decrease in potential was observed for 7 days after the initial 53 mV drop observed during the first 12 hours, with a further 132 mV decrease being observed over these final 7 days. So overall the electrode cannot be considered stable with approximately a 20 mV decrease in potential each day. CWEs have been previously shown to be unstable [19], Since the coupling between the metal and the coating in CWEs can be described as capacitive and the contact potential is distributed between the capacitors o f the two surfaces, the sensitivity o f the capacitive coupling to external substances penetrating between the coating and the metal is detrimental to stability. Behaviour which resembled a discharging capacitor was noted with all of the (CWE)Pt/CWEs studied. After the gradual drift to lower potentials over a number of days, the electrodes were removed from the analyte solution and placed in new solutions of 0.1 M LiCl. The potentials of the electrodes were found to have returned to approximately their original values. The reason for such behaviour is unclear at this point but it is possibly due to some internal boundary effect.
For the (SC)Pt/PT/PVC(Li+) electrode an initial sharp decrease in potential of 50 mV occurred during the first 48 hours, (Figure 5.14(a)). The rate of change in potential then reduced slightly and continued decreasing at the new level for the remaining three days, with the final potential after the 5 days stability study being 94 mV lower than the original potential value on day 1. This electrode would appear to be slightly more stable than the CWE especially after a number of days when the initial drift seen is reduced to about 10 mV/day. A 10 mV drift/day however cannot be seen as ideal electrode behaviour. When the electrode was transferred into a fresh solution of LiCl at the end of the stability study, the immediate potential change observed for the (CWE)Pt/PVC(Li+) electrode was not witnessed, but instead it assumed the same potential it had before its transfer.
The drift observed may be due to a further anionic equilibration between the layers, with any remaining BF4“ from the polymerisation passing through the PVC layer trying to set up an equilibrium with the Cl“ anions, which would permeate the PVC membrane from the LiCl solution a lot more slowly than the Li+ cation, thus causing a drift in potential. It has previously been observed that measurements on conducting polymers doped with BF4“, on a platinum substrate,
214

yield higher initial potentials than those doped with other anions [65]. In this work BF4- was used as the doping ion during polymerisation and although the electrode was undoped after polymerisation, some residual BF4- may have remained in the polymer layer giving a slightly higher initial potential than would exist if the polymer was totally undoped.
With the (SC)Pt/POT/PVC(Li+) electrode, a potential within ±12 mV of the potential reached within 2 days of the beginning of the study was maintained. Again a large initial potential change of 104 mV was observed during the first 48 hours of the stability study, before a levelling off became apparent. This electrode appears to be the most stable of the three electrodes examined and again the capacitor discharge effect was not observed on transferring the electrode into a new solution.
Time (Hours)
Figure 5.14(a)’.-Stability study o f (SC)Pt/PT/ISE(Li+) in 0.1 M LiCl in the presence o f 0 .1M K N 0 3.
215

350 r
300 -
1 0 0 4 1----------------------- 1-----------------------1------------------------1---------------------- 1----------------------- 1— ------------ 1------------------------1----------------------- 1
0 20 40 60 80 100 120 140 160 180
Time (Hours)
Figure 5.14(b).'-Stability study o f (SC)Pt/POT/ISE(Lf) in 0.1 M LiCl, in the presence o f 0.1M K N 0 3.
Time(Hours)
Figure S.14(c):-Stability study o f (CWE)Pt/ISE(Li+) in 0.1 M LiCl, in the presence o f 0.1M K N 03.
216

5.4.4 Oxygen Dependence
The potential of CWEs is also known to be dependent on the partial pressure of oxygen [66, 67]. Table 5.4 shows the change in potential of 10' 1 M LiCl solutions which had been allowed to reach a steady potential in open stirred solutions, before purging with nitrogen for 2 hours.
Table 5.4 Effect o f 0 2 on E lectrode Potential.
Electrode
Type
Electrode Initial Potential
MY)
Final Potential (mV)
AE fmV)
Pt 329 249 80
(CPE) Pt/PT 347 295 52
(CPE) Pt/POT 311 289 22
(SC) Pt/PT/PVC (Li+) 253 227 26
(SC) Pt/POT/PVC (Li+) 320 306 14
(CWE) Pt/PVC(Li+) 329 311 18
From these results, we can see that the bare platinum electrode is affected the most by the presence of O2. Unlike the polypyrrole system previously described [1], where the (CPE)Pt/PPy electrode in which the PPy was in its doped form, displayed no potential change, both PT and POT do exhibit a potential decrease when purged with N2. The (CPE)Pt/PT electrode showed a larger potential change than the (CPE)Pt/POT electrode. The potential changes are however smaller than that seen for the Pt electrode on its own. This suggests that by coating the Pt electrode with these semiconducting polymers the effect of 0 2 on the platinum electrode can be reduced.
The effect o f 0 2 on the electrodes is further reduced when each of the semiconducting polymers is coated with the PVC-ionophore cocktail suggesting that both semi-conducting polymer layers are more permeable to O2 than the ionophoric PVC layer. The (CWE)Pt/PVC(Li+) electrode displays an 18 mV drop in potential under the same conditions indicating the capability of oxygen to penetrate the PVC membrane to the platinum surface. The polypyrrole layers
217

used in analogous work had an estimated thickness of 8 jun [ 1 ] whereas the polymer layers in this work are approximately 0.25 jim [62]and this could account for the increased influence of oxygen on the rest potential. All electrodes showed a tendency to return to approximately their original potential upon cessation of nitrogen purging.
5.4.5 Redox Response
The results of the redox response measurements are summarised in Table 5.5. The bare Pt electrode displayed a Nemstian response whereas the (CPE)Pt/PT and (CPE)Pt/POT electrodes displayed a sub Nemstian response but with some electronic conduction being evident. This was to be expected since both polymers used in this system are in their undoped/semiconductive state. The fact that a response is obtained indicates that some electronic transmission to the Pt layer is possible. When the PVC(Li+) layer was added no redox response was observed, since there is no mechanism present for electron transport in the PVC. Hence the PVC layer can protect the inner Pt or semiconducting polymer layer from the effects of strong oxidising or reducing agents in solution.
Table 5.5 Redox R esponse
ElectrodeType
Electrode Slope (mV/decade)
Pt 58.2
(CPE) Pt/PT 30.0
(CPE) Pt/POT 35.1
(SC) Pt/PT/PVC (Li+) -0.5
(SC) Pt/POT/PVC (Li+) -1.5
(CWE) Pt/PVC(Li+) -0.5
218

5.4.6 Effect of Conditioning Solution on Electrode Response
A PT polymeric film was prepared as previously described and was conditioned for 2 days in KC1 after synthesis. A cationic sub-Nemstian slope was obtained ie 36.25 mV/dec. At this stage a Na+ selective PVC-ionophore cocktail was added to the electrode to yield a (SC)Pt/PT/PVC(Na+) electrode. After drying, the electrode was conditioned for 24 hours in NaCl before its response to NaCl was examined, Figure 5.16. A slope of 56.72 mV/dec was obtained and a selectivity coefficient o f Na+ against K+ was calculated to be -1.65 indicating that the electrode was responding selectively to its primary ion.
Log [NaCl] /M
Figure 5.16:-Response o f (SC)Pt/PT/PVC(Na+) electrode to NaCl in the presence o f no background electrolyte.
219

5.4.7 Conclusion
Electrode systems incorporating the semiconductive polymers PT and POT as a solid contact between a platinum substrate and a PVC layer containing a lithium selective ionophore have been successfully made and compared to a CWE using the same ionophore. Both types of electrode give comparatively the same lithium response with a slope of approximately 56 mV/decade and the (SC)Pt/PT/PVC(Li+) electrode shows slightly superior lithium selectivity over a number of cations. Stability, although not ideal at this stage, was better for the solid contact electrodes compared to the CWE, with the (SC)Pt/POT/PVC(Li+) electrode showing the best stability. The partial pressure of oxygen in analyte solutions was found to have an influence on solid contact electrodes which is in direct contrast with the findings of the electrically conducting doped PPy and may be a consequence of the thinner conducting polymer layers used in this work. Redox results suggest that electronic information can be conducted through the polymer layers and this would appear to be involved in the mechanism of information transmission in the overall electrode system.
220

5.5 Comparison o f Chloride Selective Solid Contact Electrodes and Coated
W ire Electrodes
The next stage of the work involved trying to ascertain whether a cation sensitive electrode such as (CPE)Pt/PT or (CPE)Pt/POT could be made anion selective by the addition of an anion selective PVC membrane. The anion which was to be determined was chloride and it was decided to keep the nature of the cation constant throughout all of the work so again lithium was used.
5.5.1 Ionic R esponse
The cationic response of both polymer layers was again examined prior to coating. The (CPE)Pt/PT electrode was conditioned for 4 days in 0.1 M LiCl. The response was very poor compared to that obtained previously [61], with a slope o f 28.37 mV/dec being obtained. The electrode was conditioned for a further 36 hours in 10- 4 M LiCl. Again the response was not very good and the electrode was conditioned for a further 36 hours in 0 .1M LiCl before an adequate response was obtained with a slope of 35.1 mV/dec. Hysteresis was again evident but this did not seem to have really affected the final (SC)Pt/PT/PVC(Li+) electrode response, so it was decided to coat with PVC containing Cl' selective ion-exchanger ionophore , PVC(Cl-) at this stage. The cationic response of (CPE)Pt/POT was not as good as that previously obtained, with a slope of 31.70mV/dec. being observed, but it was decided to go ahead with it after 27 hours conditioning in 0.1 M LiCl. Electrochemically synthesised conducting polymer electrodes are susceptible to changes in polymerisation conditions, and all parameters must be rigidly adhered to if reproducible films are to be prepared. Parameters such as the presence of oxygen, presence of water and polymerisation temperature can greatly affect the properties of the layer produced.
The PVC layers were allowed to dry for at least 12 hours before being conditioned in 0.1 M LiCl. No background electrolyte was used in any of the measurements since N 0 3’ and S 0 4 ’ were both found to interfere significantly with the chloride response. Therefore, all values quoted have been corrected for liquid junction potential using the Henderson equation. All slopes have been calculated over three decades with four points between 10' 1 and 10' 4 M.
221

The results for the chloride selective electrodes are shown in Table 5.6 with data obtained from the response curves 5.17(a), (b) and (c) for the(SC)Pt/PT/PVC(Cl‘), (SC)Pt/POT/(Cl') and the (CWE)Pt/PVC(Cl') respectively.
Table 5.6 Ionic Response of Chloride Electrodes
Electrode
Tvpe
Electrode Slope imV/Decade') L.O.D. ÎMÏ
(CPE) Pt/PT 35.15 -
(CPE) Pt/POT 31.70 -
(SC) Pt/PT/PVC (Cl") -61.95 3.20xl0-5
(SC) Pt/POT/PVC (C1-) -62.55 1.40xl0"5
(CWE) Pt/PVC(Cl") -63.45 7.93x10⁻⁶
Both solid contact electrodes showed near Nemstian anionic response with (SC)Pt/PT/PVC(Cl") giving the best response ie. -61.96, compared to the coated wire version, (CWE)Pt/PVC(Cl_) which gave a slope of -63.45. However, the Pt/PVC(Cl") electrode showed a better L.O.D. Hysteresis did not seem to be a problem with any of the three electrodes, with similar potential values being obtained for each electrode when the potential was measured from 1 0 " 1 to 1 0 " 6
M, and in reverse from 10- 6 to 10" 1 M. Selectivity measurements for different anions were not carried out since the Cl" ionophore was found not to be particularly Cl" selective. Any anions examined interferred significantly with the Cl" response and no suitable background salt for selectivity measurements could be obtained. The aim of this section of the work was to establish whether the principle of reversing a cation selective electrode could be carried out. Therefore the lack of selectivity displayed by the particular ion-exchanger used is not really detrimental to the findings at this stage but for future work, where ion sensors are being developed, like with all ISEs initial ion selectivity of the ionophore or ion- exchanger is crucial.
222

LogfLiCl] / M
Figure 5.17(a):- Response o f (SC)Pt/PT/P VC(Cl') electrode to LiCl in the presence o f no background electrolyte.
Log[LiCl] M
Figure 5.17(b):- Response o f (SC)Pt/POT/PVC(Cl-) electrode to LiCl in the presence o f no background salt.
223

LogfLiCl] /M
Figure 5.17(c):- Response o f (CWE)Pt/PVC(Cl~) electrode to LiCl in the presence o f no background electrolyte.
5.5.2 Stability
The stability studies for the (SC)Pt/PT/PVC(Cl-), (SC)Pt/POT/PVC(Cl') and (CWE)Pt/PVC(Cl') are shown if Figures 5.18(a), (b) and (c) respectively. The (SC)Pt/PT/PVC(Cl-) electrode like its lithium analogue shows a continuous decrease in potential over the duration of the seven day stability study (Figure 5 .18(a)). The final rate o f the potential decrease is established within the first 1 0
hours unlike the (SC)Pt/PT/PVC(Li+) electrode which took 48 hours to reach its final rate of potential change. This however could be an ionophore effect. The final potential was 119 mV less than the initial potential, and still decreasing at a rate o f about 15 mV/day. This decrease in potential could be due to a further decrease in BF4* anion concentration in the electrode system as was previously discussed.
The (SC)Pt/POT/PVC(Cl‘) electrode showed very good stability over an 8 day stability study (Figure 5.18(b)). A final potential value of ±10 mV was achieved in under 24 hours with no continuous decrease during this time. This ability to stay at approximately the same potential over a number of days was also
224

exhibited by the Li+ analogue of this solid contact material ie (SC)Pt/POT/PVC(Li+)
The (CWE)Pt/PVC(Cl‘) electrode, after an initial 212 mV decrease in the first 40 hours, maintained a final potential within ±16 mV of this value for a remaining 4 days, but with larger variations in potential between days than those observed for (SC)Pt/POT/PVC(Cl*) (Figure 1.6c). Again a return of the potential to its original value was seen when the electrode was transferred to a new solution of LiCl at the end of the stability study, illustrating the difficulities in obtaining stable CWE potentials.
So it can be concluded again from these stability studies that the POT solid contact electrode offers the most stable system, but in general the Cl' electrodes appear to be more stable than their Li+ equivalents.
0 20 40 60 80 100 120 140 160 180 200Time (Hours)
Figure 5.18(a) ¡-Stability study o f (SC)Pt/P T/P VC (Cl') in 0.1 M LiCl in the presence o f no background electrolyte.
2 2 5

450 t
I!4 0 0 --
> 3 5 0
E,
• 2 3 0 0 --e<uo
150 I--------- 1----------!----------1----------1--------- 1----------1----------1----------1--------- 1--------- 10 20 40 60 80 100 120 140 160 180 200
Time (Hours)
Figure 5.18(b):-Stability study o f (SC)Pt/POT/PVC(Cl-) in 0.1 M LiCl in the presence o f no background electrolyte.
Time (Hours)
Figure 5.18(c)¡-Stability study o f (C WE)Pt/P VC(Cl~) in 0.1 M LiCl in the presence o f no background electrolyte.
226

5.5.3 Oxygen Study
The effect of the presence of O2 on the various electrodes is demonstrated in Table 5.7, where the change in potential of each electrode over a 2 hour period in which the electrode solution, 0.1 M LiCl was purged with N 2 . The chloride CWE shows a slightly bigger potential decrease to that observed for the lithium CWE ie 36 mV vs 18 mV, but again the potential reduction is an indication that the PVC ionophore layer is to a certain extent 0 2 permeable. The potential change is found to be decreased with the addition of the PVC(Cl') onto the solid contact electrodes. This is a similar effect to that observed with the Li" selective analogues. PT or POT as earlier stated do not block the permeation of O 2 to the Pt surface but do reduce it and a combination of both semi-conducting polymer and PVC reduces the influence of O2 on the overall electrode response.
Table 5.7 Effect o f O 2 On Electrode Potentials
ElectrodeType
Electrode Initial Potential (mV)
Final Potential (mV)
AE (mV)
Pt 329 249 80
(CPE) Pt/PT 347 295 52
(CPE) Pt/POT 311 289 22
(SC) Pt/PT/PVC (C1-) 213 196 17
(SC) Pt/POT/PVC (C1-) 320 306 14
(CWE) Pt/PVC(Cl-) 333 297 36
5.5.4 Redox Response
Table 5.8 shows the redox responses of the different combinations of electrodes which also incorporate the chloride selective membrane. The electronic conduction observed with Pt/PT and with Pt/POT in the form of a sub-Nemstian redox response, is non-existent once the PVC(Cl') layer forms the redox solution/electrode interface indicating the inability of the PVC to provide a mechanism of electronic conduction and that electronic transmission cannot occur between the PVC and the semiconducting polymer layers. These results
227

corroborate the conclusions drawn in section 5.4, that the PVC layer has the potential to protect the inner conducting polymer layer from the effects of stong oxidising or reducing agents in sample solutions.
Table 5.8:- Redox Response of Electrodes Incorporating Chloride Ionophore.
Electrode Tvpe Electrode Slope (mV/Decade)
Pt 58.2
(CPE) Pt/PT 30
(CPE) Pt/POT 35
(SC) Pt/PT/PVC (Li+) -1.5
(SC) Pt/POT/PVC (Li+) -0.5
(CWE) Pt/PVC(Li+) -1.5
5.5.5 Conclusion
The successful conversion of a cation sensitive electrode ie Pt/PT and Pt/POT to an anion sensitive electrode was carried out by the addition of a chloride selective PVC membrane to the solid contact electrodes. The coated wire electrodes displayed the best chloride sensitivity and the POT solid contact electrode exhibited the best stability. No redox sensitivity was shown by any of the PVC coated electrodes due to the absence of any electronic conduction mechanism. This is also an indication that the initial ionic analyte concentration variation is transmitted through the PVC ionophore membrane by ionic conduction.
228

5.6 Discussion to sections 5.4 and 5.5, Solid Contact Lithium and Chloride
Selective Electrodes.
The experiments described in sections 5.4 and 5.5 were carried out to determine whether PT and POT could be incorporated into an electrode between a Pt substrate and a PVC ion-selective membrane to produce a functioning electrode and to build up a picture of the mechanism of operation of such electrodes. From the ionic response studies (section 5.4.1 and 5.5.1) it was clear that a semiconducting PT or POT electrode exhibiting sub-Nemstian cation sensitivity could be made either cation (Li+) or anion (Cl") selective by the addition of a PVC layer containing the appropriate ionophore. Such electrodes were capable of giving near Nemstian responses to their primary ion.
None of the stability studies (section 5.4.3 and 5.5.2) gave results for electrodes which could be classed as stable i.e + 2 mV/day, but the inclusion of the Pt or POT semi-conducting layers in the electrodes was found to produce electrodes which were more stable than their coated wire equivalents. The lack of stability o f the CWEs was demonstrated by a constant reduction in potential with time, but with a return of the potential to its original value when the electrodes were transferred to a fresh solution. The exact reason for such behaviour is not understood but it could be due to an internal boundary effect. No such behaviour was shown by any of the solid contact electrodes giving an initial indication of an alternative, potentially less erratic, mechanism of conduction being involved in the solid contact electrodes. The POT solid contact electrodes showed the best stability, with a maximum variation after the initial potential decrease, which was displayed by all of the electrodes of ± 12 mV/day. The overall lack of day to day stability exhibited by these electrodes could be a consequence of the effect of variations of the partial pressure of 0 2 on the electrode potentials.
The chloride selective electrodes displayed improved stability compared to their lithium counterparts for all three electrode types i.e. (SC)Pt/PT/PVC(Cl‘), (SC)Pt/POT/PVC(Cf) , (CWE)Pt/PVC(Cl'). This could be an effect of the particular ion-exchanger used, but the failure of KONE to release information on the characteristics o f these ionophores precludes further comment. Alternatively this difference in stability may be due to slight mechanistic variations between the generation of a cationic response and the generation of an anionic response.
229

The results obtained from the redox studies (section 5.4.5 and 5.5.4) are very important from the point of view of describing a possible mechanism for the solid contact electrodes. The fact that both (CPE)Pt/PT and (CPE)Pt/POT electrodes display a response although not Nemstian, to the presence of a redox couple is indicative of electronic conduction in the PT or POT layers to the Pt substrate. This is a vital piece of information as it indicated that both PT and POT have the capability to behave as an electron exchanger which is absent in CWEs. No redox response is displayed by the Pt/CWE electrodes and the addition of the PVC ionophore layer to the semi-conducting polymers results in the removal of the redox sensing capabilities of the electrode. This is also an important feature of the solid-contact electrode since a mixed ionic and redox response is obviously undesirable [57], The lack of selectivity and sub-Nemstian responses exhibited by potentiometric electrodes made using conducting polymers which has been ascribed to a mixed redox-ionic response is effectively eliminated by the addition o f the ionically conducting PVC-ionophore layer.
The potentiometric response displayed by the electrically polymerised PT and POT, both in this work and in previous research [61], strongly suggest that PT and POT behave preferentially as cation exchangers in their undoped semi- conductive state. From the potentiometric studies carried out, potentials of the polymer electrodes were in the range 0.1 to 0.45 V, which are below the oxidation potential for PT and POT. Hence the polymers are believed to remain in their undoped state during these measurements. The potential at which these electrodes operate, coupled with the redox response results, give an indication that changes in sample ion concentrations, can be transmitted to electronic conduction at the Pt substrate because of the mixed response of the PT and POT layers.
By collating the data obtained with these electrodes an analogous interface diagram to that presented for the PPy solid contact system [ 1 ] can be drawn.
230

D iagram 5.1:- Schem atic diagram o f the charge transfer processes between the three interfaces o f the P T or P O T so lid contact lithium selective electrode. C + = conditioning cation, S ' =charge on su lphur atom s o f thiophene rings, I =
ionophore.
The following charge transfer processes are thought to occur i Li+ or Cl" exchange at the PVC/analyte solution interface
or
or
Li+(aq) I(m) ^ i+ I(m) (5.38a)
Cl (aq) (m) (m) Cl (5.38b)
where (aq) is the aqueous phase, (m) represents the PVC membrane phase and I is the ionophore.
ii Transport o f the charged complex within the bulk PVC layer :(Li+I)' - — (Li+I)" (5.39a)
(I C l')’ m (ICl-)"m (5.39b)
where (") is the external side and (') is the internal side of the PVC membrane.
iii Exchange of ions at the PT or POT/P VC interface.iv Electron transport within the PT or POTv Electron transfer at the Pt/PT or Pt/POT interfacevi Electron flow within the metal.
The PT and POT layers in their undoped state are cation sensitive [61]. This sensitivity has been attributed to a possible interaction between the electron donating sulphur atoms of the thiophene rings forming the polymer backbone with cations. Therefore a cation equilibrium is set up at the Pt/PT ot Pt/POT
231

interfaces, in contrast to the anion equilibrium illustrated by Cadogan et al [1], A constant bulk concentration of Li+ both in the PT or POT and in the lithium selective PVC membrane is providing a sufficient driving force to control a local equilibrium at this interface and thereby maintain a constant gradient of electrical potential.
In the chloride selective solid contact electrodes, the cation potential is maintained by both the Li+ in the PT or POT as before and also with the ion exchanger which is a component of the ionophoric cocktail. Therefore again there is a sufficient driving force to control a local equilibrium at the SC/PVC interface.
So in both the cationic and anionic selective electrodes a cationic equilibrium is set up at the PT/PVC/solution interfaces and throughout the bulk PVC membrane during conditioning with the possibility of some neutral salt formation between the Li+ and the Cl' anion especially in the (SC)Pt/PT/PVC(Cl_) or (SC)Pt/POT/PVC(Cl_) electrodes not being ruled out. A disruption of this equilibrium by a change in PVC membrane ion concentration results in the ultimate electronic conduction of a change through the electropolymer to the Pt substrate.
From a stability view point the most important process of the solid contact electrode is that described by process iii where effectively the transfer o f ionic to electronic information is accomplished. The apparent lack of such an interface in CWEs has been offered as an explanation for the lack of stability of CWEs.
In conclusion, the inclusion of a a mixed ion/e" conducting electropolymer such as PT or POT, has the power to "unblock" the interface between the ionically conducting PVC-ionophore membrane and the electronically conducting substrate.
232

5.7 Hybrid-Film Electrodes
Introduction
Up to this point the solid contact approach for a solution to the blocked interface problems, among others, of the CWE, has involved a three tier electrode approach ie. a substrate like Pt or GC coated with conducting polymer and then subsequently coated with the traditional PVC layer containing the ionophore of interest. A mixture of the two polymers, conducting and PVC to form a hybrid- film electrode which would have the inherent properties of both the electronically conducting PPy, PT or POT and the ionically conductive PVC cocktail has not been extensively examined due to solubility problems of PPy and PT in THF and most organic solvents, the solvent which is used in casting PVC ISEs. However, POT is a member of the polyalkylthiophene (PAT) family which is known for solubility in organic solvents, is slightly soluble in THF, so it was decided to utilise this property to examine the possibilities of such a system.
The incorporation of a conducting polymer into a membrane which was then used in a conventional ISE arrangement has previously been described by Pearson et al [56], In the electrodes described doped PPy which had been prepared either chemically or electrochemically was ground to a fine powder in an agate mortar and was then mixed with an approximately equal weight o f either PVC or silver sulphide. After further grinding of the mixtures to give homogeneous PPy-PVC binder mixtures THF was added and the resulting disc produced after evaporation was used in a conventional ISE arrangement. The ion-selective nature of the membrane was provided solely by the presence of the doped PPy. All of the electrodes of this format except one gave a sub-Nemstian anionic responses with a cationic response being seen for an electrode whose PPy component had been prepared by cycling to -0.75 V on the reverse scan. Undoping to such low levels may cause an influx of cations into the membrane to effect electroneutrality. The sub-Nemstain anionic responses were attributed to the possibility of insufficient numbers o f electroactive sites being available in the surface layers of the membrane. The work described in this section involves the mixing of chemically polymerised POT, (POT)c, with a lithium selective ionophore in different ratios and the assessment of each combination as a lithium selective electrode. So unlike the work described by Pearson et al [56] a solid contact configuration will be used which contains both ionically and electronically conducting materials.
233

Results and Discussion
It must be noted that the electrode containing 50% POT looked different to the other combinations. The film was not smooth like the others but appeared crumpled. This may have been due to the two different polymers drying at unequivalent rates causing the film to stretch.
5.7.1 Ionic Response
5.7.1.1 Hybrid-film E lectrodes on Platinum.
The first electrode of this type examined, used a Pt substrate. It was composed of approximately 10% POT and 90% PVC(Li+). It yielded a sub-Nemstian cationic response to Li+ with a slope of 43.75 mV/dec., (Figure 5.19). It displayed good stability over the latter 5 days of a 7 day stability test (Figure 5.20) and showed no redox response to various ratios of the Fell and Felll redox couple. The cationic response although sub-Nemstian, along with the apparent stability of the electrode and most importantly the lack of redox response of the electrode with this combination of electroactive and ionically active components was very encouraging. However, the black polymeric layer did not adhere very well to the Pt substrate and it actually fell off before selectivity measurements could be made. Therefore, further examination was carried out using GC as the substrate. This inability of (POT)c to adhere well to Pt was previously reported [6 8 ].
234

F igure 5.19:- Potentiom etric response o f a (HFE)Pt/IO%POT, 90% PVC(Li) electrode to LiCl, in the presence o f a background electrolyte o f 0.1 M K N 0 3
Time (Hours)
F igure 5.20:- S tability study with (HFE)Pt/10% POT, 90%PVC(Li) electrode in
0.1 M LiCl, in the presence o f 0.1 M K N 0 3
235

5.7.1.2 Hybrid-fïlm POT Electrodes Using Glassy Carbon as Substrate.
The ionic response of the various hybrid-film electrodes on glassy carbon is summarised in Table 5.9, with data obtained from the response curves 5.21(a)-(i).
Table 5.9 Ionic R esponse o f H ybrid-film Electrodes on GC.
Electrode
Name.
% POT Slope
mV/ Dec
LOD (M) KLi+.Na+ K y+jc+ KLi+.NH/|+ KLi+.Mg2+
(a) 0 56.00 2.11X10*4 -1.24 -1.29 -1.33 -2.33
(b) 5 56.00 2.59x10^ -1.27 -1.29 -1.39 -2.39
(c) 10 56.75 1.66X10⁻⁴ -1.31 -1.46 -1.49 -2.43
(d) 15 57.75 1.78X10⁻⁴ -1.40 -1.48 -1.61 -2.58
(e) 20 55.50 1.57x10^ -1.37 -1.47 -1.57 -2.49
(f) 25 56,75 1.76X10"4 -1.40 -1.47 -1.62 -2.45
(g) 50 20.75 3.30x10^ +0.14 +0.18 -0.55 -0.28
(h) 75 23.00 1.40x10“* +0.03 +0.05 +0.04 -1.03
0 ) 100 6.85 - -0.10 0.00 + 0.02 -1.00
For electrodes containing between 0 and 25% POT a near Nemstian response was obtained (Figures 5.21(a) - 5.21(f)). All o f these electrodes also displayed Li+ selectivity over Na+, K+, NH4 + and Mg2+. For electrodes prepared with 50 - 100% POT a poor cationic response was observed with slopes o f 20.8 and 23.0 being obtained for 50 and 75% POT respectively (Figure 5.21(g) and (h)) and a more anionic response being observed for the 100% POT (Figure 5.2l(i)). Lithium selectivity was non-existent for these three electrodes.
O f the electrodes containing between 0 and 25% POT, the 15% POT electrode, (HFE)GC/15%POT,85%PVC(Li+) gave the best slope and marginally better selectivity coefficient values. A slope of 57.75 mV/dec. was obtained for LiCl compared to 56.0 mV/dec. for the GC coated wire version, or (CWE)GC/0%POT,100%PVC(Li+) electrode. The selectivity values obtained for this electrode are also superior to those obtained for the (CWE)GC/0%POT,100%PVC(Li+) electrode with kLiNaPot of -1.40 compared to -1.24 being obtained. These selectivity and slope values are also better than those obtained for the solid contact electrodes prepared with both PT and POT described earlier. However a different substrate was used i.e. Pt, and for a direct comparison to be made PT and POT solid contacts should be prepared by
236

electropolymerisation on GC. The LOD of 1.78x10‘4 M is also an improvement on that obtained with the analogous CWE and SC lithium selective electrodes discussed in section 5.3.
Log[LiCI]/M
Figure 5.21(a):- Potentiometrie response o f a (CWE)GC/0%POT, 100%PVC(Li+) electrode to LiCl, in the presence o f 0 .1 M K N 0 3
LogfliCl] / M
Figure 5.21(b):- Potentiometrie response o f a (HFE)GC/5%POT, 95%PVC(Li+ ) electrode to LiCl, in the presence o f 0 .1M K N 0 3
237
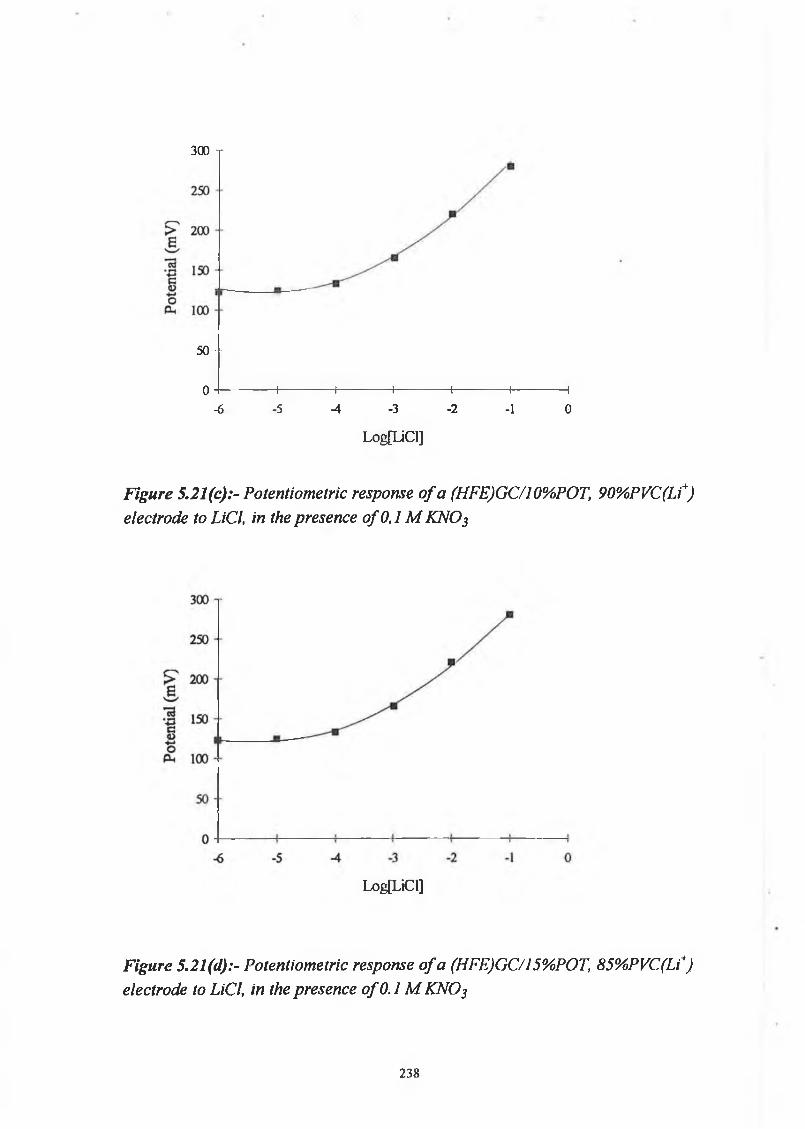
300 T
5 0 "
0 -I-------------- 1-------------- 1--------------1--------------1--------------1-------------- 1-6 -5 -4 -3 -2 -1 0
Log[LiCl]
Figure 5.21(c):- Potentiometrie response o f a (HFE)GC/W%POT, 90%PVC(Li+) electrode to LiCl, in the presence o f 0 ,1 M K N 0 3
Log[LiCl]
Figure 5.21(d):- Potentiometrie response o f a (HFE)GC/15%POT, 85%PVC(Li+) electrode to LiCl, in the presence o f 0.1 M K N 0 3
238

Log[LiCl] IM
Figure 5.21(e):- Potentiometrie response o f a (HFE)GC/20%POT, 80%PVC(Li+) electrode to LiCl, in the presence o f 0 .1 M KNOj
Log [LiCl]
Figure 5.21(f):- Potentiometrie response o f a (HFE)GC/25%POT, 75%PVC(Li+) electrode to LiCl, in the presence o f 0.1 M K N 0 3
239

Log[LiCI]/M
Figure 5.21(g):- Potentiometrie response o f a (HFE)GC/50%POT, 50%PVC(Li+) electrode to LiCl, in the presence o f 0 .1 M K N 0 3
Log[LiCl] / M
Figure 5.21(h):- Potentiometrie response o f a (HFE)GC/75%POT, 25%PVC(Li+) electrode to LiCl, in the presence o f no background electrolyte.
* Analysis Order 10 1 - 10"6 M
** Analysis Order 10^ -10 1 M

LogfLiCl] / M
Figure 5.21(i):~ Potentiometric response o f a (CPE)GC/100%PC)T, 0%PVC(Li+) electrode to LiCl, in the presence o f no background electrolyte.
* Analysis Order 10 1 - 10"6 M
** Analysis Order 10"6 - 10 1 M
Hysteresis was not evident with any of the hybrid-film electrodes from 0 to 25% POT, with very stable potential readings being achieved immediately when the magnetic stirrer was turned off. All electrodes had a response time of under 10 seconds.
5.7.2 Stability
The (HFE)GC/15%POT, 85%PVC(Li+) electrode showed very good stability over the latter 6 days of a seven day stability test (Figure 5.22(a)), with apotential difference of only 2 mV over the last three days. The coated wireelectrode on this substrate also displayed good stability but a constant upward drift of between 2 and 4 mV/day was noticed from the third day onwards (Figure 5.22(b)). It would appear therefore that the hybrid-film electrode is slightly more stable than its CWE equivalent. The return of the electrode to its original potential after the stability test was not observed with the GC/PVC(Li+) electrode and the initial upward increase in potential during the first couple of days of the stability study is possibly associated with an equilibration of the LiCl throughout the bulk of the membrane.
241

Time (Hours)
Figure 5.22(a):- Stability study o f (HFE)GC/15%POT, 85%PVC(Li+) in 0.1 M LiCl, in the presence o f a fix e d background solution o f 0 .1 M KNQ3.
Time (Hours)
Figure 5.22(b):- Stability study o f (CWE)GC/100%PVC(Li+) in 0.1 M LiCl, in the presence o f 0.1 M K N 0 3
242

5.7.3 Oxygen Dependence
From Figure 5.23(a) it can be seen that oxygen bears no influence on the absolute potential of the (HFE)GC/15%POT, 85%PVC(Li+) electrode. The reason for this being that oxygen was found not to affect the GC substrate (Figure 5.23(b)) in the same way it affects Pt with no decrease in potential being observed upon purging with nitrogen. Glassy carbon has been suggested to be a suitable substrate for electrodeposition of heteroatomic compounds due to its large electrochemical working range and the fact that it gives strong adherent films [48], Such a positive characteristic would also appear to be applicable to GC electrodes coated with chemically prepared (POT)c. The lack of effect o f the partial pressure of sample oxygen on the GC substrate displayed here could be a contributing factor to the improved stability observed for the hybrid-film electrodes compared to the Pt/SC electrodes of sections 5.4 and 5.5.
N2 In '
Time (Hours)
Figure 5.23(a):- Effect o f removal o f 0 2 fro m a 0.1 M LiCl solution on the (HFE)GC/J5%POT, 85% PVC(Li+) electrode, in the presence o f 0.1 M K N 0 3
243

Time (hours)
Figure 5.23(b):- Effect o f removal o f 0 2 fro m a 0.1 M LiCl solution on an uncoated GC electrode, in the presence o f 0.1M K N 0 3
5.7.4 Redox Response
None of the electrodes between 0 and 50% POT displayed any sort o f redox response, giving evidence, that the PVC part o f the membrane rather than the (POT)c is dominating the cationic response process displayed in the potentiometric curves, to the changes in its environment. The analyte ion concentration recognition process would be purely ionic and changes in ion concentration are then transmitted through to the Pt substrate by an electronic process similar to the solid contact described for the POT in the solid contact electrodes (Table 5.10). Since both the (HFE)GC/75%POT, 25%PVC(Li+) and (CPE)GC/100%POT display some redox response indicates that the (POT)c is electronically semi-conducting and hence electronic conduction from the solution directly through to the GC substrate is possible.
At higher POT compositions, where a redox response is noted, the semiconductive nature o f the POT appears to be the dominant recognition species and hence electronic conduction from the solution directly through to the GC substrate occurs.
244

Table 5.10:- Redox response o f glassy carbon hybrid-film electrodes.
ElectrodeType
Electrode Slope (mV/decade)
GC 57.6(CWE) GC/100%PVC(Li+) 0.5(HFE) GC/15%POT,85%PVC(Li+) 1.5(HFE) GC/50%POT,50%PVC(Li+) 0.5(HFE) GC/75%POT,25%PVC(Li+) 2 0 . 0
(CPE) GC/100%POT 21.5
5.8 Hybrid-film E lectrode containing Chloride ionophore, G C /15% PO T,85% PV C (C l_).
One hybrid-film electrode containing 15% PVC (C1‘) was prepared. The dry weight o f 100 (j.L PVC(Cl') was 14.28 m, so for the 15% POT electrode a weight of 2.14 mg POT was used along with 85 iL of the cocktail. The layer did not dry as evenly as its comparable (HFE)GC/15%POT,85%PVC(Li+) hybrid-film electrode with two thinner patches in the film over the (HFE)GC surface. The film did not appear as black as that obtained with the (HFE)GC/15%POT,85%Li+ electrode, and small water droplets were noticed to have adhered to the electrode surface upon removal from the aqueous 0.1 M LiCl conditioning solution. The (HFE)GC/15%POT,85%Li+ film appeared to be more hydrophobic with no moisture remaining upon removal from the conditioning solution.
The response to LiCl with no background salt is shown in Figure 5.24, with an average slope of 61.50 mV/decade being obtained. Potential reproducibility was not as good with the (HFE)GC/15%POT,85%PVC(Li+) electrode. A negative redox response slope was obtained with a slope of 20 mV/dec. The polymeric film was found to be dark green after the redox measurements had been made. The 15%P0T,85%PVC(C1') had previously been noticed to trap some of the Felll during redox measurements, giving a yellow colour to a layer which should have been clear. This colour remained in the film even after a week long conditioning period in 0 .1 M LiCl. Time did not permit a further examination of this type of electrode. The occurence of a redox response for this electrode is in contrast to the lack of redox sensitivity of the (HFE)GC/15%POT, 85%PVC(C1")
245
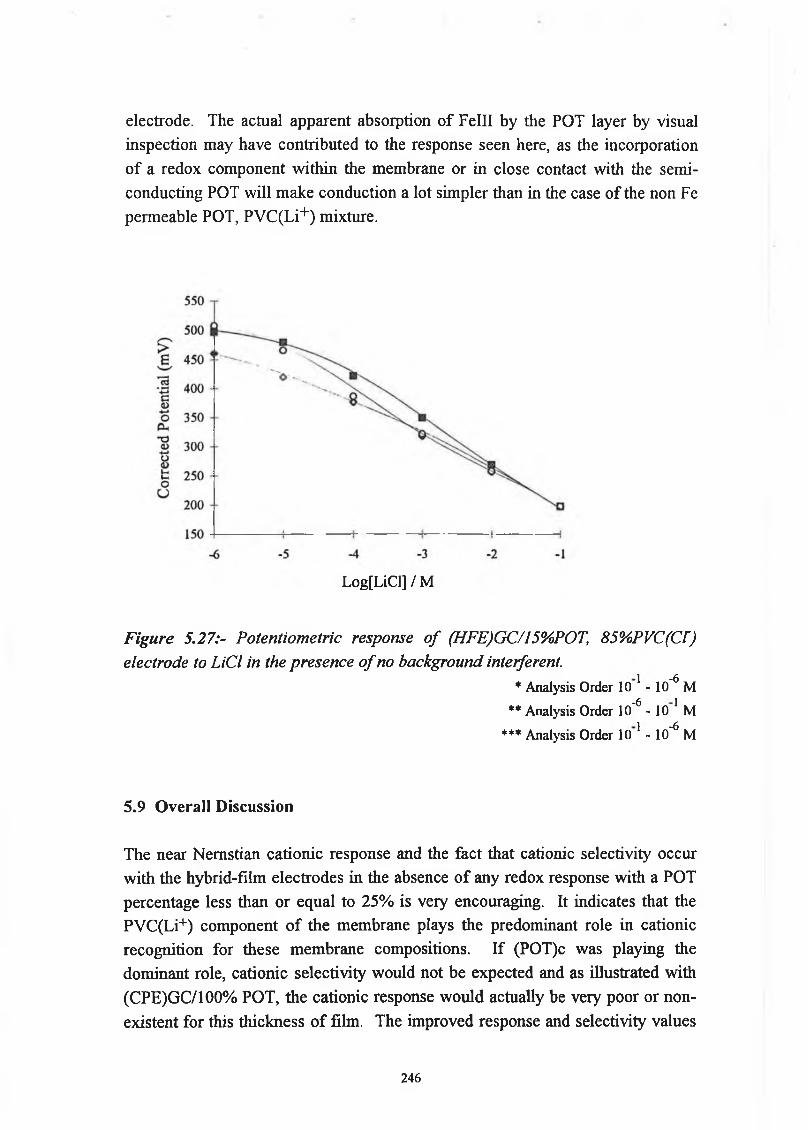
electrode. The actual apparent absorption of Felll by the POT layer by visual inspection may have contributed to the response seen here, as the incorporation of a redox component within the membrane or in close contact with the semiconducting POT will make conduction a lot simpler than in the case of the non Fe permeable POT, PVC(Li+) mixture.
LogfLiCl] / M
Figure 5.27:- Potentiometric response o f (HFE)GC/15%POT, 85%PVC(CF) electrode to LiCl in the presence o f no background interferent.
* Analysis Order 10 1 - 10-6 M ** Analysis Order 10*6 - 10 1 M
*** Analysis Order 10 1 - 10^ M
5.9 O verall D iscussion
The near Nemstian cationic response and the fact that cationic selectivity occur with the hybrid-film electrodes in the absence o f any redox response with a POT percentage less than or equal to 25% is very encouraging. It indicates that the PVC(Li+) component o f the membrane plays the predominant role in cationic recognition for these membrane compositions. If (POT)c was playing the dominant role, cationic selectivity would not be expected and as illustrated with (CPE)GC/100% POT, the cationic response would actually be very poor or nonexistent for this thickness o f film. The improved response and selectivity values
246

for (HFE)GC/15%POT over its coated wire equivalent is a possible indication of the presence of an additional information transmission mechanism for concentration changes. The small percentage of (POT)c appears to play a role in transferring electronic information to the Pt metal substrate in a more efficient manner than in the CWE.
The 100% (POT)c electrode does not display any real cationic sensitivity, in this work, whereas it was observed previously [61] with a slope of approximately 50mV/dec and this could be due to a number of factors. Firstly, a different substrate was used i.e. Pt instead of GC, although this factor should not reduce cation sensitivity to practically zero but would be expected to alter it slightly. Secondly, the thickness and density of the polymer layer which was approximately 150 pm compared to just 3 ^m in the earlier work, could simply be too large to allow sufficient transport of cations through the film during conditioning, thereby preventing electrostatic interaction with the sulphur group of the polyoctylthiophene taking place, a process which is considered of paramount importance in the ability of these polymers to perform as cation sensitive materials. Since POT has a relatively low ionic/electronic conduction which manifests itself in non-Nemstian cationic and redox responses, a thick film may prevent effective signal transfer. From the redox response results for the GC/100%POT electrode where a slope of 21.5 mV/dec is seen, it is apparent that some electronic conduction is possible with even this dense membrane.
With the (HFE)GC/15%POT, 85%PVC(Li+) electrode, there is a larger percentage of polymer through which cations can freely move i.e. PVC, and hence Li+ is introduced into the film in a more comprehensive way and can interact more easily with the sulphur groups of the POT. This introduces the possibility of electronic transfer o f ionic concentration changes in the film to the GC substrate. The percentage of POT would appear not to be large enough to exert its own cationic sensing abilities on the overall results as a decrease in selectivity, not an increase as observed, would be expected if the POT was playing a role in the solution cationic recognition process . The way in which the polymer dries on the electrode surface may also play an important role in the electrode characteristics, with perhaps the POT having a greater tendency to adhere to the GC substrate resulting in a predominantly electronically conductive interface. The lack o f a redox response for this electrode is a beneficial characteristic since it means it is not susceptible to interference from the presence of a redox couple and it is responding solely to the presence of the Li+ cation.
247

The over all stability of both the (HFE)GC/15%POT, 85%PVC(Li+) and (CWE)GC/0% POT, 100%PVC(Li+) are improved from the (CWE)Pt//PVC(Li+) and Pt/ CWE electrodes with the potential of the (HFE)GC/15%POT, 85%PVC(Li+) electrode being particularly stable i.e. 2-4 mV/day after 2 days and initial potential changes not being as great i.e. 30 mV, as those witnessed for the Pt electrodes. The increased stability could be a substrate effect, with GC not being as susceptible to potential changes with oxygen partial pressure changes. The slightly better stability for the (HFE)GC/15%POT compared to the (CWE)GC/100% PVC(Li+) points to the possible existence of an additional ionic/electronic conduction mechanism being involved in the membrane containing (POT)c. This coupled to the selectivity and cationic response curve add to this proposition. A diagram of the possible nature of the conduction process is presented in diagram 5.2.
GC POT, PVC (Li y Analyte
Diagram 5.2:- Schematic conduction mechanism o f hybrid-film POT, PVC(Li+) electrodes. I=Ionophore.
5.10 Conclusion
A new type of Lithium selective electrode has been produced using chemically synthesised POT and a lithium selective ionophore. It displays superior Li+ response, selectivity, L.O.D. and stability to either CWE, or solid contact electrodes incorporating electrically polymerised PT or POT. It requires the use of a cheaper substrate i.e. GC instead of Pt, which is not susceptible to potential changes with variations in the partial pressure of oxygen in the analyte solutions. Further work will be required to elucidate the exact nature of the conduction processes of this type of electrode.
248

5.11 References
1. A. Cagogan, Z. Gao, A. Lewenstam, A. Ivaska, and D. Diamond. Anal. Chem., 64 (1992) 2496.
2. R.W. Cattrall, and I.C. Hamilton, Ion-Selective Electrode Rev., 6 (1984) 125.3. W.E. Morf, "The Principles o f Ion-Selective Electrodes and o f Membrane
Transport", Elsiever, Amsterdam, (1981) 3.4. E.P Serjeant, in "Potentiometry and Potentiometric Titrations", Wiley, New
York, (1984) 105.5. W.E Morf in ref 3 above, 60.6 . G.J. Moody and J.D.R. Thomas (Eds.) "Selective Ion-Sensitive Electrodes",
Merrow, Watford, (1971).7. D. Ammann, W.E. Morf, P.Anker, P.C. Meier, E. Pretsch, and W. Simon,
Ion-Selective Electrode Rev., 5 (1983) 3.8 . P. Oggenfuss, W.E. Morf, U. Oesch, D. Ammann, E. Pretsch, W. Simon,
Anal. Chim. Acta, (1986) 299.9. G.J. Moody and J.D.R. Thomas, Selective Electrode Rev., 13 (1991) 227.10. J. Janata, M. Josowicz and D. M. De Vaney, Anal. Chem., 6 6 (1994) 207 R.11. J. Janata, Anal. Chem., 64 (1992) 196 R.12. R.L.Solsky, Anal. Chem., 62 (1990) 21R.13. J. Janata, Anal. Chem., 62 (1990) 33 R.14. R.L.Solsky, Anal. Chem., 60 (1988) 106R.15. M.A. Arnold and R.L.Solsky, Anal. Chem., 58 (1986) 54R.16. H.Hirata and K. Date, Talanta, 17 (1970) 883.17. R.W. Cattrall and H. Freiser, Anal. Chem., 43 (1971) 1905.18. H. Hirata and K. Date, Anal. Chem., 43 (1971) 279.19. R.W. Cattrall D.M. Drew and I.C. Hamilton, Anal. Chim. Acta, 76 (1975)
269.20. R.W Cattrall, D.M. Drew, Anal. Chim. Acta, 77 (1975) 9.21. A. Hulanicki, R. Lewandowski and M. Maj, Anal. Chim. Acta, 69 (1974)
409.22. H. Tamura, K. Kimura and T. Shono, Anal. Chem., 54 (1982) 1224.23. M. Trojanowicz, Z. Augustowska, W. Matuszewski, G. Moraczewska and A.
Hulanicki, Talanta, 29 (1982) 113.24. H. James, G. Carmack and H. Freiser, Anal. Chem., 44 (1972) 856.25. B.P Nikolskii, and E.A. Materova, Ion-Selective Electrode Rev., 7 (1985) 3.26. R.P. Buck, in "Ion-Selective Electrodes in Analytical Chemistry" Vol 1,. H.
Freiser (ed.), Plenum, New York, (1990) 58.
249

27. F. Oehme in "Sensors, a Comprehensive Survey" Vol. 2, (eds.) W. Gopel, J. Hesse and J. N. Zemal (eds.), V.C.H., Weinheim, (1991).
28. M.A. Ratner and D.F. Shriver, Chem. Rev., 8 8 (1988) 109.29. R.W. Murray, in "Electroanalytical Chemistry", Vol. 13, A.J. Bard (ed.),
Marcel Dekker, New York, (1991) 191.30. R.J. Forster, J.G. Vos, M.E.G. Lyons, J.Chem. Soc., Faraday Trans., 87, 23
(1991)3761.31. T.A. Skotheim (ed.) "Handbook o f Conducting Polymers", Marcel Dekker,
New York, (1986).32. H. Shirakawa, E.J. Louis, A.G. Mac Diarmid, C.K. Chiang, A.F. Heeger, J.
Chem. Soc. Chem Commun., (1977) 578.33. C.K. Chiang Y.W. Park, A.J. Heeger, H.Shirakawa, E.J. Louis, and A.G.
Mac Diarmid, J. Chem. Phys., 69 (1978) 5098.34. R.B. Kauer, and A.G. Mac Diarmid, Sei. Am., 258 (1988) 60.35. L.H. Van Vlack, “Elements o f Materials Science and Engineering’, 5th
Edition, Addison-Wesley Publishing Company, US, (1985).36. J. Heinze, Top. Curr. Chem., 152 (1990) 1.37. E.M. Genies, G. Bidan, and A.F. Diaz, J. Electroanal. Chem., 149 (1983)
101.
38. R.J. Waltman, J. Bargon, and A.F. Diaz, J. Phys. Chem., 87 (1983) 1459.39. G. Tourillon and F. Gamier, J. Electroanal. Chem., 135 (1982) 173.40. P. Marque, J. Roncali, and F. Gamier, J. Electroanal. Chem., 218 (1987) 107.41. Q. X. Zhou, C. J. Kolaskie and L.L. Miller, J. Electroanal. Chem., 223
(1987) 283.42. S. Bruckenstein, A.R. Hillman, J. Phys. Chem., 95 (1991), 10748.43. I.C. Lee, J. Electroanal. Chem., 340 (1990) 333.44. G.L. Duffitt and P.G. Pickup, J. Chem. Soc., J. Chem. Soc., Faraday Trans.,
8 8 (1992) 1417.45. G.G. Wallace, and Y.P. Lin, J. Electroanal. Chem., 247 (1988) 145.46. C. Iwakaura, Y. Kajiya, and H. Yoneyama, J. Chem. Soc., Chem. Commun.,
(1988) 1019.47. J.M. Slater, J. Paynter, and E.J. Watt, Analyst, 118 (1993) 379.48. P.R. Teasdale, G.G. Wallace, Analyst, 118 (1993) 329.49. M.D. Imisides, R. John, P.J. Riley, G.G. Wallace, Electroanalysis, 3 (1991)
879.50. G. Bidan, Sens, and Actuators B, 6 , (1992) 45.51. A. Ivaska, Electroanalysis, 3 (1991) 247.52. S. Dong, Z. Sun, and Z. Lu, Analyst, 113 (1988) 1525.
250

53. S. Dong, Z. Sun, and Z. Lu, J. Chem. Soc., Chem. Commun., (1988) 993.54. Z. Lu, Z. Sun and S. Dong, Electroanalysis, 1 (1989) 271.55. A. Cadogan, A. Lewenstam and A. Ivaska, Talanta, 39 (1992) 617.56. J. F. Pearson, J.M. Slater and V. Jovanovic, Analyst, 117 (1992) 1885.57. J. Bobacka, Z. Gao, A. Ivaska, and A. Lewenstam, J. Electroanal. Chem., 368
(1994) 33.58. A. Lewenstam, J. Bobacka, A. Ivaska, J. Electroanal. Chem., 368 (1994) 23.59. T.Okako, H. Hayashi, K. Hiratini, H. Sugihara and N. Koshizaki, Analyst,
116 (1991) 923.60. A.E. Karagozler, O.Y. Ataman, A. Galal, Z.-L. Hue, H. Zimmer, H.B. Mark
Jr., Anal. Chim Acta, 248 (1991) 163.61. J. Bobacka, A. Lewenstam, and I. Ivaska, Talanta, 40 (1993) 1437.62. J. Bobacka, M. Grzeszczuk and I. Ivaska, Electrochimica Acta, 37 (1992)
1759.63. K.Y. Jen, R. Oboodi, and R.L. Elsenbaumer, Polym. Mater. Sci. Eng., 53
(1985) 79.64. IUPAC Recommendations for Nomenclature o f Ion-selective Electrodes,
Pure and Appl. Chem., 48 (1976) 127.65. J. Bobacka, personal communication.6 6 . K. Toth, E. Graf, G. Horvai, E. Pungor and R.P Buck, Anal. Chem., 58
(1986) 2741.67. M. Mai-Zurawska, A. Hulanicki, Anal. Chim. Acta, 136 (1982) 395.6 8 . J. Bobacka, A. Ivaska, M. Grzeszczuk, Synth. Met., 44 (1991) 21.
251