sensitivity analysis of city delta calculations for ... · sensitivity analysis of city delta...
TRANSCRIPT

33rd meeting of the Task Force on Integrated Assessment Modelling Sensitivity analysis of CD for Spain
Sensitivity analysis of City Delta calculationsfor several Spanish cities
UNIVERSIDAD POLITÉCNICA DE MADRIDDepartment of Chemical and Environmental Engineering
Prague. 3 May, 2007
33rd meeting of the Task Force on Integrated Assessment Modelling
J. Lumbreras, R. Borge, E. Rodríguez
National Integrated Assessment activities:

33rd meeting of the Task Force on Integrated Assessment Modelling Sensitivity analysis of CD for Spain
INTRODUCTIONSENSITIVITY ANALYSIS
CONCLUSIONS

33rd meeting of the Task Force on Integrated Assessment Modelling Sensitivity analysis of CD for Spain
Introduction
AOT40 [ppm.hours]m 2010
¿?
Possible future
emission levels
Directives, agreements
and protocols
Policy assessment and decision-making
support
Policy assessment and decision-making
support
Modelling system
Legislation, standards
Possible future air quality levels
National Emission Inventory
SEP methodology
Evaluation of City Delta results in some Spanish cities using national estimations

33rd meeting of the Task Force on Integrated Assessment Modelling Sensitivity analysis of CD for Spain
City Delta calculations (IIASA Interim Report IR-07-001)
Where:CD → concentration increment computed with the 3 models α, β → regression coefficientsD → city diameterU → wind speed∆Q → change in emission fluxesd → number of winter days with low wind speedAc → “Urban shape” areaAE → EMEP grid cell area

33rd meeting of the Task Force on Integrated Assessment Modelling Sensitivity analysis of CD for Spain
INTRODUCTION
SENSITIVITY ANALYSISCONCLUSIONS

33rd meeting of the Task Force on Integrated Assessment Modelling Sensitivity analysis of CD for Spain
Sensitivity analysis for the two largest cities in Spain (Madrid & Barcelona)
33rd meeting of the Task Force on Integrated Assessment Modelling Sensitivity analysis of CD for Spain
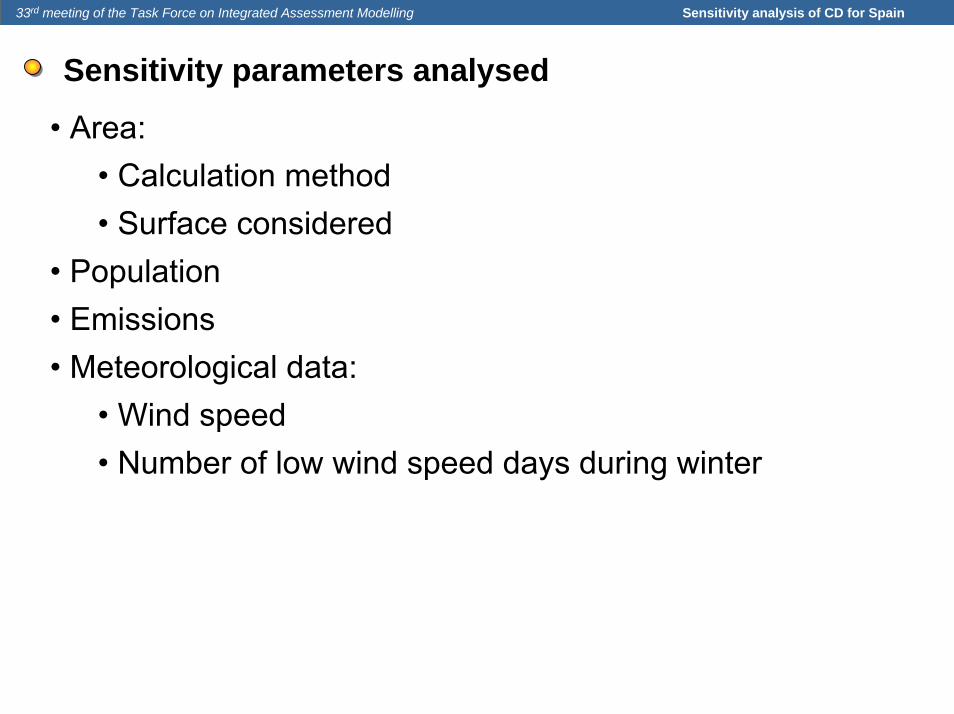
Sensitivity parameters analysed
• Area:• Calculation method• Surface considered
• Population• Emissions• Meteorological data:
• Wind speed• Number of low wind speed days during winter
33rd meeting of the Task Force on Integrated Assessment Modelling Sensitivity analysis of CD for Spain
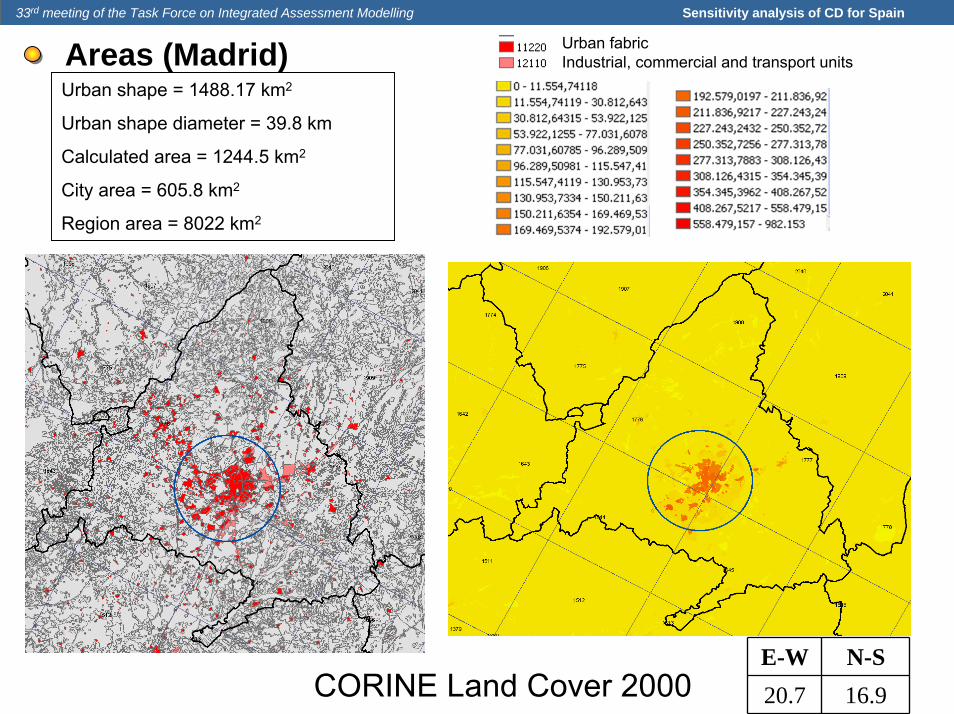
Urban fabricIndustrial, commercial and transport units
Urban shape = 1488.17 km2
Urban shape diameter = 39.8 km
Calculated area = 1244.5 km2
City area = 605.8 km2
Region area = 8022 km2
Areas (Madrid)
E-W N-S20.7 16.9CORINE Land Cover 2000
33rd meeting of the Task Force on Integrated Assessment Modelling Sensitivity analysis of CD for Spain
CD (µgm-3)

33rd meeting of the Task Force on Integrated Assessment Modelling Sensitivity analysis of CD for Spain
Areas (Barcelona) Urban fabricIndustrial, commercial and transport units
Urban shape = 603.47 km2
Urban shape diameter = 23.3 km
Calculated area = 426.8 km2
City area = 98.21 km2
Region area = 7728 km2
Max Min20 10
CORINE Land Cover 2000
33rd meeting of the Task Force on Integrated Assessment Modelling Sensitivity analysis of CD for Spain
CD (µgm-3)

33rd meeting of the Task Force on Integrated Assessment Modelling Sensitivity analysis of CD for Spain
Population
• IIASA value: 4.575.586• Official city population (2004): 3.155.359• Official region population (2004): 5.964.143
CD (µgm-3)
33rd meeting of the Task Force on Integrated Assessment Modelling Sensitivity analysis of CD for Spain
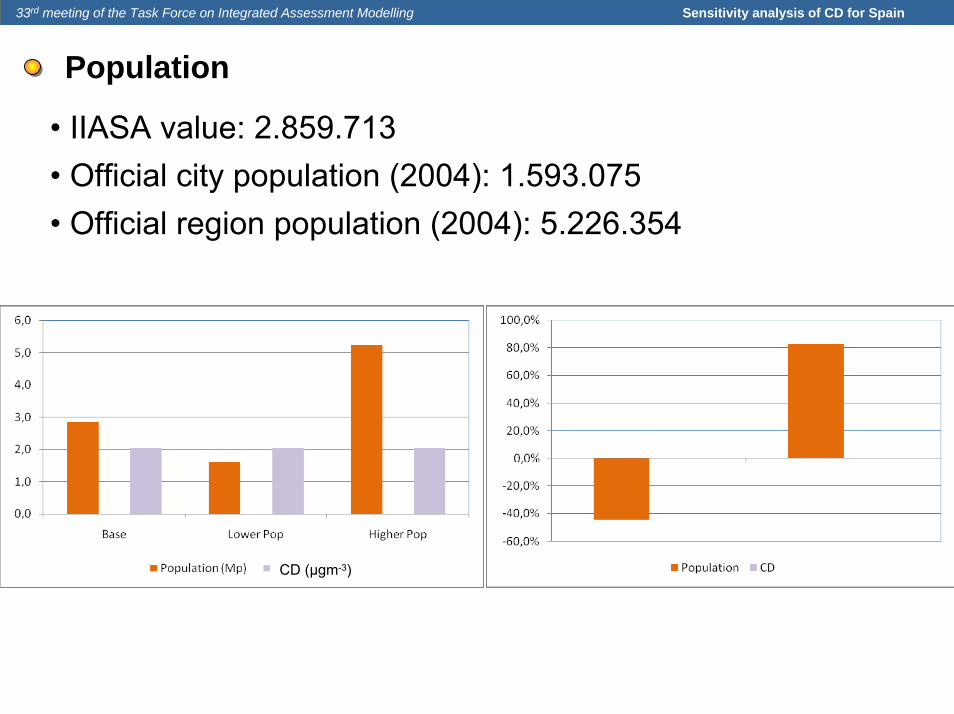
Population
• IIASA value: 2.859.713• Official city population (2004): 1.593.075• Official region population (2004): 5.226.354
CD (µgm-3)
33rd meeting of the Task Force on Integrated Assessment Modelling Sensitivity analysis of CD for Spain
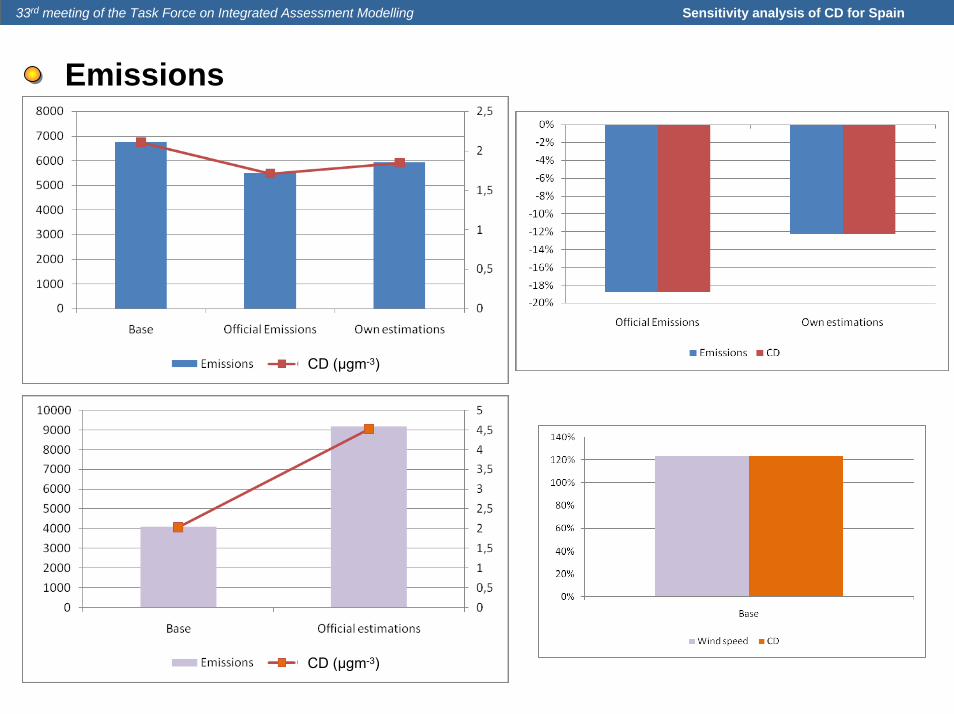
Emissions
CD (µgm-3)
CD (µgm-3)
33rd meeting of the Task Force on Integrated Assessment Modelling Sensitivity analysis of CD for Spain
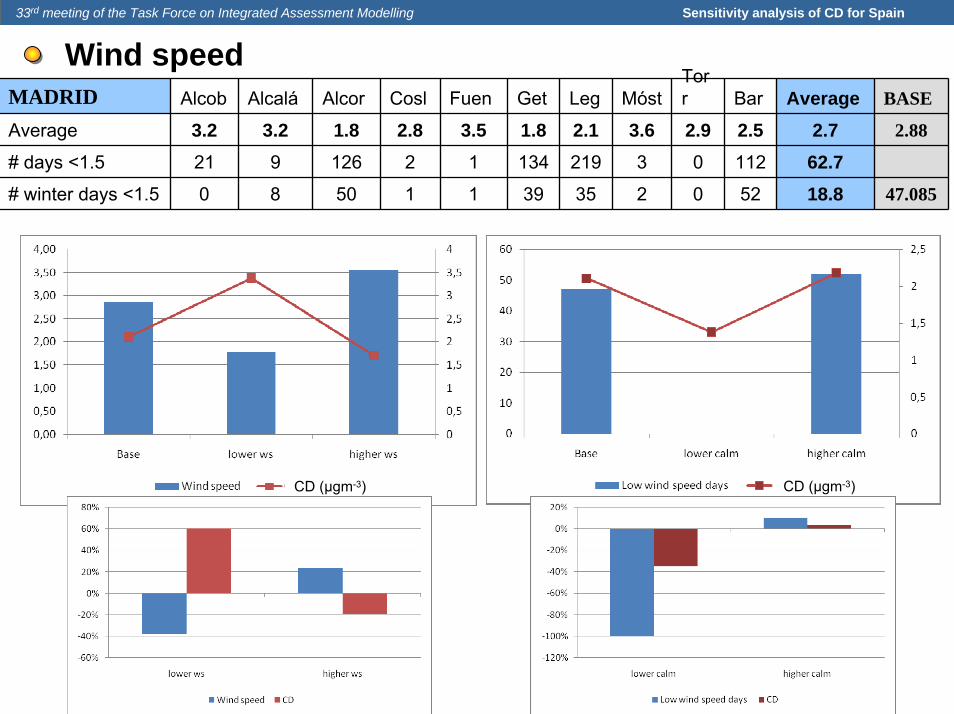
Wind speedMADRID Alcob Alcalá Alcor Cosl Fuen Get Leg Móst
Torr Bar Average BASE
Average 3.2 3.2 1.8 2.8 3.5 1.8 2.1 3.6 2.9 2.5 2.7 2.88
# days <1.5 21 9 126 2 1 134 219 3 0 112 62.7# winter days <1.5 0 8 50 1 1 39 35 2 0 52 18.8 47.085
CD (µgm-3)CD (µgm-3)
33rd meeting of the Task Force on Integrated Assessment Modelling Sensitivity analysis of CD for Spain
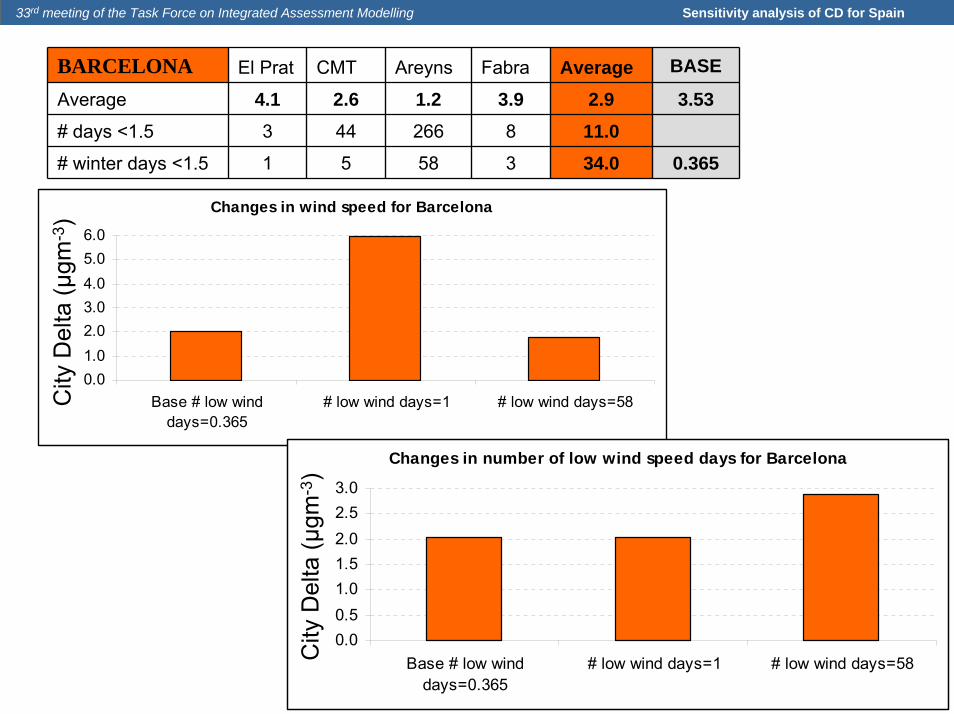
BARCELONA El Prat CMT Areyns Fabra Average BASE
Average 4.1 2.6 1.2 3.9 2.9 3.53# days <1.5 3 44 266 8 11.0# winter days <1.5 1 5 58 3 34.0 0.365
Changes in wind speed for Barcelona
0.01.02.03.04.05.06.0
Base # low winddays=0.365
# low wind days=1 # low wind days=58
City
Del
ta (
g/m
3 )
Changes in number of low wind speed days for Barcelona
0.00.51.01.52.02.53.0
Base # low winddays=0.365
# low wind days=1 # low wind days=58
City
Del
ta (
g/m
3 )
City
Del
ta (µ
gm-3
)
City
Del
ta (µ
gm-3
)

33rd meeting of the Task Force on Integrated Assessment Modelling Sensitivity analysis of CD for Spain
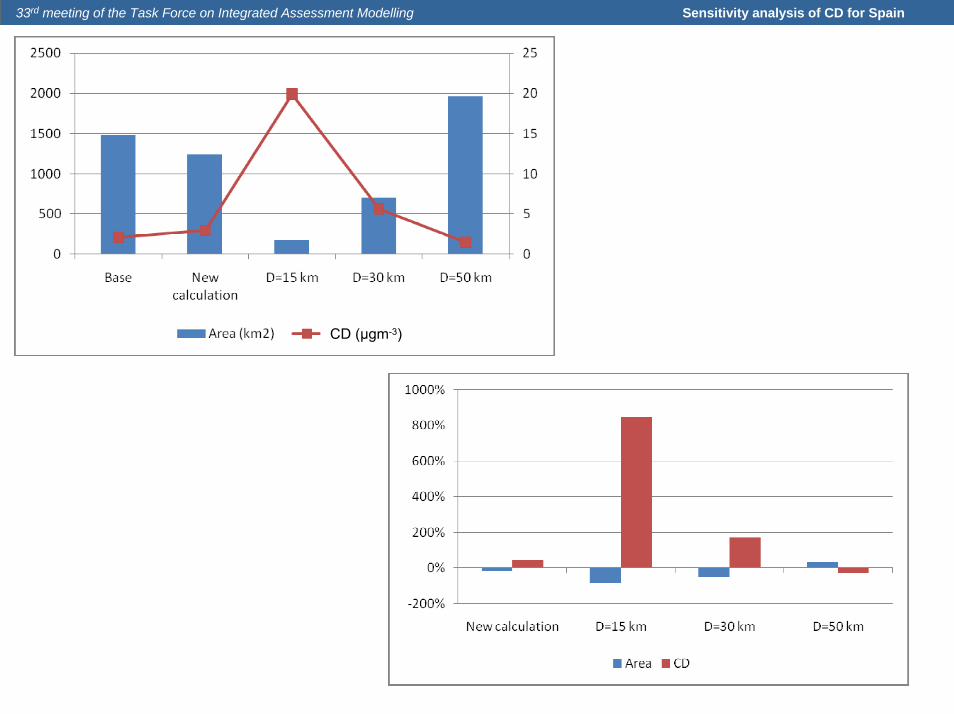
Increment intervals for MadridUrban shape
MADRIDPopulation Diameter Area
City emissions
Wind speed
# low wind speed days City Delta
Base 4,575,586 39.8 1488.2 6766.8 2.88 47.085 2.107
Highest CD 4,575,586 15.0 706.9 6766.8 1.79 52 32.583
Intermediate CD 4,575,586 30.0 176.7 6766.8 1.79 52 9.275
Lowest CD 4,575,586 50.0 1963.5 5497.0 3.56 0 0.553
City
Del
ta (µ
gm-3
)

33rd meeting of the Task Force on Integrated Assessment Modelling Sensitivity analysis of CD for Spain
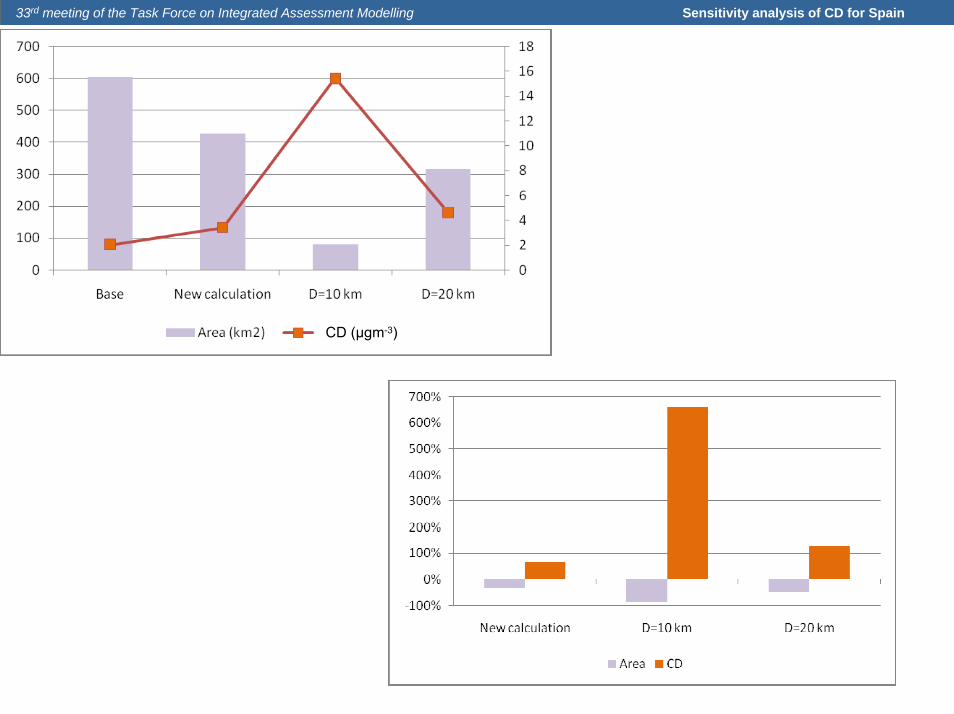
Increment intervals for BarcelonaUrban shape
BARCELONAPopulation Diameter Area
City emissions
Wind speed
# low wind speed days City Delta
Base 2,859,713 23.3 603.5 4126.0 3.53 0.365 2.030
Highest CD 2,859,713 10.0 78.5 9204.1 1.21 58 100.871
Lowest CD 2,859,713 23.3 603.5 4126.0 4.07 1 1.760
City
Del
ta (µ
gm-3
)

33rd meeting of the Task Force on Integrated Assessment Modelling Sensitivity analysis of CD for Spain
INTRODUCTION
SENSITIVITY ANALYSIS
CONCLUSIONS
33rd meeting of the Task Force on Integrated Assessment Modelling Sensitivity analysis of CD for Spain
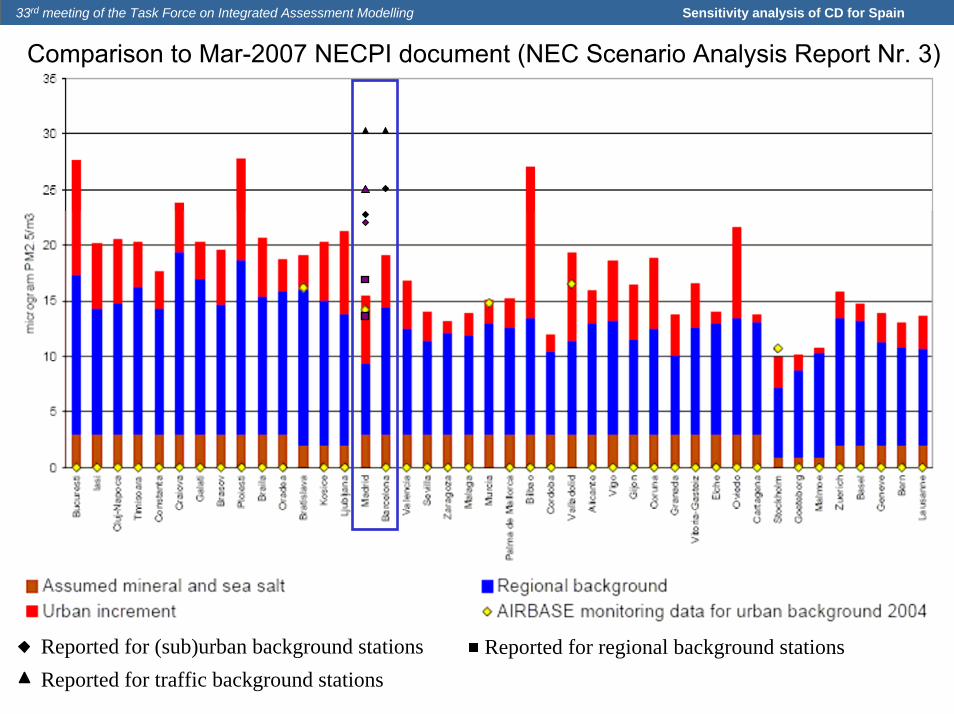
Reported for (sub)urban background stationsReported for traffic background stations
Reported for regional background stations
Comparison to Mar-2007 NECPI document (NEC Scenario Analysis Report Nr. 3)

33rd meeting of the Task Force on Integrated Assessment Modelling Sensitivity analysis of CD for Spain
Reported for (sub)urban background stationsReported for traffic background stations
Reported for regional background stations
Comparison to lowest CD

33rd meeting of the Task Force on Integrated Assessment Modelling Sensitivity analysis of CD for Spain
Reported for (sub)urban background stationsReported for traffic background stations
Reported for regional background stations
Comparison to other CD> 100

33rd meeting of the Task Force on Integrated Assessment Modelling Sensitivity analysis of CD for Spain
Conclusions (1)• It was necessary IIASA support to reproduce calculations• Current computed urban concentrations do not match with PM2.5 measurements for Madrid and Barcelona• CD computation is:
• very sensitive to geometric and meteorological parameters• little sensitive to emissions• unsensitive to population
• Sensitivity is city-dependent:•relatively robust to input changes in Madrid (CD ranging from 0.6 to 9.3 mg/m3)•highly sensitive to input changes in Barcelona (CD varies from 1.8-100.9 mg/m3)

33rd meeting of the Task Force on Integrated Assessment Modelling Sensitivity analysis of CD for Spain
Conclusions (2)• It is necessary to obtain improved values from countries, especially regarding:
• Wind data (both wind speed and number of low ws days)• “Urban shape” area
• Since there is large variability between monitoring stations, it appears critical to have comparable criteria among countries to select the monitoring stations:
• for meteorological input data• for PM2.5 concentration comparison