seniors in transition - cihi · seniors in transition: exploring pathways across the care...
TRANSCRIPT


Production of this document is made possible by financial contributions from Health Canada and provincial and territorial governments. The views expressed herein do not necessarily represent the views of Health Canada or any provincial or territorial government.
Unless otherwise indicated, this product uses data provided by Canada’s provinces and territories.
All rights reserved.
The contents of this publication may be reproduced unaltered, in whole or in part and by any means, solely for non-commercial purposes, provided that the Canadian Institute for Health Information is properly and fully acknowledged as the copyright owner. Any reproduction or use of this publication or its contents for any commercial purpose requires the prior written authorization of the Canadian Institute for Health Information. Reproduction or use that suggests endorsement by, or affiliation with, the Canadian Institute for Health Information is prohibited.
For permission or information, please contact CIHI:
Canadian Institute for Health Information495 Richmond Road, Suite 600Ottawa, Ontario K2A 4H6
Phone: 613-241-7860Fax: [email protected]
ISBN 978-1-77109-605-8 (PDF)
© 2017 Canadian Institute for Health Information
RAI-MDS 2.0 © interRAI Corporation, Washington, D.C., 1995, 1997, 1999. Modified with permission for Canadian use under licence to the Canadian Institute for Health Information. Canadianized items and their descriptions © Canadian Institute for Health Information, 2017.
RAI-HC © interRAI Corporation, Washington, D.C., 1994, 1996, 1997, 1999, 2001. Modified with permission for Canadian use under licence to the Canadian Institute for Health Information. Canadianized items and their descriptions © Canadian Institute for Health Information, 2017.
How to cite this document:Canadian Institute for Health Information. Seniors in Transition: Exploring Pathways Across the Care Continuum. Ottawa, ON: CIHI; 2017.
Cette publication est aussi disponible en français sous le titre Aînés en transition : cheminements dans le continuum des soins.ISBN 978-1-77109-606-5 (PDF)

Table of contentsAcknowledgements . . . . . . . . . . . . . . . . . . . . . . . . . . . . . . . . . . . . . . . . . . . . . . . . . . . . . . . . . 4
About this report . . . . . . . . . . . . . . . . . . . . . . . . . . . . . . . . . . . . . . . . . . . . . . . . . . . . . . . . . . . 6
Executive summary . . . . . . . . . . . . . . . . . . . . . . . . . . . . . . . . . . . . . . . . . . . . . . . . . . . . . . . . . 7
Background . . . . . . . . . . . . . . . . . . . . . . . . . . . . . . . . . . . . . . . . . . . . . . . . . . . . . . . . . . . . 7
Our work . . . . . . . . . . . . . . . . . . . . . . . . . . . . . . . . . . . . . . . . . . . . . . . . . . . . . . . . . . . . . . 7
What we found . . . . . . . . . . . . . . . . . . . . . . . . . . . . . . . . . . . . . . . . . . . . . . . . . . . . . . . . . . 8
Introduction . . . . . . . . . . . . . . . . . . . . . . . . . . . . . . . . . . . . . . . . . . . . . . . . . . . . . . . . . . . . . . . 9
Demand for continuing care . . . . . . . . . . . . . . . . . . . . . . . . . . . . . . . . . . . . . . . . . . . . . . . . 9
Health system capacity . . . . . . . . . . . . . . . . . . . . . . . . . . . . . . . . . . . . . . . . . . . . . . . . . . 11
This analysis . . . . . . . . . . . . . . . . . . . . . . . . . . . . . . . . . . . . . . . . . . . . . . . . . . . . . . . . . . 12
Approach . . . . . . . . . . . . . . . . . . . . . . . . . . . . . . . . . . . . . . . . . . . . . . . . . . . . . . . . . . . . . . . 12
Data sources . . . . . . . . . . . . . . . . . . . . . . . . . . . . . . . . . . . . . . . . . . . . . . . . . . . . . . . . . . 12
Defining the study population . . . . . . . . . . . . . . . . . . . . . . . . . . . . . . . . . . . . . . . . . . . . . . 12
Designing the analyses . . . . . . . . . . . . . . . . . . . . . . . . . . . . . . . . . . . . . . . . . . . . . . . . . . 14
Identifying subpopulations of seniors who may not have required residential care . . . . . . 14
Key findings . . . . . . . . . . . . . . . . . . . . . . . . . . . . . . . . . . . . . . . . . . . . . . . . . . . . . . . . . . . . . 17
With appropriate supports, more seniors could live at home . . . . . . . . . . . . . . . . . . . . . . 17
Certain factors increase the likelihood of entering residential care . . . . . . . . . . . . . . . . . 20
Seniors assessed in hospital are more likely to enter residential care, and enter sooner . . . . . . . . . . . . . . . . . . . . . . . . . . . . . . . . . . . . . . . . . . . . . . . . . . . . . . . 22
Seniors wait longer in ALC for home care . . . . . . . . . . . . . . . . . . . . . . . . . . . . . . . . . . . . 25
Discussion . . . . . . . . . . . . . . . . . . . . . . . . . . . . . . . . . . . . . . . . . . . . . . . . . . . . . . . . . . . . . . . 27
Conclusion . . . . . . . . . . . . . . . . . . . . . . . . . . . . . . . . . . . . . . . . . . . . . . . . . . . . . . . . . . . . . . . 31
Appendix A: Glossary . . . . . . . . . . . . . . . . . . . . . . . . . . . . . . . . . . . . . . . . . . . . . . . . . . . . . . 32
Appendix B: Jurisdictional differences in terminology . . . . . . . . . . . . . . . . . . . . . . . . . . . . . . 36
Appendix C: Additional tables . . . . . . . . . . . . . . . . . . . . . . . . . . . . . . . . . . . . . . . . . . . . . . . . 37
Appendix D: Text alternative for figures . . . . . . . . . . . . . . . . . . . . . . . . . . . . . . . . . . . . . . . . . 41
References . . . . . . . . . . . . . . . . . . . . . . . . . . . . . . . . . . . . . . . . . . . . . . . . . . . . . . . . . . . . . . 43

4
Seniors in Transition: Exploring Pathways Across the Care Continuum
AcknowledgementsThe Canadian Institute for Health Information (CIHI) established a working group of representatives of health regions and ministries of health from Ontario, Manitoba, Saskatchewan, Alberta, British Columbia and Yukon. These jurisdictions provide CIHI with data that enabled this work. Working group members provided feedback that informed the analyses, interpretation and presentation of this report.
CIHI wishes to acknowledge and thank the members of the working group for their contributions:
• Karen Archibald, Director, Strategic Initiatives, British Columbia Ministry of Health
• Cheryl Beach, Clinical Director, Assisted Living and Abbotsford/Mission Residential Care, Fraser Health
• Donna Conway, Corporate Director, Decision Support, Island Health
• Jamie Davenport, Director, Home Care Development, Seniors Health, Community Seniors Addictions and Mental Health, Alberta Health Services
• Mark Edmonds, Director, Health System Integration, Central West Local Health Integration Network, Ontario
• Roxie Eyer, Director, Continuing Care Branch, Manitoba Health, Seniors and Active Living
• Hana Forbes, Regional Director, Long-Term Care Program, Winnipeg Regional Health Authority
• Nancy Gault, Deputy Seniors Advocate, Office of the Seniors Advocate, British Columbia Ministry of Health
• Elaine Halvorsen, Program Consultant, Community Care Branch, Saskatchewan Ministry of Health
• Cheryl Holt, Special Care Home Consultant, Continuing Care and Rehabilitation, Saskatchewan Ministry of Health
• Kirn Khaira, Director, Health System Performance Management, British Columbia Ministry of Health
• Pauline Michaud, Manager, Continuing Care Information Team, Alberta Health
• Brian Pollard, Interim Assistant Deputy Minister, Long-Term Care Homes Division, Ontario Ministry of Health and Long-Term Care
• Jeff Poss, Adjunct Associate Professor, School of Public Health and Health Systems, University of Waterloo
• Rosalinde Sandoff, Research and Evaluation Consultant, Research, Evaluation and Central Support, Saskatchewan Ministry of Health

5
Seniors in Transition: Exploring Pathways Across the Care Continuum
• Liris Smith, Director, Care and Community, Continuing Care Division, Yukon Department of Health and Social Services
• Anne-Marie Visockas, Senior Program Officer, Financial Planning, Alberta Health Services
• Sheryl-Ann Wasson, Manager, Quality, Risk and Clinical Practice, Continuing Care Division, Yukon Department of Health and Social Services
• Randi West, Director, Primary and Community Care Analytics, British Columbia Ministry of Health
• Monica White, Clinical Educator, North East Community Care Access Centre, Ontario
• Monica Whitridge, Director, RAI Initiatives, Alberta Health Services
Please note that the analyses and conclusions in this report do not necessarily reflect the opinions of the individuals or organizations mentioned above.

6
Seniors in Transition: Exploring Pathways Across the Care Continuum
About this reportThis report and its companion products focus on seniors in the publicly funded continuing care system. The report investigates a number of analytical questions to help understand the care paths of seniors over time through the continuing care system. The companion tools provide high-level information on
• Statistics Canada’s population estimates and projections, to illustrate the size of the seniors population across Canada, including historic and projected changes over time; and
• The population of seniors in home care and residential care across health regions. This tool provides in-depth information specific to each health region and permits comparisons among regions, between service types and over time (for the past 5 years) on selected measures.
Definitions of the main terms used in this report can be found in the glossary (see Appendix A).
Comments?The Canadian Institute for Health Information (CIHI) welcomes your feedback about this report and would like to know how future reports can meet your information needs. Please send an email with your comments to [email protected].

7
Seniors in Transition: Exploring Pathways Across the Care Continuum
Executive summary BackgroundAcross Canada, the continuing care sector strives to keep pace with the growing population of seniors. Growth in Canada’s seniors population has been steady for 20 years. However, within the next 20 years, growth in the older seniors population (those age 75 and older) — who rely more heavily on continuing care services — is expected to accelerate, causing that population to double in size. As the population of seniors grows, continuing care systems will face higher demands and expectations, including increased prevalence of chronic conditions and increased consumer expectations about remaining at home as long as possible. With unprecedented change forecast for the seniors population, health system administrators, care providers and planners are seeking to improve long-term sustainability for this sector.
Continuing care systems in Canada deliver a range of services and support to seniors living in various care settings. Provinces and territories have various means of providing and funding these services. Residential care is typically the most intensive and most expensive service, providing care to people with complex needs. While currently only a small fraction (approximately 9%) of seniors age 75+ live in residential care, the expected doubling of this population over the next 20 years will place unprecedented pressures on Canada’s continuing care systems. Within the context of health spending in Canada today, alternatives to adding more residential care capacity to address the expected growth in demand will need to be explored.
Our workThe focus of our work is to better understand how Canada’s seniors transition from living independently to receiving continuing care services, and what factors influence their transition into residential care. We established a working group of representatives from ministries and health regions to help guide and inform this work. We linked data across sectors and over time to follow seniors as they transitioned through the continuing care systems of 35 health regions, observing their clinical and functional characteristics to better understand their needs.
8
Seniors in Transition: Exploring Pathways Across the Care Continuum
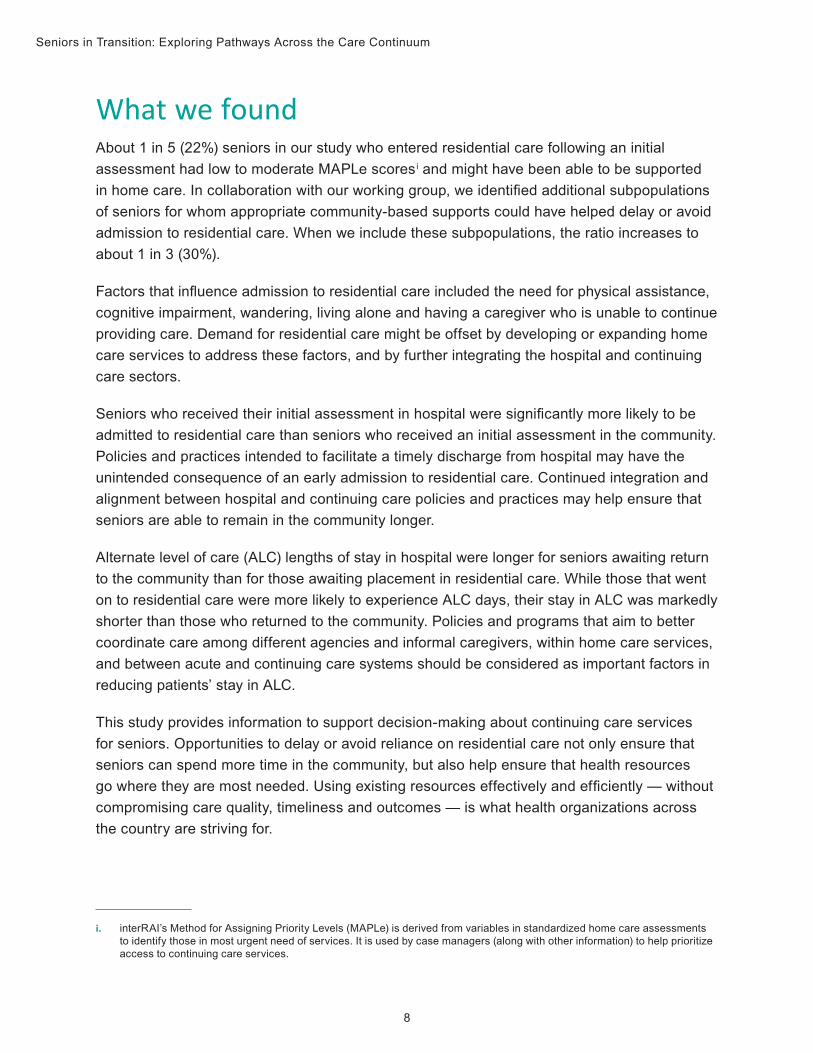
What we foundAbout 1 in 5 (22%) seniors in our study who entered residential care following an initial assessment had low to moderate MAPLe scores i and might have been able to be supported in home care. In collaboration with our working group, we identified additional subpopulations of seniors for whom appropriate community-based supports could have helped delay or avoid admission to residential care. When we include these subpopulations, the ratio increases to about 1 in 3 (30%).
Factors that influence admission to residential care included the need for physical assistance, cognitive impairment, wandering, living alone and having a caregiver who is unable to continue providing care. Demand for residential care might be offset by developing or expanding home care services to address these factors, and by further integrating the hospital and continuing care sectors.
Seniors who received their initial assessment in hospital were significantly more likely to be admitted to residential care than seniors who received an initial assessment in the community. Policies and practices intended to facilitate a timely discharge from hospital may have the unintended consequence of an early admission to residential care. Continued integration and alignment between hospital and continuing care policies and practices may help ensure that seniors are able to remain in the community longer.
Alternate level of care (ALC) lengths of stay in hospital were longer for seniors awaiting return to the community than for those awaiting placement in residential care. While those that went on to residential care were more likely to experience ALC days, their stay in ALC was markedly shorter than those who returned to the community. Policies and programs that aim to better coordinate care among different agencies and informal caregivers, within home care services, and between acute and continuing care systems should be considered as important factors in reducing patients’ stay in ALC.
This study provides information to support decision-making about continuing care services for seniors. Opportunities to delay or avoid reliance on residential care not only ensure that seniors can spend more time in the community, but also help ensure that health resources go where they are most needed. Using existing resources effectively and efficiently — without compromising care quality, timeliness and outcomes — is what health organizations across the country are striving for.
i. interRAI’s Method for Assigning Priority Levels (MAPLe) is derived from variables in standardized home care assessments to identify those in most urgent need of services. It is used by case managers (along with other information) to help prioritize access to continuing care services.

9
Seniors in Transition: Exploring Pathways Across the Care Continuum
IntroductionDemand for continuing careIn 2011, the first of Canada’s baby boomers turned 65, triggering a challenging new era for the country’s health care services. Over the past decade, there has been increasing concern that Canada’s health systems will be unable to meet the growing needs of this aging population bulge. Across the country, health systems are experiencing significant pressure in all sectors as they respond to the needs of seniors — including a widely recognized drive for independence and desire to remain in their homes as long as possible.1 Because significant growth in the seniors population is expected to continue over the next 2 decades, health organizations across the country are focused on how best to meet the health care needs of an aging population.
Figure 1 Seniors population forecast, 2017 and 2037
0
2
4
6
8
10
12
3.5
2017 2037
Senio
rs po
pulat
ion (in
milli
ons)
Age 65–74 Age 75+
2.6
5.76.2
10.4
4.7
NoteFigures may not add due to rounding.Source Statistics Canada, Table 052-0005: Projected population, projection scenario M3, age and sex, as of July 1, Canada, provinces and territories, annual (persons x 1,000).

10
Seniors in Transition: Exploring Pathways Across the Care Continuum
Estimates for 2017 show that 17% of Canada’s population is age 65 and older — 6.2 million seniors.2 Within this group, older seniors (those age 75 and older) generally rely most heavily on health care services. The population age 75 and older is estimated to represent 7% or 2.6 million of our population, a number that is expected to more than double over the next 20 years (see Figure 1). Currently, it is estimated that Nova Scotia, New Brunswick and British Columbia have the highest proportions of older seniors in Canada. However, the territories and Alberta will experience the greatest proportional increase in the older seniors population over the next 2 decades.2 Responding to the needs of this aging population presents significant challenges now and will continue to do so in the future.
Canada’s aging population will drive an increased need for services for seniors with chronic conditions and medically complex conditions.3, 4 Growth and change in the composition of Canada’s population of seniors, coupled with their increased expectations for service, will place significantly more — and potentially different — pressures on health systems that are already straining.
Using population estimates and projections developed by Statistics Canada, CIHI developed a web-based tool to help illustrate the expected change in Canada’s seniors population.
Many areas in Canada are experiencing challenges in making sure that people are treated in the right place, with the right kind of care, at the right time. In the past, hospitals were largely designed to serve a younger population and are now most effective at treating short-term acute illnesses. Elderly people, however, are more likely to experience chronic and medically complex conditions, which require a different kind of care — one that provides an ongoing relationship with an integrated care team.5, 6 Seniors use a disproportionate amount of hospital services. Although they make up 17% of the population, they represent 34% of hospital cases and 58% of the hospital days.7
Continuing care systems in Canada deliver a range of services and support to seniors living in various care settings, distinguished here as either home care ii (care provided in one’s own home or in home-like settings such as assisted living or supportive living) or residential care (care provided in a specialized facility that includes 24-hour nursing supervision). These services are defined as extended health care services by the Canada Health Act, so they can be charged for at either partial or full private rates.8 As such, they do not have to be publicly administered, universal, comprehensive, accessible or portable; this contributes to wide-ranging differences in the way provinces and territories have configured, delivered and funded them. Jurisdictions across Canada also use different terminology to describe the range of services they provide and the care settings where these services are provided. See Appendix B for a table outlining the different terminology used in the provinces and territory studied in this report.
ii. For the purposes of this report, the term “home care” is used to describe the services provided to individuals anticipated to require long-term home care support.

11
Seniors in Transition: Exploring Pathways Across the Care Continuum
Demand for continuing care resources is currently high across Canada, evidenced by people waiting at home or in hospital for home care services or for a place in residential care. Those waiting in hospital are designated alternate level of care (ALC). Unmet demand creates pressures across the health service continuum. For example, waiting in hospital has an impact on a wide range of hospital operations, including occupancy rates that often exceed hospital capacity. Overcapacity puts significant strain on the hospital system, resulting in congestion and overcrowding in the emergency department and inpatient units. This, in turn, can lead to a host of risks for patients, including infection,9 medical errors,10 cognitive decline11 and functional decline.12
Health system capacity If we assume that health services will be provided in the future as they have been in the past, health systems would need to double existing residential care capacity over the next 20 years to keep up with population growth. Clearly, this is not a feasible or appropriate option. Ensuring there is capacity to meet the pending demand of a growing population of seniors requires more than just building new beds; it means transforming the way care is provided across the continuum. Making sure that health services match the needs of the population closely, and that current beds and home health services are used appropriately, may allow health systems to harness capacity from existing resources.
Studies have shown that some seniors who are placed in residential care are clinically very similar to others who are able to remain in their homes in the community with the right supports.13, 14 Delaying placement in residential care for people who do not need that level of service — even by just 1 month — by providing them with appropriate supports in the community would have profound implications for freeing system capacity when multiplied across an entire service population.
ExampleIn a health system with 30,000 residential care beds and an average length of stay of 20 months, by reducing each new client’s length of stay by just 1 month, the system could serve nearly 1,000 more people within existing capacity.
12
Seniors in Transition: Exploring Pathways Across the Care Continuum
This analysis The intent of this analysis is to better understand how Canada’s seniors transition from living independently to receiving continuing care services, and what factors influence their transition into residential care. The analyses in this report focus on answering the following questions:
• How many seniors who enter residential care might have been able to be supported in home care?
• What are the key factors that influence entering residential care?
• How does being assessed in a hospital influence residential care admissions?
• Do wait times in ALC differ depending on the service to which seniors are discharged?
Approach This section describes our data sources, how we defined our study population, and key aspects of the study design (see the Methodology Notes for complete details and limitations).
Data sourcesThis analysis examined seniors age 65 and older in the publicly funded continuing care systems across 35 health regions in Ontario, Manitoba (Winnipeg Regional Health Authority [WRHA] only), Saskatchewan (excluding Mamawetan Churchill River and Keewatin Yatthé), Alberta, British Columbia (excluding Northern Health Authority) and Yukon. We linked 3 years of data (2012–2013 to 2014–2015) from CIHI’s Home Care Reporting System (HCRS), Continuing Care Reporting System (CCRS), Discharge Abstract Database (DAD) and Ontario Mental Health Reporting System (OMHRS), and included only those health regions for which data was available from these data sources throughout the study period.
Defining the study populationIn general, seniors entering the continuing care system receive an initial assessment to identify their need for continuing care services and to determine their eligibility for different care settings. Following this initial assessment, eligible seniors are designated as suited for either home care or residential care. Once they start receiving care, seniors receiving home care services are assessed using the standardized interRAI Resident Assessment Instrument–Home Care (RAI-HC) ©, while those receiving residential care are assessed using the standardized interRAI Resident Assessment Instrument–Minimum Data Set 2.0 (RAI-MDS 2.0) ©.

13
Seniors in Transition: Exploring Pathways Across the Care Continuum
We linked initial assessments and all subsequent assessments over the 2-year study period to identify care trajectories for seniors who had entered the continuing care system. The 59,171 seniors who followed the care trajectories presented in Figure 2 formed our final study population. iii The average age of seniors included in the study was 83 years; 63% were female and 16% lived in a rural area.
In Figure 2, the initial care setting is depicted by points A (home care as initial care setting) and B (residential care as initial care setting). Typically, those whose initial setting is residential care remain in this setting for the duration of their involvement with the continuing care system. Those whose initial setting is home care may follow 1 of 2 pathways: they remain on home care for the duration of the study period (point C in Figure 2); or they transition to residential care following a period of receiving home care (point D).
Figure 2 Care trajectories in the study population
Initialassessment 49,808 35,735
9,363
Transitioningfrom home care
to residential care
Residential care
Home care
A
B
C
D
14,073
iii. The vast majority of the 61,029 seniors newly entering continuing care in 2012–2013 followed the 3 care trajectories in Figure 2 (i.e., a total of 59,171 seniors — 97% overall, ranging from 93% to 100% across the 35 regions). The remaining 1,858 (3%) of seniors followed a large number of different and often complicated trajectories, for which there were relatively few observations. These cases were excluded from further analysis.

14
Seniors in Transition: Exploring Pathways Across the Care Continuum
Designing the analysesThis report focuses primarily on seniors entering residential care. As seen in Figure 2, seniors in this study entered residential care via 2 trajectories:
1. Residential care only: Following an initial assessment, 9,363 seniors (16%) entered residential care as their first care setting.
2. Home care to residential care: 49,808 seniors began their trajectory with home care. Of that group, more than a quarter (14,073 seniors, or 28%) transitioned to residential care within 2 years. Half of this group made the transition within 304 days (mean 330 days).
Identifying subpopulations of seniors who may not have required residential careIndividual care needs may be expressed on a continuum, and the continuing care system provides a range of services designed to accommodate these needs in various care settings. MAPLe scores derived from variables in home care assessments are used for identifying those in most urgent need of services, and are used by case managers (along with other information) to help prioritize access to continuing care services. Seniors with high and very high MAPLe scores (4 and 5) are often prioritized for placement in residential care facilities, while those with low to moderate MAPLe scores (1 to 3) are typically supported in home care.15, 16
Some health systems monitor the proportion of individuals entering residential care with low to moderate MAPLe scores, recognizing that individuals prefer to receive care in their own homes and that a lower percentage is a positive indicator for measuring health system performance.17
Health organizations across the country are exploring innovative options for maintaining clients in their home and in the community for as long as possible. There is recognition that there may also be opportunities to further tailor or enhance home care services to support seniors with specialized needs.13 In collaboration with the working group, we defined 3 additional subpopulations of seniors entering residential care who might have been able to remain in the community with appropriate home care services and supports. To varying degrees, each of these subpopulations overlaps with those who were assessed with low to moderate MAPLe scores.

15
Seniors in Transition: Exploring Pathways Across the Care Continuum
The 4 subpopulations we examined are defined below:
1. MAPLe low–moderate — These seniors have a MAPLe score less than or equal to 3. Seniors with low to moderate (1 to 3) MAPLe scores are more likely to remain in the community, supported with home care services, while those with high (4) and very high (5) scores are often prioritized for placement in residential care facilities.
2. Physical needs — This group of seniors could potentially be supported at home or in an assisted living type setting. This subpopulation consists of seniors with an Activities of Daily Living (ADL) Hierarchy Scale score greater than 0, no responsive behaviours, a Cognitive Performance Scale (CPS) score of 2 or less, no swallowing or eating problems and less than 2 recent falls (i.e., in the 90-day period prior to the assessment).
3. Lighter care needs — These are seniors with lighter care needs who potentially could be supported in a home setting. This subpopulation consists of seniors with a CPS score of 0 or 1, an ADL score of 0 or 1, and a Changes in Health, End-Stage Disease and Signs and Symptoms (CHESS) score of 0 to 2, and who do not exhibit wandering behaviours.
4. Dementia and light care needs — These seniors have dementia but otherwise have low cognitive and functional impairment. They tend to have high or very high MAPLe scores but can remain in the community with appropriate support. Some jurisdictions have implemented dwellings with specialized levels of care and supports designed to make it easier for this population to remain in the community. This subpopulation is defined as seniors with dementia (either Alzheimer or other type of dementia), an ADL score of 0 to 2 and a CPS score of 0 to 2.
Overall, 43% (25,623) of the study population was in the MAPLe low–moderate subpopulation at the time of initial assessment. Although the subpopulations were uniquely defined, there were varying degrees of overlap among them. The lighter care needs and physical needs subpopulations were relatively distinct (overlapping by less than 10%), yet collectively they comprised 93% of the MAPLe low–moderate group. The group of seniors with dementia and light care needs was relatively unique (73% of seniors in this subpopulation did not overlap with any other subpopulation). See Appendix A of the Methodology Notes companion document for further detail.

16
Seniors in Transition: Exploring Pathways Across the Care Continuum
Profiling seniors in continuing careTo help understand the populations served by home care and residential care in selected health regions, we developed an interactive web-based tool that allows users to learn about the prevalence of selected client characteristics and subpopulations over time and across care settings. This tool presents summarized interRAI assessment data at the health region level about individuals who have been assessed in home care, those who are newly entering residential care and those who are already living in a residential care facility. This includes prevalence information on the subpopulations we investigated, client factors, behaviours and impairments, and selected diseases and illnesses.
Seniors in residential care• Average age 86 years
• 70% are female
• 67% have a diagnosis of dementia
• 98% have some cognitive and/or functional impairment
SourceContinuing Care Reporting System, 2015–2016, Canadian Institute for Health Information.

17
Seniors in Transition: Exploring Pathways Across the Care Continuum
Key findings With appropriate supports, more seniors could live at homeAbout 1 in 5 (22%) seniors in our study who entered residential care following an initial assessment had low to moderate MAPLe scores and might have been able to be supported in home care (see Figure 3). The percentage of seniors entering residential care who met this criterion was lowest in British Columbia (15%) and highest in Manitoba (WRHA only, 33%). We also examined those seniors who entered residential care after having received home care and, as expected, the proportion with low to moderate MAPLe scores was lower (16% overall) than the proportion of seniors entering residential care following an initial assessment.
Figure 3 Percentage of seniors entering residential care following initial assessment with low to moderate MAPLe scores, by jurisdiction
23%
33%
16%
30%
15%
28%
22%
0%
5%
10%
15%
20%
25%
30%
35%
40%
Ontario Manitoba(WRHA)
Saskatchewan Alberta British Columbia Yukon Overall
Perce
ntage
enter
ing re
siden
tial c
are
NoteThe Yukon percentage is based on a denominator less than 30 and should be interpreted with caution.Sources Home Care Reporting System and Continuing Care Reporting System, 2012–2013 to 2014–2015, Canadian Institute for Health Information.

18
Seniors in Transition: Exploring Pathways Across the Care Continuum
When we expand the analysis to include the additional subpopulations, overall up to 30% of those entering residential care following an initial assessment might have been able to remain in the community with appropriate supports. Table 1 shows variation by jurisdiction.
Table 1 Percentage of seniors entering residential care following an initial assessment, by jurisdiction and subpopulation
JurisdictionMAPLe
low–moderate Physical needsLighter care
needsDementia and
light care needsAny
subpopulationOntario 23 20 3 10 31
Manitoba (WRHA)
33 21 15 16 47
Saskatchewan 16 13 4 5 21
Alberta 30 17 14 15 41
British Columbia
15 14 2 9 21
Yukon 28 16 12 28 44
Overall 22 18 4 10 30
NoteYukon percentages are based on a denominator less than 30 and should be interpreted with caution.Sources Home Care Reporting System and Continuing Care Reporting System, 2012–2013 to 2014–2015, Canadian Institute for Health Information.
We looked at all seniors in our study and examined rates of residential care entry for those with high and very high MAPLe scores and those in the MAPLe low–moderate group. As would be expected, seniors with high and very high MAPLe scores had higher rates of admission to residential care (Figure 4), both among those who entered residential care following an initial assessment (22% versus 8%, respectively) and those who transitioned into residential care from home care (37% versus 10%, respectively).

19
Seniors in Transition: Exploring Pathways Across the Care Continuum
Figure 4 Rates of seniors entering residential care, by MAPLe score
MAPLe low–moderate MAPLe high and very high
8%10%
22%
37%
0%
5%
10%
15%
20%
25%
30%
35%
40%
45%
Following an initial assessment Transitioning from home care
Perce
ntage
enter
ing re
siden
tial c
are
22% of seniors with high and very high MAPLe scores entered residential care following an initial assessment
Sources Home Care Reporting System and Continuing Care Reporting System, 2012–2013 to 2014–2015, Canadian Institute for Health Information.
Seniors with high and very high MAPLe scores averaged 56 days between the initial assessment and entry to residential care (median 30 days), while those with low to moderate MAPLe scores averaged 73 days (median 26 days).
Expanding the analysis to include the other subpopulations shows that those in any subpopulation who entered residential care following an initial assessment waited an average of 80 days (median 32 days), whereas for those who were not in any subpopulation, the average number of days to residential care entry was 51 (median 28 days).

20
Seniors in Transition: Exploring Pathways Across the Care Continuum
Certain factors increase the likelihood of entering residential care Based on consultation with the working group and a review of relevant literature,14, 18, 19 we identified 33 factors that may be associated with entering residential care (see Appendix C). These factors were analyzed using logistic regression for the complete cohort to explore the unique influence of each factor on the likelihood of entering residential care following an initial assessment and after a period of receiving home care.
Entering residential care following an initial assessment Of the factors we examined, 6 significantly increased the odds of entering residential care following an initial assessment (odds ratio >1.5, p<0.05), as shown in Figure 5. iv
Figure 5 Factors influencing entry to residential care following an initial assessment
1.7
1.9
2.0
3.2
3.3
6.4
0 1 2 3 4 5 6 7 8 9 10
Wandering
Caregiver unable to continue
Lives alone
Initial assessment in hospital
Adjusted odds ratio
Requires physical assistance(extensive versus independent)
Cognitive impairment(moderate versus intact)
Note95% confidence intervals shown. See Appendix C for complete results for all factors entered into the models.Sources Home Care Reporting System and Continuing Care Reporting System, 2012–2013 to 2014–2015, and Discharge Abstract Database and Ontario Mental Health Reporting System, 2011–2012 to 2014–2015, Canadian Institute for Health Information.
iv. Analysis of these factors was also conducted for each subpopulation. While some factors, in part or in whole, were not present in all subpopulations, these same factors were the only significant factors.

21
Seniors in Transition: Exploring Pathways Across the Care Continuum
Our analysis showed that seniors who received their initial assessment while in hospital were 6.4 times more likely to enter residential care than those who were not in hospital at the time of assessment. Because the regression model controls for all other factors, this effect remains, regardless of assessed health needs and caregiver status. This effect is further investigated in the next 2 findings.
Logistic regression and odds ratiosLogistic regression is used to assess the likelihood of 1 of 2 possible outcomes — in our study, entering residential care or not entering residential care — considering the influence of a set of factors or predictor variables. The result of this analysis is an odds ratio, which compares the odds of an event occurring in one group with the odds of it occurring in another group (e.g., seniors who wander compared with those who don’t).
The Activities of Daily Living (ADL) Hierarchy Scale measures the degree of physical assistance required in the areas of personal care, toileting, mobility and eating.20 The analysis showed that as the degree of physical assistance increased, there was an increased likelihood of entering residential care. Seniors requiring extensive assistance with personal hygiene or toilet use (ADL = 3) were 3.3 times more likely to enter residential care compared with those who were independent.
The Cognitive Performance Scale (CPS) considers an individual’s memory impairment, level of consciousness and executive function. Seniors with a moderate level of impairment (CPS = 3) are 3.2 times more likely to enter residential care. A moderate CPS score is an indication that the individual has at least one severe impairment and is no longer independent in the areas of decision-making and making oneself understood.20 This threshold represents the point at which we saw a significant increase in the likelihood of entering residential care, beyond which no further increase in likelihood occurs.
Seniors who lived alone (without a primary caregiver in the home) were 2.0 times more likely to enter residential care than those who lived with their primary caregiver. Similarly, having a caregiver who was unable to continue providing care meant that seniors were 1.9 times more likely to enter residential care. Finally, seniors who had a recent history of wandering were 1.7 times more likely to enter residential care.
22
Seniors in Transition: Exploring Pathways Across the Care Continuum
Entering residential care after receiving home careAll of the factors discussed above were also associated with a transition to residential care after a period of receiving home care. However, additional factors were associated with an increased likelihood of entering residential care, including caregiver distress, falls, medical instability and a diagnosis of dementia. Those who transitioned to residential care after a period of receiving home care may have experienced declines in health status, increases in memory loss, additional requirements for physical assistance and increases in caregiver distress. Caregiver distress has been found to be more likely when the care recipient struggles with cognitive impairment or has an increased need for physical assistance, both of which are further associated with advancing dementia and other chronic conditions.21
Interestingly, some factors (e.g., income quintile, responsive behaviours, incontinence, specific diagnoses such as diabetes, hypertension and cancer) were not meaningful contributors to residential care entry in either regression model. The lack of an association here does not necessarily mean that a factor does not play a role in admission to residential care; factors may interact to influence this likelihood. For example, responsive behaviours, which include aggression and resisting care, may be more challenging when combined with cognitive impairment. A full list of the factors that were considered and the odds ratios for both regression analyses are included in Appendix C.
Seniors assessed in hospital are more likely to enter residential care, and enter soonerIn the previous finding, we saw that receiving an initial assessment in hospital significantly increased a person’s odds of being admitted to residential care (controlling for health needs and caregiver status). Overall, only 12% of seniors in our study received an initial assessment in hospital, while the majority (88%) received their initial assessment in the community. 60% of seniors who received their initial assessment in hospital were admitted to residential care, compared with only 10% of seniors who received their initial assessment in the community. Importantly, the percentage of seniors entering residential care from hospital ranged significantly among jurisdictions, from 43% in Saskatchewan to 89% in British Columbia (Figure 6).

23
Seniors in Transition: Exploring Pathways Across the Care Continuum
Figure 6 Unadjusted percentage of seniors assessed in hospital who entered residential care
65%
74%
85%
60%
51%
70%
87%
57%
43%
71%
89%
0% 20% 40% 60% 80% 100%
Ontario
Saskatchewan
Alberta
British Columbia
Percentage entering residential care
2012–2013 2013–2014 2014–2015
NotesData was not available to calculate the 2014–2015 percentage for Saskatchewan. For additional information on this figure, see the “3 cohort years” section in the Methodology Notes companion document. Winnipeg data was unavailable (in part because seniors admitted to residential care from hospital do not receive an initial assessment).Sources Home Care Reporting System and Continuing Care Reporting System, 2012–2013 to 2015–2016, and Discharge Abstract Database and Ontario Mental Health Reporting System, 2011–2012 to 2015–2016, Canadian Institute for Health Information.

24
Seniors in Transition: Exploring Pathways Across the Care Continuum
Seniors assessed in hospital may have higher needs than those assessed in the community, explaining their higher priority for admission to residential care. This was further explored using MAPLe scores. The relative probability of entering residential care was expressed as a ratio comparing those assessed in hospital with those assessed in the community by MAPLe score. Interestingly, the greatest ratio was observed among seniors with a moderate score. Those assessed as moderate in hospital were 8.7 times more likely to enter residential care than those assessed as moderate in the community (Figure 7). Furthermore, the ratio decreased for those with high or very high MAPLe scores.
Figure 7 Likelihood of entering residential care from hospital relative to entering residential care from the community, by MAPLe score
7.1
8.7
5.9
3.5
0
1
2
3
4
5
6
7
8
9
10
Ratio
MAPLe score
Low–mild (1–2) Moderate (3) High (4) Very high (5)
Those with moderate MAPLe scores were 8.7 times more likely to enter residential care if assessed in hospital
NoteThe overall higher effect of initial assessment in hospital among seniors with moderate MAPLe scores was present for all jurisdictions, and across all 3 years of the study.Sources Home Care Reporting System and Continuing Care Reporting System, 2012–2013 to 2014–2015, and Discharge Abstract Database and Ontario Mental Health Reporting System, 2011–2012 to 2014–2015, Canadian Institute for Health Information.

25
Seniors in Transition: Exploring Pathways Across the Care Continuum
In addition to being more likely to enter residential care following an initial assessment, seniors who started their trajectory in hospital were admitted to residential care sooner than seniors who started their trajectory in the community — for every MAPLe score (see Appendix C). Seniors assessed in the community with very high MAPLe scores waited twice as long as seniors assessed in hospital with low to moderate scores (Figure 8).
Figure 8 Time from initial assessment to residential care entry
0%
25%
50%
75%
100%
0 60 120 180 240 300 360 420 480 540 600 660 720
Cumu
lative
perce
ntage
Days to residential care entry
MAPLe very high (in the community)MAPLe low–moderate (in hospital)
75% of seniors assessed in the community with MAPLe very high enter within 77 days
75% of seniors assessed in hospital with MAPLe low–moderate enter within 34 days
Sources Home Care Reporting System and Continuing Care Reporting System, 2012–2013 to 2014–2015, and Discharge Abstract Database and Ontario Mental Health Reporting System, 2011–2012 to 2014–2015, Canadian Institute for Health Information.
Seniors wait longer in ALC for home careMost seniors (82%) who received their initial assessment in hospital (regardless of whether their initial care setting was residential care or home care) experienced ALC. The term ALC is used in this analysis to describe the status of individuals who occupy a hospital bed but no longer require the intensity of resources and services provided in acute care.22 Among seniors assessed in hospital, those going to residential care were more likely to be designated ALC than those waiting to receive home care (90% versus 57%, respectively). However, those waiting to receive home care spent longer in ALC (median 34 days) than those waiting for residential care (median 28 days).

26
Seniors in Transition: Exploring Pathways Across the Care Continuum
There was significant variation across jurisdictions in the median ALC length of stay, both for seniors waiting for home care and for those waiting for residential care. For all jurisdictions, seniors waited longer in ALC for home care (Figure 9). v
Figure 9 Median ALC length of stay to receive home care and residential care, by jurisdiction
36.5
28
1614
32
27
3432
0
5
10
15
20
25
30
35
40
45
50
Home care Residentialcare
Residentialcare
Residentialcare
Residentialcare
Home care Home care Home care
Ontario Saskatchewan Alberta British Columbia
ALC
length
of st
ay (d
ays)
NoteWinnipeg data was unavailable (in part because seniors admitted to residential care from hospital do not receive an initial assessment).Sources Home Care Reporting System and Continuing Care Reporting System, 2012–2013 to 2014–2015, and Discharge Abstract Database and Ontario Mental Health Reporting System, 2011–2012 to 2014–2015, Canadian Institute for Health Information.
v. ALC reporting varies by jurisdiction and is influenced by availability of services in the community and clinician designation practices. A number of factors may influence the designation of a patient as ALC, including, for example, inconsistent understanding of the definition of ALC and misperception that the patient cannot be designated ALC until his or her discharge destination is confirmed. In 2016–2017, CIHI released new clinician guidelines to standardize ALC designation in acute inpatient care. These guidelines are currently being implemented to improve comparability of ALC data reported in the DAD.

27
Seniors in Transition: Exploring Pathways Across the Care Continuum
DiscussionBecause seniors rely more heavily on health systems than other age groups, the growth of this population will have wide-ranging effects on Canada’s health systems. In the past, continuing care systems have provided services to clients in their home (home care) and in residential care settings. In the early 2000s, it became apparent that the demand for residential care needed careful management due to a combination of factors, including rising costs, significant growth in the number of seniors and recognition that seniors value their independence highly, preferring to remain in the community for as long as possible. In response, many jurisdictions began introducing new types of care in an effort to redirect people with less complex needs away from residential care.23 These services (such as assisted living and supportive housing) allow individuals to enjoy the benefits of living more independently in the community but typically cost less to provide than residential care, in part because they do not provide 24-hour nursing support.
As we look to the future, it will be important to optimize current resources by ensuring that care level and type is appropriately matched to client need. As well, there will be a need to explore innovative care models and technological solutions. This report highlights potential opportunities to serve more people within existing resources, while maintaining care quality, experience and outcomes.
To ensure the best match between client needs and the level and type of care provided, we require a better understanding of the needs of clients accessing care and the factors that lead individuals who are living independently or with supports in the community to residential care. Standardized clinical assessments can help us understand both the characteristics of individuals as they first enter the continuing care system and the changes that occur along their care trajectories. This is powerful information that can help us understand where efforts to offset demand by delaying or avoiding admissions to residential care could be focused.

28
Seniors in Transition: Exploring Pathways Across the Care Continuum
With appropriate supports, more seniors could live at homeOur analysis identified seniors who enter and live in residential care with care needs that appear similar to those of seniors typically supported in home care. This raises important questions, such as
• What supports and services are required to allow these individuals to remain in the community longer?
• What role do local health system policies and procedures have in influencing this outcome?
There is variation among the jurisdictions in the proportion of seniors with low to moderate MAPLe scores entering residential care following an initial assessment who may have been appropriate for home care. Factors such as the supply and range of home care and residential care resources may influence this variation, suggesting there may be value in continuing care systems monitoring residential care admission practices. Delaying or avoiding admissions of individuals with care needs that could be supported in the community would affect residential care capacity, potentially making space available for people with higher care needs.
Examining these subpopulations helps to identify opportunities to enhance or expand community-based care to better meet the needs of seniors. This may require health systems to reach beyond the array of existing services and supports — which may have implications for policies and practices — and establish capacity to implement innovative models, services and technologies.
Certain factors increase the likelihood of entering residential careExisting service models may not be sufficiently equipped to support individuals in the community, or there may be policies and procedures that direct clients with certain clinical characteristics to residential care. The working group reflected that by developing or expanding home care services that address wandering behaviours and higher levels of functional and cognitive impairment, and by making appropriate supports available to individuals who live alone or have caregivers who are unable to continue, demands for residential care could be offset. With innovative solutions, such as dementia villages where residents are able to live actively in a secure, familiar environment (as in Weesp, the Netherlands),24 or designated supportive living dwellings specializing in dementia care (as in Alberta),25 some seniors may be able to remain in the community longer. The important influence of being assessed in hospital was also identified and prompted further investigation.

29
Seniors in Transition: Exploring Pathways Across the Care Continuum
Implications of in-hospital assessmentsWhen an elderly person comes into hospital, the staff assesses their current status and develops a care plan to address presenting symptoms. However, treatment plans developed in hospital typically focus on patients’ immediate needs (short-term acute illnesses) and may not fully consider the ongoing complex needs of patients with underlying chronic conditions.
There is an increasing awareness of the need to assess and consider a patient’s pre-hospital functioning when developing care plans. This helps hospital staff see how the elderly person functions in their normal day-to-day life and allows them to make treatment plans that enable that person to return to their normal living arrangements.
When this is in place, seniors are more likely to recover without experiencing a decrease in ability to manage their own lives; however, it might take seniors with chronic health conditions longer to recover from illness or trauma than those who are younger or have no chronic health conditions.
It is difficult for hospital staff to maintain a focus on helping seniors return to their normal living arrangements when hospitals are over capacity and under pressure to decrease length of stays of their patients.
Often administrative processes prioritize moving patients in hospital beds into residential care beds over people from the community — because the goal is to free capacity in acute care. However, an unintended consequence may be that seniors who could return home, perhaps with assistance, are placed in residential care. Once they are in residential care, they remain there.
— A member of the working group

30
Seniors in Transition: Exploring Pathways Across the Care Continuum
Seniors assessed in hospital are more likely to enter residential care, and enter soonerOur analysis illustrates a potential predisposition to residential care for those assessed in hospital (controlling for MAPLe score). The practice of admitting seniors to residential care who may have been able to be supported in home care can have undesirable consequences, such as a longer stay in residential care, a negative impact on patient outcomes and potential displacement of higher-needs individuals (restricting patient flow). To help seniors remain in the community longer, decision-makers must first understand how hospital and continuing care policies and practices can be better integrated and aligned.
The working group reflected on the potential unintended consequences that current hospital practices — designed to alleviate the burden on the hospital system — may have on residential care admissions. There are likely variations among jurisdictions and care providers in the way clinical assessments influence decision-making. For example, in some jurisdictions, rather than being used to determine eligibility for residential care, assessments conducted in hospital may occur after a predetermination has been made that the patient cannot return home. Some jurisdictions have implemented policies such as Home First or Home Is Best, recommending that individuals be transferred home from the hospital prior to assessing their care needs. This allows seniors to convalesce in their own home before determining the most appropriate long-term care option.26, 27
There are limitations to what assessments alone can tell us about individuals entering residential care. Other factors, such as client, family and provider preferences, as well as factors not addressed through the assessment instrument, may also influence the likelihood of admission to residential care for assessments completed both in hospital and in community.
Seniors wait longer in ALC for home careThe working group reflected that there can be considerable effort and time involved in properly supporting home care for some clients. This often involves coordination between and within different agencies and informal caregivers, and providing and installing household amenities (including safety and security equipment). Ensuring that appropriate supports are available often creates delays in returning to the community and thus lengthier stays while designated ALC. Anticipating client needs and coordinating care as early as possible during the hospital stay may help reduce the wait in ALC.

31
Seniors in Transition: Exploring Pathways Across the Care Continuum
ConclusionOver the past several decades, Canada’s continuing care systems have made adaptations to accommodate growth in the seniors population, as well as the preferences of seniors to maintain their independence. In the coming years, as this population growth accelerates and seniors’ care needs become increasingly complex (due to increased life expectancy and higher prevalence of chronic diseases), continuing care systems will need to further adapt.
This study shines a light on how seniors transition from living independently to receiving continuing care services, and on the factors that influence their transition into residential care. To help ensure that health systems can continue to meet the needs of seniors, it will be essential to expand efforts to support seniors so they can remain in their homes for as long as possible. Clearly no single intervention will offset demand for residential care beds in Canada and uphold individual preferences to remain in the community as long and as independently as possible. There are many innovative approaches being introduced across the country that address ways to meet client and caregiver needs in the home, often requiring improved integration within and across health care systems and leveraging new technologies. The challenge for health system decision-makers, care providers and planners is exploring ways to expedite their implementation in order to address the future needs of the continuing care sector.

32
Seniors in Transition: Exploring Pathways Across the Care Continuum
Appendix A: Glossary Activities of Daily Living (ADL) Hierarchy Scale
Developed by interRAI, this scale groups ADL performance levels into ordered stages of loss (early loss: personal hygiene; middle loss: toileting and locomotion; and late loss: eating). The scale ranges from 0 (no impairment) to 6 (total dependence).20
alternate level of care (ALC)
The term “alternate level of care (ALC)” is used to describe persons who occupy a bed in a facility but no longer require the intensity of resources and services provided in that setting. In the context of this analysis, ALC identifies a person who has completed the acute care phase of his or her treatment but remained in an acute care bed.
assisted living
Assisted living (or supportive living) provides housing and personal care services for individuals who can live independently (without continuous medical care) but require a supportive environment due to physical and functional health challenges. Assisted living residences may include private homes and apartments, and can range from single-room spaces to self-contained apartments.
care setting
Where a client lives when receiving continuing care services.
care trajectories
Care trajectories represent the movement of clients through care settings over time.
care transitions
Care transitions occur when care needs change, requiring a move between care settings.
case manager
A case manager is the person responsible for assessing client needs and coordinating service delivery. Case managers work with clients and their families to establish appropriate supports across care settings and facilitate changes in services to reflect changing needs.

33
Seniors in Transition: Exploring Pathways Across the Care Continuum
Cognitive Performance Scale (CPS)
Developed by interRAI, the CPS considers information about an individual’s state of consciousness, memory, daily decision-making, communication and eating. Scores range from 0 to 6, with higher values indicating greater levels of impairment.20
community
For the purposes of this report, the term “community” refers to a location of residence that includes seniors living at home or in home-like settings. It is differentiated from institutional settings (i.e., hospital, residential care). This location of residence is independent from care services (i.e., seniors living in the community may or may not receive home care).
continuing care
Continuing care systems provide seniors with a range of short- and long-term services in a variety of care settings designed to optimize independence and quality of life. Continuing care is provided by a mix of public (government-owned and operated), non-profit and private for-profit organizations. In some cases, clients receiving publicly funded services may also pay out of pocket for additional services.
Continuing Care Reporting System (CCRS)
CCRS contains demographic, administrative, clinical and resource utilization information about individuals who receive continuing care services in hospitals or long-term care homes. Participating organizations also provide information about facility characteristics to support comparative reporting and benchmarking.
Discharge Abstract Database (DAD)
The DAD captures administrative, clinical and demographic information on hospital discharges (including deaths, sign-outs and transfers). Some provinces and territories also use the DAD to capture day surgery.
health region
Health regions are defined by provincial/territorial governments as the geographical areas of responsibility for regional health boards (i.e., legislated) or as regions of interest to health care authorities.

34
Seniors in Transition: Exploring Pathways Across the Care Continuum
home care
Home care refers to a range of services (from help with light shopping, cleaning and housekeeping to more personal care, like help with bathing and dressing) provided in a client’s home or community dwelling (e.g., assisted living or supportive living). Additional support, such as medication administration or access to 24-hour assistance in case of an emergency, can be provided in these dwellings.
Home Care Reporting System (HCRS)
HCRS contains demographic, clinical, functional and resource utilization information about clients served by publicly funded home care programs in Canada.
initial assessment
An initial Resident Assessment Instrument–Home Care (RAI-HC) assessment is conducted by a case manager to determine eligibility and service needs of individuals being considered for publicly funded services. This may occur when there is a sudden change in health status or a gradual decline that becomes a concern. An initial assessment may be initiated while the individual is living at home, with or without short-term home care services, or during an acute care episode.
jurisdiction
This term refers to provincial or territorial governments or health regions with decision-making powers.
Ontario Mental Health Reporting System (OMHRS)
OMHRS analyzes and reports on information submitted to CIHI about all individuals receiving adult mental health services in Ontario, as well as some individuals receiving services in youth inpatient beds and selected facilities in other provinces. OMHRS includes information about mental and physical health, social supports and service use, as well as care planning, outcome measurement, quality improvement and case-mix funding applications.
Resident Assessment Instrument–Home Care (RAI-HC)
The clinical data standard for the Home Care Reporting System (HCRS) was developed by interRAI, an international research network. It was modified with permission by CIHI for Canadian use. The RAI-HC is used to identify the preferences, needs and strengths of long-term home care clients. Data from the RAI-HC is captured in HCRS.

35
Seniors in Transition: Exploring Pathways Across the Care Continuum
Resident Assessment Instrument–Minimum Data Set (RAI-MDS 2.0)
The clinical data standard for the Continuing Care Reporting System (CCRS) was developed by interRAI, an international research network. It was modified with permission by CIHI for Canadian use. Clinicians assess clients of residential care facilities using interRAI’s Resident Assessment Instrument–Minimum Data Set (RAI-MDS 2.0). Data from the RAI-MDS 2.0 is captured in CCRS.
residential care
Residential care is available for seniors who are no longer able to function independently and require full-time facility-based long-term care with 24-hour nursing supervision.
senior
An individual age 65 and older.
supportive living
See assisted living.

36
Seniors in Transition: Exploring Pathways Across the Care Continuum
Appendix B: Jurisdictional differences in terminology
JurisdictionHome care setting
Residential care settingHome care services Supportive needs servicesOntario Home care/community
support servicesRetirement homes/supportive housing
Long-term care homes/nursing homes
Manitoba Home care Supportive housing Personal care homes/nursing homes
Saskatchewan Home care Assisted living services/personal care homes
Special care homes/nursing homes
Alberta Home care Supportive living (designated and non-designated)
Long-term care facilities
British Columbia Home care Assisted living Residential care
Yukon Home care programs Not applicable Long-term/facility care

37
Seniors in Transition: Exploring Pathways Across the Care Continuum
Appendix C: Additional tables
Table C1 Results of logistic regression models assessing likelihood of entering residential care (number, percentage and odds ratios for all factors included in the models)
Factors
Following initial assessment
(number)
Following initial assessment
(percentage)
Following initial assessment —
Odds ratio (confidence
interval)Following home care (number)
Following home care
(percentage)
Following home care —
Odds ratio (confidence
interval)Hospital (initial assessment) 6,744 11.5% 6.37 (5.95, 6.83) — — —
Hospital (high user) 2,616 4.5% 1.19 (1.06, 1.34) — — —
Age (mean) — 82.7 1.02 (1.01, 1.02) — 83.6 1.00 (1.00, 1.01)
Male 21,667 37.0% 0.92 (0.87, 0.98) 15,761 36.2% 0.89 (0.84, 0.95)
Income quintile5 High 9,536 16.3% 0.87 (0.80, 0.95) 7,166 16.4% 0.92 (0.84, 1.00)
4 10,707 18.3% 0.94 (0.87, 1.02) 7,989 18.3% 0.92 (0.85, 1.00)
3 11,489 19.6% 0.99 (0.91, 1.07) 8,466 19.4% 0.94 (0.87, 1.02)
2 12,877 22.0% 0.99 (0.91, 1.07) 9,580 22.0% 0.99 (0.92, 1.07)
1 Low (reference) 13,933 23.8% — 10,373 23.8% —
Location of residence (urban) 49,342 84.3% 1.05 (0.98, 1.14) 36,735 84.3% 0.84 (0.78, 0.90)
Living alone 27,530 47.0% 2.02 (1.91, 2.15) 19,681 45.2% 2.10 (1.98, 2.22)
Caregiver distress 14,564 24.9% 1.18 (1.11, 1.26) 12,245 28.1% 1.53 (1.44, 1.62)
Caregiver unable to continue 8,954 15.3% 1.90 (1.78, 2.04) 7,590 17.4% 1.90 (1.78, 2.02)

Seniors in Transition: Exploring Pathways Across the Care Continuum
38
Factors
Following initial assessment
(number)
Following initial assessment
(percentage)
Following initial assessment —
Odds ratio (confidence
interval)Following home care (number)
Following home care
(percentage)
Following home care —
Odds ratio (confidence
interval)Requires physical assistance (ADL Hierarchy Scale)
6 Total dependence 577 1.0% 5.67 (4.25, 7.57) 708 1.6% 2.50 (1.94, 3.23)
5 Dependent 2,424 4.1% 5.99 (5.29, 6.79) 2,447 5.6% 4.20 (3.73, 4.73)
4 Maximal 3,580 6.1% 4.12 (3.70, 4.59) 3,382 7.8% 3.50 (3.15, 3.89)
3 Extensive 4,850 8.3% 3.30 (2.99, 3.63) 4,835 11.1% 3.06 (2.78, 3.36)
2 Limited 9,851 16.8% 2.06 (1.90, 2.24) 8,758 20.1% 2.27 (2.09, 2.46)
1 Supervision 8,012 13.7% 1.64 (1.50, 1.80) 5,670 13.0% 1.88 (1.72, 2.05)
0 Independent (reference) 29,248 50.0% — 17,774 40.8% —
Cognitive impairment (CPS)6 Very severe 429 0.7% 2.15 (1.55, 2.98) 570 1.3% 2.50 (1.86, 3.37)
5 Severe 2,605 4.4% 3.05 (2.65, 3.52) 3,327 7.6% 4.32 (3.69, 5.07)
4 Moderately severe 1,191 2.0% 3.09 (2.59, 3.68) 1,236 2.8% 4.53 (3.77, 5.44)
3 Moderate 7,591 13.0% 3.21 (2.86, 3.59) 7,081 16.3% 5.64 (4.90, 6.50)
2 Mild 23,800 40.7% 1.68 (1.52, 1.84) 17,186 39.4% 3.22 (2.84, 3.67)
1 Borderline 9,159 15.6% 1.25 (1.11, 1.40) 6,089 14.0% 1.84 (1.59, 2.14)
0 Intact (reference) 13,767 23.5% — 8,085 18.6% —
Responsive behaviour 7,582 13.0% 1.14 (1.05, 1.23) 6,903 15.8% 1.28 (1.19, 1.37)
Wandering 2,927 5.0% 1.73 (1.56, 1.91) 2,620 6.0% 2.00 (1.81, 2.20)
Instability (CHESS Scale) 48,296 82.5% 1.20 (1.10, 1.31) 33,027 75.8% 1.95 (1.81, 2.11)
Falls 13,199 22.5% 1.18 (1.11, 1.26) 8,131 18.7% 1.69 (1.58, 1.79)
Bladder incontinence 13,362 22.8% 1.05 (0.98, 1.12) 13,272 30.5% 1.01 (0.95, 1.07)
Bowel incontinence 5,424 9.3% 0.99 (0.90, 1.08) 5,497 12.6% 1.13 (1.04, 1.22)
Oxygen 2,839 4.8% 1.06 (0.93, 1.20) 2,669 6.1% 0.99 (0.88, 1.12)
Daily pain 29,598 50.6% 0.89 (0.84, 0.94) 22,674 52.0% 0.88 (0.83, 0.93)

39
Seniors in Transition: Exploring Pathways Across the Care Continuum
Factors
Following initial assessment
(number)
Following initial assessment
(percentage)
Following initial assessment —
Odds ratio (confidence
interval)Following home care (number)
Following home care
(percentage)
Following home care —
Odds ratio (confidence
interval)Dementia 20,677 35.3% 1.20 (1.12, 1.28) 17,124 39.3% 1.78 (1.67, 1.90)
Signs of depression 12,059 20.6% 0.98 (0.92, 1.05) 9,700 22.3% 1.11 (1.04, 1.18)
Any psychiatric diagnosis 8,724 14.9% 1.10 (1.03, 1.19) 7,959 18.3% 1.10 (1.03, 1.17)
Diabetes 14,305 24.4% 0.89 (0.83, 0.95) 11,392 26.1% 0.88 (0.83, 0.94)
Heart disease 13,281 22.7% 1.01 (0.95, 1.08) 11,482 26.4% 1.07 (1.00, 1.13)
Congestive heart failure 7,338 12.5% 1.05 (0.96, 1.14) 6,716 15.4% 0.89 (0.83, 0.97)
Emphysema/COPD/asthma 9,487 16.2% 0.97 (0.89, 1.05) 8,474 19.4% 0.96 (0.89, 1.03)
Hypertension 36,231 61.9% 1.01 (0.96, 1.07) 28,995 66.5% 1.03 (0.98, 1.09)
Stroke 10,283 17.6% 1.13 (1.06, 1.22) 8,341 19.1% 0.98 (0.92, 1.05)
Parkinson disease 2,823 4.8% 0.91 (0.80, 1.04) 2,480 5.7% 1.02 (0.92, 1.13)
Cancer 6,562 11.2% 1.22 (1.12, 1.33) 5,485 12.6% 0.77 (0.70, 0.83)
Arthritis 27,210 46.5% 0.88 (0.83, 0.93) 23,679 54.3% 1.01 (0.95, 1.06)
Hip fracture 3,064 5.2% 1.24 (1.11, 1.39) 2,193 5.0% 1.14 (1.02, 1.28)
Osteoporosis 12,309 21.0% 1.04 (0.97, 1.11) 10,973 25.2% 0.98 (0.92, 1.05)
Valid sample 58,542 — — 43,574 — —
Notes— Not applicable.ADL: Activities of Daily Living.CPS: Cognitive Performance Scale.CHESS: Changes in Health, End-Stage Disease and Signs and Symptoms.COPD: Chronic obstructive pulmonary disease.
40
Seniors in Transition: Exploring Pathways Across the Care Continuum
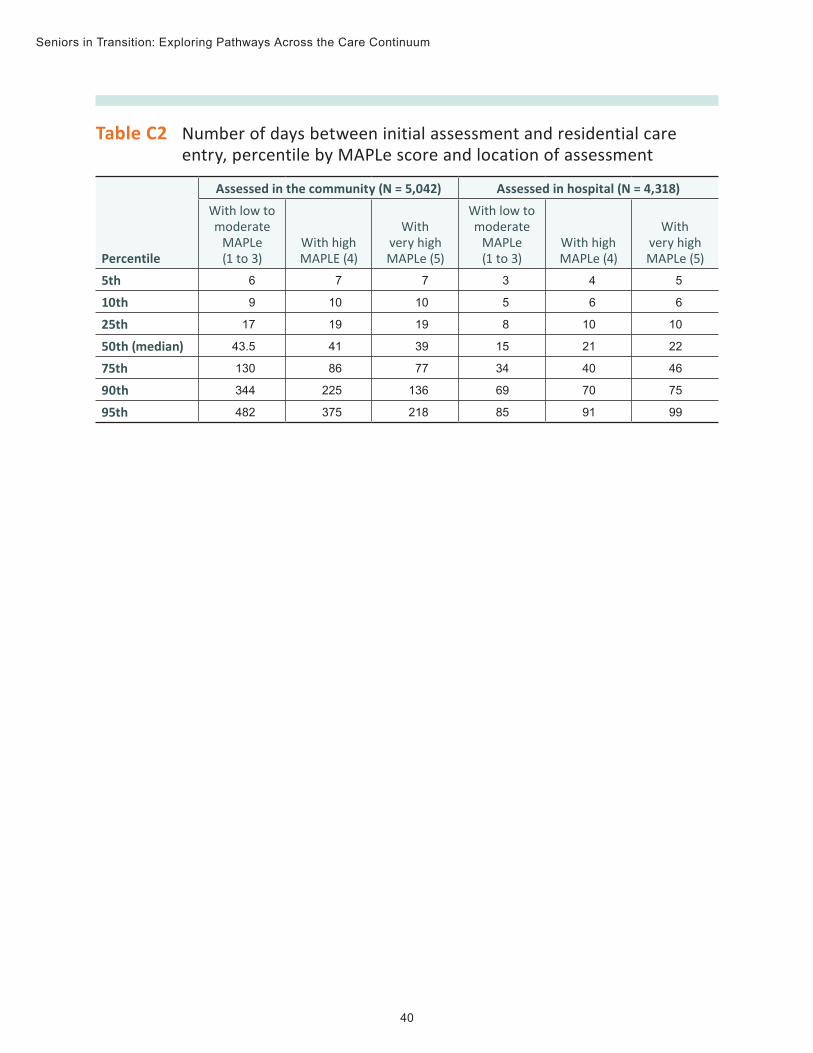
Table C2 Number of days between initial assessment and residential care entry, percentile by MAPLe score and location of assessment
Percentile
Assessed in the community (N = 5,042) Assessed in hospital (N = 4,318)With low to moderate
MAPLe (1 to 3)
With high MAPLE (4)
With very high MAPLe (5)
With low to moderate
MAPLe (1 to 3)
With high MAPLe (4)
With very high MAPLe (5)
5th 6 7 7 3 4 5
10th 9 10 10 5 6 6
25th 17 19 19 8 10 10
50th (median) 43.5 41 39 15 21 22
75th 130 86 77 34 40 46
90th 344 225 136 69 70 75
95th 482 375 218 85 91 99

41
Seniors in Transition: Exploring Pathways Across the Care Continuum
Appendix D: Text alternative for figuresData table for Figure 6: Percentage of seniors assessed in hospital who entered residential care
Province 2014–2015 2013–2014 2012–2013Ontario 65% 60% 57%
Saskatchewan — 51% 43%
Alberta 74% 70% 71%
British Columbia 85% 87% 89%
Notes— Data was not available to calculate the 2014–2015 percentage for Saskatchewan. For additional information on this figure, see the “3 cohort years” section in the Methodology Notes companion document. Winnipeg data was unavailable (in part because seniors admitted to residential care from hospital do not receive an initial assessment).Sources Home Care Reporting System and Continuing Care Reporting System, 2012–2013 to 2015–2016, and Discharge Abstract Database and Ontario Mental Health Reporting System, 2011–2012 to 2015–2016, Canadian Institute for Health Information.
Text alternative for Figure 8: Time from initial assessment to residential care entry
This shows the cumulative percentage for time from initial assessment to residential care entry in days. Those assessed in hospital with low to moderate MAPLe scores enter residential care faster than individuals assessed in the community with very high MAPLe scores. 75% of seniors assessed in the community with a MAPLe score of 5 enter within 77 days, and 75% of seniors assessed in hospital with low to moderate MAPLe scores enter within 34 days.

42
Seniors in Transition: Exploring Pathways Across the Care Continuum
Data table for Figure 9: Median ALC length of stay to receive home care and residential care, by jurisdiction
Province Care setting MedianOntario Home care 36.5
Residential care 28
Saskatchewan Home care 16
Residential care 14
Alberta Home care 32
Residential care 27
British Columbia Home care 34
Residential care 32
Sources Home Care Reporting System and Continuing Care Reporting System, 2012–2013 to 2014–2015, and Discharge Abstract Database and Ontario Mental Health Reporting System, 2011–2012 to 2014–2015, Canadian Institute for Health Information.

43
Seniors in Transition: Exploring Pathways Across the Care Continuum
References 1. Carstairs S, Keon WJ. Canada’s Aging Population: Seizing the Opportunity. Special
Senate Committee on Aging — Final Report. 2009.
2. Statistics Canada. CANSIM Table 052-0005: Projected population, by projection scenario, age and sex, as of July 1, Canada, provinces and territories, annual (persons). Accessed February 17, 2017.
3. Canadian Institute for Health Information. Health Care in Canada, 2011: A Focus on Seniors and Aging. 2011.
4. Denton FT, Spencer B. Chronic Health Conditions: Changing Prevalence in an Aging Population and Some Implications for the Delivery of Health Care Services. 2009.
5. World Health Organization. World Report on Ageing and Health. 2015.
6. Chatterji S, Byles J, Cutler D, Seeman T, Verdes E. Health, functioning, and disability in older adults — Present status and future implications. The Lancet. 2015.
7. Canadian Institute for Health Information. Inpatient hospitalizations: Volumes, length of stay and standardized rates. Quick Stats tables. 2014–2015. Accessed February 2, 2017.
8. Madore O. The Canada Health Act: Overview and Options. Revised May 16, 2005. Accessed January 19, 2017.
9. Kaier K, Mutters NT, Frank U. Bed occupancy rates and hospital-acquired infections — Should beds be kept empty?. Clinical Microbiology and Infection. October 2012.
10. Derlet RW, McNamara RM, Kazzi AA, Richards JR. Emergency department crowding and loss of medical licensure: A new risk of patient care in hallways. Western Journal of Emergency Medicine. March 2014.
11. Mathews SB, Arnold SE, Epperson CN. Hospitalization and cognitive decline: Can the nature of the relationship be deciphered?. The American Journal of Geriatric Psychiatry. May 2014.
12. Graf C. Functional decline in hospitalized older adults: It’s often a consequence of hospitalization, but it doesn’t have to be. The American Journal of Nursing. January 2006.
13. Office of the Seniors Advocate British Columbia. Placement, Drugs and Therapy . . . We Can Do Better. 2016.

44
Seniors in Transition: Exploring Pathways Across the Care Continuum
14. Doupe M, John PS, Chateau D, Strang D, Smele S, Bozat-Emre S, Fransoo R, Dik N. Profiling the multidimensional needs of new nursing home residents: Evidence to support planning. Journal of the American Medical Directors Association. June 2012.
15. Hirdes JP, Poss JW, Curtin-Telegdi N. The Method for Assigning Priority Levels (MAPLe): A new decision-support system for allocating home care resources. BMC Medicine. March 2008.
16. Ontario Long Term Care Association. This Is Long-Term Care 2016. 2016.
17. Health Quality Ontario. Measuring Up 2016: A Yearly Report on How Ontario’s Health System Is Performing. 2016.
18. Luppa M, Luck T, Weyerer S, König HH, Brähler E, Riedel-Heller SG. Prediction of institutionalization in the elderly: A systematic review. Age and Ageing. January 2010.
19. Penning MJ, Cloutier DS, Nuernberger K, MacDonald SW, Taylor D. Long-term care trajectories in Canadian context: Patterns and predictors of publicly funded care. The Journals of Gerontology Series B: Psychological Sciences and Social Sciences. August 2016.
20. Canadian Institute for Health Information. Describing Outcome Scales (RAI-MDS 2.0). 2013.
21. Canadian Institute for Health Information. Supporting Informal Caregivers — The Heart of Home Care. 2010.
22. Canadian Institute for Health Information. Seniors and Alternate Level of Care: Building on Our Knowledge. 2012.
23. Canadian Centre for Elder Law. Discussion Paper on Assisted Living: Past, Present and Future Legal Trends in Canada. 2008.
24. Dementia Village Advisors. Dementia villages. Accessed February 28, 2017.
25. Alberta Health Services. Continuing care: Continuing care choices. Accessed February 28, 2017.
26. Ontario Ministry of Health and Long-Term Care. Patients First: A Roadmap to Strengthen Home and Community Care. 2015.
27. BC Government News. B.C. continues to expand primary and community care [media release]. March 1, 2013.

[email protected] Ottawa495 Richmond Road
Suite 600
Ottawa, Ont.
K2A 4H6
613-241-7860
CIHI Toronto 4110 Yonge Street
Suite 300
Toronto, Ont.
M2P 2B7
416-481-2002
CIHI Victoria 880 Douglas Street
Suite 600
Victoria, B.C.
V8W 2B7
250-220-4100
CIHI Montréal 1010 Sherbrooke Street West
Suite 602
Montréal, Que.
H3A 2R7
514-842-2226
cihi.ca15522-0617