senior thesis volcanoes as indicators of regional stress
TRANSCRIPT
Senior Thesis
Volcanoes as Indicators of Regional Stress Orientation in the Erebus Volcanic Province, West Antarctica
by Adam. Angel
1995
submitted as partial fulfillment of the requirements for the degree of Bachelor of Science in Geology and
Mineralogy at The Ohio State University, Spring Quarter, 1995
Approved by:
Table of Contents
Introduction .................................................... 1
Stress Determinations from Volcanic Alignments .................• 2
Plank Eruptions on Polygenetic Volcanoes ...•.....•....•.... 2
Vent Alignments in Volcanic Fields ........................ • s
Potential Ambiguities and Problems .............................. 8
Examples Carried Out With Proposed Methods •..............•..•••• 9
Tectonic Setting and Geology of the Erebus Volcanic Province ..• 12
Neotectonic Setting of Antarctica .•..••.............•.•... 12
Cenozoic McMurdo Volcanic Group .•..•..•....•.•....•...•••. 15
Erebus Volcanic Province .......•.......................... 16
Previous Structural Models for the Erebus Volcanic Province ••.. 17
Discussion .......•............................•......•......... 19
References
Table
Figures
INTRODUCTION
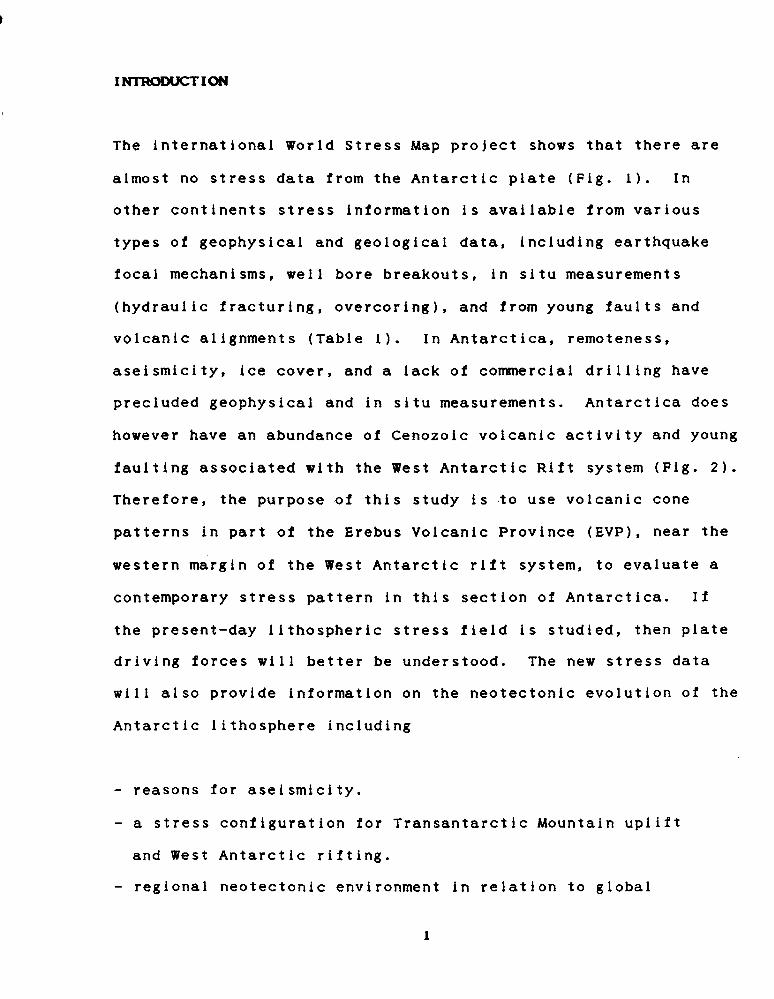
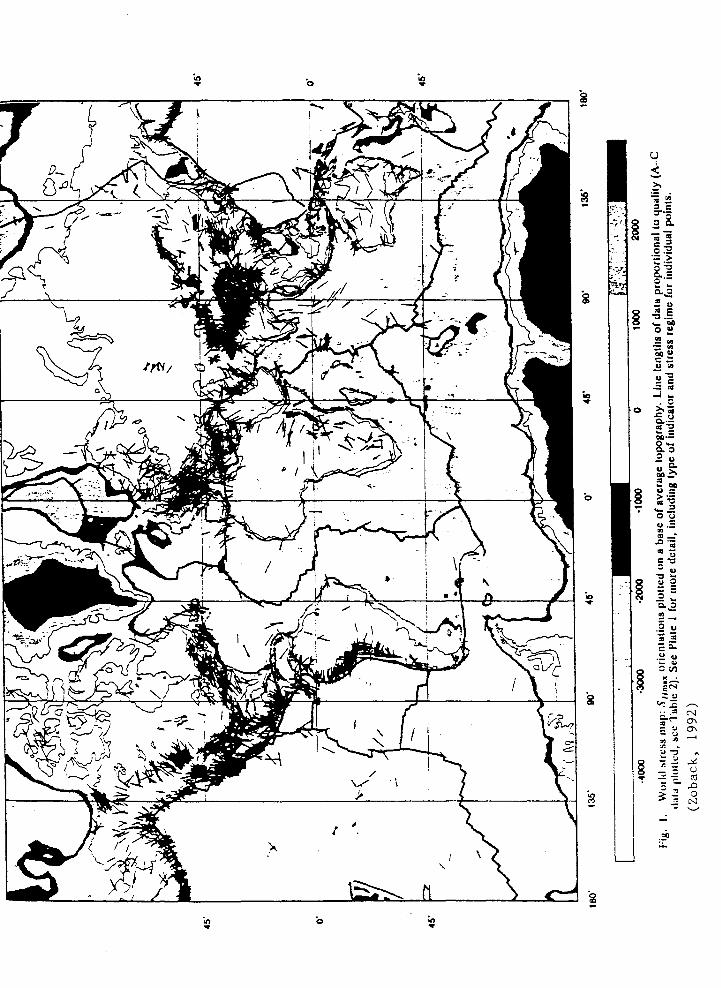
The international World Stress Map project shows that there are
almost no stress data from the Antarctic plate (Fig. 1). In
other continents stress information is available from various
types of geophysical and geological data, including earthquake
focal mechanisms, well bore breakouts, in situ measurements
(hydraulic fracturing, overcoring), and from young faults and
volcanic alignments (Table 1). In Antarctica, remoteness,
aseismicity, ice cover, and a lack of commercial drilling have
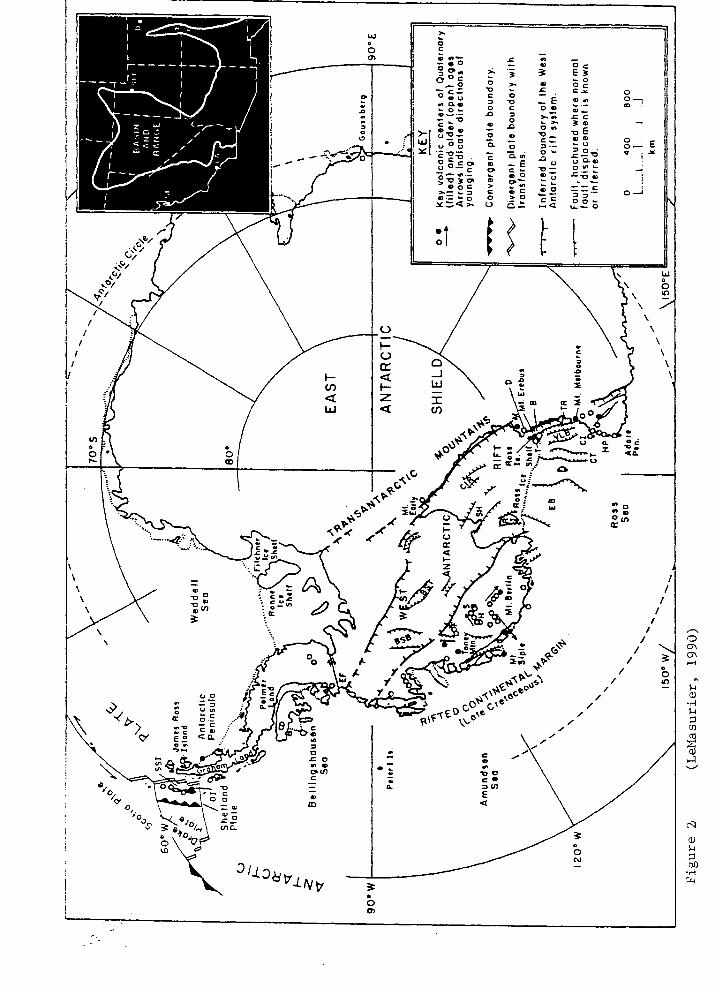
precluded geophysical and in situ measurements. Antarctica does
however have an abundance of Cenozoic volcanic activity and young
faulting associated with the West Antarctic Rift system (Fig. 2).
Therefore, the purpose of this study is to use volcanic cone
patterns in part of the Erebus Volcanic Province (EVP), near the
western margin of the West Antarctic rift system, to evaluate a
contemporary stress pattern in this section of Antarctica. If
the present-day lithospheric stress field is studied, then plate
driving forces will better be understood. The new stress data
will also provide information on the neotectonic evolution of the
Antarctic lithosphere including
- reasons for aseismicity.
- a stress configuration for Transantarctic Mountain uplift
and West Antarctic rifting.
- regional neotectonic environment in relation to global
1
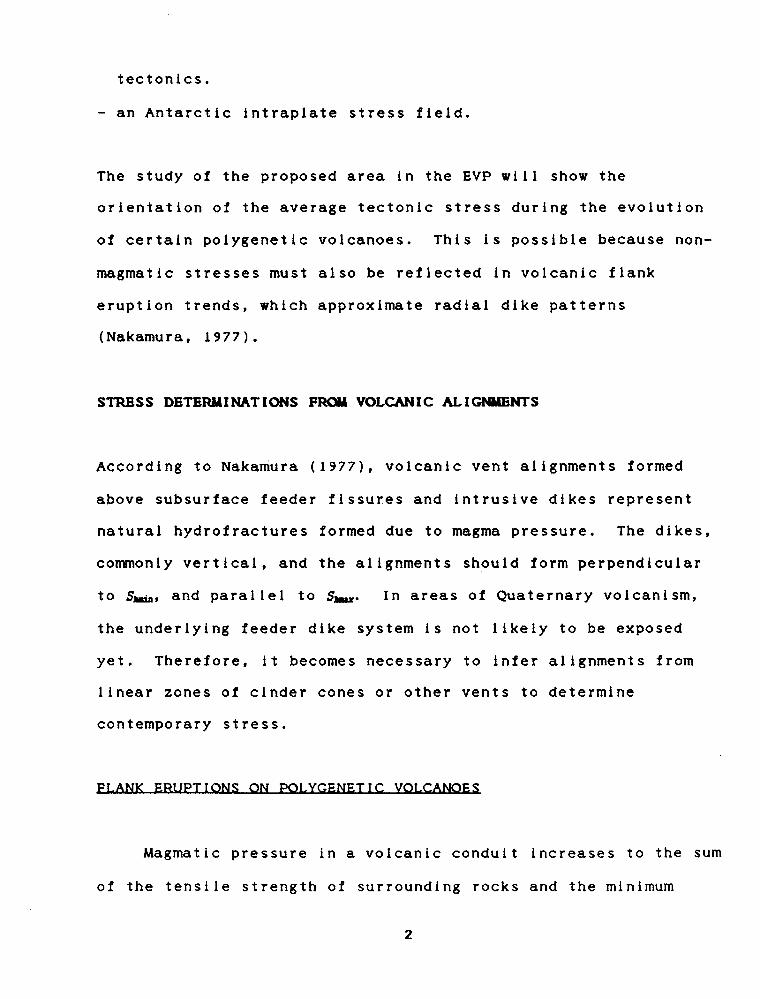
tectonics.
- an Antarctic intraplate stress field.
The study of the proposed area in the EVP will show the
orientation of the average tectonic stress during the evolution
of certain polygenetic volcanoes. This is possible because non
magmatic stresses must also be reflected in volcanic flank
eruption trends, which approximate radial dike patterns
(Nakamura, 1977).
STRESS DETERMINATIONS FROll VOLCANIC ALIGNMENTS
According to Nakamura (1977), volcanic vent alignments formed
above subsurface feeder fissures and intrusive dikes represent
natural hydrofractures formed due to magma pressure. The dikes,
commonly vertical, and the alignments should form perpendicular
to SJ11W, and parallel to S11au· In areas of Quaternary volcanism,
the underlying feeder dike system is not likely to be exposed
yet. Therefore, it becomes necessary to infer alignments from
linear zones of cinder cones or other vents to determine
contemporary stress.
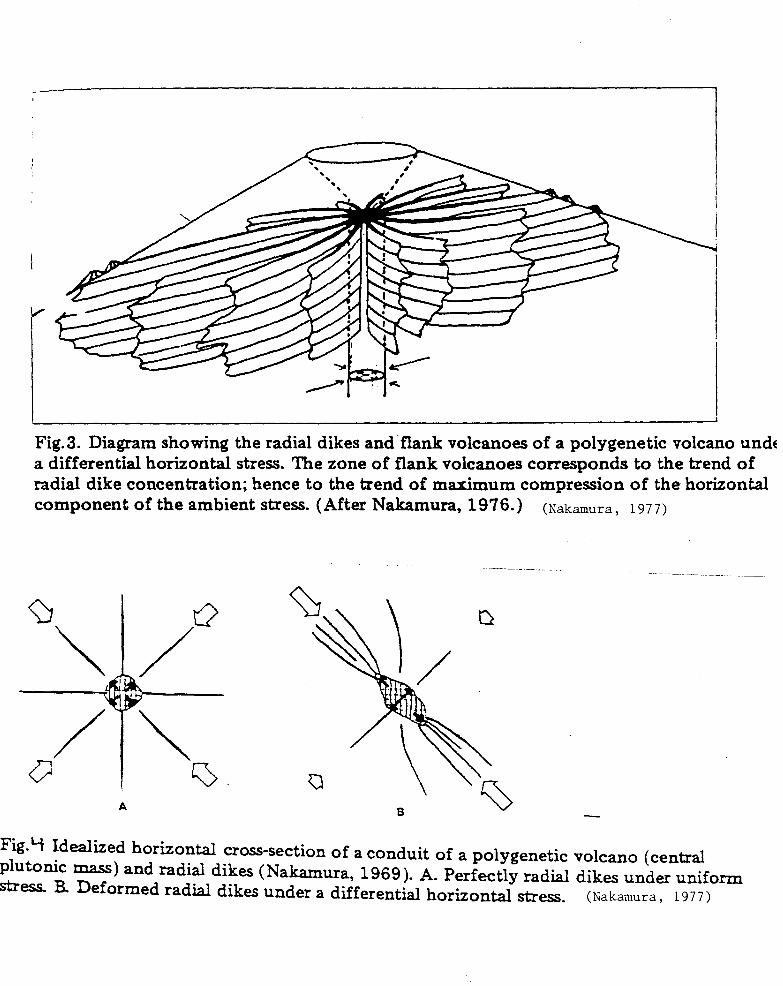
FLANK ERUPTIONS ON PQLYGENETIC VOLCANOES
Magmatic pressure in a volcanic conduit increases to the sum
of the tensile strength of surrounding rocks and the minimum
2
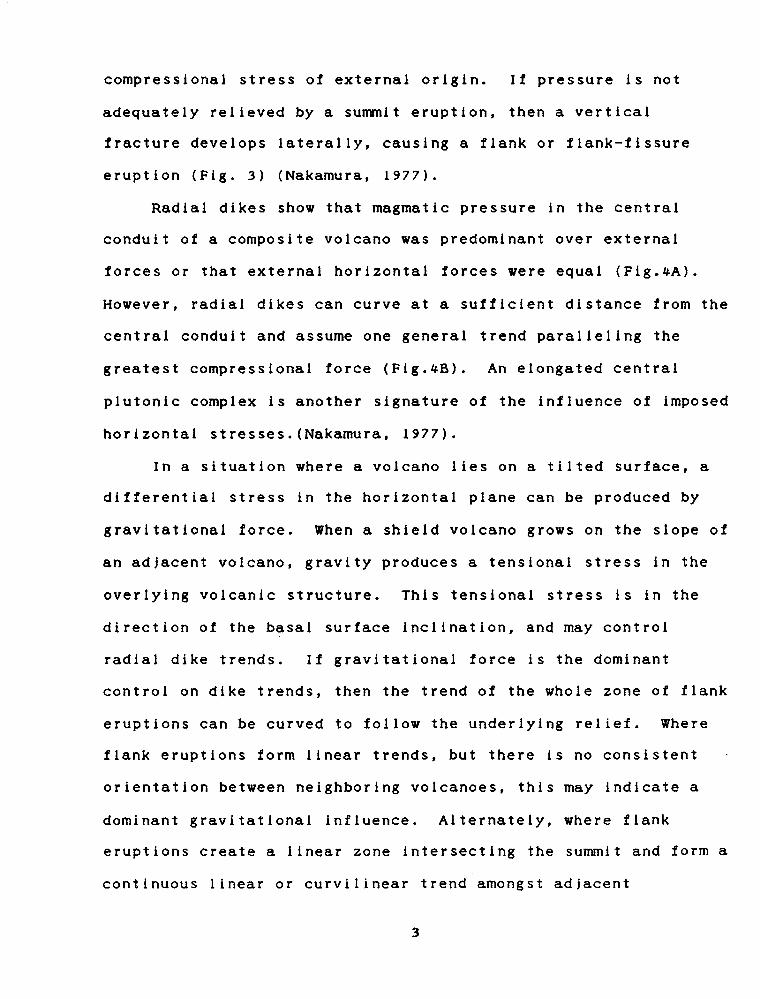
compressional stress of external origin. If pressure is not
adequately relieved by a summit eruption, then a vertical
fracture develops laterally, causing a flank or flank-fissure
eruption (Fig. 3) (Nakamura, 1977).
Radial dikes show that magmatic pressure in the central
conduit of a composite volcano was predominant over external
forces or that external horizontal forces were equal (Fig.~A).
However, radial dikes can curve at a sufficient distance from the
central conduit and assume one general trend paralleling the
greatest compressional force (Fig.~B). An elongated central
plutonic complex is another signature of the influence of imposed
horizontal stresses.(Nakamura, 1977).
In a situation where a volcano lies on a tilted surface, a
differential stress in the horizontal plane can be produced by
gravitational force. When a shield volcano grows on the slope of
an adjacent volcano, gravity produces a tensional stress in the
overlying volcanic structure. This tensional stress is in the
direction of the basal surface inclination, and may control
radial dike trends. If gravitational force is the dominant
control on dike trends, then the trend of the whole zone of flank
eruptions can be curved to follow the underlying relief. Where
flank eruptions form linear trends, but there is no consistent
orientation between neighboring volcanoes, this may indicate a
dominant gravitational influence. Alternately, where flank
eruptions create a linear zone intersecting the summit and form a
continuous linear or curvilinear trend amongst adjacent
3
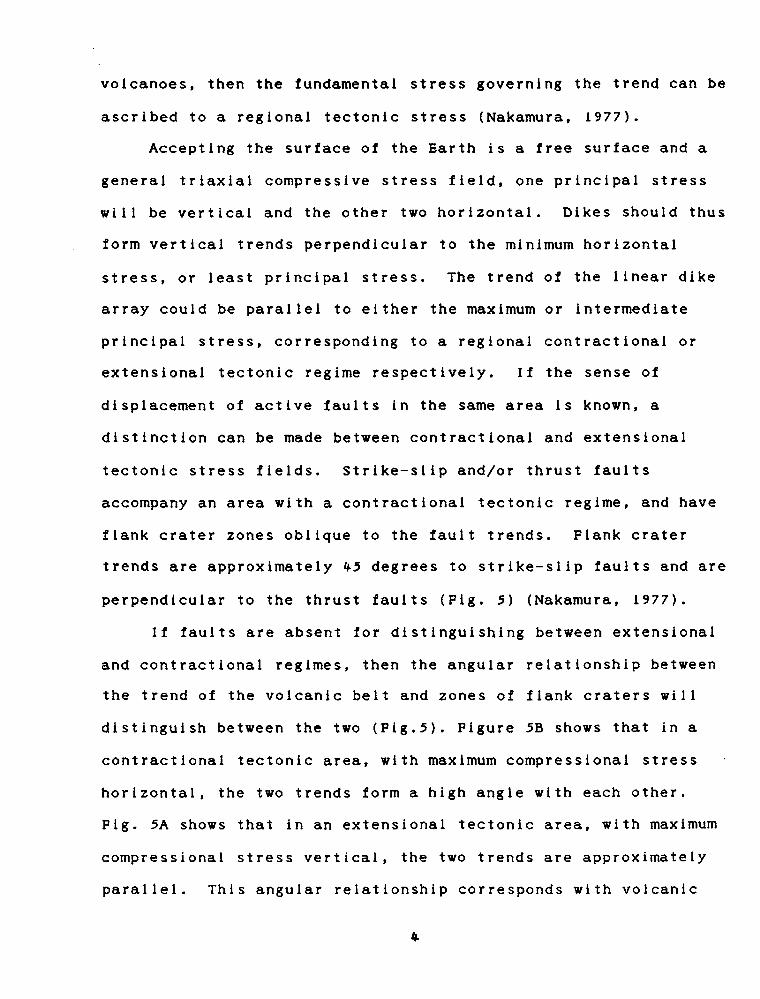
volcanoes, then the fundamental stress governing the trend can be
ascribed to a regional tectonic stress (Nakamura, 1977).
Accepting the surface of the Earth is a free surface and a
general triaxial compressive stress field, one principal stress
will be vertical and the other two horizontal. Dikes should thus
form vertical trends perpendicular to the minimum horizontal
stress, or least principal stress. The trend of the linear dike
array could be parallel to either the maximum or intermediate
principal stress, corresponding to a regional contractional or
extensional tectonic regime respectively. If the sense of
displacement of active faults in the same area is known, a
distinction can be made between contractional and extensional
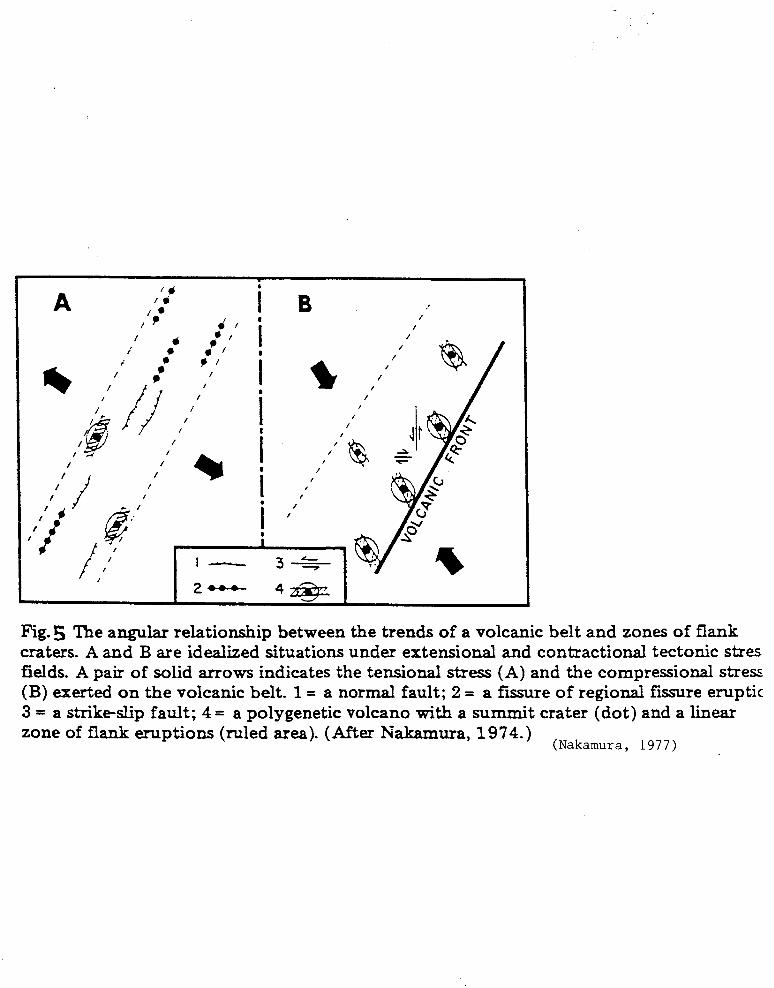
tectonic stress fields. Strike-slip and/or thrust faults
accompany an area with a contractional tectonic regime, and have
flank crater zones oblique to the fault trends. Flank crater
trends are approximately ~5 degrees to strike-slip faults and are
perpendicular to the thrust faults (Pig. 5) (Nakamura, 1977).
If faults are absent for distinguishing between extensional
and contractional regimes, then the angular relationship between
the trend of the volcanic belt and zones of flank craters will
distinguish between the two (Pig.5). Figure 5B shows that in a
contractional tectonic area, with maximum compressional stress
horizontal, the two trends form a high angle with each other.
Fig. 5A shows that in an extensional tectonic area, with maximum
compressional stress vertical, the two trends are approximately
parallel. This angular relationship corresponds with volcanic

..£:
belts under contractional and extensional tectonics,
respectively. Extensional volcanic belts and accompanying zones
of flank eruptions tend to be perpendicular to the divergence
direction between plates. Contractional tectonic area volcanic
belts parallel the convergence direction across the plate
boundary. The maximum compressional stress in the volcanic belt
will be nearly parallel to the converging direction and form an
angle between the zone of flank eruptions and the trend of the
volcanic belt (Nakamura, 1977).
VENT ALIGNMENTS IN VO!CANIC EIE!DS
Multiple eruptions in a given area will form a field of
scattered vents and cinder cones. Due to the linear character of
magmatic hydrofractures, any one given eruption can produce
multiple vents, and it is difficult to determine these vent
alignments from visible cinder cones (Pig. 6). The goal is to
statistically produce and reproduce these vent alignments (Pig.
7) (Wadge and Cross, 1988).
One way to define volcanic alignments is by midpoint,
strike, and length. Alignments are chosen by inspection and the
strike is then determined by a linear least squares fit. The
standard deviation of the fit is used to determine the quality of
the proposed alignment along with the number of vents. The
quality rating is grouped into four ranks, A >B >C >D, where A ~5
vents, and B = ~ vents. When the standard deviation of the fit
.5

SD ~750m, no penalty is applied to the alignment. A penalty of
one rank is applied where 750m < SD< 2250m, and a penalty of
three ranks applied where SD> 2250m (Suter et al., 1992).
There are two other quantitative methods for determining the
directions of lineaments defined by aligned volcanic vents. The
two-point azimuth and Hough transform methods are two effective
procedures, which can compliment each other and generate
reproducible results.
The two-point azimuth method checks the whole field of
mapped vent sites and tests whether alignments are significant or
due to chance. First, every azimuth between a given point and
all other points is measured. For a total of n points there will
be n(n-1)/2 azimuths that may or may not show a preferred
direction. The problem is that an elongated field of study will
produce more azimuths with that orientation. This problem can be
fixed by using a circular field or by correcting for the shape of
the field. By using a set of circular fields (bins), a
correction for field elongation can be made. Each bin is
treated separately and given a correction based on C-of(exf/sf),
where c is the correction, of is the observed frequency, exf is
the expected mean frequency, and af is the simulated frequency.
The result can be displayed as a histogram of azimuth frequency
for each bin. Ideally, this method should be used in a field of
homogeneously distributed points. Therefore, in a heterogenous
field, the same number of points is used in each bin (Wadge and
Cross, 1988).
6
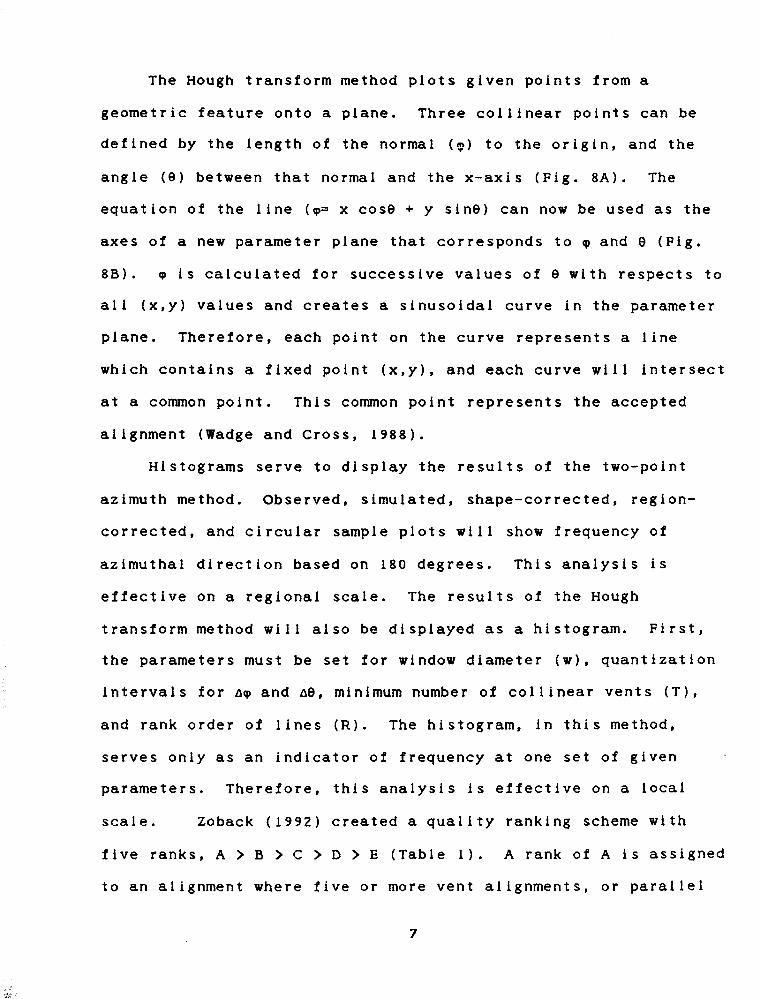
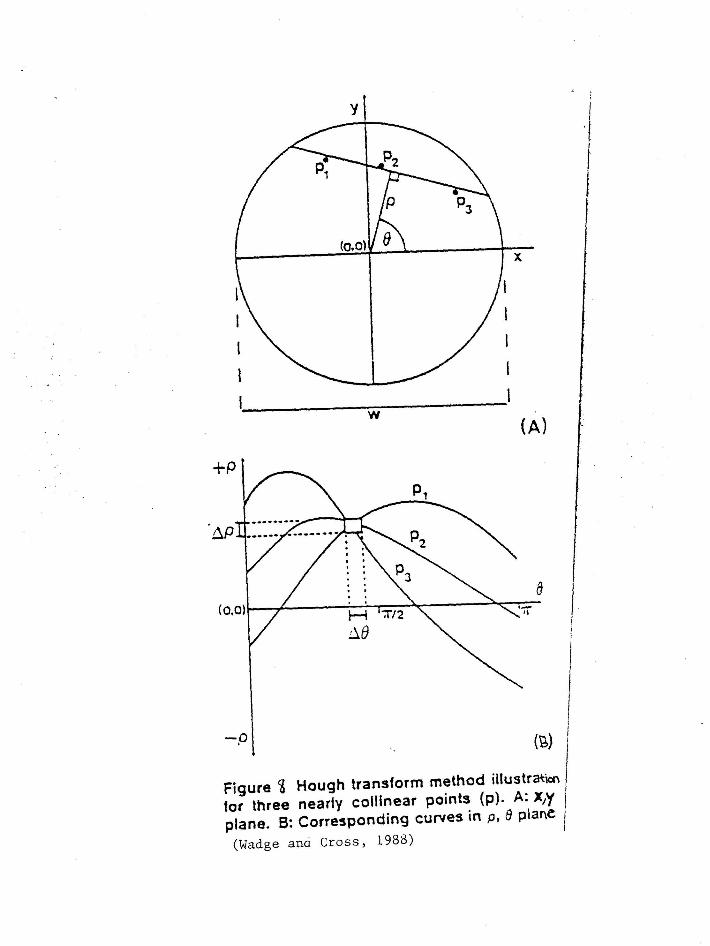
The Hough transform method plots given points from a
geometric feature onto a plane. Three collinear points can be
defined by the length of the normal {~) to the origin, and the
angle (0) between that normal and the x-axis {Fig. 8A). The
equation of the line {~= x cose + y sine) can now be used as the
axes of a new parameter plane that corresponds to ~ and a {Fig.
8B). ~is calculated for successive values of 0 with respects to
all (x,y) values and creates a sinusoidal curve in the parameter
plane. Therefore, each point on the curve represents a line
which contains a fixed point (x,y), and each curve will intersect
at a conunon point. This conunon point represents the accepted
alignment (Wadge and Cross, 1988).
Histograms serve to display the results of the two-point
azimuth method. Observed, simulated, shape-corrected, region
corrected, and circular sample plots will show frequency of
azimuthal direction based on 180 degrees. This analysis is
effective on a regional scale. The results of the Hough
transform method will also be displayed as a histogram. First,
the parameters must be set for window diameter (w), quantization
intervals for A~ and A0, minimum number of collinear vents (T),
and rank order of lines (R). The histogram, in this method,
serves only as an indicator of frequency at one set of given
parameters. Therefore, this analysis is effective on a local
scale. Zoback (1992) created a quality ranking scheme with
five ranks, A> B > c > D > E (Table 1). A rank of A is assigned
to an alignment where five or more vent alignments, or parallel
7

dikes, are present with a standard deviation of less than 12
degrees. A rank of B is assigned to an alignment where three or
more vent alignments, or parallel dikes, are present with a
standard deviation of less than 20 degrees. A rank of C is
assigned to an alignment where there is a single well exposed
dike or a single alignment. A, B, and c vent alignments must
consist of at least five vents. A rank of D is assigned when an
alignment has be inferred from less than five vents. A rank of E
is assigned when no reliable information is available regarding
principal stress orientations. Lastly, rank A is considered to
be accurate within ±10-15 degrees, rank B within ±15-20 degrees,
rank C within ±25 degrees, and D yielding questionable results.
POTENTIAL AMBIGUITIES AND PROBLEMS
The primary problem with vent alignment analysis is that
pre-existing Joint sets, when close to the surface, may control
intrusion rather than magma inducing fractures as required to
apply stress analysis. However, the errors created by
preexisting fault sets will be small. For a previously existing
Joint set to be intruded into, its strike must be nearly
perpendicular to the greatest tensional stress. The error can be
great when the two horizontal stresses are approximately equal,
but this scenario rarely occurs (Zoback, 1992). The Chyulu Hills
in Southeastern Kenya and the Springerville Volcanic Field in
Arizona exhibit this problem and provide insight on tectonic
8
stress regimes of the past, as well as exposing the ambiguities
inherent in using this method.
EXAMPLES CARRIED OUT WITH PROPOSED llETifODS
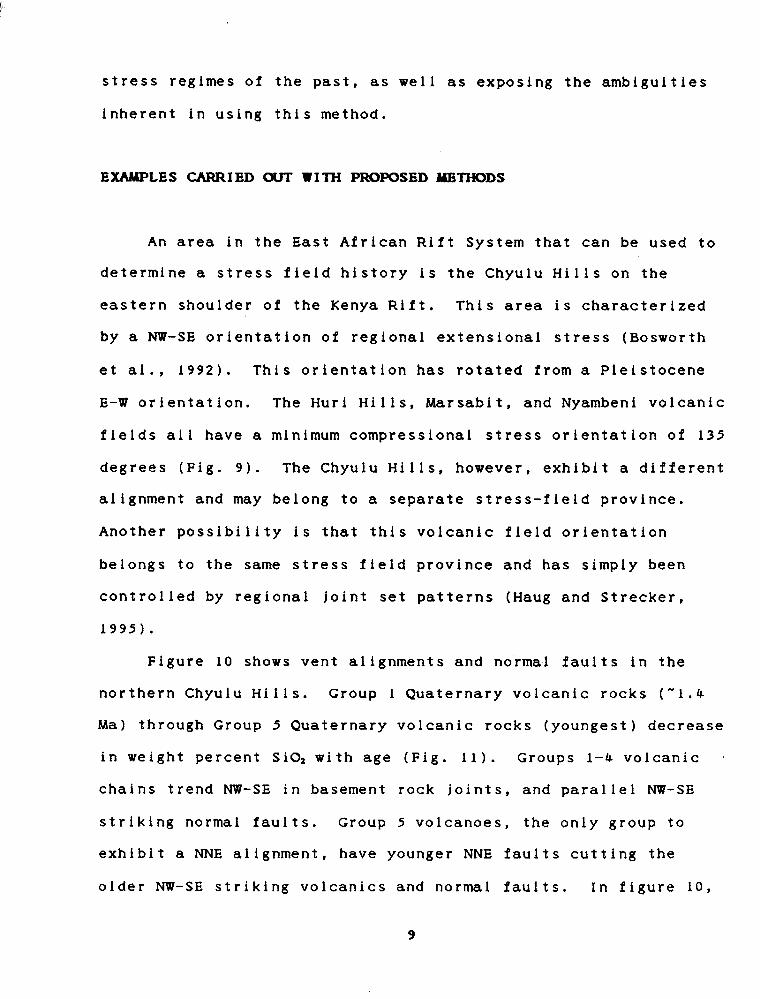
An area in the East African Rift System that can be used to
determine a stress field history is the Chyulu Hills on the
eastern shoulder of the Kenya Rift. This area is characterized
by a NW-SE orientation of regional extensional stress (Bosworth
et al., 1992). This orientation has rotated from a Pleistocene
E-W orientation. The Huri Hills, Marsabit, and Nyambeni volcanic
fields all have a minimum compressional stress orientation of 135
degrees (Fig. 9). The Chyulu Hills, however, exhibit a different
alignment and may belong to a separate stress-field province.
Another possibility is that this volcanic field orientation
belongs to the same stress field province and has simply been
controlled by regional joint set patterns (Haug and Strecker,
1995).
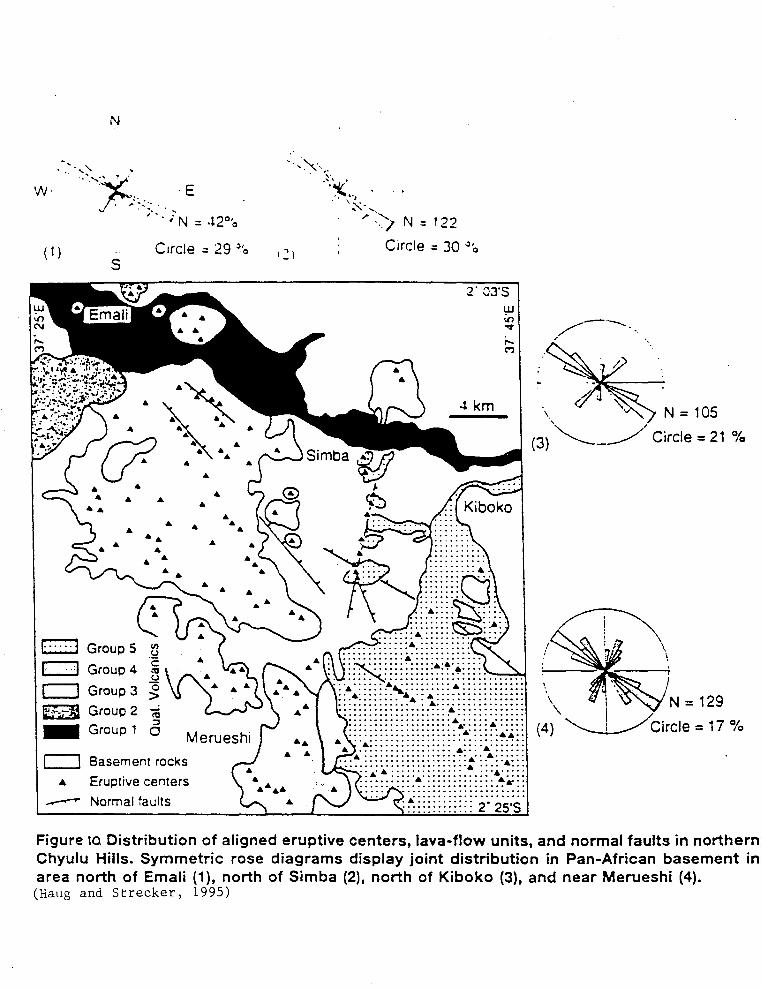
Figure 10 shows vent alignments and normal faults in the
northern Chyulu Hills. Group l Quaternary volcanic rocks c-1.~
Ma) through Group 5 Quaternary volcanic rocks (youngest) decrease
in weight percent Si02 with age (Fig. 11). Groups 1-~ volcanic
chains trend NW-SE in basement rock joints, and parallel NW-SE
striking normal faults. Group 5 volcanoes, the only group to
exhibit a NNE alignment, have younger NNE faults cutting the
older NW-SE striking volcanics and normal faults. In figure 10,
9
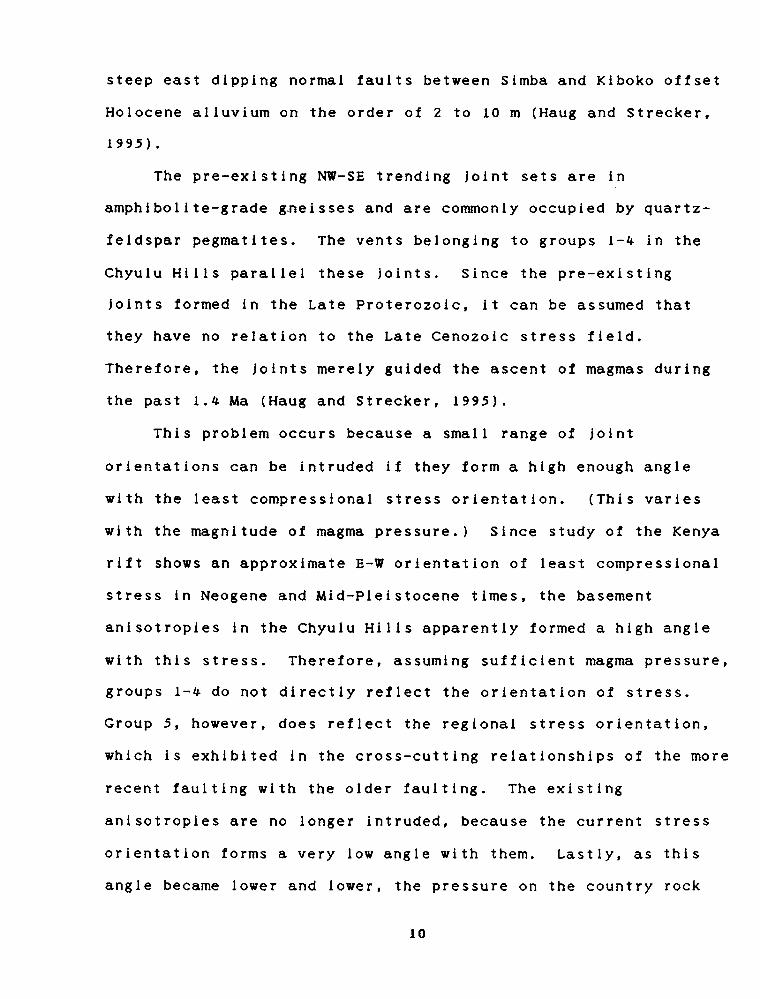
steep east dipping normal faults between Simba and Kiboko offset
Holocene alluvium on the order of 2 to 10 m (Haug and Strecker,
1995).
The pre-existing NW-SE trending Joint sets are in
amphibolite-grade ~neisses and are commonly occupied by quartz
feldspar pegmatites. The vents belonging to groups 1-4 in the
Chyulu Hills parallel these joints. Since the pre-existing
Joints formed in the Late Proterozoic, it can be assumed that
they have no relation to the Late Cenozoic stress field.
Therefore, the Joints merely guided the ascent of magmas during
the past 1.4 Ma (Haug and Strecker, 1995).
This problem occurs because a small range of Joint
orientations can be intruded if they form a high enough angle
with the least compressional stress orientation. (This varies
with the magnitude of magma pressure.) Since study of the Kenya
rift shows an approximate E-W orientation of least compressional
stress in Neogene and Mid-Pleistocene times, the basement
anisotropies in the Chyulu Hills apparently formed a high angle
with this stress. Therefore, assuming sufficient magma pressure,
groups 1-4 do not directly reflect the orientation of stress.
Group 5, however, does reflect the regional stress orientation,
which is exhibited in the cross-cutting relationships of the more
recent faulting with the older faulting. The existing
anisotropies are no longer intruded, because the current stress
orientation forms a very low angle with them. Lastly, as this
angle became lower and lower, the pressure on the country rock
10
increased (prior to new faulting) and caused the intrusions to
become more felsic (Haug and Strecker, 1995).
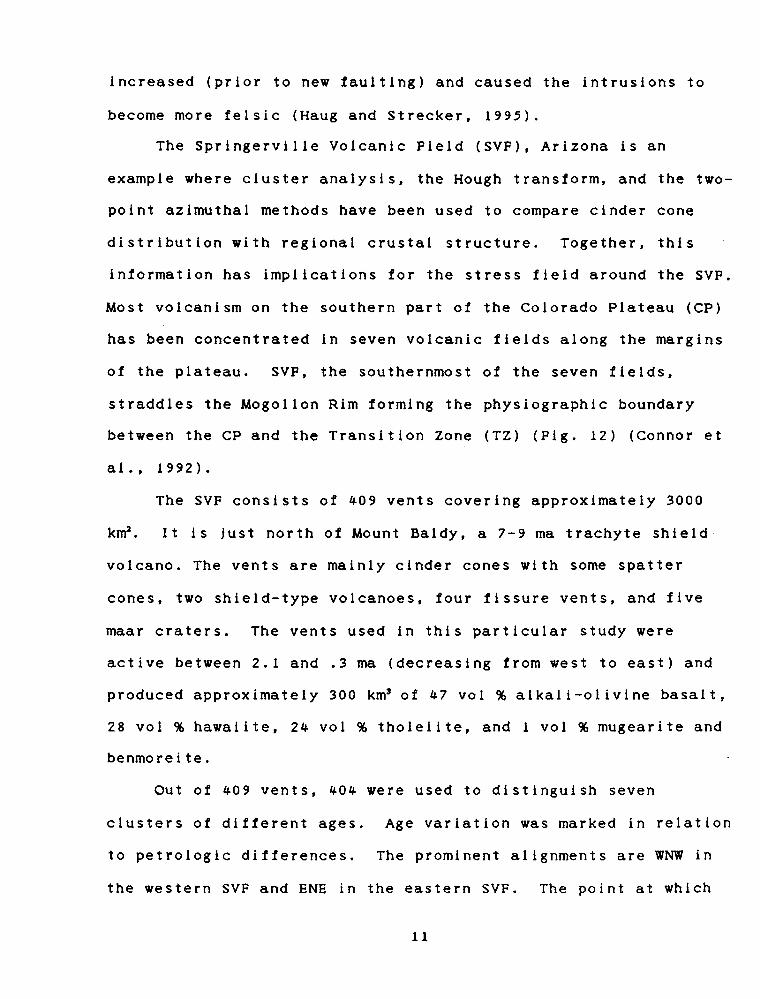
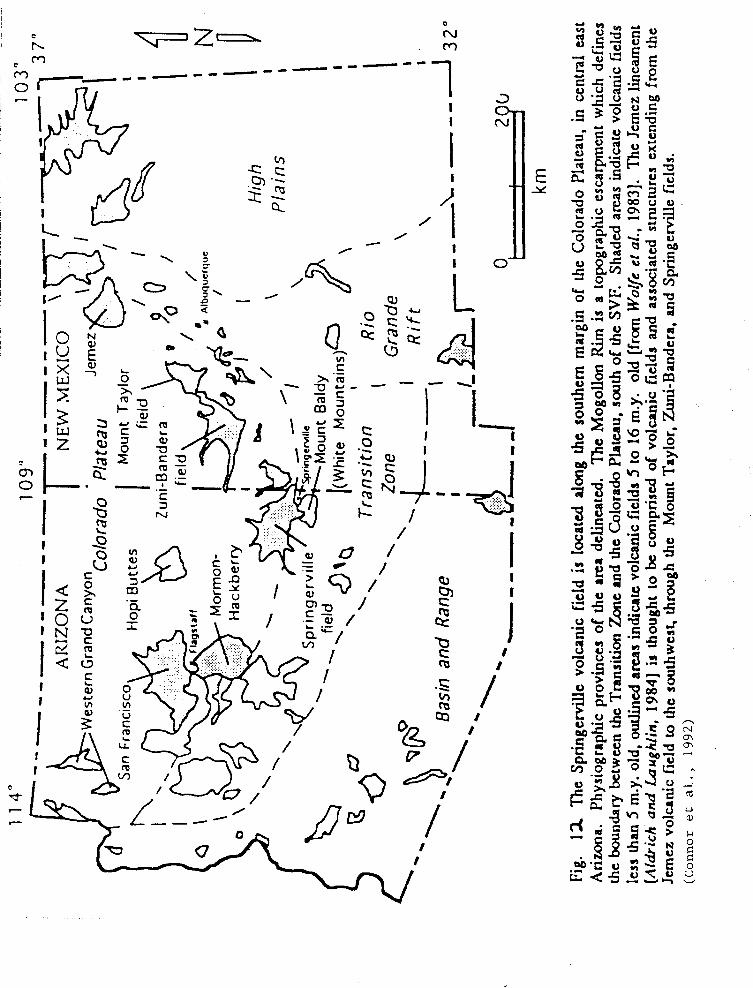
The Springerville Volcanic Field (SVF), Arizona is an
example where cluster analysis, the Hough transform, and the two
point azimuthal methods have been used to compare cinder cone
distribution with regional crustal structure. Together, this
information has implications for the stress field around the SVP.
Most volcanism on the southern part of the Colorado Plateau (CP)
has been concentrated in seven volcanic fields along the margins
of the plateau. SVP, the southernmost of the seven fields,
straddles the Mogollon Rim forming the physiographic boundary
between the CP and the Transition Zone (TZ) (Pig. 12) (Connor et
al., 1992).
The SVF consists of 409 vents covering approximately 3000
km2 • It is just north of Mount Baldy, a 7-9 ma trachyte shield
volcano. The vents are mainly cinder cones with some spatter
cones, two shield-type volcanoes, four fissure vents, and five
maar craters. The vents used in this particular study were
active between 2.1 and .3 ma (decreasing from west to east) and
produced approximately 300 km' of 47 vol% alkali-olivine basalt,
28 vol % hawaiite, 24 vol % tholeiite, and 1 vol % mugearite and
benmoreite.
Out of 409 vents, 404 were used to distinguish seven
clusters of different ages. Age variation was marked in relation
to petrologic differences. The prominent alignments are WNW in
the western SVF and ENE in the eastern SVF. The point at which
11
these two trends meet in the south central SVF marks the most
intense cinder cone density. Cluster distribution and age
variation would seem to indicate that these vent alignments are
due to magma ascension along preexisting faults and fractures.
These extensional features are most likely related to regional
physiographic features such as the Colorado Plateau (Connor et
al., 1992).
TECTONIC SETTING AND GEOLOGY OF THE EREBUS VOLCANIC PROVINCE
NEOTECTONIC SETTING OE ANTARCTICA
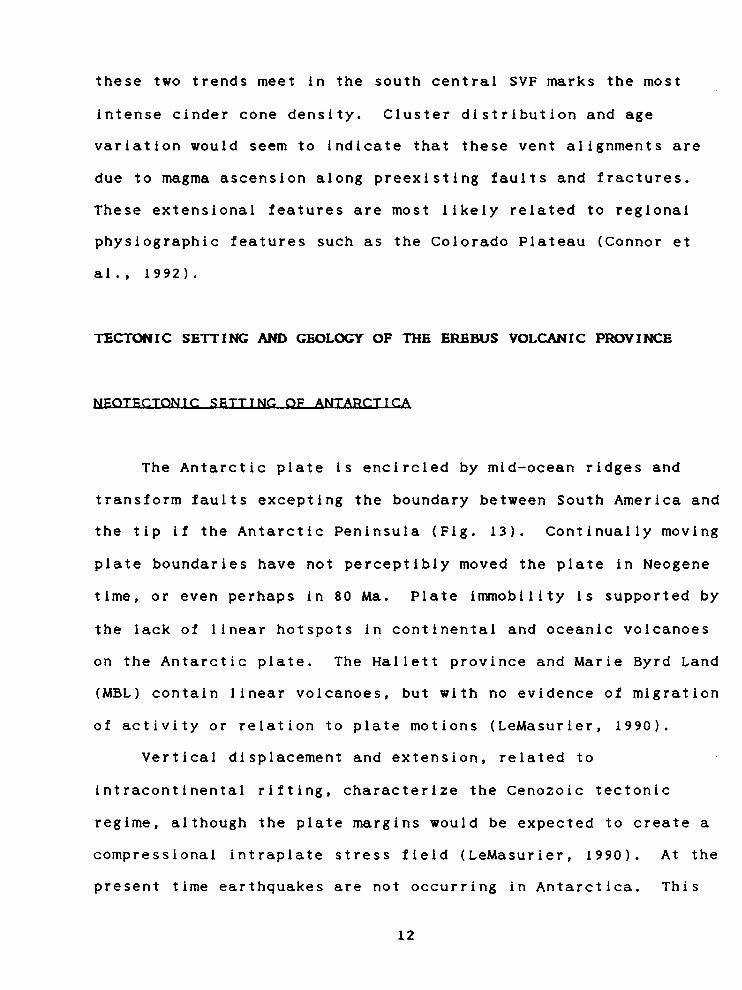
The Antarctic plate is encircled by mid-ocean ridges and
transform faults excepting the boundary between South America and
the tip if the Antarctic Peninsula (Fig. 13). Continually moving
plate boundaries have not perceptibly moved the plate in Neogene
time, or even perhaps in 80 Ma. Plate immobility is supported by
the lack of linear hotspots in continental and oceanic volcanoes
on the Antarctic plate. The Hallett province and Marie Byrd Land
(MBL) contain linear volcanoes, but with no evidence of migration
of activity or relation to plate motions (LeMasurier, 1990).
Vertical displacement and extension, related to
intracontinental rifting, characterize the Cenozoic tectonic
regime, although the plate margins would be expected to create a
compressional intraplate stress field (LeMasurier, 1990). At the
present time earthquakes are not occurring in Antarctica. This
12

could reflect modern tectonic quiescence that might follow a
period of high post-deglaciation seismicity. However, seismicity
might also be suppressed by the combination of vertical loading
by the Antarctic Ice Sheet and a compressional intraplate stress
field. In addition to little seismic activity, borehole stress
measurements are not available on the Antarctic continent due to
remoteness, ice cover, and lack of commercial drilling.
Subduction-related volcanoes in Graham Land (GL) and the
South Shetland Islands (SSI) are remnants of a Cretaceous active
plate margin that stretched along the entire Pacific margin of
the combined Antarctic-New Zealand (NZ)-Campbell Plateau (CP)
continent. Around 80 Ma the NZ-CP block rifted from MBL and
created the present rifted continental margin. Subduction
terminated systematically northeastward until ~Ma when it
stopped at the tip of the Antarctic Peninsula. Therefore the
northern Antarctic Peninsula consists of arc, back-arc, and
within plate environments that overlap within 10 Ma (LeMasurier,
1990).
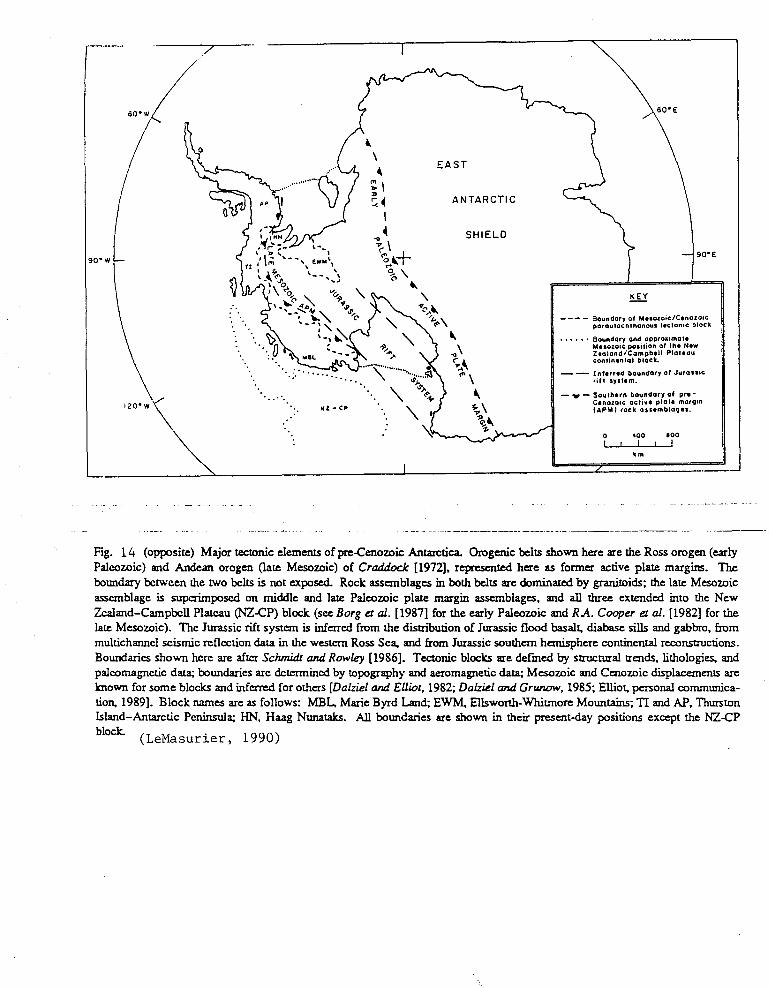
The West Antarctic rift system is a zone of lithospheric
weakness that has shown extensive volcanism and extensional
strain. Jurassic rifting parallels the line of the Late
Cretaceous breakaway of the NZ-CP block. The rift zone also
parallels the boundaries of the Late Mesozoic and Early Paleozoic
active plate margins (fig. l~). The regional extent of the West
Antarctic Rift is difficult to define due to the deceptive
arrangement of Cenozoic volcanic fields, which suggest a primary
13
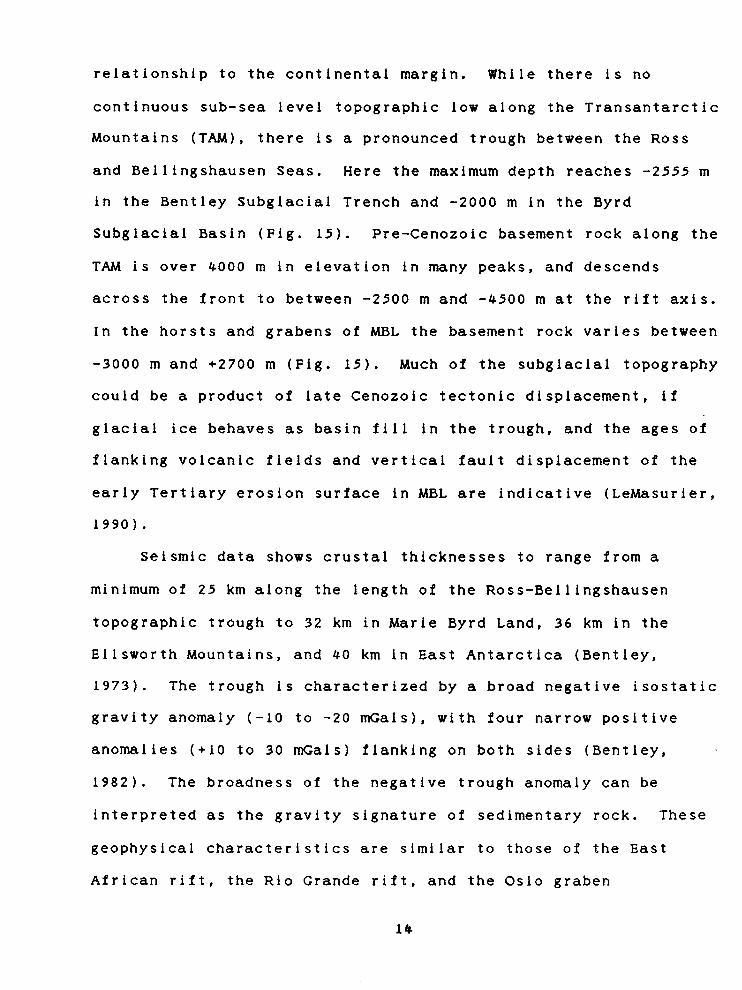
relationship to the continental margin. While there is no
continuous sub-sea level topographic low along the Transantarctic
Mountains (TAM), there is a pronounced trough between the Ross
and Bellingshausen Seas. Here the maximum depth reaches -2555 m
in the Bentley Subglacial Trench and -2000 m in the Byrd
Subglacial Basin (Fig. 15). Pre-Cenozoic basement rock along the
TAM is over ~ooo m in elevation in many peaks, and descends
across the front to between -2500 m and -~500 mat the rift axis.
In the horsts and grabens of MBL the basement rock varies between
-3000 m and +2700 m (Fig. 15). Much of the subglacial topography
could be a product of late Cenozoic tectonic displacement, if
glacial ice behaves as basin fill in the trough, and the ages of
flanking volcanic fields and vertical fault displacement of the
early Tertiary erosion surface in MBL are indicative (LeMasurier,
1990).
Seismic data shows crustal thicknesses to range from a
minimum of 25 km along the length of the Ross-Bellingshausen
topographic trough to 32 km in Marie Byrd Land, 36 km in the
Ellsworth Mountains, and ~O km in East Antarctica (Bentley,
1973). The trough is characterized by a broad negative isostatic
gravity anomaly (-10 to -20 mGals), with four narrow positive
anomalies (+10 to 30 mGals) flanking on both sides (Bentley,
1982). The broadness of the negative trough anomaly can be
interpreted as the gravity signature of sedimentary rock. These
geophysical characteristics are similar to those of the East
African rift, the Rio Grande rift, and the Oslo graben
l~

(LeMasurier, 1990).
Cenozoic volcanoes are arrayed along the flanks of the West
Antarctic rift from the western Ross Embayment to Palmer Land .
Volcanoes from the Adare Peninsula to Mount Early lie on the east
Antarctic flank, Marie Byrd Land volcanoes lie on the Pacific
flank, and volcanoes lie on both flanks in Ellsworth Land, Palmer
Land, and Alexander Island. The volcanically and structurally
asymmetrical rift has the largest volumes of basaltic and felsic
rock, as well as the longest duration of activity, in the western
Ross Embayment and Marie Byrd Land provinces. These provinces
were active in the early Miocene, late Oligocene, and possibly in
the Late Eocene. Volcanic centers are small, scattered, basaltic
and Late Miocene to Recent around the Bellingshausen Sea at the
eastern end of the rift (LeMasurier, 1990).
CENQZOIC MCMURDO VOLCANIC GRQUP
The McMurdo Volcanic Group (MVG) refers to all Cenozoic
volcanic rocks in and next to the TAM and the western Ross
Embayment (Ross Sea and Ross Ice Shelf) (Pig. 16). This group is
comparable in size with the East African Rift system and forms
one of the most extensive alkali volcanic provinces in the world
(Kyle, 1990a). The group is divided into the Hallett, Melbourne
and Erebus volcanic provinces based on spatial and tectonic
characteristics. Volcanic centers in the MVG range from >1800
km3 (Mt. Erebus) to small scoria cones. Mt. Erebus is the
15
southernmost active volcano on Earth. It has a permanent
convecting anorthoclase phonolite lava lake in a 379~ m high
summit crater. Small Strombolian type eruptions occur several
ti mes a day (Ky 1 e, 1990a) .
The MVG distribution is controlled by two tectonic elements:
1) The TAM are a major uplifted, block-faulted range extending
over 3000 km across Antarctica. 2) The Ross Embayment and a
major normal fault zone between it and the TAM. Crustal
thickness changes from ~o km beneath the TAM to 25 km beneath
McMurdo Sound and Ross Island across this fault boundary (Kyle,
1990a).
The Victoria Land basin (VLB) is the westernmost basin in
the Ross Sea. There is over 12 km of sediment in the Victoria
Land basin which extends from Ross island to Cape Washington.
The basin contains the Discovery graben and the Lee arch that
comprise the Terror Rift. The Terror rift is marked in the north
by Mount Melbourne and in the south by Mount Erebus, both of
which are currently active (Kyle, 1990a).
EREBUS VOLCANIC PROVINCE
The Erebus volcanic province (EVP), at the southern end of
Terror rift (Fig. 16), occurs at a TAM trend change and where
several TAM bounding faults might intersect. Trachytic rocks
were dominant from about 19 Ma to about lOMa, and increased
activity in the last 10 m.y. is mainly basanitic and phonolitic
16
(Kyle, 1990a). Figure 17 shows generalized ages in the EVP based
primarily on K-Ar age determinations. Each volcanic center
appears to have been active for - 1-2 m.y., with the oldest
center being around the base of Mount Morning. The oldest
centers are Gandalf and Riviera Ridges, and Mason Spur at 18.7-
12.4 Ma. A migration to the northeast is evidenced by the age
determinations for eastern Minna Bluff (11-9 Ma), northern Black
Island (10.9 Ma), central Minna Bluff (8.3-7.3 Ma) and Mount
Discovery (5.3-4.4 Ma). 4 Ma marks an increase in volcanic
activity with the formation of Mount Bird (4-3 Ma), Mount Terror
(2-0.6 Ma), Hut Point Peninsula (1.8-0.4 Ma), and Mount Erebus
(< 1 Ma) (Ky 1 e , 1 9 9 ob ) .
PREVIOUS STRUCTURAL MODELS FOR THE EREBUS VOLCANIC PROVINCE
Kyle and Cole (1974] thought that Mt. Bird, Mt. Terror, and
the Hut Point Peninsula displayed a radial pattern around Mt.
Erebus at 120 degree angles (Fig. 18). This would fit a model
for radial fractures formed in a crustal doming process. Kyle et
al. [1989] proposed that in order to supply Mt. Erebus with the
volume of phonolite erupted, it needed a mantle plume or hot spot
beneath it. The doming that created the radial symmetry
displayed on Ross Island could be due to the initiation of that
man t 1 e p 1 ume (Ky 1 e, 199 ob) .
According to Kyle and Cole (1974), Mt. Discovery also
displays a radial symmetry, and could be an early expression of
17
the Mt. Erebus mantle plume. The flanking vents of Minna Bluff,
Brown Peninsula, and Mt. Morning are at 120 degree angles to each
other with respect to Mt. Discovery (Kyle, 1990b).
Wright-Grassham (1987) thought that a lineament defined by
Mt. Morning, Mt. Discovery, Black Island, and White Island was
indicative of a transfer fault terminating the Terror rift (Fig.
19). The Discovery Volcanic Subprovince (DVS) has had continuous
volcanic activity over the last 19 Ma and is therefore the most
complete record of eruptive and tectonic styles in the MVG
(Wright-Grassham, 1987).
Figure 19 shows four structural trends that have been active
at different times. The structural trends are NNW to N-S, NW,
NE, and NNE. The NNW to N-S trends, which are not a major
control of volcanic activity, can be observed at Gandalf Ridge as
hydrothermal and alteration zones, dikes, and inferred vent
alignments (Muncy, 1979). This feature could be reflective of
axial faulting associated with the VLB and the eastern margin of
the TAM. The NW trends are dike and vent alignments along Minna
Bluff and dikes along Mason Spur. (Black Island exhibits this
trend in its oldest deposits, but to a much lesser extent.) This
trend may be controlled by upper crustal weaknesses, and would
therefore be associated with NW-trending F2 fold axes. The NE
trend is an inferred alignment of young phonolite stratovolcanoes
on Mt. Morning, Mt. Discovery and Mt. Aurora. If these three
stratovolcanoes are aligned along a transform fault, which
dextrally offsets the the TAM axial trend, then this area may
18

mark the southern limit of the VLB. The NNE trends are inferred
from vents on Mt. Morning, Mt. Discovery, and Brown Peninsula,
and indicate a NNE-trending fracture system that has been active
for 5 Ma (Wright-Grassham, 1987).
Wright-Grassham (1987) thinks that the radial symmetry
proposed by Kyle and Cole (1974) is not substantiated by current
evidence. With Minna Bluff activity occurring - 8.3-7.3 Ma,
Brown Peninsula activity occurring - 2.7-2.l Ma, Mt. Morning
activity occurring - 2.5-1 Ma, and Mt. Discovery activity
occurring - 5.1-6.6 Ma, it seems that any crustal doming occurred
too late to influence Minna Bluff volcanism.
DISCUSSION
A preliminary attempt to map the position of volcanic cones
in the Mt. Discovery region of the EVP was made. This mapping
was done using a Landsat-4 Thematic Mapper satellite image. Band
5 (a near-infrared wavelength band), which produces maximum
geologic detail and limits saturation problems (extreme
brightness) caused by ice-cover, was chosen for the Mt. Discovery
region. To sharpen linear and curvilinear features, as well as
the shapes of individual cones, the Band 5 image was filtered
with a nondirectional high-pass filter. To enhance the volcanic
features, the range of grey tones was extended by applying a
contrast stretch to the image. The image processing was carried
out by T. Wilson using the software package ERDAS ImaginQ at the
19
osu center for Mapping. When the image was enlarged to the limit
of resolution (1 pixel =ground cell of 30 m), and examined
together with aerial photography (to clarify ambiguities), it
provides an accurate spatial representation of the cone
distribution although not all of the cones could be resolved at
this scale.
Mapping and analysis of the spatial distribution of the
volcanic cones was not completed. However, this study showed
that by looking at the vent alignments associated with Mt.
Discovery, including the areas of Mt. Morning, Brown Peninsula,
and Black Island, it would be possible to reconstruct the
orientation of the average tectonic stress during the Cenozoic
evolution of the region. Using either the two-point azimuthal
method, the Hough transform method, or simple linear regression,
the resultant orientation would be reproducible and have a higher
confidence level than previous efforts determined by inspection.
This information~ when coupled with previously collected age and
petrologic data, could provide critical information for the
development of structural models in the EVP.
20
RZrBRDCBS CI~
BOSWORTH,W., STRECKER,M.R., and BLISNIUK,P.M., 1992, Integration of East African paleostress and present-day stress data: implications for continental stress field dynamics. Journal of Geophysical Research, v. 97, no. BS, p. ll,S51-11,S65.
CONNOR,C.B., CONDIT,C.D., CRUMPLER,L.S., and AUBELE,J.C., 1992, Evidence of regional structural controls on vent distribution: Springerville volcanic field, Arizona. American Geophysical Union, p. 12,349-12,359.
HAUG,G.H., STRECKER,M.R., 1995, Volcano-tectonic evolution of the Chyulu Hills and implications for the regional stress field in Kenya. Geology, v. 23, no. 2, p. 165-16S.
KYLE, P.R., and COLE,J.W., 1974, Structural control of volcanism in the McMurdo Volcanic Group, Antarctica. Bull. of Volcanol., 38, 16-25.
KYLE, P.R., MOORE,J.A., and THIRLWALL,M.F., 1989, Petrologic evolution of anorthoclase phonolite lavas at Mount Erebus, Ross Island, Antarctica, Journal of Petrology.
KYLE, P.R., 1990a, Volcanoes of the Antarctic plate and southern oceans. McMurdo Volcanic Group Western Ross Embayment. Antarctic Research Series, 4S.
KYLE, P.R., 1990, Volcanoes of the Antarctic plate and southern oceans. Erebus Volcanic Province. Antarctic Research Series, 4S.
LEMASURIER,W.E., and THOMSON,J.W., 1990, Volcanoes of the Antarctic plate and southern oceans. Antarctic Research Series, 48.
NAKAMURA,K. 1977, Volcanoes as possible indicators of tectonic stress orientation - principle and proposal. Journal of Volcanology and Geothermal Research 2. 1-16.
SUTER,M., QUINTERO,O., and JOHNSON,C.A., 1992, Active faults and state of stress in the central part of the Trans-Mexican volcanic belt, Mexico 1. The Vanta de Bravo Fault. Journal of Geophysical Research, vol. 97, no. BS, ll,9S3-11,993.
WADGE,G., CROSS,A., 19SS, Quantitative methods for detecting aligned points: an application to the volcanic vents of the

Mochoacan-Guanajuato volcanic field, Mexico. Geology, 16, 815-818.
WRIGHT-GRASSHAM, 1987, Volcanic geology, mineralogy, and petrogenesis of the Discovery Volcanic Province, Southern Victoria Land, Antarctica. PhD. Thesis, New Mexico Institute of Mining and Technology, Socorro, New Mexico. 2V. 460
ZOBACK,M.L., 1992, First- and second-order patterns of stress in the lithosphere: The world stress map project. Journal of Geophysical Research, v. 97, no. B8, p. 11,703-11,728.
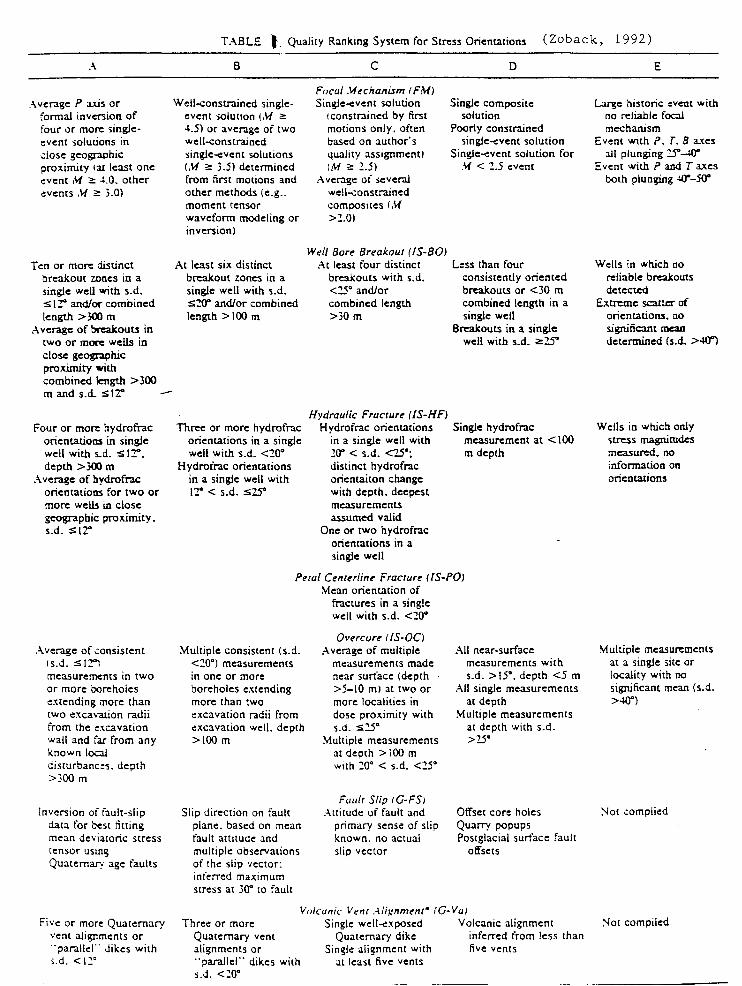
TABLE J Quality Ranking System for Stress Orientations (Zoback, 1992) ~~~~~~~~~~~~~~~~~~~~
:\
.-\ verage P ax.is or formal inversion of four or more singleevent solutions in dose geogr.iphic prox.imity laL least one event M 2: 4.0. other events M 2: 3.0)
Ten or more distinct breakout zones in a single well with s.d. s 12" and/oc combined length > 300 m
Average of brcalcouts in two or more wells in close geognphic prox.imity with combined length > 300 m and s.d. st2"
Four or more hydrofrac orientations in single well with s.d. s 12", depth >300 m
Average of bydrofrac orientations for two or more wells in close geographic prox.imity. s.d. s l2"
Average of consistent (S.d. S 12"1 measurements in two or more boreholes extending more than cwo excavation radii from the e."lcavacion wall and far from any known local disturbanc!s. depth >300 m
Inversion oi fault-slip data for best fitting mean deviacoric stress censor using Quaternary :ige faults
Five or more Quaternary vent alignments or ··parallel·· Jikes with :i.d. < 1::0
B
Well-constrained singlcevent solution (M 2:
4.5) or average of two well-constrained single-event solutions (M 2: 3.5) determined from first motions and other methods (e.g .. moment tensor waveform modeling or inversion)
At least six distinct breakout zones in a single well with s.d. sZO" and/or combined length > 100 m
Three or more hydrofrac orientations in a single well with s.d. <'.?0°
Hydrofrac orientations in a single well with 12° < s.d. S25°
c FrJcal ."fechani.sm !FM) Single-event solution
!constrained by first motions only. often based on author's quality assignment) !M 2: 2.5)
Average of several well-constrained composites !M >2.0)
Wei/ Bore Breakout ( IS-BOI
D
Single composite solution
Poorly constrained single-event solution
Single-event solution for M < 1.5 event
At least four distinct Less than four breakouts with s.d. consistently oriented <25° and/or breakouts or <JO m combined length combined length in a > 30 m single well
Hydraulic Frucrure (IS-HF)
Breakouts in a single well with s.d. 2:25°
Hydrofrac orientations Single hydrofrac in a single well with measurement at <100 10" < s.d. <2.5°: m depth distinct hydrofrac orientaiton change with depth. deepest measurements assumed valid
One or two hydrofrac orientations in a single well
Peral Centerline Fracture (IS-PO> Mean orientation of
fractures in a single
Multiple consistent (s.d. <'.?O") measurements in one or more boreholes e.'ttending more than two ex.cavation radii from ex.cavation well. depth >100 m
Slip direction on fault plane. based on mean fault attitude and multiple observations of the slip vector: inferred maximum stress at 30" co fault
well with s.d. <20"
Overcure r/S-OC) Average of multiple
measurements made near surface (depth >5-10 ml at two or more localities in dose pro:ilimity with s.d. s'.?5°
Multiple measurements at depth > 100 m with ::o· < s.d. <'.?5°
F"ult Slip tG-FSi Attitude of fault and
primary sense of slip known. no actual slip vector
All near-surface measurements with s.d. > 15°. depth <5 m
All single measurements at depth
Multiple measurements at depth with s.d. >2.5·
Offset core holes Quarry popups Poscglacial surface fault
offsets
Vokunic ~'11nr Aiii:nment• IG-Va1 Three: or more
Quaternary vent alignments or ··parallel"" dikes with s.d. <?0°
Single well-<:xposed Volcanic alignment Quaternary dike inferred from less than
Single alignment with five vents at least five vents
E
Large historic .:vent with no n::liable focal mechanism
Event wtth P. T. B a.'tes all plunging :z.5"-UJ"
Event wtth P and Taxes both plunging ~ -50"
Wells in which no n::liable brea.lcouts detected
Extreme scatter of orientations. ao significant mc:a.n determined (s.d. >40")
Wells in which only stress magnitudes measured. no information on orientations
Multiple measurements at a single site or locality with no significant mean (s.d. >40")
Not complied
Noc compiled
45• o·
I ~ 45
• p
/
100·
45•
·y
--~
-)
0 I
..... ...
/ ,_, '\.
I -J
-h
t,,/ _I
______
_ · 1·
· J
. .-:
..d[_
,_
,~··
'.....
--
~~--»Jl
45•
13
5'
90•
45
• o·
45
' 9
0•
135'
L .
' · :.
-r:w·
~;i~:;,·
, :')
.:}1
-·4
000
.3()
()()
·2
000
·100
0 0
1000
20
00
Fig.
I.
Wm
Id s
lrcs
s m
ap:
SI/
mu
ori
enta
tion
s pl
otte
d on
a b
ase
of
aver
age
topo
grap
hy.
Lin
e le
ngth
s o
f da
ta p
ropo
rtio
nal
lo q
uali
ty (
A-C
1f
ola
plol
lcJ,
sec
Tuh
lc 2
). S
ee P
late
1 f
ur m
ore
deta
il,
incl
udin
g ty
pe o
f ln
Jica
tor
and
stre
ss r
egim
e fu
r in
divi
dual
poi
nts.
(Zo
back
, 1
99
2)
16
0'
~~~--.~~~~~~~-....-~~~~~~--~~~~~~~----r-~~~~~
(.)
j::
L>
Q:
q ,_ ~
q
0 o~
' c,"
.._lb
/
q'o
r'
I
0
"-.... <v
v"V-
q
90
• w
1--
----
----
---
Pel
tr I
h.
Am
un
du
n
Se
a
\ \ \ \ \
\
'° .. , ..
~
A t<\ 0
'(
("I
o,.. 0
1-"'
.....
c;. ~
...... ~
o ·~
Ml
('Ito
11
!llp
lt
~<
' ' ' '
' "'...1
-t,.
., 'fl G'1
t-
' ' '
.......
' 15
0° w
....
Fig
ure
2
(LeM
asu
rier
, 19
90)
_,.
_,.
We
dd
ell
Se
a
........
. ..... ..
... _
Ro
ss
Se
a
EA
ST
'' 4
,,
...... ''o
,.
'.,f
1,c- ' ('.
,,,
. '"/. ~ \
--;-----------+-----------l----JJ.-------~90°E
AN
TA
RC
TIC
0
/ _,.
/
_,.
o• -
KEY
K
ey v
olc
an
ic
cen
lers
of
Qu
ate
rna
ry
(fille
d)
an
d o
lde
r (o
pe
n)
a11e
s.
Arr
ow
s in
dlc
ole
d
ire
cti
on
s o
f yo
un11
in1J
.
~
Co
nve
rQe
nl
pla
le b
ou
nd
ary
.
~
Div
er11
enl
pla
te b
ou
nd
ary
wit
h
tra
nsf
orm
s.
-r-i-,-
Infe
rre
d b
ou
nd
ary
of
lhe
Wes
t A
nla
rcllc rill
syst
em
.
~
Fa
ult
, h
ach
ure
d w
he
re n
orm
al
lau
ll d
isp
lace
me
nt
is k
no
wn
o
r in
lerr
e d
.
0 4
00
8
00
L ...
. l.
-l .
I
_J
km
150°Elb:=======;:=====================~
--·~~~~~~~~~~~~~~~~~~~~~~~~~~~~--,
I
Fig.3. Diagram showing the radial dikes and.flank volcanoes of a polygenetic volcano undE a differential horizontal stress. The zone of flank volcanoes corresponds to the trend of radial dike concentration; hence to the trend of maximum compression of the horizontal component of the ambient stress. (After Nakamura, 1976.) (Nakamura, 1977)
<:::; Q
""' / I
A
. Fig. Lt ~dealized horizontal cross-section of a conduit of a polygenetic volcano (central plutomc mass) and radial dikes (Nakamura, 1969). A. Perfectly radial dikes under uniform stress. B. Deformed radial dikes under a differential horizontal stress. (Nakamura, 1977)
A ,.
I ti B I e I f' ~ I
I I
I • • I I
; • /1 /
~ ; • jt I /
~ • ~ I • I , I. I I
I I I /
I I
,~ I I
I
I
I~ I ;...(
~ I I I
'J I
I
I I
I I I
I - ~ I I
,/ 1f' ,_ 3 ~ ~
I
4~ 2 ..........
Fig. S The angular relationship between the trends of a volcanic belt and zones of flank craters. A and Bare idealized situations under extensional and contractional tectonic stres fields. A pair of solid arrows indicates the tensional stress (A) and the compressional stress {B) exerted on the volcanic belt. 1 = a normal fault; 2 = a f'is.mre of regional fissure eruptic 3 =a strik~slip fault; 4= a polygenetic volcano with a summit crater (dot) and a linear zone of flank eruptions (ruled area). (After Nakamura, 197 4.)
(Nakamura, 1977)

';:;~ 104
I 103
I
102
"~c,< ~ "- ~aco .
a1 :
I
101 w
Gr-- Co . -a 6 \.. _,.,.,. . . '\, :· '· ......._-e,.;-\....._ - ~ Chapala , . ':., ~ : ~ G r~.ben. ~ · /4 .:.I···-~ ....
. .
... . . ~ kl . .. .. -: . . (
•\ . '"' - - -=· ~ .... ,_.> L.Chapala--···· ~ ..... ~::: ·, : .- ....._ :. LCultzeo I ··.·· :· .. · -.r~
f ., . .- : .. ,.... . .. . '."'". ·~~ ...
\ \ ....... ~.,~ .... .. .:~~.. . . . .. ~.. -: ~. -. ., '· :· r. .. ::'~·..::. .t; .. :-,·~' ....
Co I ima ( =!;~.:.:.-,,. ... :~:e~,,.:· \G , .. ,,. .. . . _....,. . ._,:., raben -:~ ~~~.; ... :.~: -:,:::.: .. ....
) .... ·.• ·."" . . . ~ •,,u.' ... ;r. • ...... ,, -:: '-.-<~~ •
,. -. - •• - • ·, '?__~~·
I \ \ • '?':i.:' ' :·~ : L': • . . . , , ' . . --~
\ ·• ~· ·• • .. ,.. ... > . . . . . -' J · .... , -
-.... ____ ... _______ ;,:-::-::-- ....... _ .. .,.. __ - -· ... _____ ,.._ .. .,.,..._.. .. .!~ I
I
21-
20-
19-
18-N
Figure 6 Michoacan-Guanajuato volcanic field (MGVF; black dots) and its regional setting. Trend of subduction zone that gives rise lo volcanism is shown in southwest Principal normalfault scarps shown are simplified from Allan (1986) and Hasenaka and Carmichael (1985b). Two principal lakes, Chapala (in west) and Cuitzeo (in east), are within weakly defined east-west graben that crosses central part of MGVF. (Wadge and Cross, 1988)

20.0 N
19.0 N
. , ~·
. . " . . .. . .
' . . . . . ·~·
"'I .,,:':' "
···~:~ ·. 7 ~ . . . .. J•. •. • • I =· • . ·. ....
... ·i. . ... . ...: . ·- . . .--" . • • • 'II\ . . . . .
• .. .
. . ..• :, • ..
••
I • -.. . --~ . '· :.. . .. ·,· . \..,.. . .. ·- . . .,.- .. I
.. . .. "-. ~
,,, ,.., . . :--- ..... ,, ·. . : . : ... r.- .. , "'* •• • ._ • • ·4>-- • • .,.- ;.s.--:.••• t11• I • • • . .... . '.,,, 'I • ... •• .. , . . ..... -~
.,,,,,_•., ~- •'- • .,,. I ·r.~ ~ • .4111'. ... • • •·
I
·~ . . . r: ... :.... .. •
'-• • • I • '• • • • ._ • :. '- .. . . ' .· .. ·--: ... ~· .,. .. .... . .. ,. •-'. • • I•
... ~ .. :·)~·~ ..... ;;~· . \: .\ .. ,. ..... ;; . . ' . ,. .. \.:' J'"f! <·., ... " ... v:
• I • . I \ ;
:< : ,
1• I • l \ •• , . ~ .. · : '(. . zl ...: • ;• • • • ,,. > .. /.../.
~----·--·
102.0W
.-
• ••
-. •
.... .. • ..
• ..
... ..
... .. • """"' "P • . -• .
----. ..
101.0W
I
Figure; Map of Michoacan-Guanajuato volcanic field as point field of 978 volcanic vent locations. Circle encompasses subset of 778 points. Regional grid used in two-point azimuth method is shown ":Jy longer tick marks at margin. (Wadge and Cross, 1988)

! !
\
I i l I I I
~ shmtn direc:ron from·
,,Jifl' ·1olcanic alignments
. 0 ::uaternary volcanic rocks and eructive centers
/Fig. 2
Chyulu Hills
100 km
o·
2·s )
/~ ~
) INOIAN
OCEAN
Figure _'l Major fau.lts of Kenya Rift and distribution of Quaternary volcanic rocks and aligned eruptive centers on eastern rift shoulder (redrawn from Saggerson, 1963; Okelo et al., 1988; Strecker and Bosworth, 1991). Inset shows eruptive centers in Chyulu Hills. Open ar-
. rows show regional Sh . min position prevailing in Kenya until mid-Pleistocene time. Solid arrows show mid-Pleistocene to Holocene S,,m•n positions. (Haug and Strecker, 1995)
N
'. -·"··, . . ..,. -';~ ...
. , ' '~ ~- .... ~ . ......_ N
'·./ :: l 22
( 1 ) Circle = JO .)o s
/--..... .. ,
\ N = 105
(3)'~--// Circle= 21 %
"' 4 "' "' "' 4
"' "' "' "' "' "'"'
"' "' "' "'
EJ Group 5
E::J Group 4
CJ Group 3
e-.~N Group 2 (ii - Group 1 :::l 0
c:J Basement rocks
... Eruptive centers
~ Normal faults
Figure ta Distribution of aligned eruptive centers, lava-flow units, and normal faults in northern Chyulu Hills. Symmetric rose diagrams display joint distribution in Pan-African basement in area north of Emali (1), north of Simba (2)i north of Kiboko (3), and near Merueshi (4). (haug and Strecker, 1995)

0 N ~
z
.··'
Basanite /
_)(i< Trachy-./ basalt Foidite
-
• x 4
• • -Basalt ' x
·- x ~ ~ x
· .. : ~] (j :
3 I ............................ :-; .. ~ Picrobasalt
2,__~---------~~~--~---~---...._~~-'-~~ 35 '-i7 39 4 L 43 45 47 49 51
Si02 (wt 0/o)
x Group 5 Holocene - Group 4
i c Group 3 • Group 2 • Group 1 {1.4 Ma)
Figure tl Total alkali and silica classification diagram showing increase in silica content in progressively younger flows in Chyulu Hills. (Haug and Strecker, 1995)
1 1
4 ()
km
I I \ \
N ~
Fig.
1
1
The
Spr
inge
rvil
le v
olca
nic
fiel
d is
loc
ated
alo
ng t
he s
outh
ern
mar
gin
of
the
Col
orad
o P
late
au,
in c
entr
al e
ast
Ari
zona
. P
hysi
ogra
phic
pro
vinc
es o
f th
e ar
ea d
elin
eate
d.
The
Mog
ollo
n R
im i
s a
topo
grap
hic
esca
rpm
ent
whi
ch d
efin
es
the
boun
dary
bet
wee
n th
e T
rans
itio
n Z
one
and
the
Col
orad
o P
late
au,
sout
h o
f th
e SV
F.
Sha
ded
area
s in
dica
te v
olca
nic
fiel
ds
less
tha
n 5
m.y
. ol
d, o
utli
ned
area
s in
dica
te v
olca
nic
fiel
ds S
to
16 m
.y.
old
[fro
m W
olfe
et
al.,
1983
).
The
Jem
ez. l
inea
men
t [A
ldri
ch a
nd
La
ug
hli
n,
1984
) is
tho
ught
to
be c
ompr
ised
of
volc
anic
fie
lds
and
asso
ciat
ed s
truc
ture
s ex
tend
ing
from
the
Je
mez
vol
cani
c fi
eld
to t
he southwes~ t
hrou
gh t
he
Mm
mt
Tay
lor,
Zun
i-B
ande
ra,
and
Spr
inge
rvil
le f
ield
s.
(Co
nn
or
et
al.
, 1
99
2)

30 E
tAa
rio
n I
.
90
E
18
0
r..e
, " M
cM
urd
o \'o:ca"'~
Gro
c11J
-N
este
r<'
Rv~s tn
·.CJ
a~·n
·e~'
8 M
ari
e 8
y•d
La
"C
c A
lexa
no
e•
1s:a
nd
Pa
lme
• La
nd
an
o
E11
swor
tti L
a•1d
D
·Gra
ha
m L
an
o a
nd
Sou
lt>
She
r1an
o 1s
1and
s
E
So
ult•
Sa
nd
wic
h Island~
F
Oce
an
ic 1
slan
os o
n t
he
An
rarc
hc
pla
te
G
Suo
anra
rcr1
c vo
ica
no
es
of
the
Pac
1hc
pla
te
~
L 1m
1rs
of
volc
an
ic r
eg
ion
s d
esc
rib
ed
1n
this
vo
lum
e
CJ]
An
tarc
tic
pla
te o
cea
nic
cru
st
~ D
1ver
gen1
pla
le b
ou
nd
ary
Tra
nsf
orm
pla
te b
ou
nd
ary
~
Co
nve
rge
nt
pla
te b
ou
nd
ary
DJ
Co
nti
ne
nta
l ar
eas
ad1a
cent
lo
the
A
nla
rcti
c p
lale
c;J
Ice
sh
elv
es
with
ice
fro
nt
0 20
00
4000
km
J w
tn
omso
'"·
19
87
Fig
ure
13
(L
eMas
uri
er,
1990
)
9o•w
.... ·.· ...
12o•w NZ - CP
SO"E
90"E
- - - - Boundary of Meso.zoic/Cenozo1c parautochthonou1 teclon1c block
• • • • ~ • Boundary and opproumat1 Mesozoic po11tion of lh• New Z101and/Campb1ll Plateau conrinenlal block.
- - Inferrtd boundary of Jurassic nft system.
- y - Southern boundary of pre -Cenozoic octi'f't plate mor91n (APt.0 rock assemblaQtS.
0 I
400 I
km
800 I
Fig. 14 (opposite) Major tectonic elements of pre-Cenozoic Antarctica. Orogenic belts shown here are the Ross orogen (early Paleozoic) and Andean orogen (late Mesozoic) of Craddodc [1972], represented here as former active plate margins. The boundary between the two belts is not exposed. Rock assemblages in both belts are dominated by granitoids; the late Mesozoic assemblage is superimposed on middle and late Paleozoic plate margin assemblages, and all three extended into the New Zealand-Campbell Plateau (NZ-CP) block (see Borg el al. [1987] for the early Paleozoic and RA. Cooper el al. (1982] for the late Mesozoic). The Jurassic rift system is inferred from the distnbution of Jurassic flood basalt, diabase sills and gabbro, from multichannel seismic reflection data. in the western Ross Sea, and from Jurassic southern hemisphere continental reconstructions. Boundaries shown here are after Schmidt and Rowley [1986]. Tectonic blocks are defmed by structural trends, lithologies, and palcomagnctic data; boundaries arc determined by topography and aeromagnetic data; Mesozoic and Cenozoic displacements are known for some blocks and inferred for others [Dalziel and Elliot, 1982; Dalziel and Grunow, 1985; Elliot, personal communication, 1989]. Block names are as follows: MBL. Marie Byrd Land; EWM. Ellsworth-Whitmore Mountains; TI and AP, Thurston Island-Antarctic Peninsula; HN, Haag Nunataks. All boundaries are shown in their present-day positions except the NZ-CP block. . ) (LeMasurier, 1990

12 VOLCANOES OF THE ANT AR enc PLATE •••
Fig. 15 Generalized subglacial bedrock topography of Antarctica. showing the deep subglacial basins of West Antarctica (the area left, or east, of the Transantarctic Mountains) that help define the position of the West Antarctic rift system. The Pacific-Antarctic ridge, Southeast Indian rise, and New Zealand-Campbell Plateau block are shown for comparative and orientation purposes, but bedrock depth symbols are not extended to these regions. Abbreviations are as follows: MI, Macquarie Island; BL Balleny Islands; RI, Ross Island; SL Siple Island; BSB, Byrd Subglacial Basin; HM, Hudson Mountains; and EM, Ellsworth Mountains; all are shown for orientation pwposes when comparing this diagram with other diagrams in this volume. Adapted from American Geographical Society [1970].
(LeMasurier, 1990)
o•
_,:dE\~~~~[[[[[[[[\UE\iii::::::: ....
-.... --· D [23 illIT2l
Seo level
Bothymetric contours at - 1000 m and - 3000 m Bed rock above seo level on the Antarctic continent
Bedrock btTween seo level and - IOOOm Bedrock between -1000m and - 3000m

20
Fig.
I 6
S
impl
ifie
d te
cton
ic
map
of
the
wes
tern
Ros
s E
m
baym
ent,
base
d on
w
ork
by
Kyl
e a
nd
Col
e [1
974]
, C
oope
r .
et
al.
[198
7],
Gai
r et
al
. [1
969]
, W
arre
n [1
969)
, an
d W
righ
t-G
rass
ham
[1
987]
, sh
owin
g th
~ di
stri
buti
on
of
McM
urdo
V
olca
nic
Gro
up
rock
s al
ong
the
wes
tern
mar
gi
n of
the
Ros
s E
mba
ymen
t.
(Ky
le,
l 9
90
a)
VO
LCA
NO
ES O
F TH
B A
NT
AR
CT
IC P
LATE
McM
UR
DO
S
OU
ND
0 2
00
11.IL
OM
E T
ER
S
15
0•
16
0•
McM
urd
o
Vo
lca
nic
G
rou
p
• su
bm
ari
ne
vo
lca
no
* a
ctiv
e
volc
an
o
RO
SS
C
EN
TR
AL
T
RO
UG
H
ICE
S
HE
LF
110•
1e
o•
EA
ST
ER
N
BA
SIN
11
0•
7

0 I
774$
'=u Beaufort Island
ROSS km SO 3-4Ma
I
Mc Murdo Sound
• Ciras 2
EREBUS VOLCANIC PROVINCE
110·
Fig. l , Generalized ages for the major volcanic centers within the Ereb~ volcanic provin~ based mainly on KAr age detamin.ations of surficial samples listed in the individual vo1C3ll0 descripcioris. (Kyle, l 990b)

/
78°
/ /
v A ,.·.::.: ..... · ~ ·.·
L A N::.o··. ·.'8 A S
·-
I \ \ \ u\tl
u\t> \ \ \ I I I I
I
\
. ·:·T·e·rr()r . \
· Rift ., - .·· ;, . ~
'. ' .. ·\
\ ·.,.. ": •.. :/ 8~10f1 '» \ \· .. ,:_. . ~~7° . ·.··
Mc Murdo Sound
165°
, .. :in111.11n f\ 1s1ana V -\
\
N
ROSS
SEA
' ' 11c·
\ \
-\ I I \
\ ~
'
77"
, ...................... ..
re•
- - - 1n'f.,-r•d faun ..... -- .... lriferred roo1a1
symmetry o~ ven•s.
0 ""' ~o
110·
Fig. \ i Generaliz.cd tectonic map of Erebus volcanic province, compiled from Warren [1969]. Cooper a al. [1987]. Wright-Grassham [1987]. and Kyle (unpublished observations, 1987).
(Kyle, 1990b)

r:::::
:1
E3
0 . •
Gro
up I
l (<
7 m
y)
I I G
roup
II
(7-l
lmy)
[] G
rou
pI
~ U
ndif
fere
ntia
ted
base
men
t ro
cks
0 G
roup
II
cin
der
con
e an
d sm
all
stra
tov
olc
ano
Bro
wn
Pen
insu
la
Con
es
Wln
dsco
up
Blu
ff
10
20
3
0 R
oss
Ice
S
he
lf
Ros
s le
e S
helf
40
km
......... M
inna
H
ook
1 N I
Smal
l G
roup
II
troc
hyte
or
ph
anol
ite
dom
e
Med
ium
to
la
rge
Gro
up ll
stra
tov
olc
on
o
---
Fau
lt
or
dyke
, do
shed
w
here
in
f err
ed
-•-
Pro
po
sed
T
rans
form
---V
en
t a
lign
me
nts
Fig
ure
\q
Stru~tural
asp
ects
o
f th
e
DV
S.
At M~son
Sp
ur,
R
ivie
ra
Rid
ge,
an
d
Gan
dal
f R
idq
e str
uctu
ral
ltre
nd
s are
g
en
era
lized
an
d
do
n
ot
rep
rese
nt
sp
ecif
ic
featu
res.
(W
rig
ht-
Gra
ssh
am,
19
87
)