senior service college united states army service college united states army distribution statement...
TRANSCRIPT

U.S. Army War College, Carlisle Barracks, PA 17013-5050
This SSCFP is submitted in partial fulfillment of therequirements imposed on Senior Service CollegeFellows. The views expressed in this student academicresearch paper are those of the author and do notreflect the official policy or position of the Departmentof the Army, Department of Defense, or the U.S.Government.
MAKING STRATEGIC DECISIONSIN DOD ACQUISITION USING
EARNED VALUE MANAGEMENT
BY
LIEUTENANT COLONEL DOUGLAS B. BUSHEYUnited States Army
Seni
orSe
rvic
eCo
llege
DISTRIBUTION STATEMENT A:Approved for Public Release.
Distribution is Unlimited.
USAWC CLASS OF 2007


REPORT DOCUMENTATION PAGEForm Approved
OMB No. 0704-0188Public reporting burden for this collection of information is estimated to average 1 hour per response, including the time for reviewing instructions, searching existing data sources, gathering and maintaining thedata needed, and completing and reviewing this collection of information. Send comments regarding this burden estimate or any other aspect of this collection of information, including suggestions for reducingthis burden to Department of Defense, Washington Headquarters Services, Directorate for Information Operations and Reports (0704-0188), 1215 Jefferson Davis Highway, Suite 1204, Arlington, VA 22202-4302. Respondents should be aware that notwithstanding any other provision of law, no person shall be subject to any penalty for failing to comply with a collection of information if it does not display a currentlyvalid OMB control number. PLEASE DO NOT RETURN YOUR FORM TO THE ABOVE ADDRESS.
1. REPORT DATE (DD-MM-YYYY)
28-02-20072. REPORT TYPE
Civilian Research Paper3. DATES COVERED (From - To)
4. TITLE AND SUBTITLE 5a. CONTRACT NUMBER
Making Strategic Decisions in DoD Acquisition Using Earned
5b. GRANT NUMBER
Value Management 5c. PROGRAM ELEMENT NUMBER
6. AUTHOR(S) 5d. PROJECT NUMBER
LTC Douglas B. Bushey, USA 5e. TASK NUMBER
5f. WORK UNIT NUMBER
7. PERFORMING ORGANIZATION NAME(S) AND ADDRESS(ES) 8. PERFORMING ORGANIZATION REPORTNUMBER
The Institute of Advanced TechnologyThe University of Texas at Austin3925 West Braker Lane, Suite 400Austin, Texas 78759-5316
IAT.R0471
9. SPONSORING / MONITORING AGENCY NAME(S) AND ADDRESS(ES) 10. SPONSOR/MONITOR’S ACRONYM(S)
Mr. Robert RiffleThe University of Texas at Austin
3925 West Braker Lane, Suite 400 11. SPONSOR/MONITOR’S REPORT
Austin, Texas 78759-5316 NUMBER(S)
IAT.R047112. DISTRIBUTION / AVAILABILITY STATEMENT
DISTRIBUTION A: UNLIMITED
13. SUPPLEMENTARY NOTESThe views of the academic research paper are those of the author and do not necessarily reflect theofficial policy or position of the U.S. Government, the Department of Defense, or any of its agencies.
14. ABSTRACTThis paper provides Department of Defense (DoD) Acquisition officials a guide for using earned value management (EVM) to make strategic decisions. Today’s militaryforces face a great variety of threats with unprecedented complexities. To deal with these threats, DoD is pursuing a bold strategy to transform itself into a more agile andlethal force while fighting the war on terrorism. This transformation, in concert with fighting a global war, comes at an expense. The fiscal year (FY) 07 defense budget willexceed $513 billion this year; if historical trends continue, around 33% of these dollars will go to weapon system acquisitions. For more than 35 years, DoD has used EVM toensure the efficient and effective use of these dollars. Yet despite the fact that this project management process has been around for so long, DoD still struggles to keepweapon system projects within budget. In the first quarter of FY06, 40 programs reported Nunn-McCurdy unit-cost breaches, with 25 of these reporting greater than 50% unit-cost growth.This paper examines how DoD can better use EVM to make strategic decisions on defense programs. The first portion of this paper briefly describes earned value and theprocess DoD uses to validate a contractor’s system. With this background, the paper describes how a valuable resource—the Defense Contract Management Agency(DCMA)—can assist project managers (PMs) with using EVM to make strategic program decisions. This section is dedicated to program EVM analysis methods used todevelop pieces of the puzzle that predict answers to very important program management questions. The research methodology includes analysis of three major defenseprogram EVM systems and data, comprehensive literature review of EVM in acquisition management, and consultation with PMs, DCMA personnel, and DoD contractors.This paper will not cover the basics of EVM. Rather, it concentrates on the use of this concept as a predictive tool to identify root causes of problems, develop solutions earlyin the acquisition lifecycle, and make strategic program decisions. This paper includes questions that acquisition officials can use to shape EVM and the data analysis andproducts that can be expected. Finally, it concludes with recommendations for maximizing the use of EVM to make strategic decisions.
15. SUBJECT TERMS
Earned Value Management, Acquisition Reform, Acquisition Guidelines, Project Management,Strategic Management, Major Defense Acquisition Program
16. SECURITY CLASSIFICATION OF: 17. LIMITATIONOF ABSTRACT
18. NUMBEROF PAGES
19a. NAME OF RESPONSIBLE PERSON
a. REPORT
UNCLASSIFEDb. ABSTRACT
SARc. THIS PAGE
UNCLASSIFED UNLIMITED 54
19b. TELEPHONE NUMBER (include areacode)
Standard Form 298 (Rev. 8-98)Prescribed by ANSI Std. Z39.18


IAT.R 0471
CIVILIAN RESEARCH PROJECT
MAKING STRATEGIC DECISIONS IN DOD ACQUISITION USING EARNED VALUEMANAGEMENT
by
Lieutenant Colonel Douglas B. BusheyUnited States Army
Mr. Robert RiffleProgram Adviser
The University of Texas at Austin
Disclaimer
The views expressed in the academic research paper are those of the author and do notnecessarily reflect the official policy or position of the US Government, the Department ofDefense, or any of its agencies.
U.S. Army War CollegeCARLISLE BARRACKS, PENNSYLVANIA 17013

IAT.R 0471

IAT.R 0471
ABSTRACT
AUTHOR: LTC Douglas B. Bushey
TITLE: Making Strategic Decisions in DoD Acquisition using Earned Value Management
FORMAT: Civilian Research Project
DATE: 1 December 2006 WORD COUNT: 14,795 PAGES: 54
CLASSIFICATION: Unclassified
This paper provides Department of Defense (DoD) Acquisition officials a guide for using
earned value management (EVM) to make strategic decisions. Today’s military forces face a
great variety of threats with unprecedented complexities. To deal with these threats, DoD is
pursuing a bold strategy to transform itself into a more agile and lethal force while fighting the
war on terrorism. This transformation, in concert with fighting a global war, comes at an
expense. The fiscal year (FY) 07 defense budget will exceed $513 billion this year; if historical
trends continue, around 33% of these dollars will go to weapon system acquisitions. For more
than 35 years, DoD has used EVM to ensure the efficient and effective use of these dollars. Yet
despite the fact that this project management process has been around for so long, DoD still
struggles to keep weapon system projects within budget. In the first quarter of FY06, 40
programs reported Nunn-McCurdy unit-cost breaches, with 25 of these reporting greater than
50% unit-cost growth.
This paper examines how DoD can better use EVM to make strategic decisions on
defense programs. The first portion of this paper briefly describes earned value and the process
DoD uses to validate a contractor’s system. With this background, the paper describes how a
valuable resource—the Defense Contract Management Agency (DCMA)—can assist project
managers (PMs) with using EVM to make strategic program decisions. This section is dedicated
to program EVM analysis methods used to develop pieces of the puzzle that predict answers to
very important program management questions. The research methodology includes analysis of
three major defense program EVM systems and data, comprehensive literature review of EVM in
acquisition management, and consultation with PMs, DCMA personnel, and DoD contractors.
This paper will not cover the basics of EVM. Rather, it concentrates on the use of this concept as
a predictive tool to identify root causes of problems, develop solutions early in the acquisition
lifecycle, and make strategic program decisions. This paper includes questions that acquisition

IAT.R 0471
officials can use to shape EVM and the data analysis and products that can be expected. Finally,
it concludes with recommendations for maximizing the use of EVM to make strategic decisions.

IAT.R 0471
TABLE OF CONTENTS
Introduction 1
Background ..........................................................................................................................2
Structure of the Paper...........................................................................................................3
Introduction to Earned Value Management 4
History..................................................................................................................................4
Current Requirements for EVMS ........................................................................................5
Benefits of EVM..................................................................................................................6
DoD Validation of an Earned Value Management System .................................................7
Framework for Analyzing EVM Data 9
Earned Value Management Analysis Framework .............................................................10
Maintenance of the Earned Value Management System ...................................................12
Analyzing Earned Value Management Data......................................................................13
Types of EVM Analysis.............................................................................................. 14
Assessing the Overall Health of a Program: Cumulative Cost and SchedulePerformance ................................................................................................................ 16
Identifying Root Causes of Issues............................................................................... 19
Developing Solutions.................................................................................................. 30
Analysis of Required Resources ................................................................................. 37
Scoping Earned Value Management Efforts: Streamlining Cost, Schedule, andPerformance Analysis to Significant Work Packages .......................................................42
Conclusions and Recommendations 46
Tailor EVM Efforts............................................................................................................47
Make DCMA Part of the Team..........................................................................................48
Make Timely Decisions .....................................................................................................48
Appendix A: Leader’s Quick Reference Guide to EVM 49
References 53

IAT.R 0471

IAT.R 0471
List of Figures and Tables
Figure 1. EVM analysis framework structure............................................................................... 11
Figure 2. Program CPI/SPI trends by month. ............................................................................... 18
Figure 3. Program Cost and Schedule Variance (CV/SV)............................................................ 19
Figure 4. Functional percentage of program cost variance........................................................... 21
Figure 5. Program CV by function ............................................................................................... 22
Figure 6. CPI by function.............................................................................................................. 23
Figure 7. Function percent of program SV ................................................................................... 23
Figure 8. CPI by IPT..................................................................................................................... 25
Figure 9. FU IPT CPI by group .................................................................................................... 26
Figure 10. M/LP/C CPI by group ................................................................................................. 26
Figure 11. Subcontractor cost/schedule variance.......................................................................... 28
Figure 12. Subcontractor C1 SPI and CPI .................................................................................... 29
Figure 13. WBS percent complete and percent spent ................................................................... 32
Figure 14. Cost and schedule variance percentage by WBS ........................................................ 33
Figure 15. Estimates at completion............................................................................................... 36
Figure 16. CPI and SPI ................................................................................................................. 37
Figure 17. Remaining billing plan ................................................................................................ 39
Figure 18. Staffing profile............................................................................................................. 40
Figure 19. Engineer staffing profile.............................................................................................. 41
Figure 20. Critical WBS element analysis of cost, schedule and performance ............................ 45
Figure 21. EVM framework structure........................................................................................... 47
Table 1. Evaluation of WBS Elements Down to the Fourth Level............................................... 43

IAT.R 0471

IAT.R 0471
ACKNOWLEDGMENTS
This paper is the result of the author’s Army War College Fellowship at the Institute for
Advanced Technology (IAT) at The University of Texas at Austin. I would like to thank Mr. Bob
Riffle, the IAT editing staff, and the IAT resource staff for their guidance and invaluable
assistance. Finally, I would like to thank my wife and family for having the patience and
understanding to allow me to conduct this research.

IAT.R 0471

IAT.R 0471
MAKING STRATEGIC DECISION IN DOD ACQUISTION USING EARNED VALUE
MANAGEMENT
Introduction
Today’s military forces face a great variety of threats with unprecedented complexities.
To defeat these threats, the US military is prosecuting the global war on terrorism (GWOT)
while at the same time transforming forces using revolutionary technologies and doctrine to
position itself for the future. These strategies put a strain on dwindling defense dollars and scarce
resources. As a result, there is continuous pressure to cut, change, or modify major defense
acquisition programs. These pressures should not lead to strategic decisions that are knee-jerk
budget reactions. Strategic decisions of this magnitude should be based on timely, objective data.
This research paper provides leaders with a guide for making strategic decisions on major
defense programs using earned value management (EVM) as a base. It is not EVM 101, nor is it
a textbook description of the algorithms and formulas used for EVM analysis—there are many
good publications and articles discussing these basics. This paper describes the most
underutilized, but arguably the most important, aspect of EVM—management. It provides a
framework to focus earned value efforts and describes what types of analysis are available for
leaders.
The target audiences for this handbook are the project managers (PMs) and program
executive officers (PEOs) who manage strategic programs. They are the leaders who must
galvanize numerous efforts, including EVM, to ensure they can deliver a mature and reliable
weapon system, on time and at budget. To accomplish this mission, PMs must team their
personnel with DoD contractors and other DoD agencies to achieve success. EVM is a great
example of this need for teamwork. PMs must work together with contractors and other agencies
to gather and analyze EV data to help manage programs. The paper concentrates on the added
value the Defense Contract Management Agency (DCMA) brings to this team. From the author’s
experience as a product manager and DCMA commander, it appears that DCMA is often
overlooked and underutilized in this process. The intent of this framework is to describe how
PMs can concentrate DCMA’s EV efforts. It gives examples of the types of analysis that DCMA
can provide. Readers must understand that, although this paper is written from a DCMA
perspective, in reality, PMs must synchronize all efforts of EVM to maximize results. Leaders at

IAT.R 0471
2
the DoD level need to ensure that good and effective management systems, such as the approach
this paper lays out, are being used to actively manage DoD programs and that decision makers
are provided with meaningful results from these tools to help them make decisions.
Background
Since the terrorist attacks on September 11, 2001, the US military has been busy fighting
a global war, defeating the remnants of the Taliban in Afghanistan, and assisting in Iraq’s fight
for democracy against a violent insurgency. There seems to be little prospect of being relieved of
these responsibilities any time soon. Recently, Army Chief of Staff General Peter J. Schoomaker
declared, “The nation must begin by acknowledging that these are increasingly dangerous times
and realize that we are actually closer to the beginning than the end of the Long War”[1]. Army,
Marine, and Special Forces units are challenged by the pace of deployments, and equipment is
increasingly in need of overhauls.
Concurrent with this high operational tempo, Department of Defense (DoD) officials
remain committed to military innovation. DoD is pursuing a bold strategy to transform itself into
a more agile and lethal force, and some argue that the threats facing the US today reinforce the
need for this transformation. Former Secretary of Defense Donald Rumsfeld has repeatedly
stated that the war on terror requires military transformation. The DoD’s Office of Force
Transformation website links to numerous articles depicting examples of innovative technologies
being used in Afghanistan and Iraq [2]. Some advocates, including GEN Schoomaker, are even
pushing to accelerate this move toward the future [3].
This transformation, in concert with fighting a global war, comes at an expense. Despite
large increases in defense spending, the cost of operations has forced many planners to
economize in other areas. Does DoD shift resources from ongoing defense programs, training,
and military construction to fuel the intense operational tempo? These trade-offs, along with
growing desire to quickly insert innovative technology into the field, create pressure to curb
investment in long-range acquisition programs. Concurrently, there is growing public opinion
that the government is mismanaging a huge defense budget. With the fiscal year (FY) 07 defense
budget exceeding $513 billion and GWOT enduring longer than some expected, criticism is
abundant. Comments such as, “America’s defense spending is out of all proportion to any
conceivable threat, and yet America’s forces are in real trouble” and “The Pentagon’s

IAT.R 0471
3
management is incompetent, and Congress, which is ultimately responsible, doesn’t care” [4] are
popping up in editorials. Weapon system acquisitions, which in recent history account for
approximately 33% of these dollars [5], are getting further scrutiny. Some advocates are calling
for a line-by-line scrutiny of the defense budget to compare the value added to military security
with the cost of each program [6].
In reality, the amount of investment in defense is not so huge when compared to the
overall economic indicators of the nation over the last 60 years. When viewed as a proportion of
gross domestic product (GDP), this amount is relatively small. The US is investing the
equivalent of 3.9 percent of GDP toward national defense, the lowest proportion since before the
beginning of World War II [7]. However, with public opinion leaning toward tightening these
resources, it becomes even more important to make sound strategic decisions concerning the
management and investment in major weapon system acquisitions.
For more than 35 years, DoD has used EVM to ensure the efficient and effective use of
these dollars. Yet despite the longstanding use of this project management process, DoD still
struggles to keep weapon system projects within budget. In first quarter FY06, 40 programs
reported Nunn-McCurdy unit-cost breaches, with 25 of these reporting greater than 50% unit-
cost growth [8]. These figures are alarming, considering the environment of tight budget
constraints and the availability of time-proven management tools like EVM. Some cost growth
can be attributable to changing requirements and the lack of stability in funding; however, a great
majority of this cost growth is attributable to ineffective use of earned value techniques. In order
to be effective, leaders must use the analysis provided by earned value techniques to make timely
strategic decisions—putting the M back in EVM. This research paper provides a construct for
making strategic decisions in DoD acquisition using EVM.
Structure of the Paper
The next section briefly describes earned value and how DoD validates a contractor’s
system. From this background, the paper describes how a valuable resource—DCMA—can
assist project managers (PMs) with using EVM to make strategic program decisions. This section
is dedicated to program EVM analysis methods used to develop pieces of the puzzle that predict
answers to very important program management questions. The research methodology includes
analysis of three major defense program EVM systems and data, comprehensive literature review
IAT.R 0471
4
of EVM in acquisition management, and consultation with PMs, DCMA personnel, and DoD
contractors. The research will not cover the basics of EVM. Rather, it concentrates on the use of
this data as a predictive tool to identify root causes of problems, develop solutions early in the
acquisition lifecycle, and make strategic program decisions. The paper includes questions that
acquisition officials can use to shape EVM and data analysis and describes the products that can
be expected. Finally, the paper will conclude with recommendations for maximizing the use of
EVM to make strategic decisions.
Introduction to Earned Value Management
The previous section described current pressures on the US military and its budget:
Defense dollars are growing in the aggregate but are diminishing in terms of percentage of GDP.
Operational tempos are near all-time highs, and DoD is striving to transform to meet future
commitments. This environment is putting pressure on defense dollars, while investment in
weapon system acquisitions is declining. It is imperative that the few acquisitions programs that
succeed in making the budget cuts stay on track, deliver on time, and perform within their
original cost estimates. That is where EVM comes into play. This section of the paper provides a
concise introduction to EVM: a brief history of its origins, DoD use of it on acquisition projects,
and its benefits. The section finishes by covering the manner in which DoD ensures that the data
and indicators generated by earned value techniques are valid and dependable.
History
The concept of earned value was developed over a century ago by industrial specialists,
who used it to manage production costs of commercial products from American factories. They
found that the common metric of planned factory production versus actual production hours
lacked fidelity—it did not give a true depiction of costs, nor did it tell them how well they were
producing. Instead, they developed the concept of converting planned factory standards to earned
standards, and then comparing these figures to the actual production hours [9]. In today’s
terminology, the earned value is the budgeted cost of work performed (BCWP) from a project.
To get a good determination of project status, BCWP must be compared to actual costs and
scheduled costs (i.e., the plan) [10]. These comparisons give leaders the correct data with which

IAT.R 0471
5
to make strategic decisions. As we will see later in this paper, this last statement is true only if
the data are managed effectively and decisions are timely.
Although EVM was conceived in industry over a century ago, it wasn’t until the early
1960s that the concept was introduced to DoD. The US Air Force adopted the concept for use on
its Minuteman missile program in 1962; by 1967, DoD formally endorsed the concept of EVM
on all new weapon acquisition projects. For nearly thirty years, DoD used the concept of EVM in
the form of cost/schedule control systems criteria (C/SCSC) for all projects with cost-incentive-
type contracts. Then in 1995, industry became proactive in reengineering C/SCSC. In 1996, the
new, reengineered system was named the earned value management system (EVMS) [11].
EVM became so embedded as an industry standard practice that in 1998, DoD transferred
ownership of the process to industry. In doing so, DoD adopted American National Standards
Institute/Electronic Industries Alliance Standard 748 (ANSI/EIA-748). This standard established
32 minimum management control guidelines for an EVM system to ensure the validity of the
information used by management.
Current Requirements for EVMS
Today a common operational definition of EVM is “the use of an integrated management
system that coordinates work scope, schedule, and cost goals, as well as objectively measures
progress toward these goals” [12]. This management process is firmly rooted in defense
acquisition. The DoD instruction for acquisition programs requires EVM on programs that meet
certain thresholds to ensure the total integration of cost, schedule, and work scope aspects of the
contract [13].
In March 2005, DoD revised the EVM requirements thresholds to include cost or
incentive contracts, subcontracts, intra-government work agreements, and other agreements that
meet the dollar amounts below:
$20 million or greater—EVM implementation compliant with ANSI/EIA-748 is
required. No formal EVMS validation is required.
$50 million or greater—EVM implementation compliant with ANSI/EIA-748 is
required. AN EVMS that has been formally validated and accepted by the cognizant
contracting officer is required [14].

IAT.R 0471
6
Benefits of EVM
EVM is now a widely accepted best practice for project management that is used by the
defense industry, DoD, and the rest of the federal government. When implemented in a
disciplined manner to manage project performance, EVM has many benefits:
It is a single management control system that can provide reliable data.
It provides cost and schedule visibility by integrating work, schedule, and cost using
a work breakdown structure (WBS).
It provides an early warning system for deviations from the baseline plan.
It serves as a basis for identifying corrective actions when performance problems
arise.
It assists leaders in mitigating performance risks while minimizing cost and schedule
overruns.
It helps forecast final cost and schedule outcomes.
It provides a database of projects that is useful for comparative analysis.
It can provide leaders a context in which to make timely, objective strategic
decisions [15, 16, 17, 18].
While the advantages of EVM can be numerous, in order to realize these benefits, the EVM
system must be valid.
So what makes an EVM system valid? In 1998, Christensen examined this question in a
study to determine the characteristics of a useful EVM system, concluding an EVM system must
be both relevant and reliable [19] in order to be useful. Christensen further breaks out these
characteristics into the following: verifiable, valid, objective, timely, feedback value, and
predictive value. Some of these features have a profound effect on a program.
For example, the general heuristic throughout industry is that the greatest opportunity for
cost avoidance is within the first 15 percent mark of contract completion [20]. After this point,
leaders must make trade-offs with schedule and requirements to cut costs. So, timeliness of the
data is important; along with feedback value and predictive value, it comprises what Christensen
terms relevant. These traits primarily involve the analysis of the data coming from the EVMS.
The prerequisite of relevant analysis, however, is reliable data from a valid system. To
ensure validity of a system, most companies follow the guidelines of ANSI/EIA-748. DoD has

IAT.R 0471
7
accepted this standard, requires compliance to it, and for programs over the $50 million
threshold, a contractor’s system must be DoD validated. However, no single EVMS can meet all
specific demands of various defense contractors. It is the contractor’s responsibility to develop
and apply specific procedures to comply with the guidelines. Therefore, DoD requires oversight,
validation, and acceptance of these systems. The next section of this paper briefly describes this
DoD process of validation.
DoD Validation of an Earned Value Management System
In 1997, DoD gave the mission to validate and accept a contractor’s EVMS to DCMA. A
major benefit of centralizing this function is to allow PMs to assume the integrity of a
contractor’s data, so emphasis can be placed on analysis [21]. This mission is accomplished
through a validation review (VR) by a team of individuals with various skills led by a review
director. The team usually consists of a mix of engineers, software specialists, contract
administrators, quality assurance personnel and EVM experts. Members from the Project
Management Office and experts from the Defense Contract Audit Agency (DCAA) assist the
team in the review of the contractor’s EVMS [22].
The purpose of the VR is to conduct a formal assessment of the contractor’s proposed
EVMS compliance with ANSI/EIA-748, to include a successful demonstration of the EVMS.
The primary objectives of the VR are to:
evaluate management system capabilities against ANSI/EIA-748,
assess the description of the management system to determine if it adequately
describes the management processes demonstrated during the review, and
evaluate the application of the management system on the contract being reviewed
[23].
The VR begins as soon as practicable following the implementation of the EVMS. The
review consists of system documentation reviews, data traces, and interviews with contractor
personnel. The contractor’s EVMS is assessed against each guideline contained in ANSI/EIA-
748. There are 32 different guidelines in ANSI/EIA-748, which are summarized into the five
major areas below.

IAT.R 0471
8
Organization: Define the work element and organizational elements for the program.
This is usually done using a WBS and an organizational structure to include
subcontractors.
Planning and Budgeting: Establish a sequenced schedule showing task
interdependencies and a time-phased budget that includes metrics, milestones,
parameters, or goals used to measure progress.
Accounting Considerations: Record all costs and be able to summarize the costs at
different accounting and schedule levels.
Analysis and Management Reports: Generate reports based on earned value analysis
on at least a monthly basis and be able to implement managerial actions based on the
analysis.
Revisions and Data Maintenance: Incorporate, reconcile, and control authorized
changes to the program, and be able to officially update the performance
measurement baseline [24].
If the VR shows deficiencies in the contractor’s EVMS, they must be fixed. Once the
contractor has fixed all deficiencies and has successfully demonstrated compliance with
ANSI/EIA-748, the EVMS is said to be validated. The administrative contracting officer (ACO)
signs a letter of acceptance that officially records that the system has been validated and
accepted. Many defense contractors use standard EVMS across their business sectors. In these
cases, DCMA commonly signs an advanced agreement (AA) for the corporation. This means the
basic EVMS across all business sectors is deemed valid and acceptable. For example, if an AA is
signed with Lockheed Martin Corporation, this covers the company’s missiles, electronics,
aviation, and all other Lockheed Martin business sectors. If the transformation in defense is to be
led by the relatively few companies in the defense industry [25], then the trend will be toward an
increasing number of AAs. This is an important point that PMs must understand. A validated
EVMS means that a solid foundation has been laid to let PMs use EVM tools effectively. For
example, the contractor will have a system that can produce an accurate and detailed WBS as
well as a linked schedule that accurately shows the critical path of the program. Such a
contractor also has the resources to apply this system to each of the programs. However, an AA
or certified system is not a guarantee that each particular program has a successful EVMS. PMs
must ensure that each program has a quality integrated baseline review (IBR) where both the

IAT.R 0471
9
contractor and the government agreed on the WBS, work packages, EVM metrics, and that
program management correctly utilizes EVM. In a later section, this paper will describe a
technique for ensuring the maintenance of a good EVMS for each program.
This brief introduction to EVM shows that it has been used by DoD for over 40 years. Its
genesis was the lack of processes to assist PMs in identifying the true status of major acquisition
projects and making decisions. If implemented correctly, EVM has numerous benefits, including
predictive analysis and providing data with which to make timely, strategic decisions. However,
this section also showed that in order to obtain these benefits, an EVMS must be relevant and
reliable. In DoD, DCMA has the mission to validate a contractor’s EVMS and ensure that it
produces reliable data. DCMA accomplishes this mission by assessing the contractor’s adherence
to ANSI/EIA-748, the industry standard for EVMS. All this is background information for the
paper’s main objective: using earned value to make strategic decisions. The next section of this
paper provides a framework for this purpose that targets the continued reliability of an EVMS
and the relevance of the data analysis.
Framework for Analyzing EVM Data
So far, this paper has suggested that EVM can provide PMs timely information with
which to make strategic decisions. However, to effectively use this information, leaders must
leverage all the resources available and focus analysis efforts. A valuable resource for a PM is
the Program Integration team from DCMA. This section examines EVM analysis and reporting
at DCMA Lockheed Martin (LM) Dallas. The discussion and analysis here are based on three
specific programs: two acquisition category (ACAT) I programs and one ACAT II program. The
actual application of EVM analysis varies among programs based on risks, types of activities,
and development phase of the associated contracts. However, the framework presented below
provides general guidelines that can be used for all programs. The author developed this
framework based on his experience as a PM and DCMA commander. The discussion and
analysis from the examples provided by DCMA LM Dallas shows how PMs might apply the
framework. The charts and visual aids from the examples are generically referenced to protect
the integrity of ongoing programs. Appendix A, “Leader’s Quick Reference Guide to EVM,”
presents the basic framework, stripped of examples, to provide readers a concise tool that they
can reference for potential applications.

IAT.R 0471
10
The real power of the framework is that it provides leaders a tool with which to focus
EVM analysis on a continual basis and make timely decisions. PMs must remember that the
earned value techniques merely provide data. Leadership and management must be applied in
order to make strategic decisions. Neil Wittmeir, a program integrator lead at DCMA LM-Dallas,
put it this way:
The EVMS on a program is an analysis tool that can be compared to the engine computeranalyzer installed on today’s cars. The EVM data can indicate that a problem exists andhelp isolate the problem to a particular function or area. The EVM analysis is comparableto the car mechanic that has the experience and training to analyze the data and determinethe parts, cost, and time that will be required to fix the problem and predict the risk of notfixing the problem. The DCMA EVM expert, the program manager, and the contractorare all teamed as the “mechanic” and the “owner,” who decide on a fix with a reasonablerisk level. To make critical decisions based on good judgment, certain questions must beanswered [26].
Earned Value Management Analysis Framework
The construct of this framework is a series of questions the PM and program management
office (PMO) personnel can use to focus EVM analysis. The discussion that follows explains
some of the DCMA analysis products and provides a general upper-level description of how they
are designed to produce information that answers the analytical questions. Real-world examples
follow this discussion to show how PMs might actually use the analysis for a particular program.
When applying the framework, leaders must remember two key points:
First, EVM is a team process, and PMs should use all the expertise in their arsenal
to maximize results. This framework shows how DCMA can contribute to the
team.
Second, EVM is a continual process. As the program matures, the team needs
periodic updates to these questions to remain relevant and effective.
This facilitates management of effort and predictive analysis by a closed-loop process of
observing, analyzing, deciding, and then observing again.
Figure 1 depicts the overall structure of the framework. It is divided into three general
parts. The first part explains how DCMA system assessments are used to validate basic program
EVM analysis data accuracy. This helps ensure the continued reliability of the earned value data.
It can be considered the ongoing validation and maintenance of the EVMS. The second major
part is dedicated to program-specific EVM analysis methods used to develop pieces of the puzzle

IAT.R 0471
11
that predict answers to very important program management questions. This analysis section is
further divided into the following focus areas: analysis strategies, assessing the overall health of
a program, identifying root causes of problems, developing solutions, and analysis of required
resources. It provides leaders a closed-loop process of assessing, deciding, and acting to manage
earned value analysis. The third and final part covers scoping of EVM efforts and integrating
performance assessments. Scoping of EVM efforts is necessary to avoid being overwhelmed
with data. Additionally, while EVM can adequately cover schedule and cost, the factor of
performance is left out. Many development programs are derailed because of the occurrence of
unexpected or unknown performance issues. This final part shows how to tie in performance risk
management with EVM analysis in order to scope efforts. It does not discuss the numerous
performance risk techniques. That is beyond the scope of this paper. It does, however, provide
leaders a way to reduce voluminous program data down to key work packages so that cost,
schedule, and performance can be viewed together.
Figure 1. EVM analysis framework structure.
PART 2
Continuous EVMS Health Assessments
Scope EVMEfforts &IntegrateTechnical
Assessment
PART 1
PART 3Act
Decide
Assess
Plan AssessmentOverall Health
Identify Root Causes
Develop SolutionsAnalyze Resources
Corrective ActionsUpdate Strategy

IAT.R 0471
12
Maintenance of the Earned Value Management System
A previous section of this paper described how DCMA validates a contractor’s EVMS.
This is a one-time declaration that the contractor has sound principles and can apply the basics of
EVM. After the ACO formally accepts the EVMS, the contractor’s certification is good until the
contractor fails to follow these sound procedures. However, the process of validation is not
recurring and is not program specific. So how does a PM know how well the contractor is
following EVMS procedures on an ongoing basis and on specific programs? Questions that
could help in understanding this are:
Is the data used to manage specific programs by the contractor credible?
Is the contractor EVMS data used by DCMA and PMO EVMS experts to predict
risks and by the PM to make major program decisions valid?
Are the systems processes used to collect EVMS data adequate (does the process
work and are the procedures followed)?
What is the risk that such things as OH or labor rates will drive program cost
variance (CV)?
The DCMA process that can help answer these questions consists of continual audits of
corporate-level standard operating procedures. While PMs focus on specific programs, DCMA
should ensure that the contractor has sound corporate processes and procedures that are being
used by all programs. EVMS, for example, is a corporate-level system that is used by all
programs. The results of these audits are usually captured in a report and distributed to key
stakeholders. The report depicts the effectiveness of the policies and assesses the value of the
procedures as they are applied to programs. If deficiencies are found, the report should also
chronologically track corrective actions. These audits and subsequent reports are excellent tools
to track the health of the overall enterprise procedures as they apply to specific programs. Two
corporate systems that directly influence EVM analysis are the EVMS itself and the financial and
accounting system.
The process of auditing the EVMS is called EVMS surveillance. It is usually conducted
jointly between DCMA, DCAA, the contractor, and PMO personnel. This joint surveillance is
similar to a mini-VR for a specific program and is very useful to determine the health of the
EVMS. An average of one program per month is audited for the effectiveness and efficiency of

IAT.R 0471
13
its EVMS. The joint surveillance team conducts a bottom-up review of actual costs, estimates,
work packages, and reporting procedures, among other elements of the program. Cost account
managers (CAMs) and divisional leaders are interviewed to determine whether they understand
and correctly apply EVM procedures. If deficiencies are found, the contractor must correct them,
and the team tracks the progress of these actions. The results of these audits and corrective action
plans are compiled in a report that should be sent to all key leaders. This process and resulting
report is invaluable for a PM. It serves as a frequent IBR and maintenance check of the
program’s EVMS.
The financial and accounting system assessments include such processes as forward price
rate agreements (FPRAs), labor rates, negotiated OH rates, final OH rates, and cost estimating
procedures. The information from the financial and accounting system assessments can be used
to detect a major impact on the program costs. One recent example from DCMA LM-Dallas
involved the accounting system consolidation of a subcontractor’s corporate entities. The OH
rates were adjusted to consolidated rates, which were much higher than local rates. The increased
OH rates were a significant factor when multiplied against the subcontractor’s direct costs in an
already over-target budget. This increased cost, plus subcontract issues, became a major program
cost driver [27]. Because these OH and rate factors increase as a multiple of all direct costs, an
OH or labor rate creep should be detected and tracked as program cost-driver risks.
By staying abreast of the health of the corporate level systems, PMs can ensure that their
EVM data remain reliable. Additionally, system risk assessments and audits provide an excellent
health indicator of the contractor as a whole. PMs can use the focused analysis to ensure that
programs are on track and be proactive in solving issues. With a good preventive maintenance
process in place, PMs can turn their attention to analysis of EVM data for specific programs.
Analyzing Earned Value Management Data
This part of the framework concentrates on program-specific analysis of the earned value
data. It is organized for PMs to assess the health of a program, identify root causes of issues,
develop solutions, and assess the resources available to correct issues. PMs always strive toward
an end state of meeting program requirements on time and within budget. This section assists in
providing the ways and assessing the means to meet these ends. Essential to this process is good

IAT.R 0471
14
leadership and planning. Before any EVM analysis can begin, leaders must understand what each
team member can provide and must communicate a good strategy for analysis.
Types of EVM Analysis
The essentials of a good analysis strategy are in-plant presence, appropriate levels of data
study, trend analysis using charts and visual aids, pushing activity down to the lowest level, root-
cause identification, and teamwork. PMs should take these factors into consideration to plan a
comprehensive strategy for EVM analysis.
In Plant
While much information can be obtained and digested through charts, spreadsheets and
number analysis, there is no substitute for having presence on site at a contractor’s plant. This
puts eyes on the target and provides PMs with the quickest turnaround for questions. DCMA can
provide this presence. Through experience, DCMA team members should have the knowledge of
in-plant conditions and the general climate of the program. This somewhat subjective evaluation
is very important to combine with the objective number analysis. Knowing the culture, standard
procedures, and previous history of the contractor provides tremendous insight as to the true root
causes of issues and probability of success for proposed corrective actions. Where risk is
apparent at a subcontractor level—where access to subcontractor EVM data is not readily
available—DCMA has a network of in-plant teams that can provide EVM support. This is an
added advantage of DCMA. It is not bound by privity of contract to deal only with the prime
contractor. DCMA can reach down to the third- and even fourth-tier subcontract facilities. This
kind of support should be planned at critical subcontractor locations so that the DCMA program
integrator can aggregate the EVM analysis at the prime level. This network of support provides
PMs with eyes at all critical locations.
Appropriate Level of Analysis
To be truly effective, EVM analysis needs to be flexible enough to arrange the data and
analysis in different ways. If EVM analysis is only done at the program level, a PM will never
have enough fidelity in the information to determine the real root causes of problems. In contrast,
if the analysis can be sorted in a variety of ways such as by function (e.g., engineering, materials,
and production) and by IPT (e.g., airframe, guidance section, propulsion), the EVM team can
better analyze what is driving the problems. Futher, the analysis needs to focus at lower levels of

IAT.R 0471
15
the WBS. By drilling down the WBS to the work package (WP) level, the team can identify the
root causes of cost and schedule anomalies. At this level, interviews with CAMs can verify the
nature of the issue: hardware/software, recurring/ nonrecurring, recoverable/nonrecoverable,
subcontractor related, contractor system related, problem origin (common shop/program
specific), impact to other program efforts, test related, or staffing related. PMs must understand
and manage this effort proactively.
Chart Analysis and Visual Aids
As the old saying goes, “A picture is worth a thousand words.” By graphing the EVM
data, a PM can see how the program is performing through trend curves. Cost and schedule
performance indicators are analyzed for chronological trends, and this provides the basis for
predictive analysis. Through multiple-order polynomial regression best-fit trend curves, the
EVM team should be able to predict the future cost and schedule impacts given the current
performance. Each data point shows a snapshot of the performance at that time. The trend curve
indicates improving or declining future performance status. The DCMA program integration
team should be able to explain the analysis, contributing factors, significance, and potential
issues indicated by cost and schedule curves. This is very important for predictive analysis and
facilitating timely decisions.
Action at Lowest Level Possible
EVM issues should be resolved at the lowest possible level that has the authority and
accountability to implement an effective corrective action. The decision to include the issue in
the analysis will depend on the value-added interest that the issue or solution may have to the
PM.
Root-Cause Analysis
Good analysis determines the most likely root cause. The recurring or nonrecurring
nature of the root cause should be addressed. The potential for recovery (or not) of cost and
schedule variance is a function of the effectiveness of the corrective action. The analysis should
include the probability of success of the corrective action for the remaining effort. Like all good
planning, multiple courses of action should be considered before selecting the corrective action.

IAT.R 0471
16
Teamwork
The IPT approach to analysis applies the knowledge and experience of many functional,
product, process, and management experts. This paper concentrates on how DCMA can
contribute to this team, but other members of the IPT should not be overlooked. These teams
usually have government and contractor representation. Solutions most beneficial to the program
are often achieved in this environment for more global issues. The IPT has proven to be an
excellent communication tool to identify multidimensional solutions that have maximum benefit
to the overall program.
Once a good analysis strategy is in place, leaders must communicate this plan, to include
what they expect from the analysis, to all team members. So where are we now? The PM should
feel comfortable with the reliability of the EVM data through the ongoing maintenance of the
EVMS. The PM should also have a well-considered plan for analyzing this data. Now we can
turn our attention to execution of this plan. The following section describes the types of analysis
to determine the general health of a program.
Assessing the Overall Health of a Program: Cumulative Cost and Schedule Performance
One of the first things a PM should understand is the performance of the overall program.
Top-level EVM performance indicators can reveal that program issues are developing or can be
used to indicate the effectiveness of corrective actions. They can provide answers to questions
such as:
What is the program cost and schedule performance health?
Is the program overall performance improving?
How do cost and schedule issues affect each other?
If there are program-level concerns, what are quantitative cost and scheduleperformance relationships?
What future performance impacts do the predictive trends indicate if correctiveactions are not implemented?
Should reprogramming or rescheduling be considered by the PMO to develop arealistic measurable baseline?
To get a good, top-level answer to these questions, DCMA uses the cost performance
index (CPI) and the schedule performance index (SPI) to analyze trends. Cost and schedule

IAT.R 0471
17
performance indicators are analyzed for chronological trends. These trends will represent an
event or condition on the program. Performance grossly divergent from the target of 1.0 for CPI
or SPI should be a cause for concern. A CPI or SPI between 1.0 and 0.95 is considered
acceptable risk, between 0.95 and 0.90 is considered moderate risk (time to take action), and
below 0.90 is considered high risk (time to re-baseline, re-scope, or halt efforts).
A decreasing schedule performance could indicate an unrealistic schedule or unforeseen
performance issues that require additional time and resources (i.e., dollars) to get back on the
program plan. Often, a schedule variance (SV) recovery requires cost beyond the original
estimate. DCMA should provide program-level explanations with curves for quick trend
references with insight into the ways that cost and schedule affect each other as they develop.
Without corrective action, the trend lines predict performance and impact. Caution should
be taken with early data. Trends developed with a limited number of data points may not be valid
predictive indicators. As corrective actions are implemented, effectiveness can be observed in an
improved performance curve. If the predictive trend line is not pointing to the program
objectives, then leaders should take further actions to get the program back on track. In
developing courses of action to correct issues, leaders must understand the ROI of their efforts.
To do this, DCMA can provide the percent-complete and percent-spent charts for a quick
measure of magnitude. This type of analysis is discussed further in a later section of the paper.
The percent-complete/spent charts combined with other analysis, such as CPI/SPI, can help
indicate the probability of recovery.
Example: A good example of overall health indicators is taken from an ACAT I program
managed by Program Executive Office Missiles and Space. In this program, leadership took
proactive measures to make positive impacts on the program. Multi-order polynomial regression
trend line analysis of cumulative CPI and SPI by performance period provides an excellent visual
tool for explanation and analysis. Figure 2, program CPI/SPI trends by month, shows an
improvement trend in both cost and schedule performance (CPI and SPI).

IAT.R 0471
18
Program CPI/SPI Trends by Month
y = 0.0003x3 - 1.0539x2 + 1288.6x - 525197
R2 = 0.9873
y = -0.0003x2 + 0.7766x - 483.16
R2 = 0.9458
0.900
0.910
0.920
0.930
0.940
0.950
0.960
0.970
0.980
0.990
CPI/SPI By Month
CP
I/S
PI
SPI 0.95 0.95 0.96 0.97 0.97 0.97 0.98 0.99 0.98 0.99 0.98 0.98 0.98 0.99 0.99
CPI 0.90 0.90 0.90 0.91 0.91 0.91 0.91 0.91 0.92 0.92 0.93 0.93 0.94 0.94 0.94
Jan-03 Feb-03 Mar-03 Apr-03 May-03 Jun-03 Jul-03 Aug-03 Sep-03 Oct-03 Nov-03 Dec-03 Jan-04 Feb-04 Mar-04
SPI Trend
CPI Trend
CPI Plot
Moderate Risk
Threshold
SPI Plot
Figure 2. Program CPI/SPI trends by month [28].
Notice the convex trend of the schedule curve showing negative improvement
acceleration as the line converges on the target SPI = 1.0. This is expected during the end of a
contract as budgeted cost of work performed (BCWP) approaches budgeted cost of work
scheduled (BCWS), regardless of past performance. At this point, schedule analysis is focused
on critical path. A quick glance at percent-complete and percent-spent charts reveals that this
contract completion is in the 90th percentile. NOTE: This concept is covered in more detail in
the Probability of Cost and Schedule Recovery section of this paper.
The cost-performance curve is slightly concave, indicating positive improvement
acceleration. An important transition watch point is when the curve bells, or changes from
concave to convex.
The cost performance curve correlation coefficient (R2) value of 0.9954 (very close to
1.0) indicates a high probability that future points will fall on this trend line if conditions do not
change. Thus, the CPI trend line can predict future performance. Each spike in the performance
curves has its own story. A low R2 value can indicate unstable, out-of-control conditions on the
program that gyrate with random patterns and should be managed. This randomness of the
unstable performance data makes predictive analysis more difficult.
In general, the root causes for the high-risk CPI of 0.90 in this example were delayed
deliveries and cost overruns associated with subcontractors. After subcontractors completed
deliveries (Jan 03 or at the beginning of the curve), the program management team regained
control of cost variance and managed to recover to an acceptable cost performance of 0.95. At

IAT.R 0471
19
the end of a contract, cost recovery becomes difficult. This recovery is unusual and a credit to the
program management.
The curve in Figure 3, program cost and schedule dollar variance (CV/SV), shows
another way to look at top-level trends. This type of analysis is similar to CPI and SPI but puts
the data in terms of EV dollars. This figure shows how many program budget dollars were
recovered during this successful 14-month period. It shows a similar trend, but also gives leaders
a good quantitative number (in budgeted dollars) to measure the degree of success.
Figure 3. Program Cost and Schedule Variance (CV/SV) [29]
This type of analysis gives PMs an overall assessment of a program’s health. It is very
good to detect issues or probable issues early in the program. Once a potential issue is identified,
however, a more in-depth analysis is required. The deeper the analysis, the easier it is to pinpoint
the cause of the issue.
Identifying Root Causes of Issues
Early indicators of the health of a program are key in making a successful end state.
These health indicators (CPI and SPI) should lead to further analysis to determine the root cause
of issues. There are various methods of cutting or organizing the EVM data. Three beneficial
ways are by function, by IPT, and by subcontractor. By analyzing this type of data, leaders have
the correct information to make timely decisions.
A look at the overall program level of EVM data can be deceiving. If some functional
teams are overachieving and others are underachieving, the cost or schedule variances may

IAT.R 0471
20
cancel each other when rolled to the program level of analysis. This cancellation of CV at upper
levels can hide potential critical lower-level risks.
To detect issues before they have major program impacts, the analysis must drill down
the WBS and be rearranged into functional, IPT, and WP levels of EVM data. With this lowest-
level, smaller-puzzle-piece visibility, issue analysis and corrective actions can be most effective.
The predecessor and dependent tasks on the critical path can be identified as possible elements of
risk mitigation. After all, if our car would not start, we would focus on repairs at the lower-level
starter system and not on analysis at the overall car level or unrelated lower-level areas such as
paint, tires, or structure.
Functional Team Cost and Schedule Performance
Work can be broken down and evaluated by functional teams such as engineering,
quality, materials, and production. PMs should request this type of analysis to answer the
following types of questions:
How are the program functional teams performing?
How do the functional dollars contribute to the program variance?
What percentage of program variance is driven by the functional team?
Are functional team performance trends indicating consistency, product issues, orflow-down impact?
What are the interactions (drive verses driven) of functional and IPT (product)team variances?
Is the functional performance related to staffing or performance issues?
What are the functional cost and schedule relationships of which a PMO shouldbe aware?
What future functional performance impacts do predictive trends indicate ifcorrective action is not implemented?
The functional analysis often points to process challenges in areas such as software,
hardware, subcontracting, engineering requirements analysis, integration and testing,
manufacturing, or functional staffing availability. The dollar contribution of a particular function
may not necessarily be performance related. For example, research and development (R&D)
programs may have a significant quantity of engineering functional effort. A small percentage of

IAT.R 0471
21
the functional engineering variance could be a major (dollar) portion of total program cost
variance. This may indicate the need for a particular focus on maintaining cost and schedule
discipline on a functional area that could have a large return on investment.
Functional performance root-cause issues may be driven by functional management,
personnel shortages, training, or level of experience. A cost variance may indicate staffing at a
higher pay grade than was estimated. Moreover, the performance of one function could impact
another function, or IPT product, because of one organization’s dependence on the work product
to another. Functional performance trends may indicate ongoing issues ranging from over- or
underestimated WPs to unforeseen technical product challenges. This in-depth analysis uncovers
many rocks to determine the root cause. The key is for leadership to manage the identification
and solutions to the problem. Let’s take a look at an example of how functional analysis can
help determine root cause.
Example: This example is from an ACAT II program with oversight from DCMA LM-
Dallas. The analysis is a series of different ways to look at the data. Each investigation leads to
another piece of the puzzle. Figure 4 shows that the materials division represents 80% (Jan 03) to
102% (Mar 04) of total program CV.
Functional % of Program Cost Variance
-20%
0%
20%
40%
60%
80%
100%
% of Program CV By Function By Month
%o
fP
rog
ram
Co
stV
ari
an
ce
Eng-% 6% 11% 10% 10% 6% 5% 5% 4% 2% -1% -6% -10% -15% -19%
Prod-% 6% 2% 3% 3% 4% 2% 3% 1% 0% 2% 3% 3% 3% 3%
Qual-% 2% 3% 3% 2% 2% 2% 3% 3% 4% 4% 4% 4% 5% 6%
MTL-% 77% 76% 76% 77% 80% 82% 80% 84% 86% 87% 91% 94% 98% 102%
Mfg Eng-% 8% 9% 9% 8% 8% 8% 8% 8% 8% 8% 8% 8% 9% 9%
Feb-03 Mar-03 Apr-03 May-03 Jun-03 Jul-03 Aug-03 Sep-03 Oct-03 Nov-03 Dec-03 Jan-04 Feb-04 Mar-04
Material
Engineering
Figure 4. Functional percentage of program cost variance[30].
The resulting percentage over 100 is possible because material CV overshadows the
positive CV of other functional groups, such as engineering. Subcontractor effort is charged to
the accounting category material. This positive slope indicates the increasing importance of this
functional area (material) during the time shown. At the end of the curve, nearly all cost variance
has roots in material.

IAT.R 0471
22
Figure 5 quantifies the impact of material CV on the program. The functional group
(material) actual quantity of CV dollar impact is ($13,076k) of the program budget (total
program composite CV of $12,872k). This should be a red flag for leaders. At this point a leader
must dig further and focus the team on the material functional group to see what the actual root
cause is within this functional area. The first thing that should be checked is the overall
performance of the material division. This includes bulk items, like nuts and bolts, and
subcontract effort for larger items like components of major end products.
Program CV by Function
y = 0.2649x4 - 1332.3x3 + 3E+06x2 - 2E+09x + 7E+11
R2 = 0.9973
(20,000)
(15,000)
(10,000)
(5,000)
0
5,000
CV $ By Function By Month
Cos
t/S
ched
ule
Var
ian
ce($
X10
00)
Prog-CV (18,457) (18,774) (18,444) (17,841) (17,490) (16,426) (15,557) (14,480) (13,925) (13,408) (12,872)
Eng-CV (1,798) (1,082) (966) (907) (745) (256) 134 933 1,411 2,041 2,506
Prod-CV (566) (826) (409) (607) (187) (79) (322) (409) (413) (414) (418)
Qual-CV (407) (424) (415) (519) (573) (609) (588) (609) (622) (690) (741)
MTL-CV (14,160) (14,977) (15,164) (14,318) (14,628) (14,205) (13,531) (13,249) (13,154) (13,201) (13,076)
May-03 Jun-03 Jul-03 Aug-03 Sep-03 Oct-03 Nov-03 Dec-03 Jan-04 Feb-04 Mar-04
Qual CV Plot
MTL CV PlotProg CV Trend
Eng CV PlotProd CV Plot
Prog CV Plot
Figure 5. Program CV by function [31].
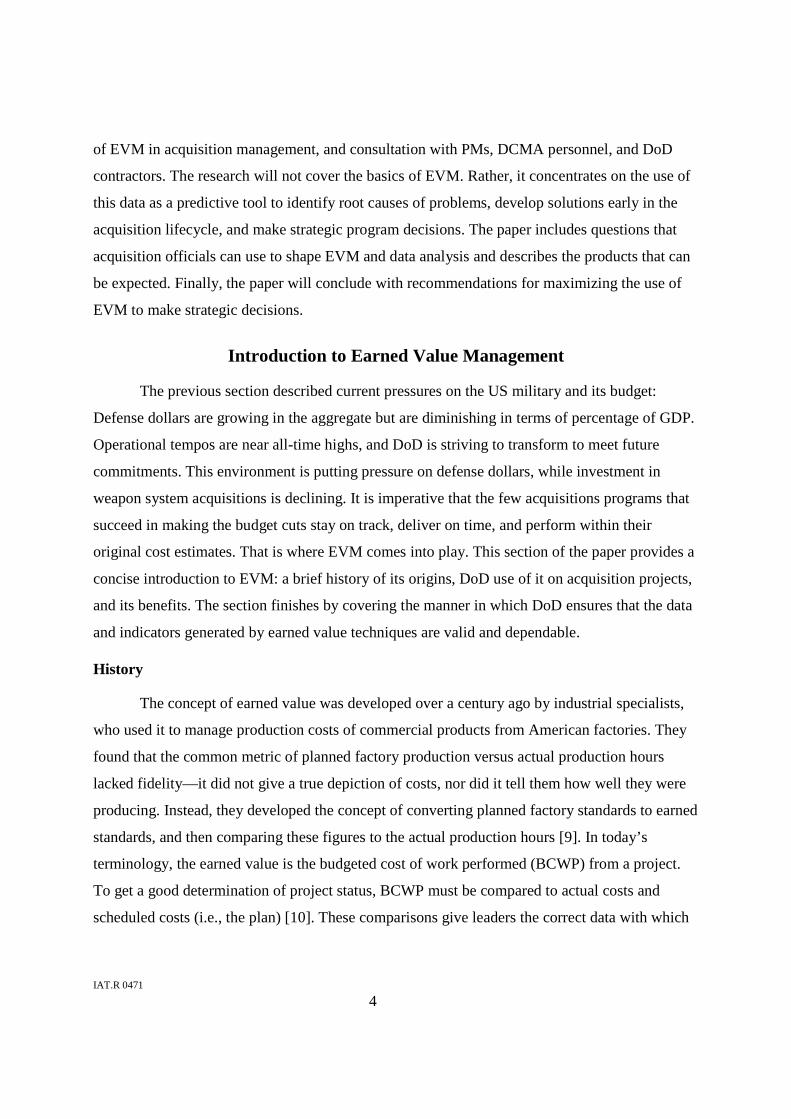
Figure 6 shows material with a high risk CPI of 0.88. It is not only the worst functional
performer but a poorer performer than the composite program CPI of 0.94. So with this bit of
information, the program team must look at what is causing the inefficient use of dollars. The
next area that should be checked is the materials overall schedule performance.
IAT.R 0471
23
Cost Performance Index (CPI) By Function y = 8E-05x3
- 0.2864x2
+ 357.37x - 148618
R 2 = 0.7141
0.84
0.86
0.88
0.90
0.92
0.94
0.96
0.98
1.00
1.02
Cum CPI By Function By Month
CP
I
Mfg Eng -CPI 0.87 0.87 0.87 0.88 0.88 0.88 0.89 0.90 0.90 0.91 0.91 0.91 0.91
MTL-CPI 0.86 0.86 0.85 0.85 0.85 0.86 0.86 0.86 0.87 0.87 0.87 0.87 0.88
Prod-CPI 0.96 0.95 0.94 0.92 0.96 0.94 0.98 0.99 0.97 0.96 0.96 0.96 0.96
Eng-CPI 0.97 0.97 0.98 0.99 0.99 0.99 0.99 1.00 1.00 1.01 1.02 1.02 1.03
Prog-CPI 0.90 0.91 0.91 0.91 0.91 0.91 0.92 0.92 0.93 0.93 0.94 0.94 0.94
Mar-03 Apr-03 May-03 Jun-03 Jul-03 Aug-03 Sep-03 Oct-03 Nov-03 Dec-03 Jan-04 Feb-04 Mar-04
Production
Production TrendEngineering
Figure 6. CPI by function [32].
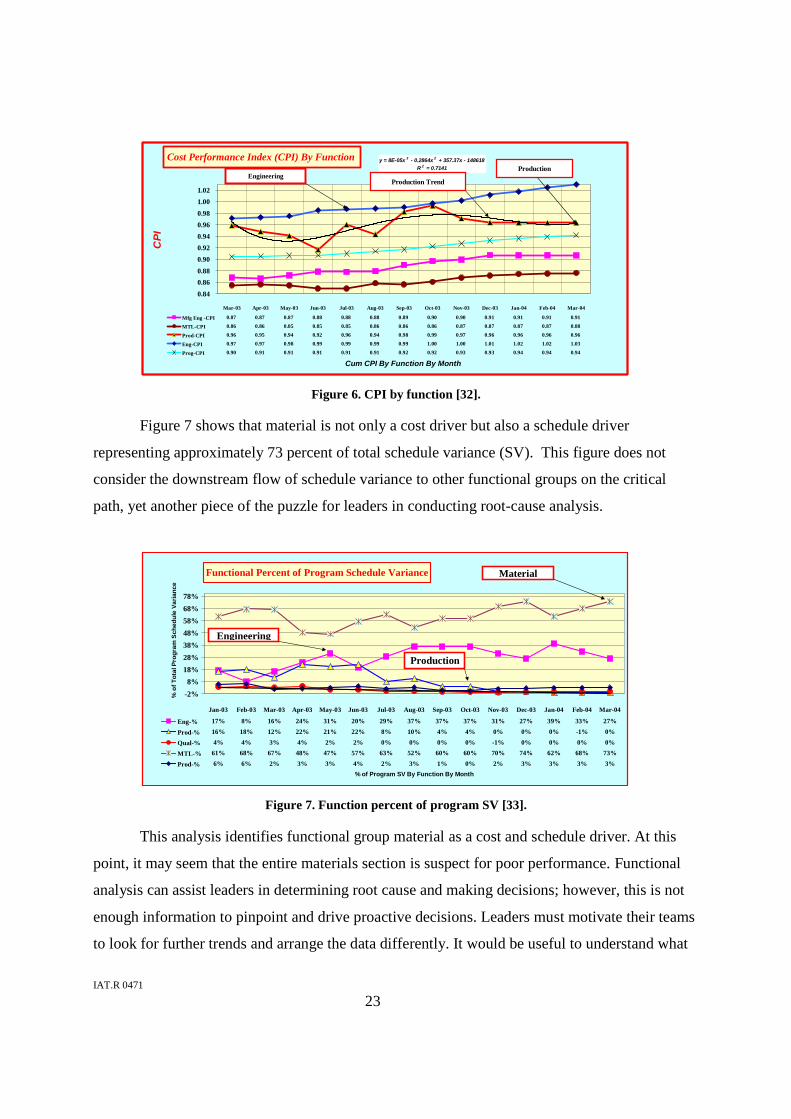
Figure 7 shows that material is not only a cost driver but also a schedule driver
representing approximately 73 percent of total schedule variance (SV). This figure does not
consider the downstream flow of schedule variance to other functional groups on the critical
path, yet another piece of the puzzle for leaders in conducting root-cause analysis.
Functional Percent of Program Schedule Variance
-2%
8%
18%
28%
38%
48%
58%
68%
78%
% of Program SV By Function By Month
%o
fT
ota
lP
rog
ram
Sch
ed
ule
Va
rian
ce
Eng-% 17% 8% 16% 24% 31% 20% 29% 37% 37% 37% 31% 27% 39% 33% 27%
Prod-% 16% 18% 12% 22% 21% 22% 8% 10% 4% 4% 0% 0% 0% -1% 0%
Qual-% 4% 4% 3% 4% 2% 2% 0% 0% 0% 0% -1% 0% 0% 0% 0%
MTL-% 61% 68% 67% 48% 47% 57% 63% 52% 60% 60% 70% 74% 62% 68% 73%
Prod-% 6% 6% 2% 3% 3% 4% 2% 3% 1% 0% 2% 3% 3% 3% 3%
Jan-03 Feb-03 Mar-03 Apr-03 May-03 Jun-03 Jul-03 Aug-03 Sep-03 Oct-03 Nov-03 Dec-03 Jan-04 Feb-04 Mar-04
Material
Engineering
Production
Figure 7. Function percent of program SV [33].
This analysis identifies functional group material as a cost and schedule driver. At this
point, it may seem that the entire materials section is suspect for poor performance. Functional
analysis can assist leaders in determining root cause and making decisions; however, this is not
enough information to pinpoint and drive proactive decisions. Leaders must motivate their teams
to look for further trends and arrange the data differently. It would be useful to understand what

IAT.R 0471
24
type of material from what component is driving the variances. A good tool for this is the IPT
analysis.
Integrated Product Team Cost and Schedule Variance
IPTs are usually organized by components or major end products of the effort. Each
component IPT has representation from the functional groups. Poor performance at the
component IPT level directly translates to problems at the product level. IPT analysis can assist
the PM in identifying issues early to make proactive decisions. When coupled with the functional
analysis described previously, root cause can usually be pinpointed to a particular product
characteristic. In general, IPT analysis helps leaders answer the following questions:
How are the IPTs performing?
What are the IPT dollar contributions to the program variance?
What percentage of program variance is driven by the IPT?
Are IPT performance trends indicating consistency, product issues, or flow-downimpact?
What are the cost and schedule relationships of which the PMO should be aware?
If there are program-level concerns, what are the quantitative cost and scheduledollar relationships to performance?
What future performance impacts do IPT predictive trends indicate, if correctiveaction is not implemented?
To determine true impact to the program, EVM variances with product roots may trigger
analysis of such areas as subcontractor performance, low-yield, high-dollar, long-lead-time
items, and product qualification. The IPT performance indication by itself may be deceiving. The
percent of overall program EVM variance should be considered when making corrective action
decisions. High-dollar products or long delivery dates may merit closer monitoring to ensure low
EVM risk.
The root cause of low EVM performance on one IPT may require corrective action
collaboration with other IPTs to minimize program impact. Analysis at the IPT performance
level has a significant potential to expose opportunities to prevent potential problems.
Unstable IPT performance may indicate the lack of technical maturity in the associated
products. The scope of tasks associated with new technology is often not clearly defined, and the

IAT.R 0471
25
required resources are difficult to accurately estimate. Often, IPT product variance analysis
points to software, hardware, or subcontracting design requirements issues. Early detection of
design problems can save future rework cost for the product and associated products.
Example: Let’s go back to our ACAT II program example. Functional analysis showed
that the materials group was responsible for poor cost and schedule performance. However, this
analysis does not show what type of material. This time the EV data will be organized by IPT.
Figure 8 reveals that the two poorest IPT cost performers are the fire unit (FU) [CPI of
0.91] and the missile/launch pod/container (M/LP/C) [CPI of 0.87]. A drill down to the subteam
level for the FU IPT (Figure 8) and the M/LP/C IPT (Figure 9) shows hardware (HW) to be the
cost issue on both IPTs (CPI of 0.89 and 0.81 respectively).
Cost Performance Index (CPI) by Integrated Product Team (IPT)
0.84
0.89
0.94
0.99
1.04
1.09
1.14
1.19
1.24
1.29
1.34
Performance Month
CP
I(1
.0G
oa
l)
FU-CPI 0.89 0.89 0.89 0.89 0.90 0.90 0.90 0.90 0.91 0.91 0.91 0.91 0.91
M/LP/C-CPI 0.86 0.86 0.85 0.84 0.85 0.86 0.86 0.87 0.87 0.87 0.87 0.87 0.87
ST&E-CPI 1.08 1.13 1.15 1.17 1.17 1.15 1.16 1.20 1.20 1.24 1.26 1.29 1.31
SE&PM-CPI 1.04 1.04 1.04 1.04 1.04 1.04 1.04 1.04 1.05 1.06 1.07 1.08 1.08
Mar-03 Apr-03 May-03 Jun-03 Jul-03 Aug-03 Sep-03 Oct-03 Nov-03 Dec-03 Jan-04 Feb-04 Mar-04
FUM/LP/C
Figure 8. CPI by IPT [34].
Further decomposition of IPTs to work packages and program knowledge was key to
root-cause analysis. The actual root cause on the FU was a subcontracted major subcomponent
that was charged as material hardware on the FU.
The FU chart (Figure 9) shows software (CPI of 0.94) to be the second poorest
performer. The root cause was a subcontractor product that had both hardware and software
failures. The subcontractor test facility was not adequate to fully test the product. The prime
contractor was forced to perform qualification tests on the product, as well as debug and
qualification test a large portion of the embedded product software. The product design was
returned to the vendor for multiple revisions and then (each time) retested at the prime’s facility.

IAT.R 0471
26
FU IPT Cost Performance Index (CPI) by Group
0.80
0.90
1.00
1.10
1.20
Performance Month
CP
I(1
.0=
Go
al)
IA&T_CPI 0.93 0.95 0.95 0.96 0.97 0.97 0.97 0.96 0.97 0.97 0.97 0.97
HW_CPI 0.88 0.87 0.87 0.87 0.87 0.88 0.88 0.88 0.89 0.89 0.89 0.89
SW_CPI 0.89 0.88 0.94 0.94 0.95 0.94 0.94 0.94 0.94 0.94 0.94 0.94
TRN EQ_CPI 1.04 1.05 1.05 1.05 1.03 0.94 1.01 1.17 1.17 1.12 1.09 1.12
Apr-03 May-03 Jun-03 Jul-03 Aug-03 Sep-03 Oct-03 Nov-03 Dec-03 Jan-04 Feb-04 Mar-04
HW
SW
TRN
IA&T
Figure 9. FU IPT CPI by group [35].
The M/LP/C root cause was also hardware component performance problems. Figure 10
shows M/LP/C software cost performance CPI of 1.23. This good news resulted from the
M/LP/C reuse software being more mature than expected and therefore functioning with very
few issues.
MLP/C IPT Cost Performance Index (CPI) by Group
0.75
0.85
0.95
1.05
1.15
1.25
Performance Month
CP
I(G
oal
1.0
)
IA&T 0.93 0.91 0.90 0.89 0.89 0.89 0.90 0.91 0.92 0.92 0.92 0.92 0.94 0.93
HW 0.81 0.81 0.80 0.80 0.79 0.80 0.81 0.82 0.81 0.82 0.82 0.82 0.81 0.81
SW 1.19 1.19 1.18 1.18 1.18 1.19 1.20 1.20 1.20 1.21 1.22 1.23 1.23 1.23
Cont HW 0.93 0.97 0.97 0.94 0.89 0.88 0.87 0.88 0.88 0.88 0.88 0.88 0.89 0.89
Feb-03 Mar-03 Apr-03 May-03 Jun-03 Jul-03 Aug-03 Sep-03 Oct-03 Nov-03 Dec-03 Jan-04 Feb-04 Mar-04
HW
SW
IA&T Cont HW
Figure 10. M/LP/C CPI by group [36].
The example shows the advantage of breaking down the EV data by IPT. Leaders obtain
a better indicator as to where the problems exist, a focus on the issues that leads to better
solutions. This example also shows that such analysis can drive further analysis and discussion.
The poor performance of the FU was directly attributable to subcontract work, an interesting
situation. The PM holds a contract with the prime contractor. Privity-of-contract principles

IAT.R 0471
27
require the PM to deal only with the prime. So how do PMs get information and analysis from
subcontractors? The answer is thru DCMA. Because DCMA has oversight authority on most
defense contractors, it is able to pull data on these subcontractors. Moreover, DCMA is able to
place personnel at the plant location and put eyes on the target.
Subcontractor Cost and Schedule Performance
Normally, geographic remoteness and limited access to subcontractor facilities increases
the complexity of good communication and limits product understanding and interface
expectations on both sides. These are but a few reasons that subcontracted effort potentially has
the highest risk of budget overruns, delivery problems, and performance issues. All these are
good reasons for close monitoring of subcontractor EVM data for early detection and resolution
management. Subcontractor EVM analysis answers the following types of questions:
How much subcontractor oversight focus should be applied to a specificsubcontract effort?
How fast are subcontract issues developing?
Are the subcontractor issues related to cost, schedule, or performance?
What are the subcontract dollar contributions to the program variance?
Are variances recurring with possible unit cost impacts or non recurring spikes?
Are subcontractor schedule variances on the critical path and does the schedulevariance exceed the master schedule critical path slack before impact ondependent tasks?
Major subcontractor EVM variance drivers should be broken out for detailed analysis.
The analysis of the subcontractor EVM problems includes a detailed understanding of the
associated variance issues. The level of oversight should be proportionate to the contribution to
the program risk.
Subcontractor efforts are budgeted and cost collected under material functional elements.
The EVM analysis relates a subcontractor’s performance variances to program, material, and
total subcontract performance for a clear understanding of major performance variance drivers.
Subcontractor EVM performance trends are monitored for early problem detection as well as
effectiveness of corrective actions taken against known problems. Characteristically,
nonrecurring issues appear as spikes, while recurring problems appear as a trend. Subcontractor

IAT.R 0471
28
schedule slack on the program schedule critical path is analyzed for risk of downstream impact
to other program elements. These elements must be considered in corrective actions.
Because the prime contractor has limited control over subcontractors, communication,
problem detection, and problem resolution become more difficult. Analysis of all subcontractor
variances provides an indication of late delivery even of fixed-price subcontracts. Cost-plus
contracts with EVM reporting are broken out for more detailed analysis of cost, schedule and
trending.
Example: Our previous example indicated that the material functional area, specifically
the FU IPT, was a cost driver. Through further analysis, it was determined that the FU effort
belonged to a subcontractor. So let’s take a look at the subcontractors’ EV data. Figure 11 clearly
shows which subcontractors are program cost and schedule drivers.
Subcontractor Cost /Schedule Variance X1K($4,300)
($3,800)
($3,300)
($2,800)
($2,300)
($1,800)
($1,300)
($800)
($300)
CV/SV
CV ($3,855) ($3,257) ($2,699) ($299) $0 $0 $0 $0 $0 $0 $0
SV ($1,665) $0 $0 $0 ($194) $0 $0 $0 $0 $0 $0
C1 C2 C3 C4 C5 C6 C7 C8 C9 C10 C11
EOS
PLS
SRM
ACM
IMU
CDM
ISD/ISTA
Slip Ring
ReLoader
Launch Tube
FTT
Figure 11. Subcontractor cost/schedule variance [37].
In this case, subcontractor C1 is not only the major cost driver but is the major schedule
driver. C1 also turns out to be the subcontractor for the FU. To find out what is going on at this
subcontractor, DCMA can turn to its representatives at the subcontractor plant and analyze its
performance. Figure 12 shows the history of subcontractor C1.

IAT.R 0471
29
Subcontractor Performance - SPI/CPI
y = -1E-05x4
+ 0.0697x3
- 129.94x2
+ 107643x - 3E+07
R2
= 0.6231
y = 0.0002x2
- 0.4051x + 252.12
R2
= 0.5301
0.85
0.87
0.89
0.91
0.93
0.95
0.97
0.99
SPI/CPI By Month
CP
I/P
I
CPI 0.87 0.87 0.87 0.87 0.87 0.87 0.88 0.86 0.888 0.889 0.890 0.892 0.890 0.888
SPI 0.99 1.00 0.99 0.99 0.99 0.99 0.99 1.000 0.989 0.989 0.987 0.989 0.986 0.983
Comp 90.69% 91.81% 92.40% 93.17% 94.28% 94.28% 94.85% 98.88% 95.87% 96.28% 96.65% 97.11% 97.44% 97.76%
Feb-03 Mar-03 Apr-03 May-03 Jun-03 Jul-03 Aug-03 Sep-03 Oct-03 Nov-03 Dec-03 Jan-04 Feb-04 Mar-04
SPI Plot
SPI Trend
CPI
Trend
CPI Plot
% Complete
Figure 12. Subcontractor C1 SPI and CPI [38]
The analysis shows very little positive slope in cost performance (from 0.87 to 0.89 in a
14-month period of performance), which promises little recovery in cost variance at the end of
the contract. Percent complete moving from 0.91 to 0.98 in a 14-month period shows slow
progress, possibly due to product technical issues. As the charts indicated, the subcontractor
struggled with performance problems that the subcontractor’s test facilities were unable to
detect. Much redesign and testing drove the CV (which never recovered from high-risk status).
The subcontractor product schedule performance appears acceptable, because the performance
snapshot was at the end of the contract. However, the subcontractor’s performance issues and
rework added unplanned effort to the critical path, which required management workarounds to
prevent major program impacts. This highlights that the SPI is less meaningful than critical path
analysis as the contract (in this case subcontract) nears completion. It is a clear example of
failure to take corrective actions early in the program. The CPI early in the program of 0.87
should have thrown up red flags to leaders and team members. This possibly could have been
corrected early enough to make positive impacts on the program.
This section has provided three ways to further analyze program data in order to
determine root causes of problems: by function, by IPT, and by subcontractor. These types of
analysis are very useful in determining the real driving force behind issues. Once the root cause
is determined, the next step is to develop solutions. There are numerous ways to correct negative
trends. The scope ranges from crashing resources, reducing scope, or even canceling the program
and using remaining resources on other DoD priorities. An essential element in determining the
IAT.R 0471
30
best corrective action is the impact to the program. The next section of the paper describes ways
to determine if corrective actions will have a significant impact.
Developing Solutions
After identifying the root causes of issues within a program, PMs need to identify
corrective action plans to get the program back on track. This is normally done in coordination
with the contractor. The contractor develops and presents different options to the PM, who then
decides which option to implement. This must be done in a timely manner and sometimes
warrants a calculated and hasty approach rather than a long, drawn-out deliberate decision cycle
(these can take months of analysis). DCMA can assist these decisions by calculating the
probability of success of different options. This can be done by looking at the progress of the
program to date and estimating cost and duration at completion. Because the focus of this paper
is on cost and schedule recovery, the discussion that follows involves only these variables.
DCMA can also assist in performance assessment of recovery plans.
Probability of Cost and Schedule Recovery: Percent-Spent and Percent-Complete Analyses
One of the first things a PM should check is the probability of cost and schedule
recovery. Some questions that can focus EVM analysis are:
What are the quick-glance chances of cost and schedule recovery?
What are the interactions (drive versus driven) of other product variances?
Is the functional performance related to staffing or performance issues?
Based on budgeted resources used and task progress, what type of correctiveactions should be considered?
How critical is the timing of corrective action to preventing future performanceimpacts?
To shape the answers to these questions, the chart analysis of percent complete and
percent spent, when paired with other analysis, can give leaders a hasty check for success-
probability predictions of the corrective action strategies. When conducting this type of analysis,
there are some rules of thumb:
Tasks that are nearing completion have fewer corrective-action options andtherefore less chance of recovering relatively large cost or schedule variances.

IAT.R 0471
31
Performance issues normally require cost and schedule resources as part ofcorrective actions. Product-related variance issues with high risks often indicatemajor corrective actions that may drive the cost, schedule, or technicalperformance of other associated products.
Low percent spent and percent complete have the best chance of recovery.
Low percent spent and high percent complete would have the next best chance ofrecovery.
High percent spent and near completion would have little chance of recovery.
High percent spent and low percent complete would have the least chance ofrecovery.
Example: Let’s take a look at how this analysis can be put to use through an example
from one of our ACAT I programs. The root-cause analysis of schedule delays was determined
to be understaffing of system engineers. This understaffing caused delays in the requirements
analysis and flow down of requirements to the various WBS elements. Delayed flow down of
requirements to software caused schedule slips in the preliminary design effort. Software
required added effort to design workarounds. Delayed requirements analysis gave the test
community inadequate requirements to test against. Additionally, the avionics group had
inadequate requirements to develop simulations and design criteria.
Figure 13 depicts the percent-spent and percent-complete analysis according to the WBS.
It shows three WBS elements with percent spent disproportionately more than percent complete.
These elements are software (SW in the figure), avionics, and integration assembly and test
(IA&T in the figure).

IAT.R 0471
32
Work Breakdown Structure (WBS) Performance _ % CompleteI & % Spent
10.0%
20.0%
30.0%
40.0%
50.0%
60.0%
70.0%
80.0%
90.0%
100.0%
WBS
%Comp 38.4% 58.6% 55.1% 39.9% 32.2% 100.0% 24.6% 15.2% 37.2% 45.8%
% Spent 40.1% 60.6% 55.1% 40.2% 32.5% 100.5% 31.7% 18.0% 21.6% 62.1%
KV Eng&A Seeker Propulsion Solid P Liquid P SW Avionics Mech S AI&T
1.2 1.2.1 1.2.2 1.2.3 1.2.3.1 1.2.3.2 1.2.4 1.2.5 1.2.6 1.2.7
Figure 13. WBS percent complete and percent spent [39].
The proposed corrective actions were to crash resources (system engineers) to the
software and avionics sections and a parallel effort to rewrite the test plans. The above analysis
shows a good chance of gaining schedule should this course of action work correctly. However,
the added engineers would have to gain efficiencies, or costs would continue to trend negative.
To see how dramatic the efficiency gain would have to be, DCMA ran an analysis of cost
and schedule variance by WBS, shown in Figure 14. For the software and avionics elements, the
schedule variance is worse than the cost variance. Corrective action shows promise for sufficient
efficiency gains in these areas, especially if the extra engineers charge by the hour of work
instead of charging full time to the program. On the other hand, the IA&T element had much
worse cost variance than schedule variance. The addition of bodies to parallel efforts has little
probability of gaining the efficiency needed to get this WBS element back on track. Further
analysis is needed to see how the contractor would accomplish these gains.

IAT.R 0471
33
Work Breakdown Structure (WBS) Performance
_ % of Total Cost & Schedule Variance
-100.0%
-80.0%
-60.0%
-40.0%
-20.0%
0.0%
20.0%
40.0%
60.0%
80.0%
100.0%
120.0%
140.0%
160.0%
WBS
CV%T -100.00% -21.33% 0.00% -6.64% -5.21% -1.42% -34.12% -27.96% 50.24% -60.19%
SV%T -100.00% -37.27% 0.00% 96.27% -62.11% 158.39% -76.40% -41.61% -16.77% -24.22%
KV Eng&A Seeker Propulsion Solid P Liquid P SW Avionics Mech S AI&T
1.2 1.2.1 1.2.2 1.2.3 1.2.3.1 1.2.3.2 1.2.4 1.2.5 1.2.6 1.2.7
Figure 14. Cost and schedule variance percentage by WBS [40].
Further DCMA analysis exposed that the IA&T team’s corrective action included a short-
term success that could ride out the wait for requirements analysis. Boilerplating test documents
with “To Be Determined” (TBD), enabled the team to take credit for work accomplished even
though it was still TBD, resulting in a false indication of positive schedule gain at very little cost.
In reality, the long-term prediction of future cost impact would be significantly more negative
due to the additional effort required to update and rework test plans. This rework plan would not
be successful.
This type of analysis can give PMs a fairly good idea if corrective action plans can
adequately address root causes of problems. It is detailed analysis, down to the WBS element
level. Leaders must also look at the big picture when considering solutions. Even if specific
corrective actions are successful, they might not have enough impact on overall cost and
schedule variances. In order to get an overall perspective, DCMA can provide an independent
estimate at completion.
Independent Estimate at Complete Analysis
The contractor is required to provide an estimate at complete (EAC) form showing the
predicted finish and cost of the program. A thorough estimate is normally developed every six
months from bottom–up, work-remaining estimates by the CAMs. These are usually the same
individuals who did the original proposal estimates. If original work packages were
underestimated, the probability is high that the remaining work will also be underestimated. As
contract scope changes, the subject tasks are estimated for an update to the EAC. The bottom line

IAT.R 0471
34
is that contractor’s EAC usually shows some bias. It is always a good idea for leaders to get an
independent EAC (IEAC) from DCMA on a regular basis. It provides an independent prediction
of completion to give PMs an idea of how the program is progressing. When developing
solutions to problems, the IEAC shows whether corrective actions will have significant results on
the program as a whole. The IEAC helps answer and focus these types of questions:
How will the projected estimated budget or over budget needed to complete thecontract compare with the available funding?
Are the Contractor’s performance improvement assumptions used to developContractor EAC reasonable, based on demonstrated performance and knownProgram challenges?
Do the performance risk reductions implemented by the Contractor support theperformance improvement assumptions?
Why is the DCMA Independent Estimate At Complete (IEAC) a more likelytarget than the Contractor’s EAC?
Do the most likely IEAC trend estimates indicate a predicted futureimprovement?
An EVM analysis, combined with information about the prime and subcontractor in-plant
conditions, helps validate the DCMA IEAC.
The DCMA analysis uses EVM data in concert with knowledge of the work environment
inside the plant (prime and subcontract level) to derive the IEAC. It includes a reasonableness
evaluation of the contractor’s EAC. If current cumulative or period performance indicators do
not support the contractor’s CPI and no program events should dramatically change
performance, then the contractor’s EAC may be questionable. In contrast, if the contractor’s
EAC seems reasonable, DCMA will validate this reasonableness. Leaders should expect a
relative-difference explanation between the two estimates.
The IEAC is developed from the current actual, cumulative cost of a program plus an
estimate of the cost to perform the remaining work. The estimate of cost on remaining work is
based on the performance capability demonstrated by the contractor and other risks with
probable cost impact on the program. The periods of performance are evaluated for explainable
curve shapes and predictive trends that correlate with program events, activities, and risks. A
performance factor that best represents the program operational environment is applied to the
remaining tasks.
IAT.R 0471
35
A period performance analysis helps to establish an optimum performance factor to apply
to the remaining work. This is done to capture the relative trends of work efficiency by the
contractor. Trades are made between the quantity of historical data points used to derive
estimates (the larger the number of valid points, the greater the accuracy) and knowledge of the
program, which includes performance issues (failures requiring redesign or retrofit), change in
type of objective tasks (from design to test or production), manufacturing problems, and
subcontractor issues (performance or delivery). Should the data show a random pattern of period
performance, it usually indicates poor management control. Straight-line estimates then become
less predictable. Thus, the shape of the period performance data curve is an important element of
estimating IEAC. So how does DCMA determine the shape of the data curve? Through
weighting of various factors that impact the cost and schedule performance of a program.
The weight given to schedule in the performance factor used to develop the IEAC may
depend on critical path issues and the root cause of schedule variance. The weight given to the
cost portion of the factor may be influenced by the ability to design workaround corrective
actions to recover CV and the probability that the corrective action will be effective. If added
resources will be required to improve schedule slippage risks, additional schedule performance
factors will become part of the equation. Program details from root-cause analysis and
experienced judgment allow reasonable weighting of various factors used to estimate the IEAC.
Once DCMA determines the appropriate factor weights, EVM analysis is combined with the
program knowledge and experience to determine an IEAC.
As a program travels through its lifecycle, the goal of PMs should be to have an IEAC
that never changes. This would mean that the program plan is accurate and the contractor has no
problems. However, such an occasion is rare indeed in the real world. A normal DoD acquisition
program is complex and carries risk, so a more likely scenario is a changing IEAC. It is
important to note that a changing IEAC does not indicate inaccuracy. Too often, leaders blame
the EVMS itself, claiming it needs to be certified again. A changing IEAC is a red flag that
should prompt leaders to take action (remember, the M in EVM stands for management). The
goal is to implement management initiatives that reduce the IEAC to a value consistent with the
target budget at complete (BAC) and baseline end date.
Example: Let’s take a look at an example using data from our ACAT II program. The
program was running a CPI around 0.90, indicating that work was not as efficient as predicted.

IAT.R 0471
36
Additionally, the PM was instructed to cut schedule because the decision to progress to the next
phase of the program had been accelerated by three months. After determining root cause, the
PM decided to take numerous actions, to include combining tests, cutting scope, moving work
in-house (less expensive labor), and narrowing performance solutions to a manageable set of
possibilities.
Figure 15 shows the various estimates at completion during these corrective actions. The
bottom line (least cost) indicates the original BAC, set at $248 M. The next highest curves show
the contractor’s latest revised estimate (i.e., EAC) and DCMA’s minimum estimate at
completion. The highest curves (most cost) are DCMA’s most likely IEAC, based on a three-
month moving average and the fourth-order polynomial regression forecast IEAC based on the
PM’s corrective actions. Notice that the contractor’s EAC was originally much lower than the
DCMA IEAC. Further, the contractor predicted significant improvements in the first month of
the recovery plan. Such significant recoveries in such a short period are highly unlikely and
should be suspect. The DCMA IEAC follows a more likely recovery with sustainable progress
over the next ten months. The most likely curve is based on the three-month moving average and
the forecasted IEAC curve, which appear to be converging as the contract nears completion.
Independent Estimate At Complete (IEAC) (Burdened) =Most Likely (LRE/BAC/Min/Median & Most Likely)
y = -83.343x3 + 305796x2 - 4E+08x + 2E+11
R2 = 0.9603
$247
$252
$257
$262
$267
$272
$277
Month
m$
Min $254,409 $252,296 $251,240 $252,033 $251,586 $251,701 $252,851 $251,946 $251,745 $251,654
Most Likely $273,515 $272,506 $265,546 $262,792 $259,055 $258,769 $256,422 $257,823 $256,248 $259,496
BAC $248,441 $248,441 $248,441 $248,441 $248,441 $248,319 $248,319 $248,319 $248,319 $248,319
LRE $255,832 $250,406 $251,965 $251,965 $251,965 $251,965 $251,965 $251,965 $251,965 $251,965
Jun-03 Jul-03 Aug-03 Sep-03 Oct-03 Nov-03 Dec-03 Jan-04 Feb-04 Mar-04
4th order Polynomial Regression
Trend line - Focast
Most Likely= IEAC based on Past 3MO
CPI Avg -Cost Performance
Figure 15. Estimates at completion [41].
This is an example of the management team implementing very successful cost-recovery
actions, and the IEAC value was adjusted to reflect success. CPI and SPI analysis supports this
improvement activity over this time period. Figure 16 shows a significant improvement in period
CPI, but not such a significant improvement in the cumulative CPI. Because the contract was

IAT.R 0471
37
nearing completion, cumulative CPI changed only slightly (0.92 to 0.94 over an 18-month
performance).
Cost Performance Indication (CPI) Analysis
y = -0.0007x3 + 2.6147x2 - 3248.2x + 1E+06
R2 = 0.8883
0.600
0.800
1.000
1.200
1.400
1.600
1.800
2.000
Performance Period
CP
I
CPI Period 0.824 0.632 0.920 0.868 0.765 1.050 0.949 0.948 0.939 1.099 1.183 1.196 1.630 1.597 1.958 1.284 1.277 1.544
CPI CUM 0.918 0.909 0.905 0.905 0.901 0.905 0.906 0.906 0.907 0.910 0.914 0.917 0.923 0.927 0.933 0.936 0.939 0.942
CPI Period 3 Mo Avg 0.90 0.75 0.79 0.80 0.85 0.90 0.93 0.98 0.95 0.99 1.06 1.15 1.29 1.46 1.71 1.56 1.45 1.33
O-02 N-02 D-02 J-03 F-03 M-03 A-03 M-03 J-03 J-03 A-03 S-03 O-03 N-03 D-03 J-04 F-04 M-04
CPR CUM
CPI Period
CPI Period
Trend
CPI Period
3Mo Avg
Trend
CPI Period3mo Run Avg
Figure 16. CPI and SPI [42]
In this case, cumulative CPI would not be representative of projected performance of the
remainder of the contract. The period CPI was not consistent enough to yield an accurate
estimate. The three-month running average of period CPIs proved to be the most appropriate
under these conditions to give the most likely and accurate IEAC.
These examples showed how DCMA can give leaders a quick estimate on the probability
of success for corrective actions using EV analysis. It is important for leaders to understand what
analysis is available and how to manage the efforts in order to make timely decisions. Using the
techniques discussed thus far, leaders can identify problems early, pinpoint root causes, and
develop solutions that have a good probability of correcting issues. The next section takes a look
at the resources available to implement corrective actions.
Analysis of Required Resources
Once corrective action plans are identified, leaders need to ensure there are required
resources available with which to implement the plans. Two important resources are money and
people. This section provides examples of how DCMA can assist PMs in analyzing these two
resources using the remaining billing plan and staffing profile.

IAT.R 0471
38
Remaining Billing Plan
In these times of tight fiscal constraints, PMs need to ensure that enough money is
available to cover all courses of action. The question that can focus analysis toward this goal is:
What is the funding liquidation profile for future months that will ensure money is available to
pay vouchers? The contractor’s remaining billing plan can assist in answering this question.
The contractor’s planned funding commitment (i.e., baseline program budget), contract
cancellation cost, and planned billing for future months are all contained in the remaining billing
plan. Notice that this plan covers all courses of action including cancellation and its respective
costs. These figures can be evaluated for continuity with the program progress and past
performance and history to determine if they are reasonable. The program planned billings,
commitments, and termination costs are all budget liabilities and estimated expenditures which
directly affect a program’s cost and money flow. DCMA can provide analysis of the remaining
billing plan to ensure enough funds to cover corrective actions are available. This also provides
PMs reasonable data from which to update plans for obligations and disbursements.
Example: Figure 17 shows the billing profile for a contract with duration of
approximately one year, scheduled for completion at the end of the calendar year 2004. The chart
curves appear to be appropriate: expected billing is tracking expected spending, termination
costs are tapering to the month prior to completion, and open commitments are sloping to none
by the close of the contract. The minimal incremental variations from period to period is
characteristic of a labor-intensive contract, with few hardware deliveries or events that may show
as step variations on the curve (when EV is claimed and the government billed or open
commitments claimed).
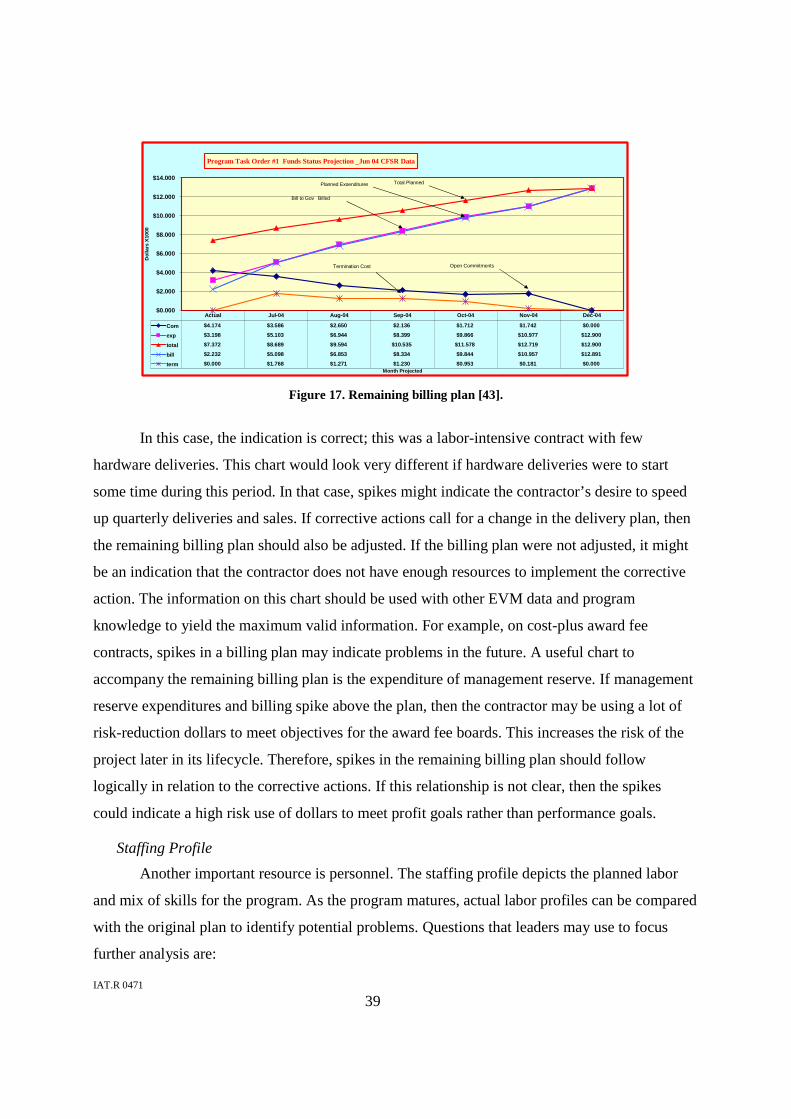
IAT.R 0471
39
Program Task Order #1 Funds Status Projection _Jun 04 CFSR Data
$0.000
$2.000
$4.000
$6.000
$8.000
$10.000
$12.000
$14.000
Month Projected
Do
lla
rsX
10
00
Com $4.174 $3.586 $2.650 $2.136 $1.712 $1.742 $0.000
exp $3.198 $5.103 $6.944 $8.399 $9.866 $10.977 $12.900
total $7.372 $8.689 $9.594 $10.535 $11.578 $12.719 $12.900
bill $2.232 $5.098 $6.853 $8.334 $9.844 $10.957 $12.891
term $0.000 $1.768 $1.271 $1.230 $0.953 $0.181 $0.000
Actual Jul-04 Aug-04 Sep-04 Oct-04 Nov-04 Dec-04
Total Planned
Open Commitments
Planned Expenditures
Bill to Gov Billed
Termination Cost
Figure 17. Remaining billing plan [43].
In this case, the indication is correct; this was a labor-intensive contract with few
hardware deliveries. This chart would look very different if hardware deliveries were to start
some time during this period. In that case, spikes might indicate the contractor’s desire to speed
up quarterly deliveries and sales. If corrective actions call for a change in the delivery plan, then
the remaining billing plan should also be adjusted. If the billing plan were not adjusted, it might
be an indication that the contractor does not have enough resources to implement the corrective
action. The information on this chart should be used with other EVM data and program
knowledge to yield the maximum valid information. For example, on cost-plus award fee
contracts, spikes in a billing plan may indicate problems in the future. A useful chart to
accompany the remaining billing plan is the expenditure of management reserve. If management
reserve expenditures and billing spike above the plan, then the contractor may be using a lot of
risk-reduction dollars to meet objectives for the award fee boards. This increases the risk of the
project later in its lifecycle. Therefore, spikes in the remaining billing plan should follow
logically in relation to the corrective actions. If this relationship is not clear, then the spikes
could indicate a high risk use of dollars to meet profit goals rather than performance goals.
Staffing Profile
Another important resource is personnel. The staffing profile depicts the planned labor
and mix of skills for the program. As the program matures, actual labor profiles can be compared
with the original plan to identify potential problems. Questions that leaders may use to focus
further analysis are:

IAT.R 0471
40
Is the labor actual staffing on target for the program planned execution burn rate?
Is the type labor appropriate for the current tasks being performed in theStatement of Work (SOW) and WBS?
The staffing profile not only shows the ability of the contractor to provide adequate
workforce to execute the contract, but also provides insight into the type of functional labor that
is being staffed. The functional charts complement the staffing profile chart in analysis of labor-
related root-cause issues. Short staffing of a credible plan normally indicates risk of future SV or
future dependence on tasks occurring later in the network schedule that have variance issues.
Overstaffing a credible plan usually will result in CV, and may have a root cause in unforeseen
technical issues or underestimated WPs. Therefore, the staffing profile can be used to identify
future problems, or as a check on the appropriate level and mix of personnel to work corrective
actions.
Example: Figure 18 represents a program staffing profile. The program staffing chart
shows understaffed conditions through June and July 2004 and conditions approaching the
estimated head count by the end of August 2004. For budgetary reasons, the program was forced
to draw down the staffing to only the core key members of the work force. The program
expected follow-on contracts for the new phase of the program that would require the key
individuals to ramp to the new contract requirements. Delays in funding have stretched the
timeline with no new funding.
Program Manpower Chart
0.0
2.0
4.0
6.0
8.0
10.0
12.0
14.0
16.0
18.0
20.0
22.0
24.0
26.0
28.0
30.0
Report Week
Eq
uiv
ale
nt
Hea
ds
ACTUALS 24.5 23.6 19.0 18.0 14.6 11.3 14.4 13.1 13.5 15.8 14.8 17.7 17.3
ETC 27.8 27.8 27.8 27.8 26.4 26.4 26.4 26.4 18.2 18.2 18.2 18.2 18.2 17.9 17.9 17.9 17.9 0.0
4-Jun 11-Jun 18-Jun 25-Jun 2-Jul 9-Jul 16-Jul 23-Jul 30-Jul 6-Aug 13-Aug 20-Aug 27-Aug 3-Sep 10-Sep 17-Sep 24-Sep 1-Oct
Figure 18. Staffing profile [44].

IAT.R 0471
41
This is not an atypical picture for a DoD program under budgetary pressures. As funding
is squeezed, leaders must understand the impact to their program. As one could expect from this
type of staffing profile, the program began to slip behind schedule. However, the severity of the
impact of understaffing on the schedule slip cannot be determined from this aggregate staffing
profile. For this, a breakout by functional or skill level is needed.
Figure 19 represents the engineer staffing profile. It is important to note that engineers
comprise approximately 87 percent of the entire core team for the program. The chart shows
similar characteristics of the aggregate staffing profile. The number of engineers on the program
was less than planned. It will be very difficult to complete this program on schedule. Moreover,
technical issues that arise will be hard to mitigate. The choices for corrective actions are few.
However, a more detailed analysis of similar functional staffing charts could bring the program
capability and funding requirement into better focus. The program could be sharing engineering
expertise from another program on an as-needed basis. Some engineering work, such as reports
and studies of experiments, could be brought in-house and completed by government engineers.
There are some options for PMs. By channeling analysis efforts on the staffing profiles, leaders
can assess what might work and, more importantly, what definitely will not work.
Engineering Manpower
0.0
2.0
4.0
6.0
8.0
10.0
12.0
14.0
16.0
18.0
20.0
22.0
24.0
26.0
Report Week
eq
uiv
lian
tH
ea
ds
ACTUALS 21.2 20.6 15.9 14.1 12.0 9.8 12.4 10.5 10.2 12.6 11.2 15.0 14.7
ETC 23.7 23.7 23.7 23.7 22.4 22.4 22.4 22.4 14.9 14.9 14.9 14.9 14.9 14.3 14.3 14.3 14.3 0.0
4-Jun 11-Jun 18-Jun 25-Jun 2-Jul 9-Jul 16-Jul 23-Jul 30-Jul 6-Aug 13-Aug 20-Aug 27-Aug 3-Sep 10-Sep 17-Sep 24-Sep 1-Oct
Figure 19. Engineer staffing profile [45].
The EVM analysis portion of the framework covered analysis strategies, assessing the
overall health of a program, identifying root causes of problems, developing solutions, and
analysis of required resources. The basis of the analysis is a validated EVMS with continual

IAT.R 0471
42
preventive maintenance checks to ensure the data is reliable. The last major segment of the
framework provides a method by which leaders can scope the EVM efforts. When coupled with
the analysis techniques described above, it provides an excellent tool to make informed
decisions.
Scoping Earned Value Management Efforts: Streamlining Cost, Schedule, and
Performance Analysis to Significant Work Packages
So far, this paper has focused primarily on the cost and schedule aspects of programs. It
has dedicated space to the reliability, validity, and predictive nature of cost and schedule data
used by leaders to make decisions on strategic programs. However, there is a third aspect of
programs that leaders must balance: technical performance. This is especially true for programs
in their development phases. Leaders use tools such as risk management plans, technical
performance measures (TPMs), and key performance parameters (KPPs) to manage the technical
maturity of programs. With this voluminous set of data flying at leaders, it is easy to be
overwhelmed. This segment provides a technique leaders can use to streamline data and integrate
the three aspects of cost, schedule, and performance into a manageable form.
The objective of integrating these factors is not new. Many studies have been conducted
to determine the best way of accomplishing this task. Most of these, such as the Navy’s
Technical Performance Measurement System study conducted by Program Executive Office for
Air ASW, Assault, and Special Mission Programs, used TPM management as the base and
applied EV techniques when necessary [46]. The methodology explained below is different, in
that it uses all three aspects to determine what work packages to analyze, and then combines the
features into one simple chart for the decision maker.
The first step in this process in to narrow down the number of work packages for review
to the most critical set. A good rule of thumb as to how far down the WBS to start your
segregation is the fourth level of the WBS. This provides enough detail to determine root causes
without overloading decision makers with too much data. Once the list of WBS elements down
to the fourth level is compiled, then evaluate each of these elements for their impact on cost,
schedule, and performance. A good set of evaluation criteria to accomplish this is:
Key Performance Parameter (KPP): Does this WBS element affect a KPP?
TPM: Does this WBS element influence a TPM?
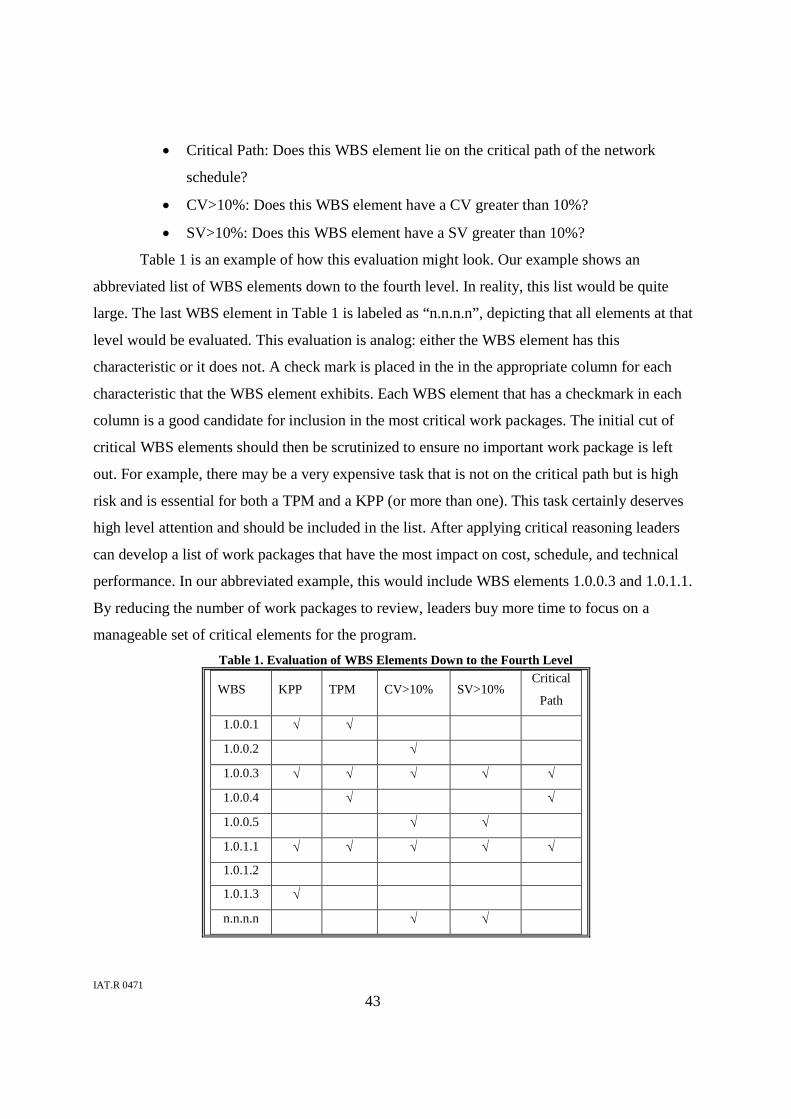
IAT.R 0471
43
Critical Path: Does this WBS element lie on the critical path of the network
schedule?
CV>10%: Does this WBS element have a CV greater than 10%?
SV>10%: Does this WBS element have a SV greater than 10%?
Table 1 is an example of how this evaluation might look. Our example shows an
abbreviated list of WBS elements down to the fourth level. In reality, this list would be quite
large. The last WBS element in Table 1 is labeled as “n.n.n.n”, depicting that all elements at that
level would be evaluated. This evaluation is analog: either the WBS element has this
characteristic or it does not. A check mark is placed in the in the appropriate column for each
characteristic that the WBS element exhibits. Each WBS element that has a checkmark in each
column is a good candidate for inclusion in the most critical work packages. The initial cut of
critical WBS elements should then be scrutinized to ensure no important work package is left
out. For example, there may be a very expensive task that is not on the critical path but is high
risk and is essential for both a TPM and a KPP (or more than one). This task certainly deserves
high level attention and should be included in the list. After applying critical reasoning leaders
can develop a list of work packages that have the most impact on cost, schedule, and technical
performance. In our abbreviated example, this would include WBS elements 1.0.0.3 and 1.0.1.1.
By reducing the number of work packages to review, leaders buy more time to focus on a
manageable set of critical elements for the program.
Table 1. Evaluation of WBS Elements Down to the Fourth Level
WBS KPP TPM CV>10% SV>10%Critical
Path
1.0.0.1
1.0.0.2
1.0.0.3
1.0.0.4
1.0.0.5
1.0.1.1
1.0.1.2
1.0.1.3
n.n.n.n

IAT.R 0471
44
Once the set of critical WBS elements is established, leaders can then analyze the cost,
schedule, and technical performance of each element. To facilitate this analysis, a clear, concise
chart that captures all pertinent data is useful. Figure 20 is an example of this type of chart. The
figures on this chart are fabricated to protect proprietary rights of the program. Let’s examine its
components. The chart is labeled with the name of the work package, the WBS number, and the
date of the reporting period. The top section of the chart contains EVM analysis numbers for the
current month, cumulative to date, and estimates at completion given the progress of the work
package. These are the raw EV analysis numbers. Some leaders might have favorite analysis
numbers or indices that they might want to see in this section. These are the quick-look
indicators of the progress of the work package, and should be used as flags for more in-depth
analysis if needed. More important are the assessment of trends and assessment of variance
analysis. These are provided in the upper right quadrant (Cumulative Trend & Projection
Assessment) and lower left quadrant (DCMA Engineer Assessment of Variance Analysis),
respectively. The trend and projection assessment provides an evaluation of performance for the
last three months and a projection of where the indices will head given the current work
situation. The variance assessment provides reasons for or possible root causes of any variances
as well as an assessment of correct action impacts. The last cell of this section is a general,
overall observation of the work package and the recommended action plans.
These sections give an excellent evaluation of the cost and schedule health of the work
package. The final section, in the lower right quadrant of the chart, provides the integration of
technical performance of the work package. This engineer assessment and analysis has the
following areas:
Technical Maturity: An assessment of the technical maturity of the work package
Overtime: A judgment of how much overtime and management reserve is being
applied to the work package. This is a telling indicator.
Work to Go: An assessment of the percent complete and percent spent, with
explanations for differences.
TPM: An assessment of the impact this work package has on TPMs and analysis
of progress. This could link to any additional TPM charts necessary.
Efficiency Factors: An analysis of the corrective actions and risk management
actions taken thus far for the work package.
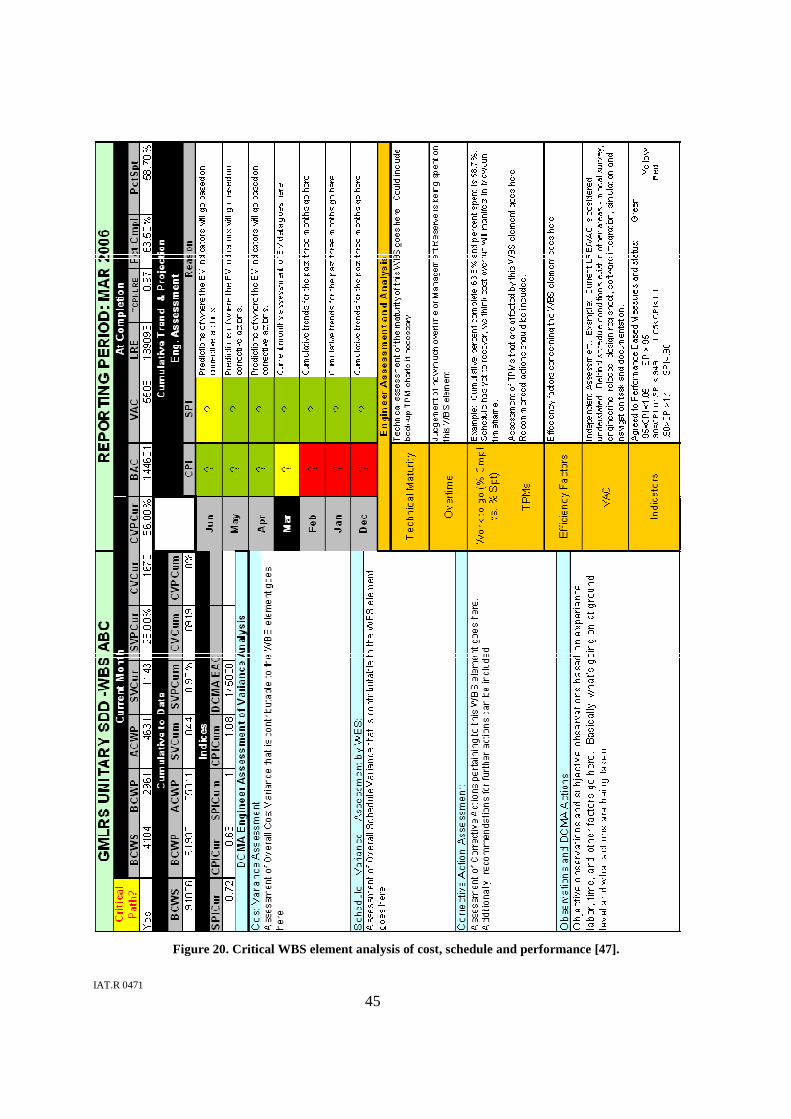
IAT.R 0471
45
Figure 20. Critical WBS element analysis of cost, schedule and performance [47].

IAT.R 0471
46
Variance at completion: An independent assessment of variances at completion
that are or could be caused by the technical performance of this work package.
Indicators: The program performance metrics for these work packages and their
status.
This area of the chart provides an excellent view of how the work package is progressing
technically. It is not a substitute for good performance risk management techniques such as
TPMs. Rather it is a compilation of the data resultant from these processes. When coupled
together with the cost and schedule analysis, leaders have a comprehensive snapshot of the
progress of the most critical work packages. This is an exceptional tool for use by leaders on a
monthly basis or at every program review. It ties together all important aspects of a program and
facilitates a more detailed discussion of issues if needed. This leads to proactive management of
the program.
The framework for EVM provides PMs timely information with which to make strategic
decisions. It does this by providing tools that leaders can use to manage the EV analysis. The
first portion of the framework ensures the reliability of the data. Used on a continual basis,
leaders can be confident that the analysis produced by their team comes from valid data. The
second portion provides a closed-loop process for analyzing the EV data. Leaders can use these
tools to focus efforts to assess the program and determine root causes of issues, decide on
solutions, and then reshape the analysis strategy on a continual basis. The last portion provides a
way for leaders to scope their EVM efforts and integrate these techniques with performance
assessments of the most critical work packages.
Conclusions and Recommendations
Today’s military faces huge budget challenges. We are fighting a global war on terrorism
while transforming our forces for the future. This places enormous strains on our defense dollars.
As a result, there is continuous pressure to cut, change, or modify major defense acquisition
programs. Strategic decisions of this magnitude should be based on timely, objective data. This
research paper provides leaders with a guide for making strategic decisions on major defense
programs using EVM as a base. It supplies tools with which leaders can proactively manage
programs and ensure there are no surprises. It provides a framework to focus earned value efforts
and describes what types of analysis are available for leaders. The purpose is to obtain the most

IAT.R 0471
47
accurate and timely data with which leaders can make informed strategic decisions. To maximize
the efficiency of EVM, the following recommendations are provided.
Tailor EVM Efforts
There are many types of EVM techniques that can be used on a program. Leaders should
tailor their approach to the type of program they are managing and according to their leadership
style. The framework presented in this paper incorporates the essential elements of any good
EVM program. (See Figure 21) First, the data obtained from the EVMS must be valid and
reliable. This is not a fire-and-forget process. Once a contractor’s EVMS is certified, it must be
continually monitored for validity. Second, leaders must develop and use a proactive
management process for analyzing the EV data that is generated. This paper is structured to
supply leaders with the types of questions they might want to ask to assist in this process.
Without planning these efforts up front, EVM has the possibility of becoming a reporting process
of old data and therefore, irrelevant. To be predictive, leaders must understand the tools they
have, maximize their use, and have a clear intent on the purpose of EVM. Finally, leaders should
strive to combine the analysis of cost and schedule with the technical performance. These three
aspects form the triad of every program, and should not be assessed in isolation. Leaders must
find a good balance between all three.
Figure 21. EVM framework structure.
SECTION 2
Continuous EVMS Health Assessments
Scope EVM
Efforts &
Integrate
Technical
SECTION 1
SECTION 3Act
Decide
Assess
Plan Assessment
Overall Health
Identify Root Causes
Develop Solutions
Analyze Resources
Corrective Actions
Update Strategy

IAT.R 0471
48
Make DCMA Part of the Team
DCMA is a valuable resource for a PM. DCMA personnel are located in the plant and
provides the eyes and ears forward where the contractor is performing. Their network of
personnel enables them to provide insight of not only the prime contractor, but also on the
subcontractors. Too many times, PMs do not understand what DCMA can provide. This paper,
albeit a paper on EVM techniques, was written from a DCMA perspective. It provided what
DCMA contributes to the team if fully utilized. PMs should incorporate DMCA personnel into
the PMO team. This includes setting performance goals, objectives, and expected deliverables
for DCMA. By providing a clear intent and end state, leaders can focus DCMA efforts to provide
predictive analysis. The more they understand what is expected, the better DCMA can take the
initiative to provide timely data for leaders.
Make Timely Decisions
It is important to make timely decisions. The earlier issues are found and resolved, the
less the expense. Despite being around for many years, the EVM process still is not completely
understood by all whom use it. As a result, DoD still struggles to keep weapon system projects
within budget. The purpose of this paper is to provide a construct for making strategic decisions
in DoD acquisition using EVM. It is assembled in the form of a reference book for ease of use.
By correctly identifying and planning EVM efforts, PMs can make timely decisions. If leaders
do not proactively use EVM, then many defense dollars are at risk of being inefficiently used.
This is a risk that our soldiers cannot afford. Leaders must make the hard decisions early in the
program lifecycle. The framework presented in this paper provides them a method for making
these decisions. As the old car mechanic said, “you can pay me now, or pay me later.” In today’s
high operational tempo environment, our forces cannot risk “paying later” through additional
dollars for over budget programs or by waiting for the essential capabilities of programs that are
late to get to the battlefield.

IAT.R 0471
49
Appendix A: Leader’s Quick Reference Guide to EVM
I. Validating a DoD contractor’s EVM System
A. Leader Focus Questions
Is the data used to manage the program by the contractor credible?
Is the contractor EVMS data used by DCMA and PMO EVMS experts to predict
risks and by the PM to make major program decisions valid?
Are the systems processes used to collect EVMS data adequate (does the process
work and are the process procedures followed)?
What is the risk that OH and labor rates will drive program cost variance (CV)?
B. Analysis Products:
1. EVMS Validation and Certification
2. EV Joint Surveillance
3. Systems Risk Assessment
II. Assessing the Overall Health of a Program
A. Leader Focus Questions
What is the program cost and schedule performance health?
Is the program overall performance improving?
How do cost and schedule issues affect each other?
If there are program-level concerns, what are quantitative cost and scheduleperformance relationships?
What future performance impacts do the predictive trends indicate if correctiveactions are not implemented?
Should reprogramming or rescheduling be considered by the PMO to develop arealistic measurable baseline?
B. Analysis Products
1. Cumulative Cost Performance Index (CPI)
2. Cumulative Schedule Performance Index (SPI)

IAT.R 0471
50
III. Identifying Root Causes of Problems
A. Leader Focus Questions for Functional Teams
How are the program functional teams performing?
How do the functional dollars contribute to the program variance?
What percentage of program variance is driven by the functional team?
Are functional team performance trends indicating consistency, product issues or
flow down impact?
What are the interactions (drive verses driven) of functional and IPT (product)
team variances?
Is the functional performance related to staffing or performance issues?
What are the functional cost and schedule relationships of which the PMO should
be aware?
What future functional performance impacts do predictive trends indicate if
corrective action is not implemented?
B. Analysis Products
1. Functional Team Cost Performance
2. Functional Team Schedule Performance
C. Leader Focus Questions for Integrated Product Teams
How are IPTs performing?
What are the IPT dollar contributions to the program variance?
What percentage of program variance is driven by the IPT?
Are IPT performance trends indicating consistency, product issues or flow downimpact?
What are the cost and schedule relationships of which the PMO should be aware?
If there are program-level concerns, what is quantitative cost and schedule dollarrelationship to performance?
What future performance impacts do IPT predictive trends indicate, if correctiveaction is not implemented?
IAT.R 0471
51
D. Analysis Products
1. Integrated Product Team Cost Performance
2. Integrated Product Team Schedule Performance
E. Leader Focus Questions for Subcontractors
How much subcontractor oversight focus should be applied to a specificsubcontract effort?
How fast are subcontract issues developing?
Are the subcontractor issues related to cost, schedule, or performance?
What are the subcontract dollar contributions to the Program variance?
Are variances recurring with possible unit cost impacts or non recurring spikes?
Are subcontractor schedule variances on the critical path and does the schedulevariance exceed the master schedule critical path slack before impact ondependent tasks?
F. Analysis Products
1. Subcontractor Cost Performance
2. Subcontractor Schedule Performance
IV. Developing Solutions
A. Quick Check on Probability of Recovery Leader Focus Questions
What are the quick-glance chances of cost and schedule recovery?
What are the interactions (drive versus driven) of other product variances?
Is the functional performance related to staffing or performance issues?
Based on budgeted resources used and task progress, what type of correctiveactions should be considered?
How critical is the corrective action timing to preventing future performanceimpacts?
IAT.R 0471
52
B. Analysis Products
1. Percent-Complete Analysis
2. Percent-Spent Analysis
C. Estimate at Complete Leader Focus Questions
How will the projected estimated budget or over budget needed to complete thecontract compare with the available funding?
Are the contractor’s performance improvement assumptions used to developcontractor EAC reasonable, based on demonstrated performance and knownprogram challenges?
Do the performance risk reductions implemented by the contractor support theperformance improvement assumptions?
Why is the DCMA independent estimate at complete (IEAC) a more likely targetthan the contractor’s EAC?
Do the most likely IEAC trend estimates indicate a predicted futureimprovement?
D. Analysis Product: Independent Estimate at Complete Analysis
V. Analysis of Required Resources
A. Leader Focus Questions
What is the funding liquidation profile for future months that will ensure moneyis available to pay vouchers?
Is the labor actual staffing on target for the program planned execution burnrate?
Is the type labor appropriate for the current tasks being performed in thestatement of work (SOW) and WBS?
B. Analysis Products
1. Remaining Billing Plan
2. Staffing Profile

IAT.R 0471
53
References
1. Army Chief of Staff, GEN Peter J. Schoomaker, “Bitter Lessons of Unpreparedness,” Army2006-07 Green Book, p.24, October 2006.
2. Office of the Secretary of Defense for Force Transformation, numerous articles,http://www.oft.osd.mil, (accessed October–November 2006).
3. Schoomaker, p. 26.
4. Winslow T. Wheeler, “The Mess in the Defense Budget: Congress Helped Make It. Will ItHelp Fix It?” http://www.motherjones.com/news/special_reports, (accessed 7 October 2006).
5. Office of Management and Budget, The Executive Office of the President, FY 2005Department; http://www.whitehouse.gov/omb/busget/fy2005/defense.html, (accessed 4October, 2006).
6. Fred Kaplan, “Defense Budget 101: How much are we really spending?”Washingtonpost.Newsweek Interactive Co. LLC, http://www.slate.com/id/2135553, (accessed12 October 2006).
7. Assistant Secretary of the Army (Financial Management and Comptroller), Valerie LynnBaldwin, “The Cost of the Army,” Army 2006-07 Green Book, p. 46’ October 2006.
8. Department of Defense news release: “DoD releases Selected Acquisition Reports,” DefenseAT&L, July–August, 2006,http://www.findarticles.com/p/articles/mi_m0QMG/is_4_35/ai_n16619393, (accessed 27September 2006).
9. Quentin W. Flemming and Joel M. Koppelman, “The Earned Value Body of Knowledge,”Proceedings of the 30th Annual Project Management Institute 1999 Seminars & SymposiumPhiladelphia, Pennsylvania, Papers Presented October 10 – 16, 1999.
10. LTCDR Vic D. Blanco, “Earned Value Management…A Predictive Analysis Tool,”Newsletter – United States Naval Supply Corps, p. 17, March/April 2003.
11. Flemming.
12. Deborah Tomsic, “Earned Value Management: DoD Implements Policy Improvements,”Contract Management, p. 30, October 2005.
13. Department of Defense Instruction 5000.2, Operation of the Defense Acquisition System,Washington D.C.: Department of Defense, Section 111.3.1, 12 May 2003.
14. Acting Under Secretary of Defense for Acquisition, Technology and Logistics, Michael W.Wynne, Policy Memorandum, Revision to DoD Earned Value Management Policy, 7 March2005.
15. Tomsic, p. 31.
16. David S. Christensen, Ph.D., “The Costs and Benefits of the Earned Value ManagementProcess,” Acquisition Review Quarterly, p. 380, Fall 1998.

IAT.R 0471
54
17. Eleanor Haupt, “Tailoring Earned Value Management,” briefing slides for the UnderSecretary for Acquisition, Technology and Logistics, Washington DC, 2 June 2002.
18. Sean Alexander, Meridian Consulting Group, INC., “Earned Value Management Systems(EVMS),” briefing slides for the Project Management Institute, Washington, DC Chapter, 1June 2002.
19. Christensen, p. 382.
20. David S. Christensen, Ph D., “Cost Overrun Optimism: Fact of Fiction?”, AcquisitionReview Quarterly, p. 29, Winter 1994.
21. Under Secretary of Defense for Acquisition and Technology, Paul G. Kaminski, PolicyMemorandum, Compliance responsibility for the Cost/Schedule Control Systems Criteria(C/SCSC), 1 October 1996.
22. Rebecca Davies, Executive Director of Contract Operations and Customer Relations,Defense Contract Management Agency, telephone interview by author, 23 October 2006.
23. Defense Contract Management Agency, Department of Defense Earned ValueImplementation Guide, October 2006, section 2.3.2.3.
24. National Defense Industrial Association, Program Management Systems Committee,ANSI/EIA-748-A Standard for Earned Value Management Systems Intent Guide, January2005 Edition, pgs. 3–40.
25. Eugene Gholz and Peter Dombrowski, Buying Military Tran$formation. (New York,Columbia University Press, 2006), pgs 16–33.
26. Neil Wittmeir, Defense Contract Management Agency, Program Integrator, PAC-3,interview by author, 6 November 2006.
27 Defense Contract Management Agency, Lockheed Martin, Dallas, Systems Risk AssessmentReport, November 2005.
28 Defense Contract Management Agency, Lockheed Martin, Dallas, EVM Chart and DataAnalysis of an ACAT I Missile Program, 2003–2004.
29 Ibid.
30 Defense Contract Management Agency, Lockheed Martin, Dallas, EVM Functional Chartand Data Analysis of an ACAT II Program, 2003–2004.
31 Ibid.
32 Ibid.
33 Ibid.
34 Defense Contract Management Agency, Lockheed Martin, Dallas, EVM Integrated ProductTeam Chart and Data Analysis of an ACAT II Program, 2003–2004.
35 Defense Contract Management Agency, Lockheed Martin, Dallas, EVM Fire Unit Chart andData Analysis of an ACAT II Program, 2003–2004.

IAT.R 0471
55
36 Defense Contract Management Agency, Lockheed Martin, Dallas, EVM Missile, LaunchPod, Container Chart and Data Analysis of an ACAT II Program, 2003–2004.
37 Defense Contract Management Agency, Lockheed Martin, Dallas, EVM Subcontractor Chartand Data Analysis of an ACAT II Program, 2003–2004.
38 Ibid.
39 Defense Contract Management Agency, Lockheed Martin, Dallas, EVM Work BreakdownSchedule Chart and Data Analysis of an ACAT I Program, 2005–2006.
40 Ibid.
41 Defense Contract Management Agency, Lockheed Martin, Dallas, Independent Estimate atCompletion Chart and Data Analysis of an ACAT II Program, 2003–2004.
42 Defense Contract Management Agency, Lockheed Martin, Dallas, EVM Chart and DataAnalysis of an ACAT II Program, 2003–2004.
43 Defense Contract Management Agency, Lockheed Martin, Dallas, Budget Chart and DataAnalysis of an ACAT II Program, 2004.
44 Defense Contract Management Agency, Lockheed Martin, Dallas, Staffing Chart and DataAnalysis of an ACAT II Program, 2004-2005.
45 Defense Contract Management Agency, Lockheed Martin, Dallas, Engineer Staffing Chartand Data Analysis of an ACAT II Program, 2004–2005.
46. N. D. Pisano, CDR, US Navy, Technical Performance Measurement, Earned Value, andRisk Management: An Integrated Diagnostic Tool for Program Management, Anti-Submarine Warfare Systems Project Office Washington DC, 1 June, 2002.
47 Defense Contract Management Agency, Lockheed Martin, Dallas, Critical WBS ElementAnalysis of an ACAT I Missile Program, 2006.

IAT.R 0471
56