seminar 1st semister
TRANSCRIPT

8/3/2019 Seminar 1st Semister
http://slidepdf.com/reader/full/seminar-1st-semister 1/38
Design of Rigid and Flexible Pavements for Airport Runway
A SEMINAR
REPORT SUBMITTED IN PARTIAL
FULFILLMENT OF REQUIREMENTS FOR THE
AWARD OF THE DEGREE OF
MASTER OF ENGINEERING -CIVIL
(MAJOR: HIGHWAY ENGINEERING)
By
MOHAN M
I Semester M.E., (Civil)
Under The Guidance Of
Dr.L.Manjesh.
Asst Professor
Faculty of Civil Engineering
Bangalore University
Bangalore-560056
FACULTY OF CIVIL ENGINEERING
UNIVERSITY VISVESVARAYA COLLEGE OF ENGINEERING
BANGALORE UNIVERSITY, BANGALORE-560 056

8/3/2019 Seminar 1st Semister
http://slidepdf.com/reader/full/seminar-1st-semister 2/38
ACKNOWLEDGEMENTS
I take the privilege to thank Dr. L.MANJESH, Assistant Professor, Department of Ci
Engineering, Bangalore University for suggesting this topic and for his untiring guidance a
constant inspiration throughout this work.
I like to thank Dr M.S.AMARNATH, Professor of Civil Engineering Department for h
suggestions to complete this work.
I am extremely thankful to Dr.G.SURESH, Senior Lecturer of Civil Engineering Department, f
his suggestions and guidance to complete this work.
I wish to express my gratitude to all my friends, classmates, seniors and technical assistants for th
kind co-operation during the experimental investigations and analysis of my seminar wo
successfully.
MOHAN M
I SEMESTER M.E
HIGHWAY ENGINEERING

8/3/2019 Seminar 1st Semister
http://slidepdf.com/reader/full/seminar-1st-semister 3/38
SYNOPSIS
Airport pavements are constructed to provide adequate support for the loads imposed
airplanes and to produce a firm, stable, smooth, all-year, all-weather surface free of debris or oth
particles that may be blown or picked up by propeller wash or jet blast. In order to satisfactorily fulf
these requirements, the pavement must be of such quality and thickness that it will not fail under t
load imposed. In addition, it must possess sufficient inherent stability to withstand, without damage, t
abrasive action of traffic, adverse weather conditions, and other deteriorating influences.
BIAL is the main gateway to Silicon City. The airport is facing unexpected traffic growth sin
the globalization. The current parallel runway at th airport is already reaching its capacity limit. Wh
the operation reaches the capacity limit it will interrupt the airport operation, especially delay in t
arrivals and departure operations. This paper present the current runway operation and runway desi
capacity based on departure and arrival data. Based on the data and calculations, BIAL need ne
additional runway to cater for the future air traffic operation. Hence it is required to design an additio
runway. The calculation is presented based on the data collected.

8/3/2019 Seminar 1st Semister
http://slidepdf.com/reader/full/seminar-1st-semister 4/38
CHAPTER - 1
INTRODUCTION
1.1. General
Airport pavements are constructed to provide adequate support for the loads imposed
airplanes and to produce a firm, stable, smooth, all-year, all-weather surface free of debris or oth
particles that may be blown or picked up by propeller wash or jet blast. In order to satisfactorily fulf
these requirements, the pavement must be of such quality and thickness that it will not fail under t
load imposed. In addition, it must possess sufficient inherent stability to withstand, without damage, t
abrasive action of traffic, adverse weather conditions, and other deteriorating influences. To produ
such pavements requires a coordination of many factors of design, construction, and inspection to assu
the best possible combination of available materials and a high standard of workmanship.
1.2. Types of Pavement.
Pavements discussed in this document are flexible and rigid. Various combinations of paveme
types and stabilized layers result in complex pavements classified between flexible and rigid. The desi
and evaluation guidance in this circular can be adapted to any pavement type.
1.3. Airfield Pavement Classification
Compatability of aircraft and pavement is necessary so that there is no excessive damage to t
pavement and air craft operations are unrestricted. So long as the aircraft is having single wheel, t
comparision of strength could be made by simple load tests. With the advancement of technology
aircraft design having complex wheel configurations and assemblies came in use and therefore
methodology to define the compatability between the aircraft and pavement with a common datum w
felt necessary. Different methods are available in use, however, it is required that a uniform meth
needs to be applicable to all types of aircrafts and the most widely accepted ones are stated here.
1. Aircraft classification number (ACN)
2. Pavement classification number (PCN)

8/3/2019 Seminar 1st Semister
http://slidepdf.com/reader/full/seminar-1st-semister 5/38
1.4. Objectives
1. To evaluate the engineering properties of sub grade soil.
2. To design the overall thickness for the flexible pavement based on FAA method.
3.
To design the crust thickness and composition of proposed rigid pavement as per FAA methand IRC:58:2002.
1.5. Scope
To fulfill the above objectives, laboratory experiments are performed on the subgrade s
sample. Laboratory experiments are performed to evaluate the strength aspect.
To design the crust thickness, material, and density requirements for airfield pavements. It
includes criteria of the California Bearing Ratio (CBR) procedure for flexible pavements and theWestergaard Analysis for rigid pavements.

8/3/2019 Seminar 1st Semister
http://slidepdf.com/reader/full/seminar-1st-semister 6/38
CHAPTER -2
LITERATURE REVIEW
A runway pavement is a surfaced area designed to carry aircraft traffic and includes the enti
pavement system structure above the subgrade. All slabs on grade required to support aircraft loading
whether interior (hangar floors) or exterior, are to be considered airfield pavements.
2.1.1 Flexible Pavement
Unified Facilities Criteria (UFC) in their advisory circular flexible pavements are so designat
due to their flexibility under load and their ability to withstand small degrees of deformation. The desi
of a flexible pavement structure is based on the requirement to limit the deflections under load and
reduce the stresses transmitted to the natural subsoil. The principal components of the pavement inclu
a bituminous concrete surface, graded crushed aggregate base course, stabilized material, drainage lay
separation layer, and sub base courses. A bituminous concrete surface course is hot mixed bitumino
concrete designed as a structural member with weather and abrasion resisting properties. It may cons
of wearing and binder or intermediate course. Figure 1-1 illustrates the components and the terminolo
used in flexiblepavements. Examples of All Bituminous Concrete pavements (ABC) and flexib
pavements utilizing stabilized layers are shown in Figures 1-2.
Figure 2.1. Typical flexible pavement structure

8/3/2019 Seminar 1st Semister
http://slidepdf.com/reader/full/seminar-1st-semister 7/38
2.1.2 Use of Flexible Pavements.
The use of flexible pavements on airfields must be limited to those pavement areas not subject
to detrimental effects of fuel spillage, severe jet blast, or parked aircraft. Jet blast damages bitumino
pavements when the intense heat is allowed to impinge in one area long enough to burn or soften tbitumen so that the blast erodes the pavement. Hot-mix asphaltic concretes generally will resist erosi
at temperatures up to 150 degrees Celsius (300 degrees Fahrenheit). Temperatures of this magnitude a
produced only when aircraft are standing and are operated for an extended time or with afterburne
operating. Fuel spillage leaches out the asphalt cement in asphaltic pavements. In an area subject
casual minor spillage, the leaching is not serious, but where spillage is repeated in the same spot
frequent intervals, the leaching will expose loose aggregate. Flexible pavements are genera
satisfactory for runway interiors, secondary taxiways, shoulders, paved portions of overruns, or oth
areas not specifically required to have a rigid pavement surfacing.
2.2.1 Rigid Pavement
A rigid pavement is considered to be any pavement system that contains portland ceme
concrete as one element. Rigid pavements transfer the load to the subgrade by bending or slab acti
through tensile forces as opposed to shear forces. The principal components of a rigid pavement are t
concrete slab, base course, drainage layer, and separation layer. However, a stabilized layer may
required based on site conditions. Figure 1-3 illustrates the components of a rigid pavement. T
drainage and separation layer will normally serve as the base course. The following pavements a
considered to be rigid pavements.
(1)Plain concrete pavement is a nonreinforced jointed rigid pavement.
(2) Reinforced concrete pavement is a jointed rigid pavement that has been strengthened with
deformed bars or welded wire fabric.
(3) Continuously reinforced concrete pavement is a rigid pavement that is constructed without
joints and uses reinforcing steel to maintain structural integrity across contraction cracks that form in t
pavement.
(4) Fibrous concrete pavement is a rigid pavement that has been strengthened by the
introduction of randomly mixed, short, small-diameter steel fibers. Nonsteel fibers have been used
portland cement concrete (PCC) to control shrinkage cracking, but their use is not covered in this TI.
(5) Prestressed concrete pavement is a rigid pavement that has been strengthened by the

8/3/2019 Seminar 1st Semister
http://slidepdf.com/reader/full/seminar-1st-semister 8/38
application of a significant horizontally applied compressive stress during construction.
(6) Rigid overlay pavement is a rigid pavement used to strengthen an existing flexible or rigid
pavement.
(7) Nonrigid overlay pavement is either all-bituminous or bituminous with base course used
strengthen an existing rigid pavement.
Figure 2.2. Typical rigid pavement structure
2.2.2 Use of Rigid Pavements.
The following pavements will be rigid pavement: all paved areas on which aircraft or helicopt
are regularly parked, maintained, serviced, or preflight checked, on hangar floors and access aprons;
runway ends (305 meters (1,000 feet)) of a Class B runway; areas that may be used from the runway e
to 90 meters (300 feet) past the barrier to control hook skip; primary taxiways for Class B runwayhazardous cargo, power check, compass calibration, warmup, alert, arm/disarm, holding, and washra
pads; and any other area where it can be documented that flexible pavement will be damaged by jet bl
or by spillage of fuel or hydraulic fluid. Rigid pavements shall also be used at pavement intersectio
where aircraft/vehicles have a history of distorting flexible pavements and where sustained operations
aircraft/vehicles with tire pressures in excess of 2.06 MPa (300 psi) occur. Continuously reinforc
concrete pavement will be used in liquid oxygen (LOX) storage and handling areas to eliminate the u
of any organic materials (joint sealers, asphalt pavement, etc.) In those areas. The type of pavement
be used on all other paved areas will be selected on the basis of life cycle costs.
2.3 Subgrade
2.3.1 Suitability of Subgrade.

8/3/2019 Seminar 1st Semister
http://slidepdf.com/reader/full/seminar-1st-semister 9/38
The information obtained from the explorations and tests previously described should
adequate to enable full consideration of all factors affecting the suitability of the subgrade and subso
The primary factors are as follows:
a. The general characteristics of the subgrade soils.
b. Depth to bedrock.
c. Depth to water table (including perched water table).
d. The compaction that can be attained in the subgrade and the adequacy of the existing density in t
layers below the zone of compaction requirements.
e. The strength that the compacted subgrade, uncompacted subgrade, and subsoil will have und
local environmental conditions.
f. The presence of weak or soft layers in the subsoil.
g. Susceptibility to detrimental frost action.
h. Settlement potential.
I. Expansion potential.
j. Drainage characteristics.
2.3.2 Grade Line.
The soil type together with information on the drainage requirements, balancing cut and fi
flooding potential, depth to water table, depth to bedrock, and the compaction and streng
characteristics should be considered in locating the grade line of the top of the subgrade. Generally, t
grade line should be established to obtain the best possible subgrade material consistent with the prop
utilization of available materials; however, economics of plans for construction must be given prim
consideration.
2.3.3 Subgrade CBR.
The strength of the subgrade may be expressed in terms of the CBR for flexible paveme
design. The CBR test is described in CRD-C 654. It includes procedures for making tests on samp
compacted to the design density in test molds and is soaked 4 days for making in-place CBR tests a
for making tests on undisturbed samples. These tests are used to estimate the CBR that will develop
the pavement structure. However, a subgrade design CBR value above 20 is not permitted unless t
subgrade meets the requirements for subbases. The CBR selected for the subgrade will be based on t

8/3/2019 Seminar 1st Semister
http://slidepdf.com/reader/full/seminar-1st-semister 10/38
predominant moisture conditions occurring during the life of the pavement. This moisture situation c
be obtained from pavement evaluation reports and from soil tests under existing pavements. Where lo
duration soil moisture conditions cannot be determined with confidence, the soaked laboratory CBR w
be selected for the subgrade soil.
a. Laboratory Tests. Tests results should include a full family of curves (Figure 6-1) as described
CRD-C 654. These curves show the three-way relationship of water content at the time ofcompactio
compacted density, and CBR after soaking. These curves should be studied in view of the actual wa
contents and densities that can be expected considering the natural scatter when specific control valu
are specified. The scatter that can be expected with normal control procedures will vary with the s
type. A spread of plus or minus 2 percent can be anticipated for soils with low optimum moistu
contents (in the range of 10 percent), whereas a spread of plus or minus 4 percent can be anticipated f
soils with high optimum moisture contents (in the range of 25 percent). Poor construction control m
result in even greater scatter. A comparable scatter in the density can also be expected.
After the range of moisture contents and densities that can be expected during actual construction
estimated, the range of CBR values that will result from these variations in moisture and density shou
be determined. The design CBR value for the specific soil tested should be selected near the lower p
of the range. The following steps along with Figure 6-1 illustrate the selection of a design CBR value.
1. Determine moisture/density relationship. Plot density to which soil can be compacted in the field. F
the clay of this example,use 95 percent of maximum density. Plot the desired moisture content rang
For the clay of this example, use ±1-1/2 percent of optimum moisture content for approximately 13 a
16 percent. Shaded area represents compactive effort greater than 95 percent and within ±1-1/2 perce
of optimum moisture content.
(3) Plot CBR versus dry density at constant moisture content. Plot attainable compaction limits of 1,7
and 1,840 kg/m3 (110.6 and 115 lb/ft3) for this example. The hatched area represents attainable CB
limits for desired compaction 1,770 and 1,840 kg/m3 (110.6 to 115 lb/ft3) and moisture content (13
16 percent). CBR varies from 11 (95 percent compaction and 13 percent moisture content) to 26 (
percent moisture content and maximum compaction). For design purposes, a CBR at the low end
range is used. In the example, a CBR of 12 with a moisture content specified between 13 and 16 perce
is selected.

8/3/2019 Seminar 1st Semister
http://slidepdf.com/reader/full/seminar-1st-semister 11/38
b. In-place Tests and Tests on Undisturbed Samples. Where an existing pavement at the site ha
subgrade constructed to the same standards as the job being designed, in-place tests or tests
undisturbed samples may be used in selecting the design CBR value. Also, where no compaction
anticipated, as in the layers below the zone of compaction, tests should be conducted on the natu
material.
2.4 Classification of Air Field Pavement
The scientists of UK air ministry observed that the load carrying capacity of pavement vari
with the tyre pressure or contact radius using the relationship (a1/a2)α. The aircraft is thus defined by
curve having exponent of α passing through the point obtained by contact area and the all up weight.
load classification number is assigned to such a sets of load on single wheel and tyre pressures which a
expanded to give a curve. A family of curves for various sets of load and tyre pressure is developed an
such cureve is assigned a number. The load classification number (LCN) defines the load effect of
aircraft. The safe load tested for pavement with reference to the area of contact rate used in the test, re
on such curves gives the LCN of the pavement.
Aircraft classification number (ACN) is defined as ‘the load carried by a single wheel in terms
500kg , at a constant tyre pressure of 1.2MPa by a pavement required for the aircraft using standa
method of design using CBR method for flexible pavement and PCA for interior loading for rig
pavement
Pavement classification number (PCN) is the ACN of aircraft which the pavement is capable
carrying for unrestricted movement. It may be noteworthy that the ACN/PCN are the ‘constant ty
pressure’ where as LCN is for constant contact area. This makes computations of permissible load of
aircraft compatible to the pavement strength.
2.4.1 Determination of PCN
PCN is defined for constant pressure and no method is available for direct measurement this h
therefore can be determined by combined analysis with the measurement, it provides a choice to t
airport authorities to use the method of there preference. Methods available presently use the stiffness
the pavement obtained by non destructive test method to this stiffness permissible deflection is appli
to obtain the maximum permissible load. This load which is for the particular contact area and pressu
is modified for standard contact pressure of 1.25MPa. This cycle is repeated for the stable values.
Basic Design Factors

8/3/2019 Seminar 1st Semister
http://slidepdf.com/reader/full/seminar-1st-semister 12/38
Willows-Glenn County Airport Master Plan (Adopted August 19, 2008)
The Federal Aviation Administration (FAA) provides guidance and standards for airport design throu
a series of Advisory Circulars (ACs). These guidelines promote airport improvements which enhan
airport safety and operational utility. Major considerations include:
• The total volume of aircraft operations;
• The types of aircraft seeking to operate at the airport; and
• Availability of instrument approach procedures.
Airport Role
The purpose of the proposed airfield improvements is to continue to facilitate the established airport ro
and enhance the airport’s ability to accommodate the forecast growth in business aircraft operations. T
operational role of Willows-Glenn County Airport – that of a general aviation airport – requires it
serve a wide variety of aircraft sizes and types. Currently, the airport primarily serves agricultural (aer
applicators) and personal/recreational aircraft operations. The aerial applicators principally use sing
engine turboprop aircraft. The
Personal/recreational use aircraft are mostly single-engine, piston powered aircraft. The airport also se
regular, but less frequent use by piston and turboprop twins, and small-to-mid-size business jets.
Airport Classification
For airfield design purposes, the FAA has established a set of airport classifications known as Airpo
Reference Codes (ARC). An ARC is applicable to each airport and its individual runway and taxiway
components. The primary determinants of these classifications are the critical aircraft (design aircraft
runway or taxiway is intended to serve and the instrument approach minimums applicable to a
particular runway end. Each ARC consists of two components relating to an airport’s design aircraft:
Aircraft Approach Category — depicted by a letter (A-E), this component relates to aircraft approa
speed, an operational characteristic that provides an indication of runway length requirements. With
this category, aircraft that have gross weights of 12,500 pounds or less are classified as small and ha
distinct airfield design criteria.
Airplane Design Group — depicted by a Roman numeral (I-VI), the second component relates
airplane wingspan, a physical characteristic.

8/3/2019 Seminar 1st Semister
http://slidepdf.com/reader/full/seminar-1st-semister 13/38
Generally, Aircraft Approach Category applies to runways and runway related facilities. Airpla
Design Group primarily relates to separation criteria involving taxiways and taxi lanes.

8/3/2019 Seminar 1st Semister
http://slidepdf.com/reader/full/seminar-1st-semister 14/38
CHAPTER 3
MATERIALS AND METHODOLOGY
3.1 Introduction
The properties of soils used in the present study and the details of the test procedures adopted a
described in this chapter.
3.2 Collection of soil samples
The sub-grade soil samples were obtained from BANGLORE INTERNATIONAL AIRPOR
DEVANAHALLI, BANGLORE DISTRICT. For this purpose 19 trenches were cut open near t
proposed pavement edges. Then from each trench a minimum of 25 kgs of soil samples were obtain
and collected in neat water proof bags. The bags were numbered and labeled for easy identification. S
samples were collected in small sealed covers for determining of field moisture. Undisturbed sampl
were collected with the core cutter to determine the bulk density and dry density. Then the samples we
transported to the laboratory to carry out further laboratory investigations.
3.3 Laboratory Test Results on Subgrade Soil samples
The laboratory investigations have been carried out on Subgrade soil samples collect
BANGLORE INTERNATIONAL AIRPORT, DEVANAHALLI, BANGLORE DISTRICT
Karnataka state.
Wet sieve analysis, consistency limits, modified Proctor compaction test and CBR tests we
carried out on untreated subgrade soil sample and results have been recorded in tabulated as in Chap
4.
3.4 Methods of Testing
3.4.1 Wet sieve analysis
Grain size analysis is also known as mechanical analysis of soils is the determination of t
percent of individual grain sizes present in the sample. The results of the test are of great value in so
classification. In mechanical stabilization of soil and for designing soil-aggregate mixtures the results
gradation tests are used.

8/3/2019 Seminar 1st Semister
http://slidepdf.com/reader/full/seminar-1st-semister 15/38
Sieving is performed by arranging the various sieves one over the other in the order of their me
openings. Wet sieve analysis was carried out by washing the oven dried and weighed soil sampl
through 75µ sieve. The samples were soaked in water for 24 hrs prior to washing to break the s
lumps. The dried residues were sieved through a set of IS sieves and weight of soil samples retained
each sieve was measured accurately the percentages of Gravel, Sand, Silt and Clay are shown in Tab
3.1.
Fig 3.1 Set Of Sieves
3.4.2 Liquid limit
The liquid limit for all the samples were conducted as procedure given in IS: 2720, (part-5
1985. The Liquid limit reported is an average of three determinations.
3.4.3 Plastic limitThe plastic limit of the various samples were determined as per the standard method (test f
determination of plastic limit of soil IS: 2720 (part-5)-1985. The plastic limit reported is an average
three determinations.

8/3/2019 Seminar 1st Semister
http://slidepdf.com/reader/full/seminar-1st-semister 16/38
Fig 3.2 Casagrande’s Apparatus
3.4.4 Compaction
Compaction of soil is a mechanical process by which the soil particles are constructed to
packed more closely together by reducing the air voids. Soil compaction causes decrease in air voids a
consequently an increase in dry density. The possibility of future settlement or compressibility decreas
and also the tendency for subsequent changes in moisture content decreases. Degree of compaction
usually measured qualitatively by dry density.
Increase in dry density of soil due to compaction mainly depends on two factors:
1. Moisture content.
2. Amount of compaction.
Practically all soils it is found that with increase in moisture content, dry density first increas
and then decreases
3.4.5 California Bearing Ratio (CBR) Test
The CBR is a measure of resistance of material to penetration of standard plunger und
controlled density and moisture conditions. The CBR test was developed as a method of classifying aevaluating soil sub-grade and base course materials for flexible pavement. The CBR test may
conducted in re-molded or undisturbed specimen in the laboratory. Many methods exist today whi
utilize mainly CBR test values for designing pavement structure.
CBR tests were carried out in the laboratory for each soil sample, passing through 20 mm siev
The samples were compacted in the CBR mould at OMC and soaked for 4 days. The soaked sampl

8/3/2019 Seminar 1st Semister
http://slidepdf.com/reader/full/seminar-1st-semister 17/38
were subjected to CBR test. Atleast 2 specimens were prepared for each soil sample and average of t
results was considered for analysis. A graph was plotted between penetration v/s load. The unit lo
values corresponding to 2.5 mm and 5.0 mm penetration values are found from the graph. The CB
value is calculated by
% CBR = (load × 100) / 1370 for 2.5 mm penetration
% CBR = (load × 100) / 2055 for 5.0 mm penetration
Fig 3.3 California bearing ratio test

8/3/2019 Seminar 1st Semister
http://slidepdf.com/reader/full/seminar-1st-semister 18/38
CHAPTER 4
ANALYSIS OF RESULTS
4.1 Introduction
In this chapter details about the experiments performed and a brief discussion on the experime
results is presented. In the present investigation for the subgrade soil samples, the index properties,
strength properties are studied.
Wet sieve analysis, density determination by core cutter method, Liquid limit, Plastic li
Modified Proctor’s Compaction and CBR tests were conducted for the subgrade soil samples.
4.2 Results
4.2.1 Atterberg Characteristics
i) Liquid limit
The Liquid limit is a measure of water content of soil when it approaches a particul
shearing resistance and it is amount of water which must be added to soil in order that layer mu
distant from soil particle acquires the property of free water. The shearing resistance at t
particle level and the thickness of diffused double layer primarily controls the liquid limit
clays.
ii) Plastic limit
Plastic limit is the water content corresponding to an arbitrary limit between plastic a
semi soild state of consistency of soil.
Plastic limit is affected by the following factors:
Surface area: Generally, it is known that decrease in specific surface of soil particles increa
the plastic limit though not in direct proportion.Thus the plastic limit increases with increase
coarser fraction.
8/3/2019 Seminar 1st Semister
http://slidepdf.com/reader/full/seminar-1st-semister 19/38
iii) Plasticity Index
The range of consistency within which a soil exhibits plastic properties is called plas
range and is indicated by plasticity index.
4.2.1.2 Test Results
As per experimental programme liquid limit and plastic limit tests are conducted
explained in section 3.4.2 and 3.4.3. Table 4.3 presents the plasticity characteristics of subgra
soils.
Table 4.1 Plasticity Characteristics Of Soil Subgrde

8/3/2019 Seminar 1st Semister
http://slidepdf.com/reader/full/seminar-1st-semister 20/38
Soil
Sample
Liquid
Limit
Plastic
Limit
Plasticity
Index
C1 34.30 21.30 13.00
C2 33.10 20.60 12.50
C3 36.00 24.00 12.00
C4 33.10 20.80 12.30
C5 34.50 21.00 13.50
C6 35.20 22.10 13.10
C7 36.00 24.00 12.00
C8 32.10 19.50 12.60
C9 31.50 18.00 13.50
C10 34.10 21.50 12.60
C11 33.90 20.10 13.80C12 34.60 20.20 14.40
C13 31.40 16.00 15.40
C14 30.40 17.20 13.20
C15 30.90 17.10 13.80
C16 33.90 21.40 12.50
C17 34.80 20.10 14.70
C19 29.25 17.00 12.25
C20 32.00 19.00 13.00

8/3/2019 Seminar 1st Semister
http://slidepdf.com/reader/full/seminar-1st-semister 21/38
4.2.2 Wet Sieve Analysis
The test results of the wet sieve analysis of the the subgrade soil samples are given tabulate
below in table 4.1
Table 4.2 Grain size distribution Of Subgrde soil sample
C1 59.80 37.16 3.04
C2 56.44 40.48 3.08
C3 65.20 29.68 5.18
C4 55.24 40.28 4.48
C5 59.24 36.74 4.02C6 60.26 36.96 2.78
C7 65.18 31.78 3.04
C8 55.58 37.38 7.04
C9 52.52 40.76 6.72
C10 58.06 37.58 4.36
C11 56.30 38.38 5.32
C12 57.84 39.10 3.06
C13 45.18 48.94 5.88
C14 51.04 39.02 9.94C15 50.52 45.52 6.96
C16 57.62 33.80 8.58
C17 61.00 38.56 0.40
C19 44.24 41.06 14.70
C20 52.16 32.02 15.82
% Silt
and Clay% Sand % GravelSample

8/3/2019 Seminar 1st Semister
http://slidepdf.com/reader/full/seminar-1st-semister 22/38
4.2.3 Density Determination
The bulk density and dry density were determined by driving in the core cutters in site. Table 4
shows the density characteristics.
Table 4.3 Density Characteristics Of Soil Subgrde
C1 1.99 9.09 1.83
C2 2.00 5.73 1.89
C3 1.97 8.37 1.82C4 2.08 16.36 1.79
C5 2.07 11.11 1.86
C6 2.15 9.09 1.97
C7 2.12 9.45 1.93
C8 1.97 20.88 1.63
C9 1.98 11.11 1.79
C10 1.79 8.30 1.65
C11 2.01 14.29 1.76C12 2.27 25.71 1.81
C13 2.00 7.05 1.87
C14 2.11 8.82 1.94
C15 2.10 14.29 1.84
C16 2.01 13.60 1.77
C17 1.92 6.92 1.79
C19 2.32 19.15 1.95
C20 1.87 10.70 1.69
Sample noBulk density
γbulk(g/cc)
Moisture
content (%)
Dry density
γdry (g/cc)

8/3/2019 Seminar 1st Semister
http://slidepdf.com/reader/full/seminar-1st-semister 23/38
4.2.4 Compaction Characteristics
Compaction is a process by which the soil particles are artificially rearranged and pack
together in to a closer state of contact by mechanical means in order to decrease porosity of the soil a
thus increase its dry density. In the present investigation, Modified proctor compaction test a
performed on the subgrade soil and the results are presented below.
4.2.4.1 Test Results
As per experimental programme compaction test is conducted as explained in section 3.4
Table 4.4 presents the compaction characteristics of subgrade soil.

8/3/2019 Seminar 1st Semister
http://slidepdf.com/reader/full/seminar-1st-semister 24/38
Table 4.4 Compaction Characteristics Of Soil Subgrde
OMC
(ω)%
Maximum Dry
Density(γdry)
Degree Of
Compaction(%)
C1 7.70 2.01 90.90
C2 7.80 2.03 93.03
C3 10.80 2.21 82.40
C4 11.00 1.88 95.14
C5 7.70 1.99 93.62
C6 10.90 2.21 89.02
C7 7.60 1.94 99.71
C8 11.00 1.96 83.01
C9 8.30 1.98 90.20
C10 9.30 2.23 74.10
C11 7.90 1.91 91.98
C12 8.00 2.01 89.85
C13 7.45 1.99 93.74
C14 7.60 2.05 94.68
C15 7.90 1.92 95.84
C16 7.40 2.02 87.68
C17 8.00 2.02 88.78
C19 7.90 1.98 98.24
C20 7.90 1.91 88.29
Sample
Theoritical Compaction
4.2.5 California Bearing Ratio
CBR test is an arbitrary strength test and it cannot be used to evaluate the soil properties li
cohesion or angle of friction or shearing resistance. This is a penetration test developed by Californ
Division of Highway, a method for evaluating the stability of soil subgrade and other flexible pavem
materials.

8/3/2019 Seminar 1st Semister
http://slidepdf.com/reader/full/seminar-1st-semister 25/38
4.2.5.1 Test Results
As per experimental programme CBR test is conducted as explained in section 3.4.5. Table 4
presents the CBR values of subgrade soil after soaking for 4 days.
Table 4.5 CBR values Of Soil Subgrde after 4 days soaking
C1
C2
C3
C4C5
C6
C7
C8
C9
C10
C11
C12
C13
C14
C15
C16
C17
C19
C20
4.67
3.25
10.73
5.62
3.87
8.91
5.26
5.77
4.42
2.12
4.38
4.72
4.86
5.01
8.90
5.30
3.21
4.20
2.85
4.233.28
4.04
2.91
4.11
3.45
6.81
4.48
2.53
3.993.11
3.16
2.04
3.50
SAMPLE
NO.
CBR RESULTS FOR SAMPLES
CBR @2.5 mm CBR @5.0 mm
3.11
3.50
3.18
2.12
4.53

8/3/2019 Seminar 1st Semister
http://slidepdf.com/reader/full/seminar-1st-semister 26/38

8/3/2019 Seminar 1st Semister
http://slidepdf.com/reader/full/seminar-1st-semister 27/38
4.3.1 Procedure For Design of Flexible Pavement By FAA Method
1. Series of design curves based on the CBRdesign method
2. Design curves depend on gear configuration
3. Curves provide total pavement thickness
4. Curves based on 20 year design life
5. Load: Pavement design based on maximum anticipated takeoff weight
6. Assumes 95% of the load on main gear
7. Design Inputs
Subgrade CBRvalue
Subbase CBRvalue
Design aircraft gross weight
Number of annual departures of the design aircraft
Subgrade CBR Design Value
8. Determine Design Aircraft
9. Forecast annual departures by aircraft type
10. Determine required pavement thickness for each aircraft type
11. Annual Departures of Design Aircraft
12. Group all aircraft traffic into gear configuration of design aircraft
13. Convert all departures into equivalent annual departures of the design aircraft
Hence from the charts the thickness obtained for computations in Table 4.6 is 40 in = 101.6 cm
upon the prepared subgrade
But as per the required PCN value of 80 the required thickness is 108.14 cm provide 110 cm
overall thickness.
Provide 25 cm thick SDBC (Semi Dense Bituminous Concrete) as the wearing course or surfac
courseProviding graded bituminous macadam Base Course, the thickness of Base course required 35
cm
Similarly using 20% CBR for sub base course the required thickness is 45 cms.

8/3/2019 Seminar 1st Semister
http://slidepdf.com/reader/full/seminar-1st-semister 28/38
4.3.2 Procedure For Design of Rigid Pavement By FAA Method:
1. Note the gear type, Dual or Dual Tandem or Double dual tandem
2. Convert all the gears into Equivalent Dual tandem Gear departures.
Equivalent dual tandem gear departures =conversion factor X Annual Departure
3. Calculate Aircrafts wheel loads.
Aircraft wheel load =Gross weight X 0.95X .5
2
4. Compute Equivalent design departure
Equivalent Design departure => log(R1)= log (R2)x 1
2
Where R1= equivalent annual departures by the design aircraft
R2= annual departures expressed in design aircraft landing gear
W1= wheel load of the design aircraft
W2= wheel load of the aircraft in question
5. Sum the total Number of departures, this will be the design departure and the design load will b
that of the design air craft
6. Using FAA charts find the thickness corresponding to 6978 departures of 172.60 T
We get for k= 95 pci. Flexural strength of concrete = 653 psi
Thickness of runway t= 13.5 in = 34.29 cm
Provide 40 cm thick pavement.
7. Calculate the temperature stresses and the edge load stresses.
8. Design the dowel bars.
Also as per requirement provide Dry lean concrete of thickness 10 cm

8/3/2019 Seminar 1st Semister
http://slidepdf.com/reader/full/seminar-1st-semister 29/38
29
Table 4.6: COMPUTATION AND CONVERSION OF GEAR, WHEEL LOADS AND EQUIVALENT DESIGN DEPARTURES FOR
DUAL GEAR
AircraftAnnual
Departure
Gross
Weight
(T)
Gear
type
Equivalent dual gear
departure
Aircraft wheel
loads (T)
Equivalent design
departures
Airbus A320-200 568 73.900 DT 966 17.550 26
Boeing 737-100 406 50.349 D 406 11.957 10
Boeing 737-200 408 58.332 D 408 13.850 11
Airbus A320-200 14 44.400 D 14 10.545 4
Airbus A300-600 521 172.600 DT 521 40.990 74
Airbus A310-300 104 142.900 D 104 33.938 104
Boeing 757-200 1562 116.900 DT 2656 27.570 94
Airbus A330-200 346 230.900 DDT 589 54.830 122
Boeing 747-400 183 414.130 DT 311 98.355 303
MD11 ER 212 287.124 DT 360 68.192 159
Boeing 747-800 34 443.613 DDT 58 105.358 58
Airbus A380-800 34 591.995 DDT 58 140.589 41
1006

8/3/2019 Seminar 1st Semister
http://slidepdf.com/reader/full/seminar-1st-semister 30/38
30
Table 4.7: COMPUTATION AND CONVERSION OF GEAR, WHEEL LOADS AND EQUIVALENT DESIGN DEPARTURES FOR
DUAL TANDEM GEAR
Airbus A320-200 568 73.900 DT 568 17.550 64
Boeing 737-100 406 50.349 D 244 11.957 20Boeing 737-200 408 58.332 D 245 13.850 24
Airbus A320-200 14 44.400 D 14 10.545 4
Airbus A300-600 521 172.600 DT 313 40.990 313
Airbus A310-300 104 142.900 D 63 33.938 104
Boeing 757-200 1562 116.900 DT 1562 27.570 416
Airbus A330-200 346 230.900 DDT 346 54.830 865
Boeing 747-400 183 414.130 DT 183 98.355 3196
MD11 ER 212 287.124 DT 212 68.192 1002
Boeing 747-800 34 443.613 DDT 34 105.358 285
Airbus A380-800 34 591.995 DDT 34 140.589 685
6978
Aircraft
wheel loads
Equivalent design
departuresAircraft
Annual
Departure
Gross
Weight
Gear
type
Equivalent dual
tandem gear

8/3/2019 Seminar 1st Semister
http://slidepdf.com/reader/full/seminar-1st-semister 31/38
31
4.3.3 DESIGN ASPECTS FOR CC PAVEMENT (M40) SLAB (As per IRC 58 – 1988)
Flexural strength of cement concrete = 45 kg/cm²
Elastic modulus of concrete (E) = 3 x 10⁵kg/cm
2
Poisson’ ratio (μ) = 0.15
Coefficient of thermal coefficient of concrete (α) = 10x 10-6 /ºC
Length of the Pavement Slab, L = 500 cm
Width of the Pavement Slab, B = 500 cm
Maximum temperature differential during day between top and
Bottom of the slab for the Banglore Region = 26º C
Design Load on the dual wheel assembly = 172600 kg
Tyre Pressure = 14.15 kg/cm2
Design life = 30 years
Thickness of slab = 40 cm
Temperature Stresses
The temperature stress at the critical edge region is obtained as per Westergaard analysis using
Bradbury’s coefficient as follows:
Edge warping stress, Ste = CEαt
2
Radius of relative stiffness (l), l = ℎ 3
12 (1− 2)
4= 133.15 cm
Bradbury’s Coefficient, C = 0.37375 (As per IRC 58- 1988 for L/l =3.755)
Edge warping stress, Ste = 14.576 kg/cm²
Residual available strength of concrete for supporting traffic loads

8/3/2019 Seminar 1st Semister
http://slidepdf.com/reader/full/seminar-1st-semister 32/38
32
= Flexural Strength of cement concrete – Edge Warping Stress
= 45.00 kg/cm² - 14.576 kg/cm² = 33.133 kg/cm²
Edge Load Stress, Se:
Using Westergaard Equation as under:
Se = 0.572
ℎ20.359 + 4 log10
b = radius of equivalent distribution of pressure
= a (Radius of load contact) for a/h > 1.724
= ((1.6 a2
+ h2)0.5
) - 0.675h for a/h < 1.724
Radius of load contact, cm, (assumed circular), a = 115.81 cm
b = 115.81 cm
Edge Load Stress, Se = 30.424 kg/cm² < 45 kg/cm² (Flexural Strength of cement concrete)
Corner Load Stress, Sc:
Corner load stress, Sc =3ℎ2
1 − 2 0.6
Sc = 38.43 kg/cm² < 45 kg/cm² (Flexural Strength of cement concrete)
Factor of Safety (FOS) = Residual Strength of concrete
Edge Load Stress
FOS = ℎ
=33.133
30.424= 1.089 > 1
Designed concrete pavement thickness of 40 cm is ok

8/3/2019 Seminar 1st Semister
http://slidepdf.com/reader/full/seminar-1st-semister 33/38
33
4.3.4 DESIGN OF DOWEL BARS (AS PER IRC 58 – 2002)
Design Wheel Load = 140.589 T(Dual Wheel Load)
Percentage of Load Transfer =95%
Slab Thickness, h = 40 cm
Joint width, z = 3.0 cm
Radius of Relative Stiffness, l = 133.15 cm
Permissible bearing stress in concrete is calculated as under:
Fb = (10.16 – b) fck/9.525
fck = Characteristic compressive strength of concrete cube (15 cm) after
28 days of curing concrete = 400 kg/cm2
for M – 40 Grade.
b= diameter of the dowel bar = 3.0 cm (FAA specification)
Fb = (10.16 – 3.0)x400/9.525 = 272.79 kg/ cm2
Spacing between the dowel bars = 38 cm (FAA specified)
First dowel bar is placed at a distance = 15 cm from the Pavement Edge
Length of the dowel bar = 51 cm (FAA Specified)
No. of Dowel bars participating in Load transfer = 1 + l /Spacing = 1+133.15/38 = 4 dowels
Assuming that the load transferred by the first dowel is Pt and assuming that the load on dowel
bar at a distance of ‘l ’ from the first dowel to be zero, the total load transferred by the dowel bar
system
= 1 +133.15−38
133.15+
133.15−76
133.15+
133.15−114
133.15 = 2.287
Load carried by the outer dowel bar, Pt = (140.589 x 1000 x 0.95 /2.287) = 58267 kg.

8/3/2019 Seminar 1st Semister
http://slidepdf.com/reader/full/seminar-1st-semister 34/38
34
4.4 Joints And Spacing
Variations in temperature and moisture content can cause volume change and slab warping
resulting in significant stresses. In order to reduce the detrimental effects of these stresses and to
minimize random cracking, it is necessary to divide the pavement into a series of slabs of
predetermined dimension by means of joints. Pavement joints are categorized according to the
function that the joint is intended to perform. The following joints are envisaged in this project.
4.4.1 Thickened Edge Isolation Joint
The function of the isolation joints is to isolate intersecting pavements and to isolate the
structures from the pavement this is used when conditions preclude the use of load transfer
devices that span across the joint, such as where the pavement abuts the structure or where
horizontal differences in movement of the pavement occur(e.g. at catch pits, longitudinal drain,
fuel hydrant pits etc) these joints are formed by increasing the thickness of the pavement along
the edge slab. No dowel bars are provided.
4.4.2 Sawn Contraction Joint
The function of contraction joint is to provide controlled cracking of the pavement when the
pavement contracts due to decrease in in moisture content or a temperature drop. Contraction
joint also decrease stresses caused by slab warping.
4.4.3 Doweled Construction Joints
Construction joints are required when two abutting slabs are placed at different times, such as at
the end of a day’s placement or between paving lanes.
4.4.3.1 Dimensions And Spacing Of Dowels
Dowels are used at joints to provide for transfer of load across the joint and to prevent relative
vertical displacement of adjacent slab ends. For the slab thickness of 400 mm, the FAA
recommends the following dowel dimension and spacing.
Diameter = 30 mm Length= 510 mm Spacing= 380 mm
The same are adopted in the present project.

8/3/2019 Seminar 1st Semister
http://slidepdf.com/reader/full/seminar-1st-semister 35/38
35
4.4.4 Joint Spacing
According to FAA, the maximum spacing of 6.1m is recommended for is recommended for slabs
equal to or thicker than 400 mm since the slab thickness for the present project is 400mm, a
maximum joint spacing of 6.1m will be adopted. The ratio of the longest side of a slb to the
shortest side of a slab at two intersecting sides shall not exceed 1.25.
4.4.5 Runway Length
Design Condition Data
Airplane 747-400 (PW4056)
Mean daily maximum temperature of hottest month at airport1 80.6° Fahrenheit (27° C)
Airport Elevation 2935 feet above MSL
Maximum design landing weight 574,000 pounds
Maximum design takeoff weight 875,000 pounds
95% design takeoff weight 831,250 pounds
Takeoff Length Requirements 95% Useful Load
Takeoff Length with 20 degree flap setting @ 92°F3 10,171 feet
Adjusted Takeoff Length for Elevation (dry pavement)4 10,234 feet
Existing main runway length = 10,400 feet
Hence provide runway length of 10,400 feet
8/3/2019 Seminar 1st Semister
http://slidepdf.com/reader/full/seminar-1st-semister 36/38
36
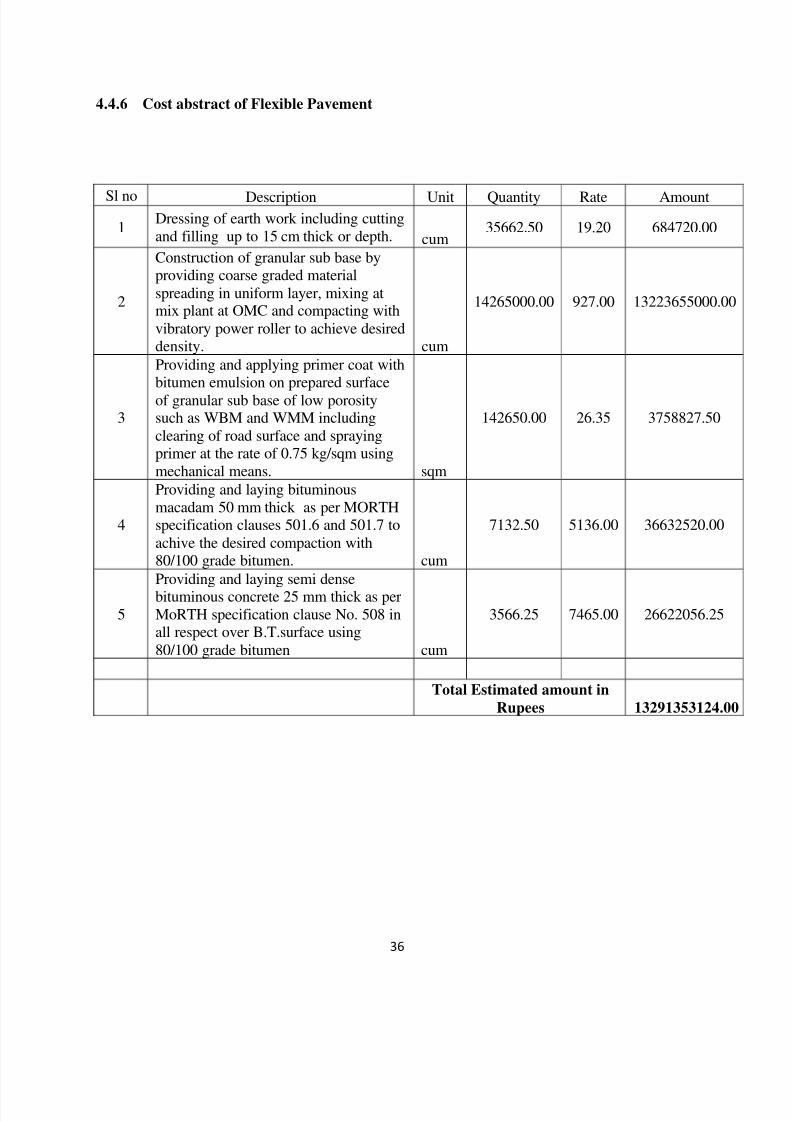
4.4.6 Cost abstract of Flexible Pavement
Sl no Description Unit Quantity Rate Amount
1Dressing of earth work including cutting
and filling up to 15 cm thick or depth. cum35662.50 19.20 684720.00
2
Construction of granular sub base byproviding coarse graded material
spreading in uniform layer, mixing atmix plant at OMC and compacting with
vibratory power roller to achieve desireddensity. cum
14265000.00 927.00 13223655000.00
3
Providing and applying primer coat withbitumen emulsion on prepared surface
of granular sub base of low porositysuch as WBM and WMM including
clearing of road surface and sprayingprimer at the rate of 0.75 kg/sqm using
mechanical means. sqm
142650.00 26.35 3758827.50
4
Providing and laying bituminous
macadam 50 mm thick as per MORTHspecification clauses 501.6 and 501.7 to
achive the desired compaction with80/100 grade bitumen. cum
7132.50 5136.00 36632520.00
5
Providing and laying semi densebituminous concrete 25 mm thick as per
MoRTH specification clause No. 508 inall respect over B.T.surface using
80/100 grade bitumen cum
3566.25 7465.00 26622056.25
Total Estimated amount in
Rupees 13291353124.00

8/3/2019 Seminar 1st Semister
http://slidepdf.com/reader/full/seminar-1st-semister 37/38
37
4.4.7 Cost abstract of Rigid Pavement
Sl no Description Unit Quantity Rate Amount
1 Dressing of earth work including cuttingand filling up to 15 cm thick or depth.
cum
35662.50 19.20 684720.00
2
Construction of granular sub base by
providing coarse graded materialspreading in uniform layer, mixing at mix
plant at omc and compacting withvibratory power roller to achieve desired
density. cum
21397.50 927.00 19835482.50
3
Construction of base courseby providingDry lean concrete spreading in uniform
layer, mixing at mix plant and compactingwith vibratory compactor. cum
14265.00 2900.00 41368500.00
4
Construction of surface course by
providing Pavement quality concretespreading in uniform layer, mixing at mix
plant and compacting with vibratorycompactor.
cum
57060.00 3450.00 196857000.00
Total estimated amount in
Rs 258745702.50

8/3/2019 Seminar 1st Semister
http://slidepdf.com/reader/full/seminar-1st-semister 38/38
CHAPTER 5
DISCUSSIONS AND CONCLUSIONS
5.1 Discussions
The subgrade soil when tested possessed the following details
1. The soil is mainly composed of around 50% of silt and clay.
2. The soil density varies between 1.7g/cm3
to 2.1g/cm3.
3. The optimum moisture content varies between 7.40% to11.00%.
4. The strength of the soil determined by 3rd
energy level CBR has the lowest value of
2.12%.
Since the strength of the soil is too low for an air field pavement (minimum 3% CBR) the
soil should be stabilized by suitable means so as to obtain a target strength of 6% CBR.
5.2. Conclusions
1. The runway length to be provided is 10,400 feet (3170 m).
2. Thickness for the flexible pavement shall be 110 cm above the prepared subgrade.
The components are
Provide 2.5 cm thick SDBC (Semi Dense Bituminous Concrete) as the wearingcourse
Provide graded bituminous macadam Base Course, the thickness is 7.5 cm.
Provide granular subbase course of thickness is 100 cms.
3. The thickness of the rigid pavement to be provided is 40 cm.
4. Number of dowel bars shall be 4.
5. The pavement composition and layer thickness are as follows
Pavement quality concrete (PQC) = 400 mm
Dry lean concrete (DLC) = 100 mm
Granular sub-base (GSB) = 150 mm
6. Observing the cost abstract it is feasible to provide the Rigid pavement for the present
project.