semiconductors keep rolling along, but for how long? 2014 gartner.pdfgartner july, 2014 2014...
TRANSCRIPT
CONFIDENTIAL AND PROPRIETARY
This presentation, including any supporting materials, is owned by Gartner, Inc. and/or its affiliates and is for the sole use of the intended Gartner audience or other intended recipients. This presentation may contain information that is confidential, proprietary or otherwise legally protected, and it may not be further copied, distributed or publicly displayed without the express written permission of Gartner, Inc. or its affiliates. © 2014 Gartner, Inc. and/or its affiliates. All rights reserved.
Jim Walker
Meptec Luncheon
Sept 17, 2014
Semiconductors Keep Rolling Along, but for How Long?

Gartner July, 2014
Agenda
• Forecast Outlook for the semiconductor industry
- Devices
- Applications
• Forecast for capital equipment and spending
• Outsourcing Services
- Foundry
- SATS
1
Gartner July, 2014
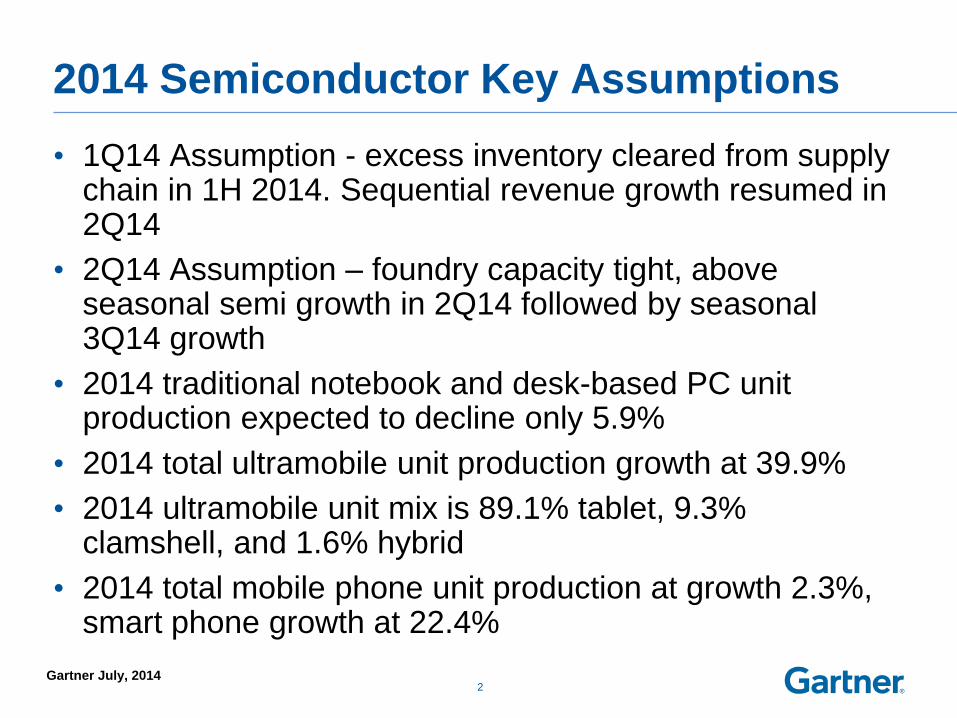
2014 Semiconductor Key Assumptions
• 1Q14 Assumption - excess inventory cleared from supply chain in 1H 2014. Sequential revenue growth resumed in 2Q14
• 2Q14 Assumption – foundry capacity tight, above seasonal semi growth in 2Q14 followed by seasonal 3Q14 growth
• 2014 traditional notebook and desk-based PC unit production expected to decline only 5.9%
• 2014 total ultramobile unit production growth at 39.9%
• 2014 ultramobile unit mix is 89.1% tablet, 9.3% clamshell, and 1.6% hybrid
• 2014 total mobile phone unit production at growth 2.3%, smart phone growth at 22.4%
2

Gartner July, 2014
0.40
0.60
0.80
1.00
1.20
1.40
1.60
1.80
1Q
07
3Q
07
1Q
08
3Q
08
1Q
09
3Q
09
1Q
10
3Q
10
1Q
11
3Q
11
1Q
12
3Q
12
1Q
13
3Q
13
1Q
14
SevereExcess
CautionZone
Semiconductor Inventory Index
Overall Semiconductor Days of Inventory Levels Drop in Q2
3
Gartner July, 2014
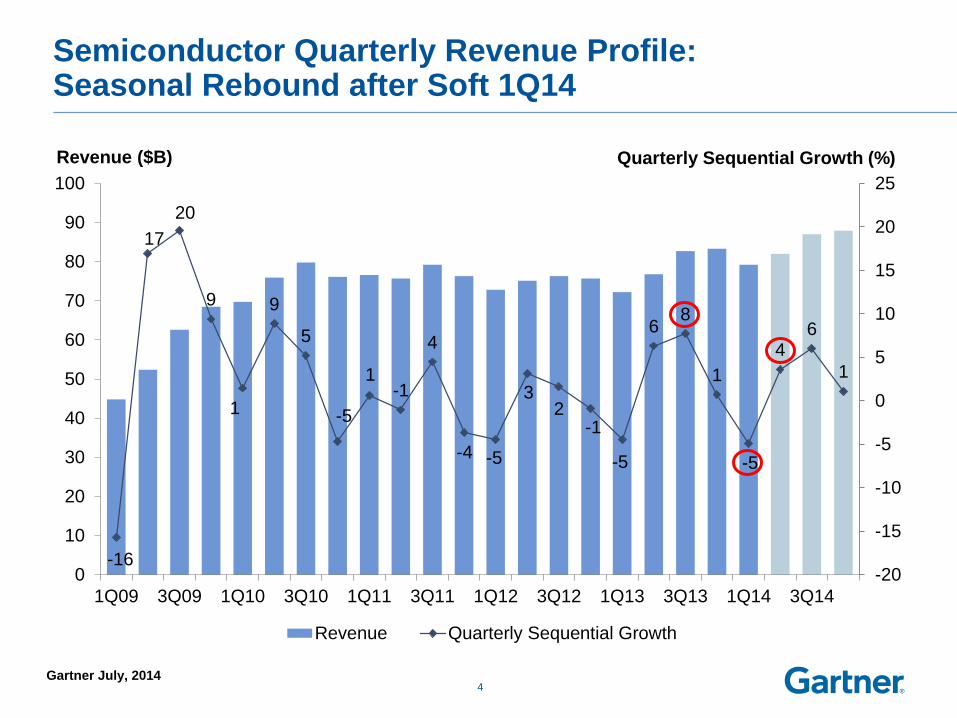
Semiconductor Quarterly Revenue Profile: Seasonal Rebound after Soft 1Q14
-16
17
20
9
1
9
5
-5
1-1
4
-4 -5
32
-1
-5
68
1
-5
46
1
-20
-15
-10
-5
0
5
10
15
20
25
0
10
20
30
40
50
60
70
80
90
100
1Q09 3Q09 1Q10 3Q10 1Q11 3Q11 1Q12 3Q12 1Q13 3Q13 1Q14 3Q14
Revenue ($B)
Revenue Quarterly Sequential Growth
Quarterly Sequential Growth (%)
4
Gartner July, 2014
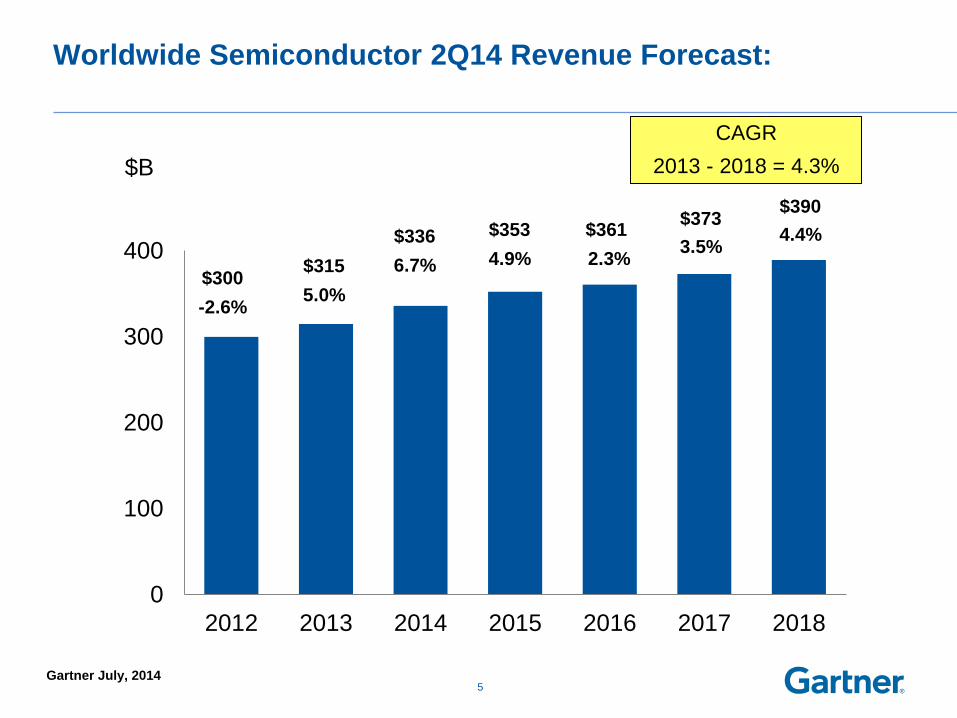
Worldwide Semiconductor 2Q14 Revenue Forecast:
5
0
100
200
300
400
2012 2013 2014 2015 2016 2017 2018
$B
CAGR
2013 - 2018 = 4.3%
$361
2.3% $300
-2.6%
$315
5.0%
$336
6.7%
$353
4.9%
$373
3.5%
$390
4.4%
Gartner July, 2014
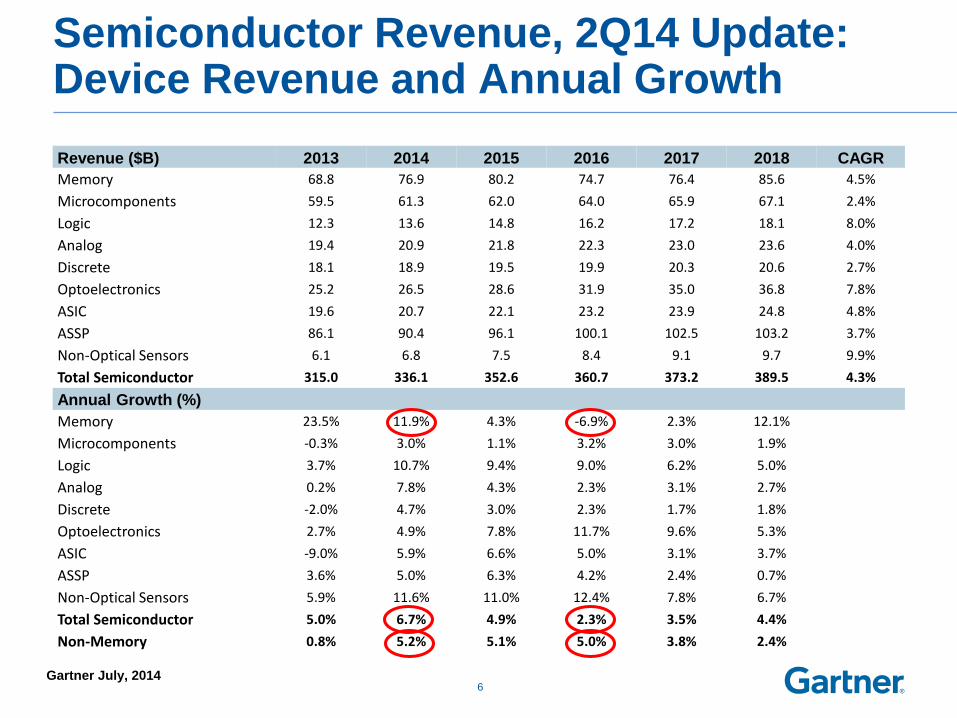
Semiconductor Revenue, 2Q14 Update: Device Revenue and Annual Growth
Revenue ($B) 2013 2014 2015 2016 2017 2018 CAGR
Memory 68.8 76.9 80.2 74.7 76.4 85.6 4.5%
Microcomponents 59.5 61.3 62.0 64.0 65.9 67.1 2.4%
Logic 12.3 13.6 14.8 16.2 17.2 18.1 8.0%
Analog 19.4 20.9 21.8 22.3 23.0 23.6 4.0%
Discrete 18.1 18.9 19.5 19.9 20.3 20.6 2.7%
Optoelectronics 25.2 26.5 28.6 31.9 35.0 36.8 7.8%
ASIC 19.6 20.7 22.1 23.2 23.9 24.8 4.8%
ASSP 86.1 90.4 96.1 100.1 102.5 103.2 3.7%
Non-Optical Sensors 6.1 6.8 7.5 8.4 9.1 9.7 9.9%
Total Semiconductor 315.0 336.1 352.6 360.7 373.2 389.5 4.3%
Annual Growth (%)
Memory 23.5% 11.9% 4.3% -6.9% 2.3% 12.1%
Microcomponents -0.3% 3.0% 1.1% 3.2% 3.0% 1.9%
Logic 3.7% 10.7% 9.4% 9.0% 6.2% 5.0%
Analog 0.2% 7.8% 4.3% 2.3% 3.1% 2.7%
Discrete -2.0% 4.7% 3.0% 2.3% 1.7% 1.8%
Optoelectronics 2.7% 4.9% 7.8% 11.7% 9.6% 5.3%
ASIC -9.0% 5.9% 6.6% 5.0% 3.1% 3.7%
ASSP 3.6% 5.0% 6.3% 4.2% 2.4% 0.7%
Non-Optical Sensors 5.9% 11.6% 11.0% 12.4% 7.8% 6.7%
Total Semiconductor 5.0% 6.7% 4.9% 2.3% 3.5% 4.4%
Non-Memory 0.8% 5.2% 5.1% 5.0% 3.8% 2.4%
6
Gartner July, 2014
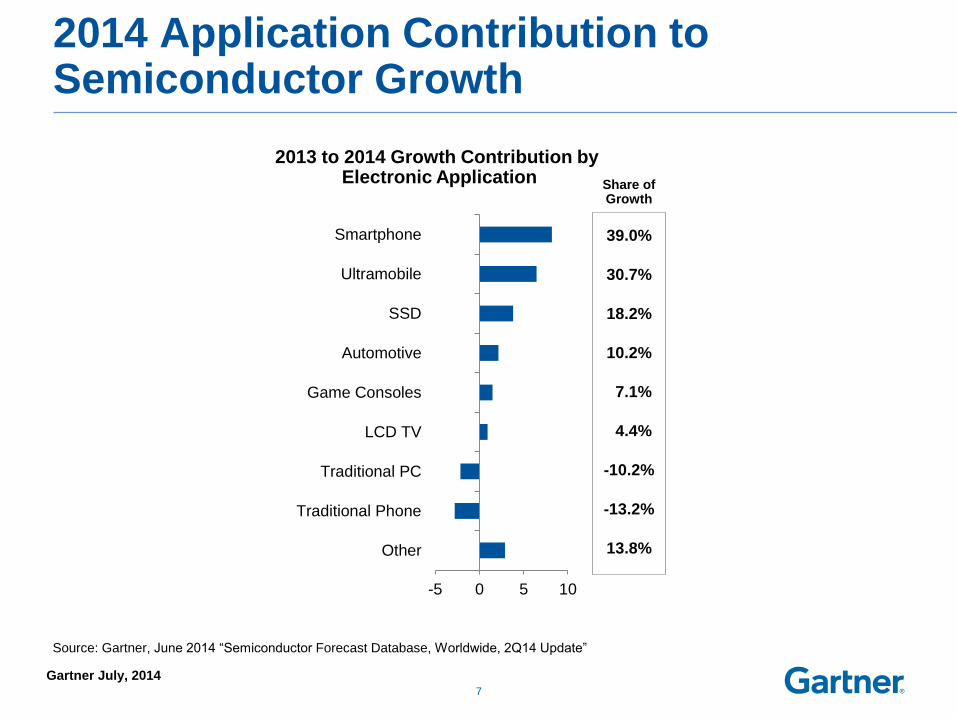
2014 Application Contribution to Semiconductor Growth
Share of Growth
7
39.0%
30.7%
18.2%
10.2%
7.1%
4.4%
-10.2%
-13.2%
13.8%
2013 to 2014 Growth Contribution by Electronic Application
-5 0 5 10
Smartphone
Ultramobile
SSD
Automotive
Game Consoles
LCD TV
Traditional PC
Traditional Phone
Other
Source: Gartner, June 2014 “Semiconductor Forecast Database, Worldwide, 2Q14 Update”
Gartner July, 2014
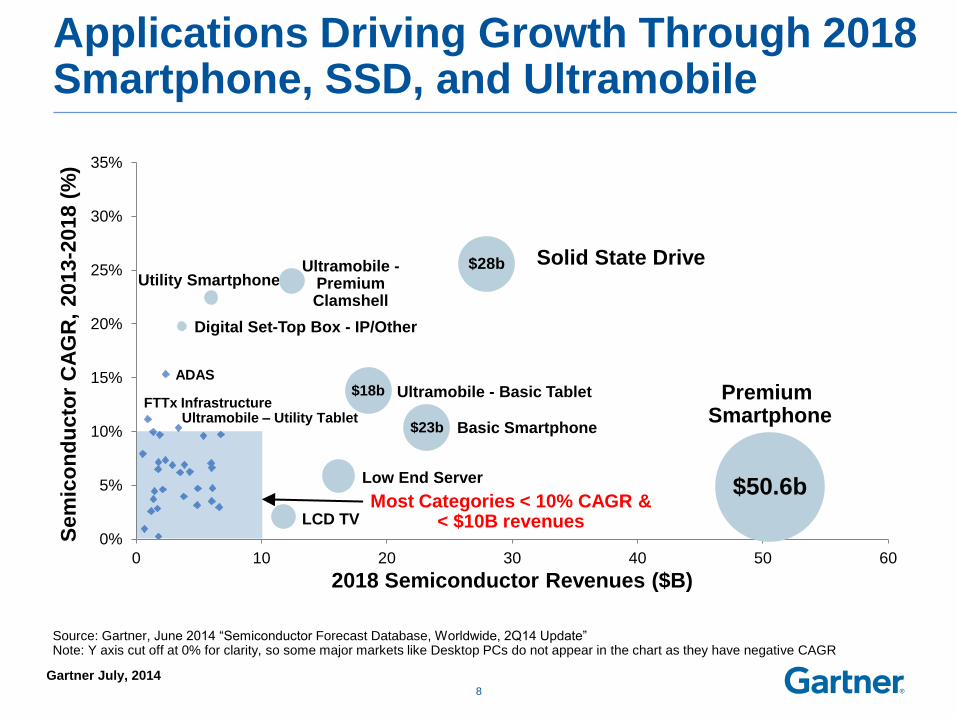
Applications Driving Growth Through 2018 Smartphone, SSD, and Ultramobile
8
Source: Gartner, June 2014 “Semiconductor Forecast Database, Worldwide, 2Q14 Update” Note: Y axis cut off at 0% for clarity, so some major markets like Desktop PCs do not appear in the chart as they have negative CAGR
0%
5%
10%
15%
20%
25%
30%
35%
0 10 20 30 40 50 60
Sem
ico
nd
ucto
r C
AG
R,
2013
-2018 (
%)
2018 Semiconductor Revenues ($B)
Solid State Drive $28b
Premium Smartphone
$50.6b
LCD TV
Low End Server
Basic Smartphone
Ultramobile - Basic Tablet
Ultramobile - Premium Clamshell
Utility Smartphone
Digital Set-Top Box - IP/Other
ADAS
FTTx Infrastructure Ultramobile – Utility Tablet
$23b
$18b
Most Categories < 10% CAGR & < $10B revenues
Gartner July, 2014
0
20,000
40,000
60,000
80,000
100,000
2012 2013 2014 2015 2016 2017 2018
Premium Traditional OS
Basic Traditional OS
Utility Traditional OS
Premium Smart OS
Basic Smart OS
Utility Smart OS
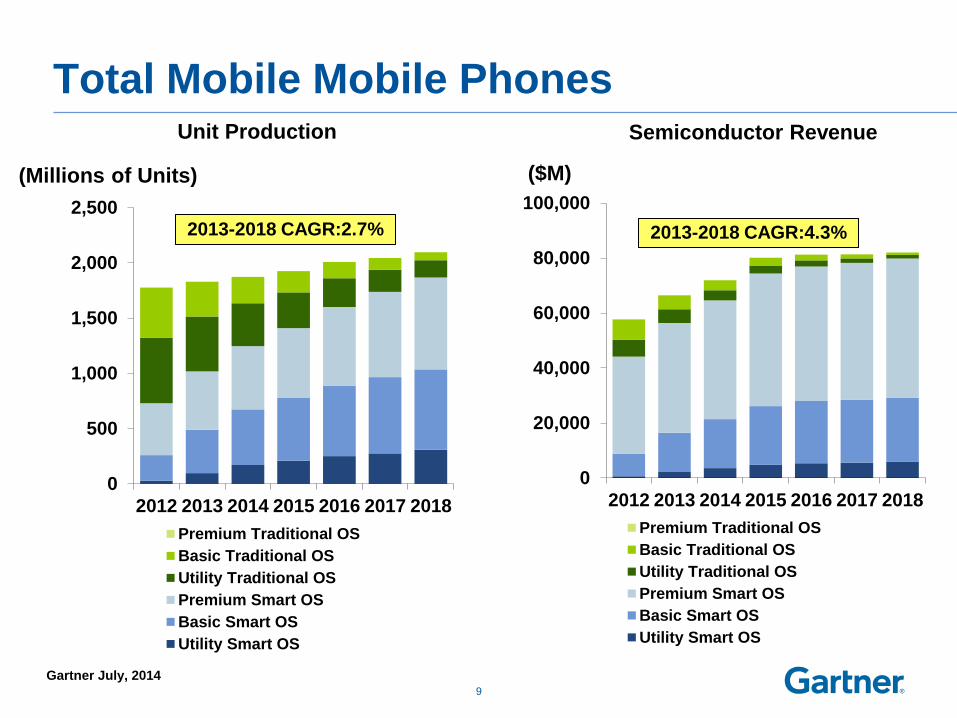
Total Mobile Mobile Phones
0
500
1,000
1,500
2,000
2,500
2012 2013 2014 2015 2016 2017 2018
Premium Traditional OS
Basic Traditional OS
Utility Traditional OS
Premium Smart OS
Basic Smart OS
Utility Smart OS
9
Unit Production
(Millions of Units)
2013-2018 CAGR:2.7% 2013-2018 CAGR:4.3%
($M)
Semiconductor Revenue
Gartner July, 2014
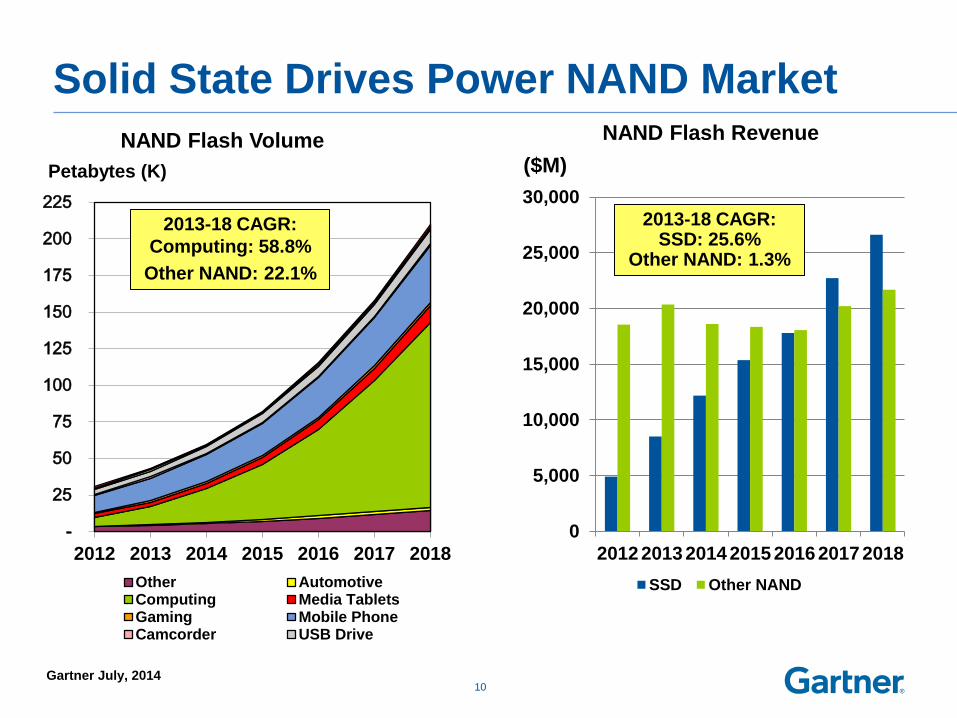
Solid State Drives Power NAND Market
10
0
5,000
10,000
15,000
20,000
25,000
30,000
2012 2013 2014 2015 2016 2017 2018
SSD Other NAND
2013-18 CAGR: SSD: 25.6%
Other NAND: 1.3%
NAND Flash Revenue
($M)
-
25
50
75
100
125
150
175
200
225
2012 2013 2014 2015 2016 2017 2018
Other AutomotiveComputing Media TabletsGaming Mobile PhoneCamcorder USB Drive
Petabytes (K)
NAND Flash Volume
2013-18 CAGR:
Computing: 58.8%
Other NAND: 22.1%
Gartner July, 2014
11
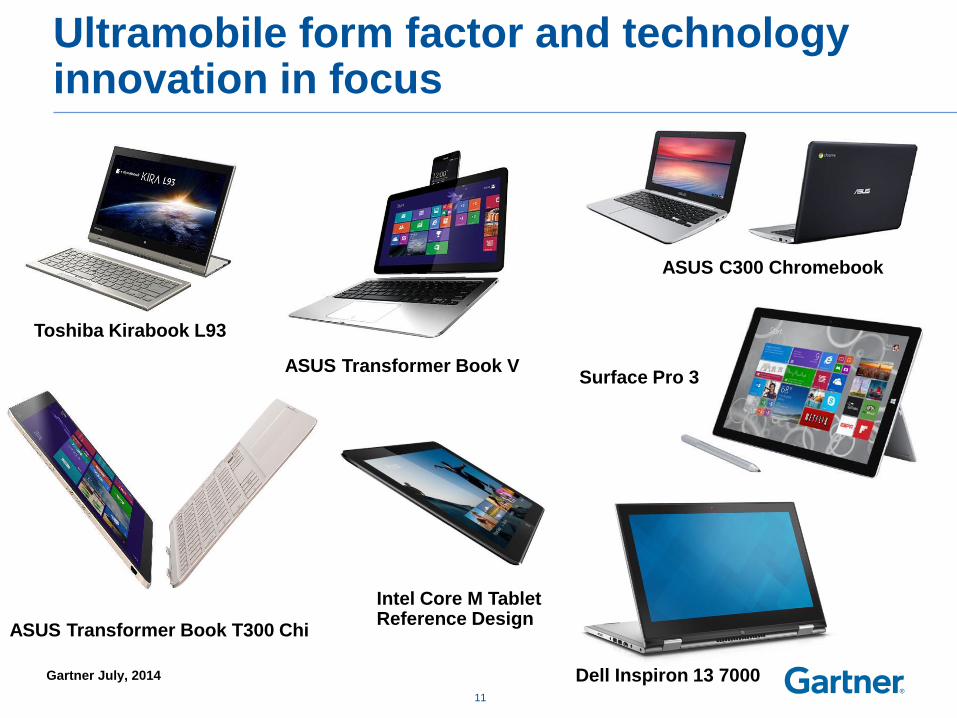
Surface Pro 3
ASUS C300 Chromebook
Dell Inspiron 13 7000
Intel Core M Tablet Reference Design
Toshiba Kirabook L93
ASUS Transformer Book T300 Chi
ASUS Transformer Book V
Ultramobile form factor and technology innovation in focus
Gartner July, 2014
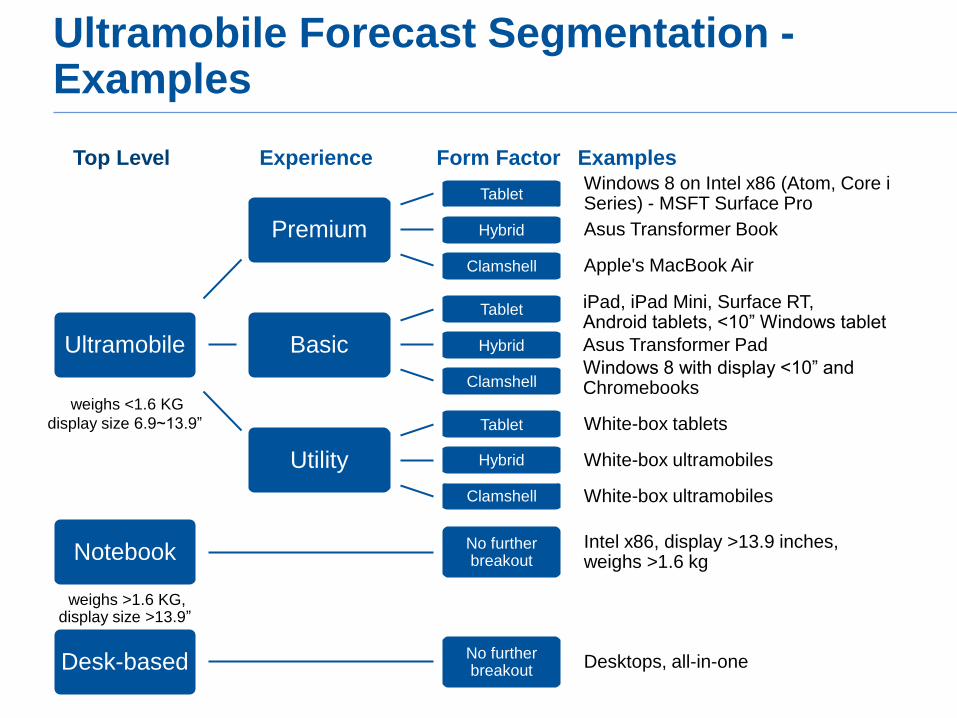
Ultramobile Forecast Segmentation - Examples
Examples
iPad, iPad Mini, Surface RT, Android tablets, <10” Windows tablet
Asus Transformer Pad
Windows 8 with display <10” and Chromebooks
White-box ultramobiles
Experience Form Factor Top Level
Intel x86, display >13.9 inches, weighs >1.6 kg
Desktops, all-in-one
Windows 8 on Intel x86 (Atom, Core i Series) - MSFT Surface Pro
Apple's MacBook Air
White-box tablets
White-box ultramobiles
Asus Transformer Book
weighs <1.6 KG
display size 6.9~13.9”
weighs >1.6 KG, display size >13.9”
Utility
Clamshell
Hybrid
Tablet
Ultramobile Basic
Tablet
Hybrid
Clamshell
Premium
Clamshell
Hybrid
Tablet
Notebook
Desk-based
No further breakout
No further breakout
Gartner July, 2014
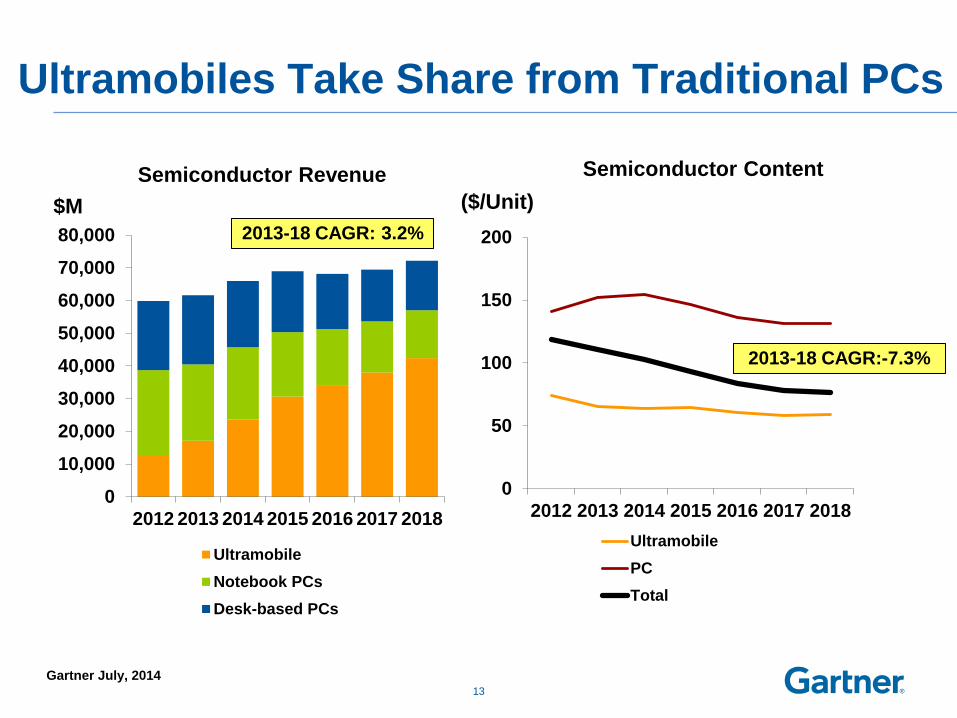
Ultramobiles Take Share from Traditional PCs
13
0
10,000
20,000
30,000
40,000
50,000
60,000
70,000
80,000
2012 2013 2014 2015 2016 2017 2018
Ultramobile
Notebook PCs
Desk-based PCs
Semiconductor Revenue
0
50
100
150
200
2012 2013 2014 2015 2016 2017 2018
Ultramobile
PC
Total
Semiconductor Content
2013-18 CAGR: 3.2%
2013-18 CAGR:-7.3%
$M ($/Unit)
Gartner July, 2014
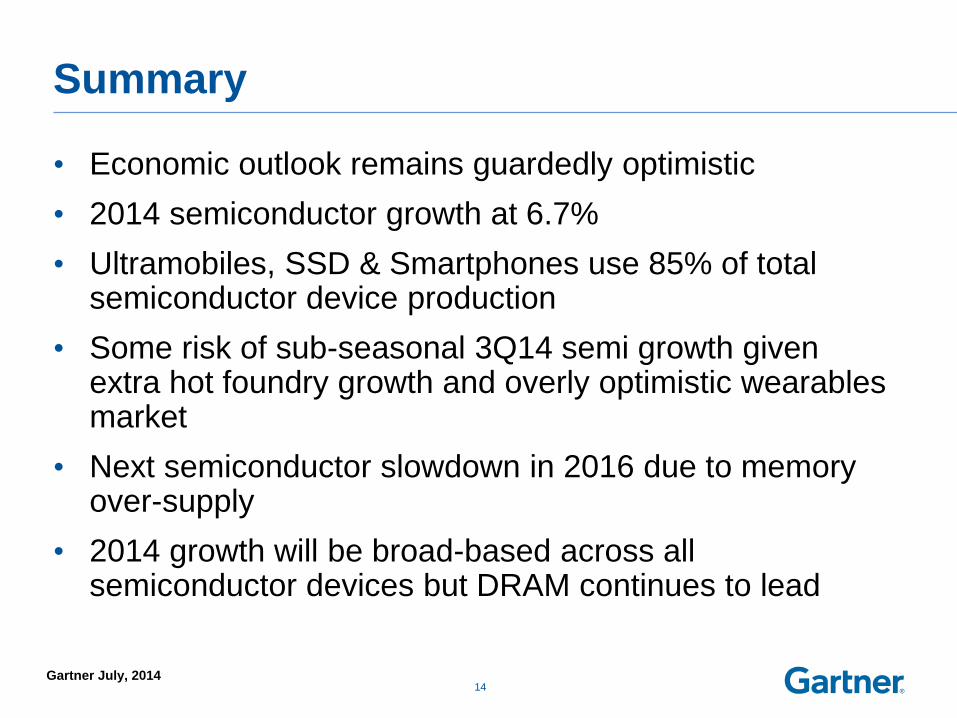
Summary
• Economic outlook remains guardedly optimistic
• 2014 semiconductor growth at 6.7%
• Ultramobiles, SSD & Smartphones use 85% of total semiconductor device production
• Some risk of sub-seasonal 3Q14 semi growth given extra hot foundry growth and overly optimistic wearables market
• Next semiconductor slowdown in 2016 due to memory over-supply
• 2014 growth will be broad-based across all semiconductor devices but DRAM continues to lead
14
CONFIDENTIAL AND PROPRIETARY
This presentation, including any supporting materials, is owned by Gartner, Inc. and/or its affiliates and is for the sole use of the intended Gartner audience or other intended recipients. This presentation may contain information that is confidential, proprietary or otherwise legally protected, and it may not be further copied, distributed or publicly displayed without the express written permission of Gartner, Inc. or its affiliates. © 2014 Gartner, Inc. and/or its affiliates. All rights reserved.
Capital Spending and Equipment
Gartner July, 2014
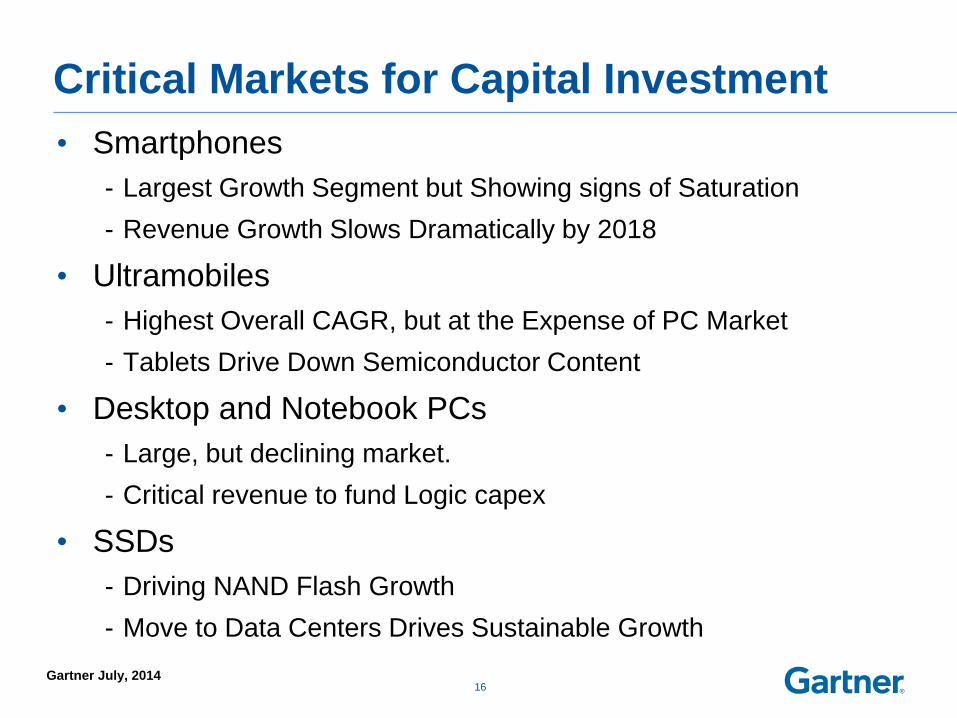
Critical Markets for Capital Investment
• Smartphones
- Largest Growth Segment but Showing signs of Saturation
- Revenue Growth Slows Dramatically by 2018
• Ultramobiles
- Highest Overall CAGR, but at the Expense of PC Market
- Tablets Drive Down Semiconductor Content
• Desktop and Notebook PCs
- Large, but declining market.
- Critical revenue to fund Logic capex
• SSDs
- Driving NAND Flash Growth
- Move to Data Centers Drives Sustainable Growth
16

Gartner July, 2014
Critical Markets for Capital Investment
17
0
20,000
40,000
60,000
80,000
100,000
120,000
140,000
160,000
2012 2013 2014 2015 2016 2017 2018
Ultramobile TraditionalPCs
Smartphones
Semiconductor Revenue
0
50
100
150
200
2012 2013 2014 2015 2016 2017 2018
Ultramobile
TraditionalPCs
Smartphones
Semiconductor Content
2013-18 CAGR: 5.2% $M ($/Unit)
Gartner July, 2014
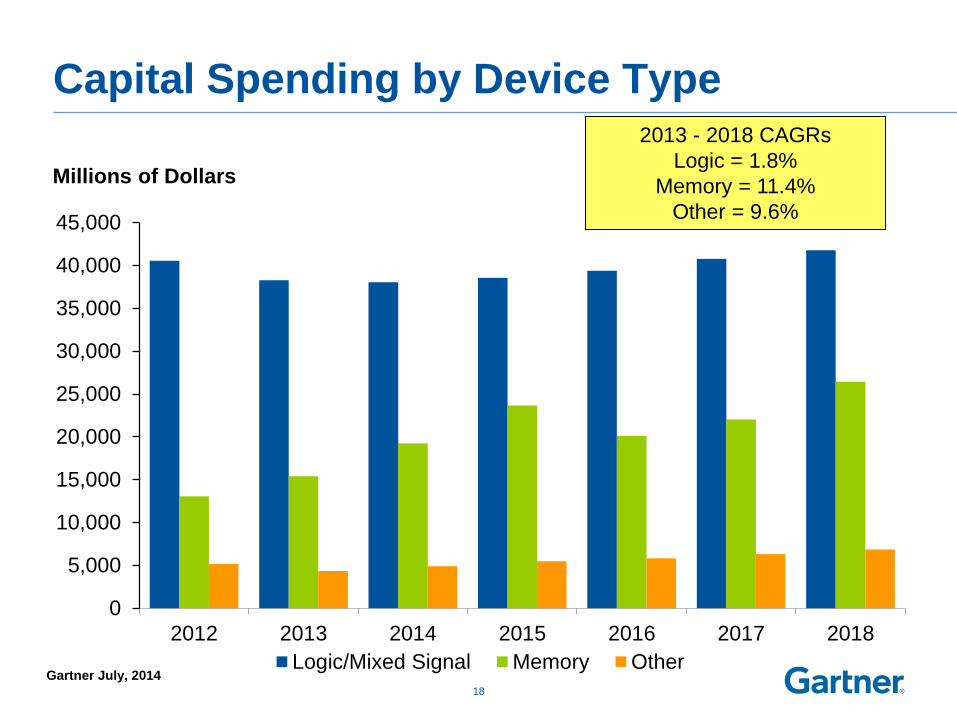
Capital Spending by Device Type
0
5,000
10,000
15,000
20,000
25,000
30,000
35,000
40,000
45,000
2012 2013 2014 2015 2016 2017 2018
Logic/Mixed Signal Memory Other
Millions of Dollars
18
2013 - 2018 CAGRs
Logic = 1.8%
Memory = 11.4%
Other = 9.6%
Gartner July, 2014
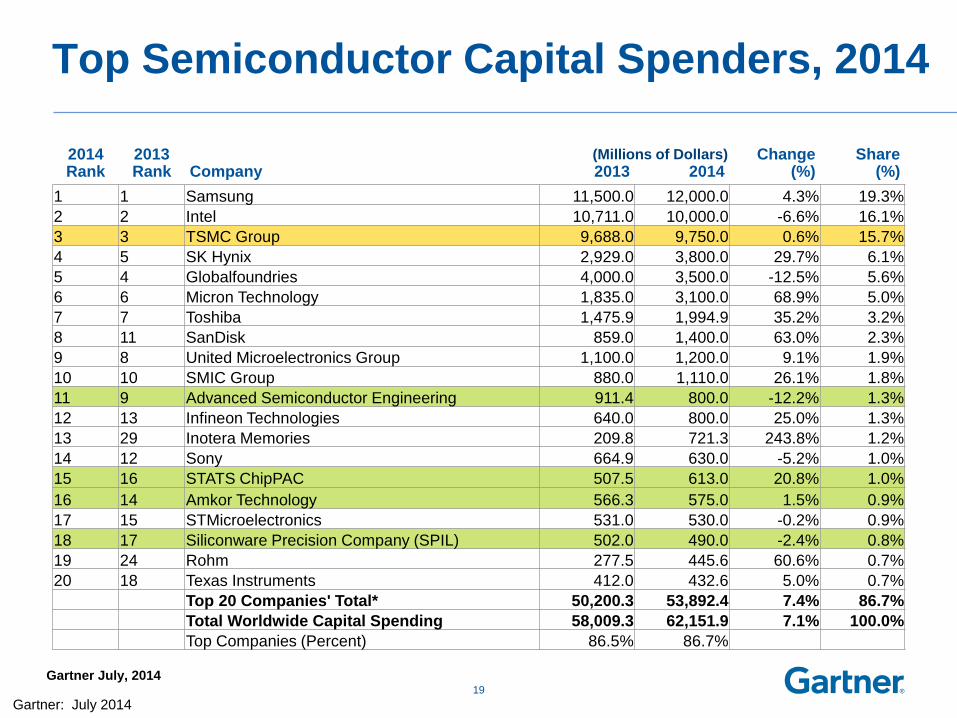
Top Semiconductor Capital Spenders, 2014
2014 Rank
2013 Rank Company 2013 2014
Change (%)
Share (%)
1 1 Samsung 11,500.0 12,000.0 4.3% 19.3%
2 2 Intel 10,711.0 10,000.0 -6.6% 16.1%
3 3 TSMC Group 9,688.0 9,750.0 0.6% 15.7%
4 5 SK Hynix 2,929.0 3,800.0 29.7% 6.1%
5 4 Globalfoundries 4,000.0 3,500.0 -12.5% 5.6%
6 6 Micron Technology 1,835.0 3,100.0 68.9% 5.0%
7 7 Toshiba 1,475.9 1,994.9 35.2% 3.2%
8 11 SanDisk 859.0 1,400.0 63.0% 2.3%
9 8 United Microelectronics Group 1,100.0 1,200.0 9.1% 1.9%
10 10 SMIC Group 880.0 1,110.0 26.1% 1.8%
11 9 Advanced Semiconductor Engineering 911.4 800.0 -12.2% 1.3%
12 13 Infineon Technologies 640.0 800.0 25.0% 1.3%
13 29 Inotera Memories 209.8 721.3 243.8% 1.2%
14 12 Sony 664.9 630.0 -5.2% 1.0%
15 16 STATS ChipPAC 507.5 613.0 20.8% 1.0%
16 14 Amkor Technology 566.3 575.0 1.5% 0.9%
17 15 STMicroelectronics 531.0 530.0 -0.2% 0.9%
18 17 Siliconware Precision Company (SPIL) 502.0 490.0 -2.4% 0.8%
19 24 Rohm 277.5 445.6 60.6% 0.7%
20 18 Texas Instruments 412.0 432.6 5.0% 0.7%
Top 20 Companies' Total* 50,200.3 53,892.4 7.4% 86.7%
Total Worldwide Capital Spending 58,009.3 62,151.9 7.1% 100.0%
Top Companies (Percent) 86.5% 86.7%
19
(Millions of Dollars)
Gartner: July 2014
CONFIDENTIAL AND PROPRIETARY
This presentation, including any supporting materials, is owned by Gartner, Inc. and/or its affiliates and is for the sole use of the intended Gartner audience or other intended recipients. This presentation may contain information that is confidential, proprietary or otherwise legally protected, and it may not be further copied, distributed or publicly displayed without the express written permission of Gartner, Inc. or its affiliates. © 2014 Gartner, Inc. and/or its affiliates. All rights reserved.
Semiconductor Outsourcing Services – Foundry &SATS
Gartner July, 2014
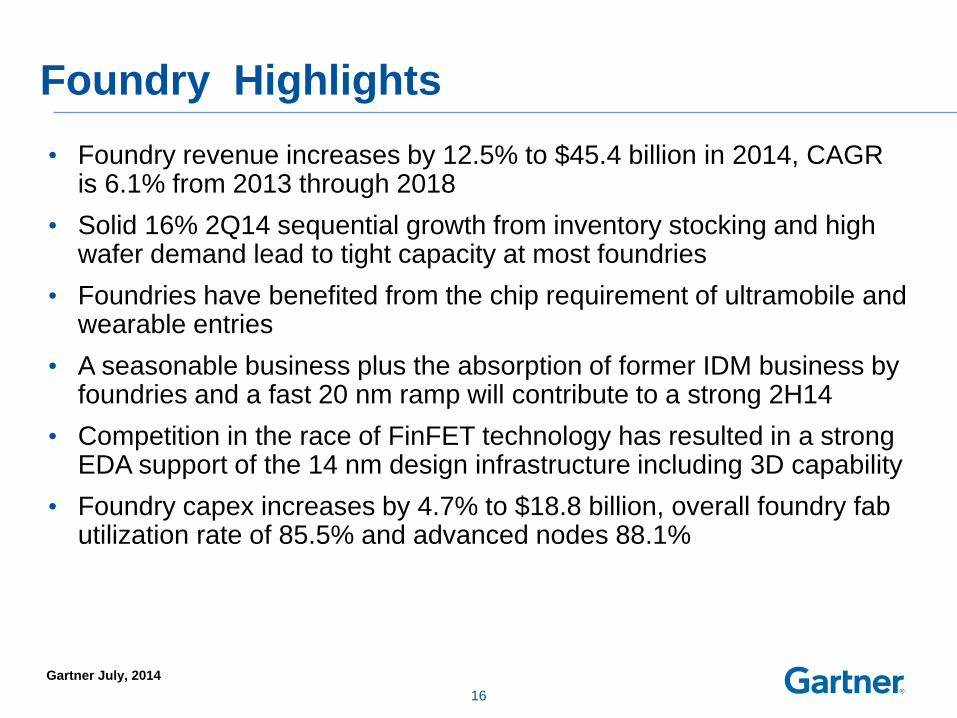
Foundry Highlights
21
• Foundry revenue increases by 12.5% to $45.4 billion in 2014, CAGR is 6.1% from 2013 through 2018
• Solid 16% 2Q14 sequential growth from inventory stocking and high wafer demand lead to tight capacity at most foundries
• Foundries have benefited from the chip requirement of ultramobile and wearable entries
• A seasonable business plus the absorption of former IDM business by foundries and a fast 20 nm ramp will contribute to a strong 2H14
• Competition in the race of FinFET technology has resulted in a strong EDA support of the 14 nm design infrastructure including 3D capability
• Foundry capex increases by 4.7% to $18.8 billion, overall foundry fab utilization rate of 85.5% and advanced nodes 88.1%
16
Gartner July, 2014
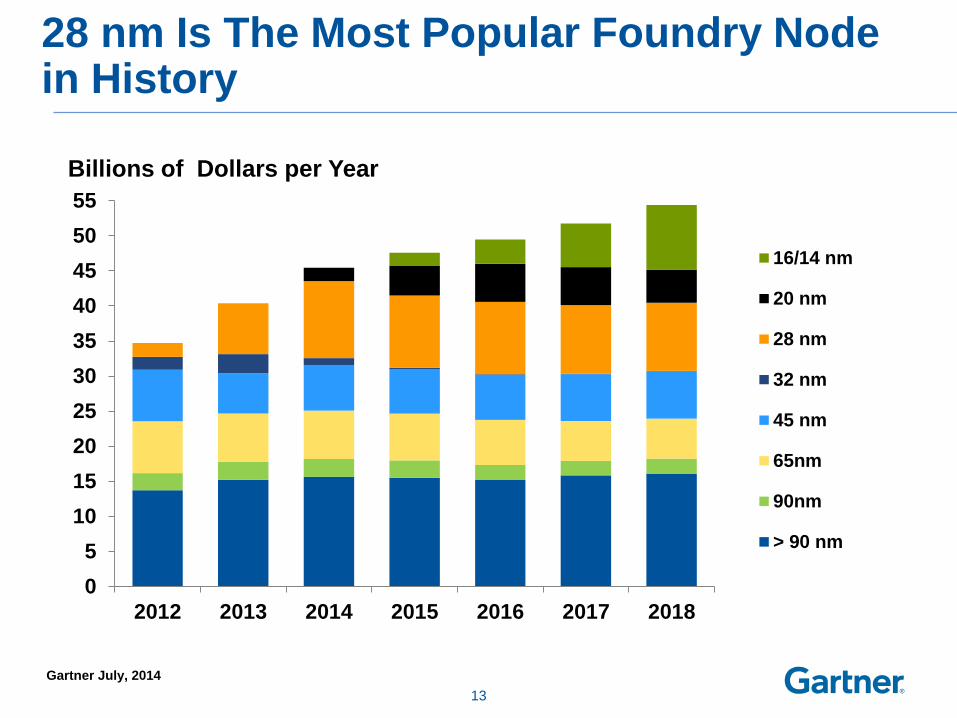
28 nm Is The Most Popular Foundry Node in History
0
5
10
15
20
25
30
35
40
45
50
55
2012 2013 2014 2015 2016 2017 2018
16/14 nm
20 nm
28 nm
32 nm
45 nm
65nm
90nm
> 90 nm
Billions of Dollars per Year
22 13
Gartner July, 2014
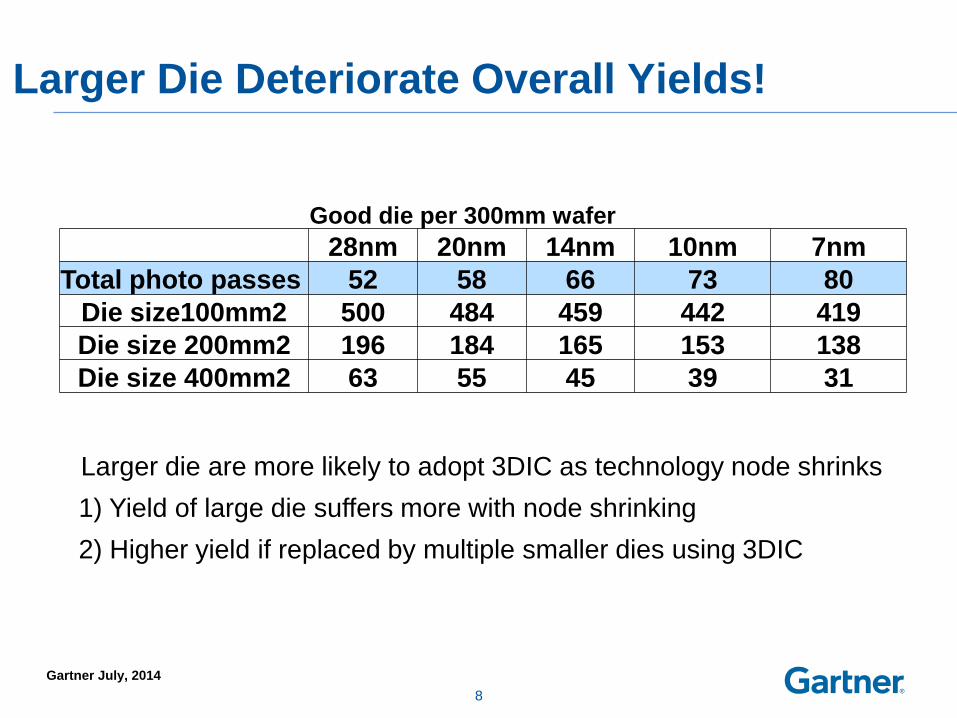
Larger Die Deteriorate Overall Yields!
23
Good die per 300mm wafer
28nm 20nm 14nm 10nm 7nm
Total photo passes 52 58 66 73 80
Die size100mm2 500 484 459 442 419
Die size 200mm2 196 184 165 153 138
Die size 400mm2 63 55 45 39 31
Larger die are more likely to adopt 3DIC as technology node shrinks
1) Yield of large die suffers more with node shrinking
2) Higher yield if replaced by multiple smaller dies using 3DIC
8
Gartner July, 2014
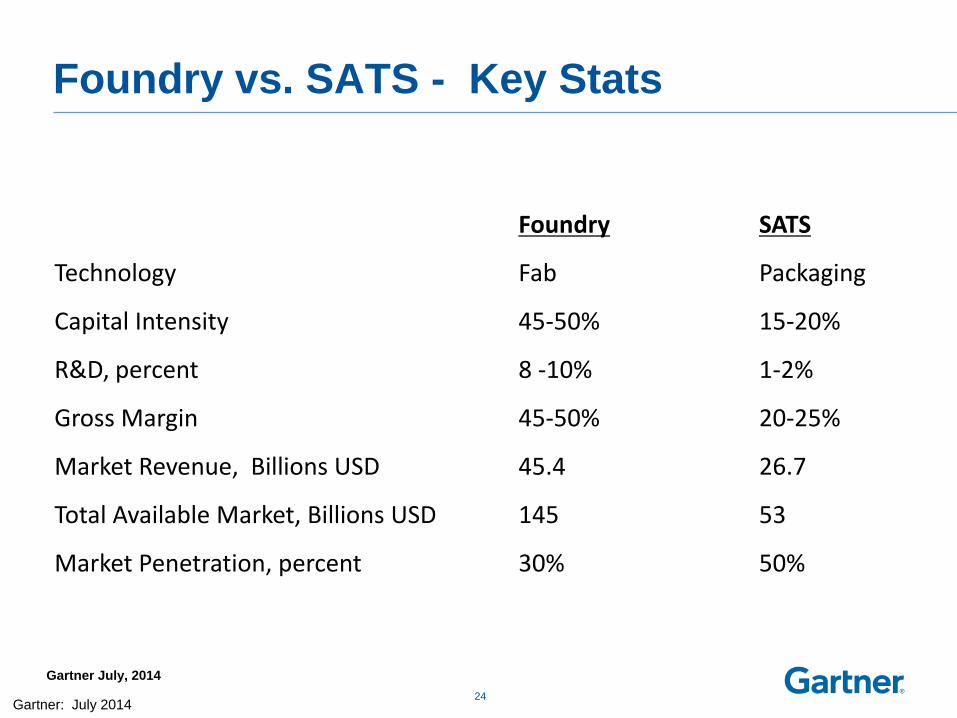
Foundry vs. SATS - Key Stats
24
Foundry SATS
Technology Fab Packaging
Capital Intensity 45-50% 15-20%
R&D, percent 8 -10% 1-2%
Gross Margin 45-50% 20-25%
Market Revenue, Billions USD 45.4 26.7
Total Available Market, Billions USD 145 53
Market Penetration, percent 30% 50%
Gartner: July 2014
Gartner July, 2014
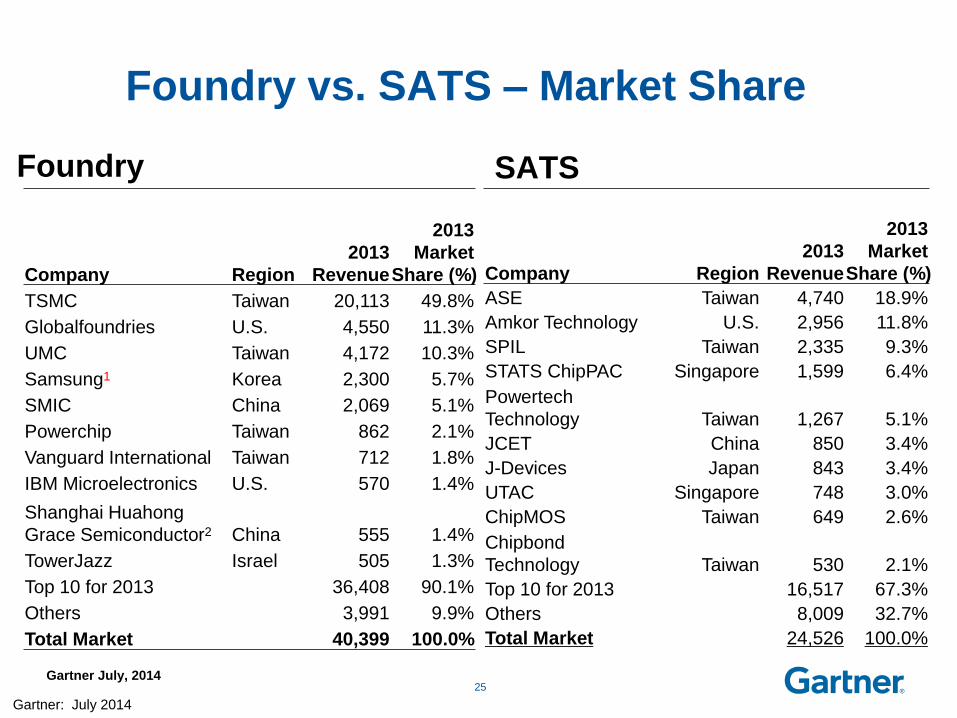
Foundry vs. SATS – Market Share
Foundry
Company Region
2013
Revenue
2013
Market
Share (%)
ASE Taiwan 4,740 18.9%
Amkor Technology U.S. 2,956 11.8%
SPIL Taiwan 2,335 9.3%
STATS ChipPAC Singapore 1,599 6.4%
Powertech
Technology Taiwan 1,267 5.1%
JCET China 850 3.4%
J-Devices Japan 843 3.4%
UTAC Singapore 748 3.0%
ChipMOS Taiwan 649 2.6%
Chipbond
Technology Taiwan 530 2.1%
Top 10 for 2013 16,517 67.3%
Others 8,009 32.7%
Total Market 24,526 100.0%
SATS
25
Company Region
2013
Revenue
2013
Market
Share (%)
TSMC Taiwan 20,113 49.8%
Globalfoundries U.S. 4,550 11.3%
UMC Taiwan 4,172 10.3%
Samsung1 Korea 2,300 5.7%
SMIC China 2,069 5.1%
Powerchip Taiwan 862 2.1%
Vanguard International Taiwan 712 1.8%
IBM Microelectronics U.S. 570 1.4%
Shanghai Huahong
Grace Semiconductor2 China 555 1.4%
TowerJazz Israel 505 1.3%
Top 10 for 2013 36,408 90.1%
Others 3,991 9.9%
Total Market 40,399 100.0%
Gartner: July 2014
Gartner July, 2014
26
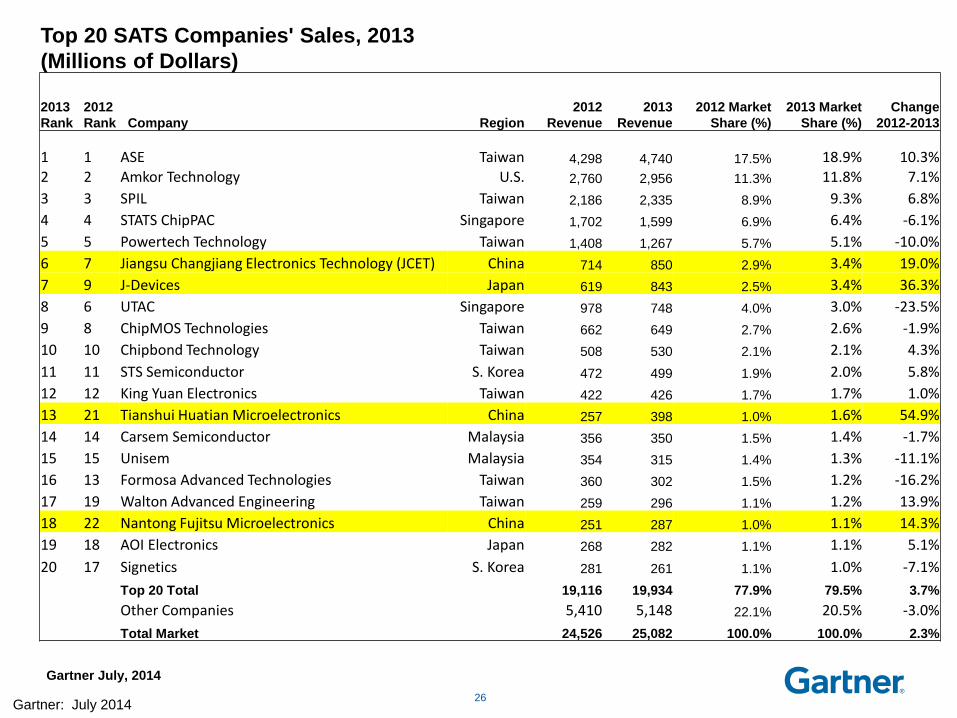
Top 20 SATS Companies' Sales, 2013
(Millions of Dollars)
2013
Rank
2012
Rank Company Region
2012
Revenue
2013
Revenue
2012 Market
Share (%)
2013 Market
Share (%)
Change
2012-2013
1 1 ASE Taiwan 4,298 4,740 17.5% 18.9% 10.3% 2 2 Amkor Technology U.S. 2,760 2,956 11.3% 11.8% 7.1%
3 3 SPIL Taiwan 2,186 2,335 8.9% 9.3% 6.8%
4 4 STATS ChipPAC Singapore 1,702 1,599 6.9% 6.4% -6.1%
5 5 Powertech Technology Taiwan 1,408 1,267 5.7% 5.1% -10.0%
6 7 Jiangsu Changjiang Electronics Technology (JCET) China 714 850 2.9% 3.4% 19.0%
7 9 J-Devices Japan 619 843 2.5% 3.4% 36.3%
8 6 UTAC Singapore 978 748 4.0% 3.0% -23.5%
9 8 ChipMOS Technologies Taiwan 662 649 2.7% 2.6% -1.9%
10 10 Chipbond Technology Taiwan 508 530 2.1% 2.1% 4.3%
11 11 STS Semiconductor S. Korea 472 499 1.9% 2.0% 5.8%
12 12 King Yuan Electronics Taiwan 422 426 1.7% 1.7% 1.0%
13 21 Tianshui Huatian Microelectronics China 257 398 1.0% 1.6% 54.9%
14 14 Carsem Semiconductor Malaysia 356 350 1.5% 1.4% -1.7%
15 15 Unisem Malaysia 354 315 1.4% 1.3% -11.1%
16 13 Formosa Advanced Technologies Taiwan 360 302 1.5% 1.2% -16.2%
17 19 Walton Advanced Engineering Taiwan 259 296 1.1% 1.2% 13.9%
18 22 Nantong Fujitsu Microelectronics China 251 287 1.0% 1.1% 14.3%
19 18 AOI Electronics Japan 268 282 1.1% 1.1% 5.1%
20 17 Signetics S. Korea 281 261 1.1% 1.0% -7.1%
Top 20 Total 19,116 19,934 77.9% 79.5% 3.7%
Other Companies 5,410 5,148 22.1% 20.5% -3.0%
Total Market 24,526 25,082 100.0% 100.0% 2.3%
Gartner: July 2014
Gartner July, 2014
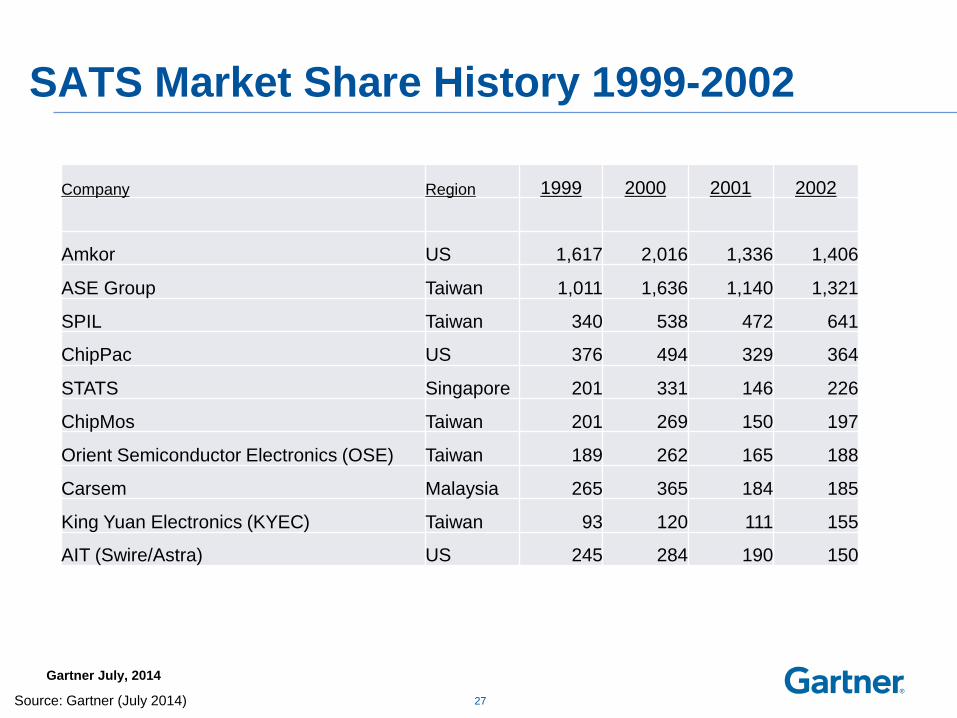
SATS Market Share History 1999-2002
27
Company Region 1999 2000 2001 2002
Amkor US 1,617 2,016 1,336 1,406
ASE Group Taiwan 1,011 1,636 1,140 1,321
SPIL Taiwan 340 538 472 641
ChipPac US 376 494 329 364
STATS Singapore 201 331 146 226
ChipMos Taiwan 201 269 150 197
Orient Semiconductor Electronics (OSE) Taiwan 189 262 165 188
Carsem Malaysia 265 365 184 185
King Yuan Electronics (KYEC) Taiwan 93 120 111 155
AIT (Swire/Astra) US 245 284 190 150
Source: Gartner (July 2014)
Gartner July, 2014
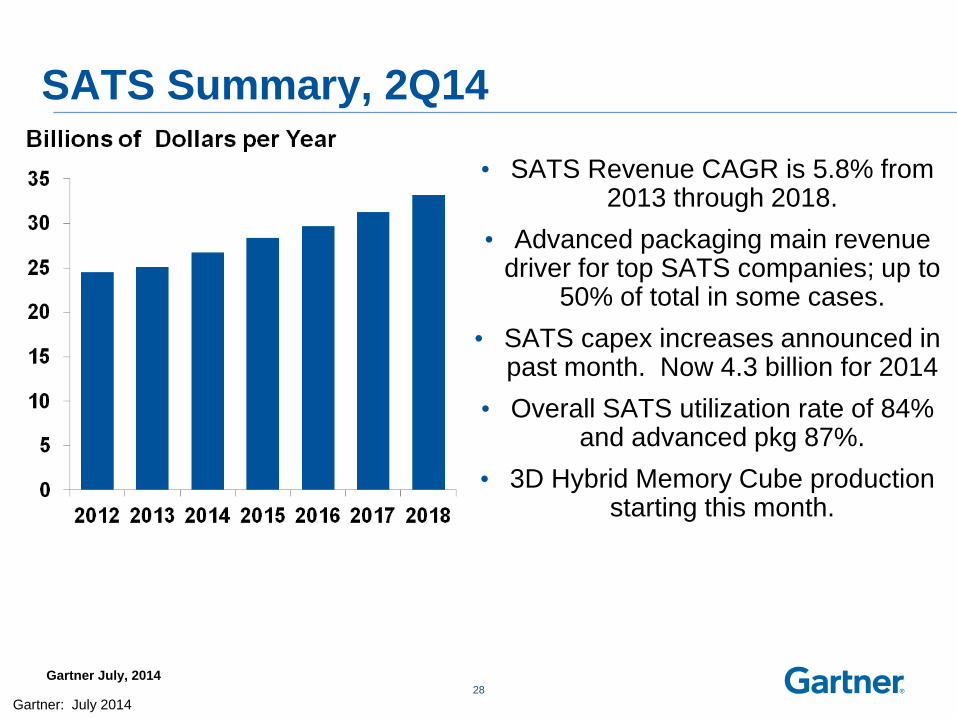
SATS Summary, 2Q14
28
• SATS Revenue CAGR is 5.8% from 2013 through 2018.
• Advanced packaging main revenue driver for top SATS companies; up to
50% of total in some cases.
• SATS capex increases announced in past month. Now 4.3 billion for 2014
• Overall SATS utilization rate of 84% and advanced pkg 87%.
• 3D Hybrid Memory Cube production starting this month.
Gartner: July 2014
Gartner July, 2014
Key Findings for SATS Industry
• Virtual and vertical integration of outsourcing is occurring as the manufacturing processes of wafer fab, packaging, and system assembly converge. Outsourcing business models are changing.
• Wafer-based packaging processes are now mainstream. In addition to companies within the SATS market, the foundry market has also emerged as a SATS competitor.
• The SATS industry has reached above the 50% outsourcing mark. Even so, the SATS market will still exhibit a growth rate above that of the overall semiconductor device industry, with a five-year compound annual growth rate (CAGR) of 5.8% from 2013 through 2018.
• Expansion into China by the SATS companies continues, as engineering expertise and supply chain infrastructure are fully developed in the area.
• The top five companies comprise approximately 50% of the SATS market revenue for 2013. While their growth will approach 60% of the market by 2018, consolidation must occur among the more than 150 companies participating in the SATS industry.
• Many SATS companies not be able to develop the necessary capital required for the increased complexity and wafer-like equipment cost required to stay competitive.
• As competition intensifies and capital requirements increase, the market will stratify into three segments: leading edge, specialty niche and sunset/mature packaging services.
29

Gartner July, 2014 Source for GDP data: IHS Global Insight, June 2014
Q2/14 Forecast Growth Scorecard
2014 2015
Revenue Growth (%) -6 Mos -3 Mos Now -6 Mos -3 Mos Now
Global Real GDP +3.0 +3.0 +2.8 +3.4 +3.5 +3.3
U.S. Real GDP +2.5 +2.5 +2.2 +3.1 +3.3 +3.1
Elec. Equipment1 +3.7 +3.9 +3.4 +4.6 +5.0 +3.5
Semiconductor2 +5.4 +5.4 +6.7 +2.8 +4.8 +4.9
Foundry +7.9 +9.9 +12.5 +4.6 +4.7 +4.7
SATS +8.6 +6.4 +6.6 +5.9 +6.1 +6.2
Capital Spending +9.9 +5.5 +7.1 +12.2 +10.0 +8.9
Equip. Spending +16.1 +12.2 +15.0 +16.3 +12.8 +11.0
WFE +16.4 +13.0 +16.1 +16.7 +10.6 +8.9
PAE +14.7 +7.4 +8.6 +12.9 +21.5 +23.6
ATE +15.2 +11.7 +14.7 +19.2 +26.6 +14.0
Silicon (MSI) +3.3 +4.8 +10.5 +5.3 +4.0 +3.1 1 Production revenue
2 Excluding solar