semiannual report - modern woodmen of america · t. rowe price mid-cap growth portfolio the views...
TRANSCRIPT

SEMIANNUAL REPORTJune 30, 2018
Mid-Cap Growth PortfolioT. ROWE PRICE
For more insights from T. Rowe Price investment professionals, go to troweprice.com.
srmgp_0618_P4Proof #

srmgp_0618_P4Proof #
T. Rowe PRice Mid-caP GRowTh PoRTfolio
Management’s discussion of fund Performance
T. Rowe PRice Mid-caP GRowTh PoRTfolio
HIGHLIGHTS
n Mid-cap growth stocks continued to record highs in the first half of 2018.
n The Mid-Cap Growth Portfolio recorded a decent gain but modestly trailed its benchmark in the period.
n The market’s focus on growth above all else—including profitability—did not suit our valuation-sensitive approach to growth investing.
n As the experience of the dot-com years demonstrates, the current growth mania cannot last forever, but predicting when reason will return is difficult.
It’s fast—receive your statements and confirmations faster than U.S. mail.
It’s convenient—access your important account documents whenever you need them.
It’s secure—we protect your online accounts using “True Identity” to confirm new accounts and make verification faster and more secure.
It can save you money—where applicable, T. Rowe Price passes on the cost savings to fund holders.*
TO ENROLL:If you invest directly with T. Rowe Price, go to troweprice.com/paperless.
If you invest through an investment advisor, a bank, or a brokerage firm, please contact that organization and ask if it can provide electronic documentation.
Go PaperlessSign up for e-delivery of your statements, confirmations, and prospectuses or shareholder reports.
Log in to your account at troweprice.com for more information.
* Certain mutual fund accounts that are assessed an annual account service fee can also save money by switching to e-delivery.
srmgp_0618_P4Proof #
1
T. Rowe PRice Mid-caP GRowTh PoRTfolio
Management’s discussion of fund Performance
T. Rowe PRice Mid-caP GRowTh PoRTfolio
dear investor
After a brief setback in February, the market resumed its upward march in early 2018. As of June, the S&P 500’s rally had continued for 112 months, putting it within grasping distance of the epic 114-month bull market run of the 1990s. In our letter six months ago, we discussed how comparisons with the 1990s transcend timespans and encompass many other worrying similarities—among them, an intense focus on growth above all other considerations, nonsensical valuations for firms that have never turned a profit, and a general sense of euphoria that pushes aside attention to risk. The persistence of these trends over the past six months has only served to heighten our sense that caution is warranted.
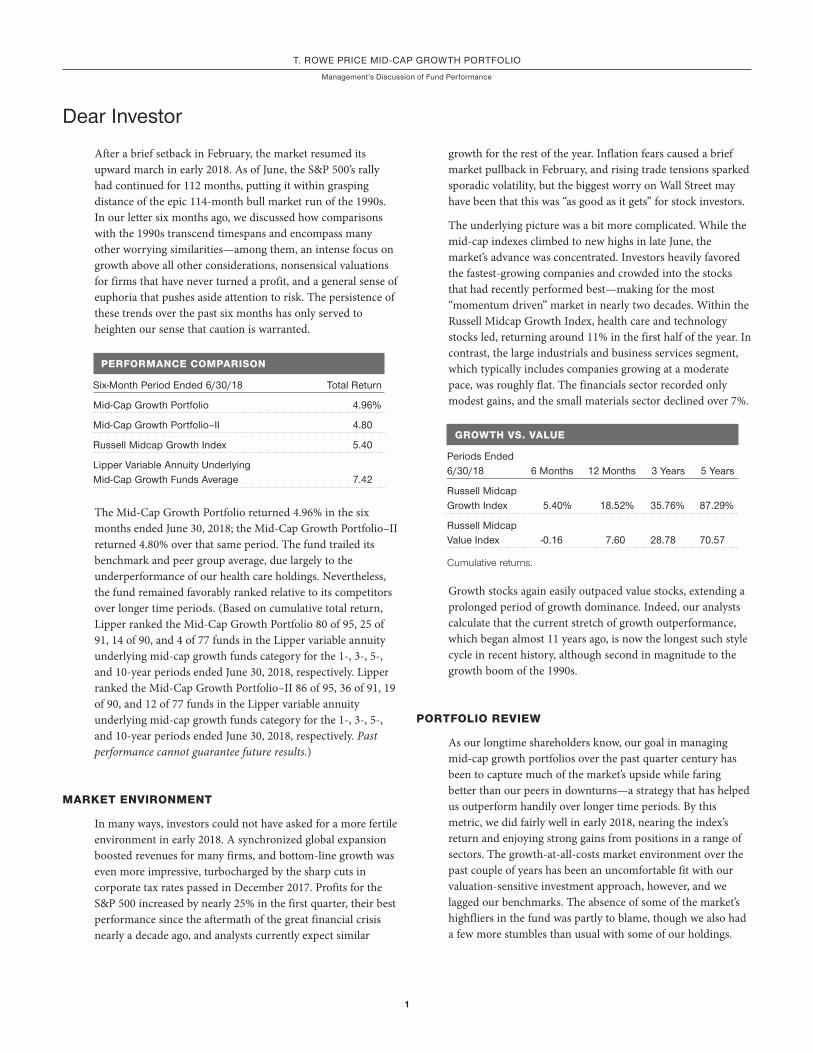
PERFORMANCE COMPARISON
Six-Month Period ended 6/30/18 Total Return
Mid-cap Growth Portfolio 4.96%
Mid-cap Growth Portfolio–ii 4.80
Russell Midcap Growth index 5.40
lipper Variable annuity Underlying Mid-cap Growth funds average 7.42
The Mid-Cap Growth Portfolio returned 4.96% in the six months ended June 30, 2018; the Mid-Cap Growth Portfolio–II returned 4.80% over that same period. The fund trailed its benchmark and peer group average, due largely to the underperformance of our health care holdings. Nevertheless, the fund remained favorably ranked relative to its competitors over longer time periods. (Based on cumulative total return, Lipper ranked the Mid-Cap Growth Portfolio 80 of 95, 25 of 91, 14 of 90, and 4 of 77 funds in the Lipper variable annuity underlying mid-cap growth funds category for the 1-, 3-, 5-, and 10-year periods ended June 30, 2018, respectively. Lipper ranked the Mid-Cap Growth Portfolio–II 86 of 95, 36 of 91, 19 of 90, and 12 of 77 funds in the Lipper variable annuity underlying mid-cap growth funds category for the 1-, 3-, 5-, and 10-year periods ended June 30, 2018, respectively. Past performance cannot guarantee future results.)
MARKET ENVIRONMENT
In many ways, investors could not have asked for a more fertile environment in early 2018. A synchronized global expansion boosted revenues for many firms, and bottom-line growth was even more impressive, turbocharged by the sharp cuts in corporate tax rates passed in December 2017. Profits for the S&P 500 increased by nearly 25% in the first quarter, their best performance since the aftermath of the great financial crisis nearly a decade ago, and analysts currently expect similar
growth for the rest of the year. Inflation fears caused a brief market pullback in February, and rising trade tensions sparked sporadic volatility, but the biggest worry on Wall Street may have been that this was “as good as it gets” for stock investors.
The underlying picture was a bit more complicated. While the mid-cap indexes climbed to new highs in late June, the market’s advance was concentrated. Investors heavily favored the fastest-growing companies and crowded into the stocks that had recently performed best—making for the most “momentum driven” market in nearly two decades. Within the Russell Midcap Growth Index, health care and technology stocks led, returning around 11% in the first half of the year. In contrast, the large industrials and business services segment, which typically includes companies growing at a moderate pace, was roughly flat. The financials sector recorded only modest gains, and the small materials sector declined over 7%.
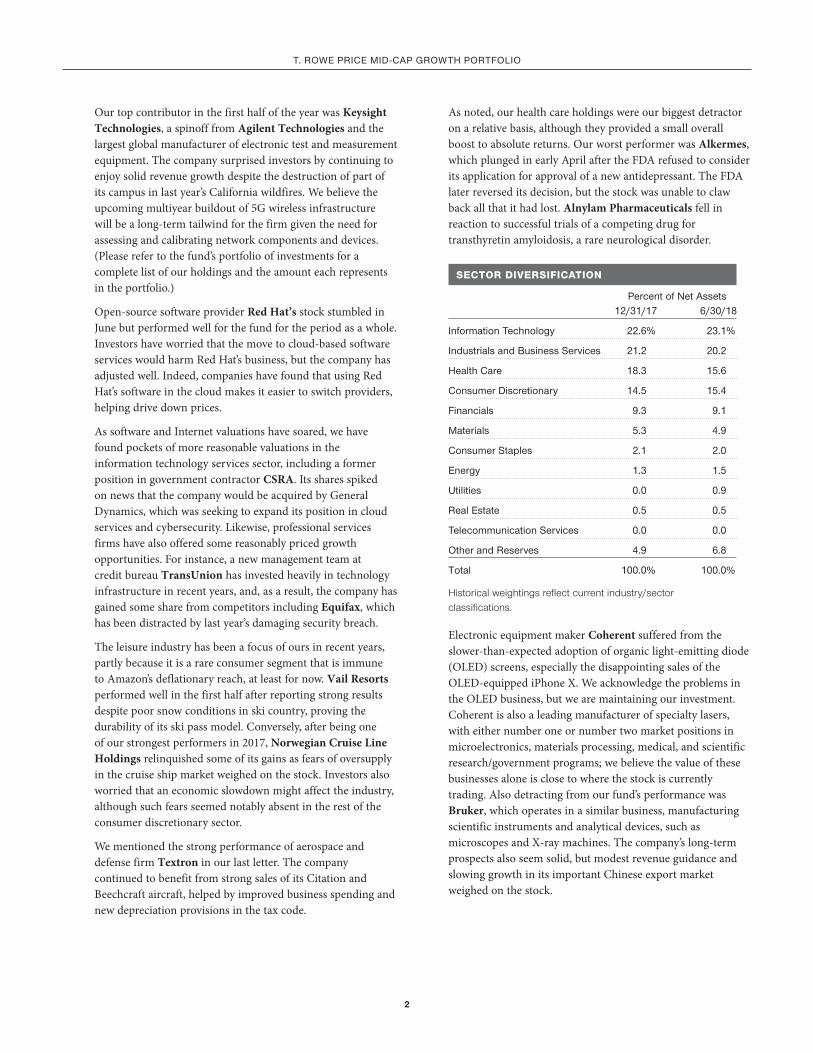
GROWTH VS. VALUE
Periods ended 6/30/18 6 Months 12 Months 3 Years 5 Years
Russell Midcap Growth index 5.40% 18.52% 35.76% 87.29%
Russell Midcap Value index -0.16 7.60 28.78 70.57
Cumulative returns.
Growth stocks again easily outpaced value stocks, extending a prolonged period of growth dominance. Indeed, our analysts calculate that the current stretch of growth outperformance, which began almost 11 years ago, is now the longest such style cycle in recent history, although second in magnitude to the growth boom of the 1990s.
PORTFOLIO REVIEW
As our longtime shareholders know, our goal in managing mid-cap growth portfolios over the past quarter century has been to capture much of the market’s upside while faring better than our peers in downturns—a strategy that has helped us outperform handily over longer time periods. By this metric, we did fairly well in early 2018, nearing the index’s return and enjoying strong gains from positions in a range of sectors. The growth-at-all-costs market environment over the past couple of years has been an uncomfortable fit with our valuation-sensitive investment approach, however, and we lagged our benchmarks. The absence of some of the market’s highfliers in the fund was partly to blame, though we also had a few more stumbles than usual with some of our holdings.
srmgp_0618_P4Proof #
2
T. Rowe PRice Mid-caP GRowTh PoRTfolio
Our top contributor in the first half of the year was Keysight Technologies, a spinoff from Agilent Technologies and the largest global manufacturer of electronic test and measurement equipment. The company surprised investors by continuing to enjoy solid revenue growth despite the destruction of part of its campus in last year’s California wildfires. We believe the upcoming multiyear buildout of 5G wireless infrastructure will be a long-term tailwind for the firm given the need for assessing and calibrating network components and devices. (Please refer to the fund’s portfolio of investments for a complete list of our holdings and the amount each represents in the portfolio.)
Open-source software provider Red Hat’s stock stumbled in June but performed well for the fund for the period as a whole. Investors have worried that the move to cloud-based software services would harm Red Hat’s business, but the company has adjusted well. Indeed, companies have found that using Red Hat’s software in the cloud makes it easier to switch providers, helping drive down prices.
As software and Internet valuations have soared, we have found pockets of more reasonable valuations in the information technology services sector, including a former position in government contractor CSRA. Its shares spiked on news that the company would be acquired by General Dynamics, which was seeking to expand its position in cloud services and cybersecurity. Likewise, professional services firms have also offered some reasonably priced growth opportunities. For instance, a new management team at credit bureau TransUnion has invested heavily in technology infrastructure in recent years, and, as a result, the company has gained some share from competitors including Equifax, which has been distracted by last year’s damaging security breach.
The leisure industry has been a focus of ours in recent years, partly because it is a rare consumer segment that is immune to Amazon’s deflationary reach, at least for now. Vail Resorts performed well in the first half after reporting strong results despite poor snow conditions in ski country, proving the durability of its ski pass model. Conversely, after being one of our strongest performers in 2017, Norwegian Cruise Line Holdings relinquished some of its gains as fears of oversupply in the cruise ship market weighed on the stock. Investors also worried that an economic slowdown might affect the industry, although such fears seemed notably absent in the rest of the consumer discretionary sector.
We mentioned the strong performance of aerospace and defense firm Textron in our last letter. The company continued to benefit from strong sales of its Citation and Beechcraft aircraft, helped by improved business spending and new depreciation provisions in the tax code.
As noted, our health care holdings were our biggest detractor on a relative basis, although they provided a small overall boost to absolute returns. Our worst performer was Alkermes, which plunged in early April after the FDA refused to consider its application for approval of a new antidepressant. The FDA later reversed its decision, but the stock was unable to claw back all that it had lost. Alnylam Pharmaceuticals fell in reaction to successful trials of a competing drug for transthyretin amyloidosis, a rare neurological disorder.
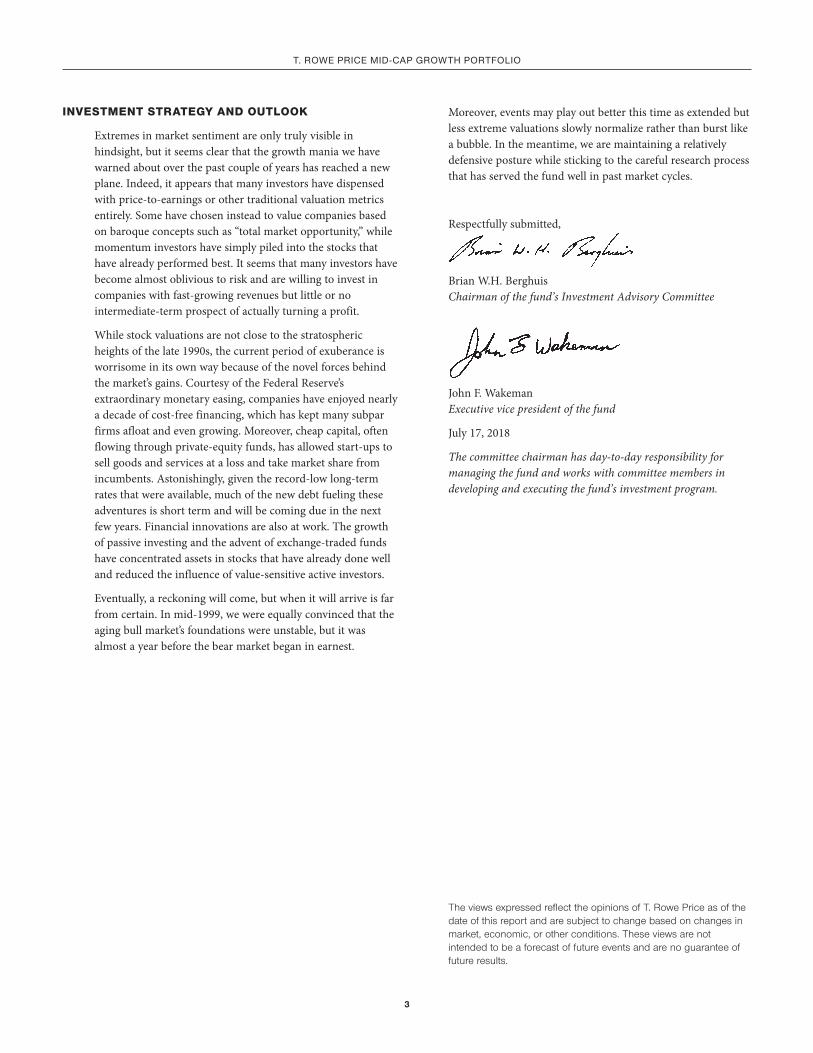
SECTOR DIVERSIFICATION
Percent of Net assets 12/31/17 6/30/18
information Technology 22.6% 23.1%
industrials and Business Services 21.2 20.2
health care 18.3 15.6
consumer discretionary 14.5 15.4
financials 9.3 9.1
Materials 5.3 4.9
consumer Staples 2.1 2.0
energy 1.3 1.5
Utilities 0.0 0.9
Real estate 0.5 0.5
Telecommunication Services 0.0 0.0
other and Reserves 4.9 6.8
Total 100.0% 100.0%
Historical weightings reflect current industry/sector classifications.
Electronic equipment maker Coherent suffered from the slower-than-expected adoption of organic light-emitting diode (OLED) screens, especially the disappointing sales of the OLED-equipped iPhone X. We acknowledge the problems in the OLED business, but we are maintaining our investment. Coherent is also a leading manufacturer of specialty lasers, with either number one or number two market positions in microelectronics, materials processing, medical, and scientific research/government programs; we believe the value of these businesses alone is close to where the stock is currently trading. Also detracting from our fund’s performance was Bruker, which operates in a similar business, manufacturing scientific instruments and analytical devices, such as microscopes and X-ray machines. The company’s long-term prospects also seem solid, but modest revenue guidance and slowing growth in its important Chinese export market weighed on the stock.
srmgp_0618_P4Proof #
3
T. Rowe PRice Mid-caP GRowTh PoRTfolio
The views expressed reflect the opinions of T. Rowe Price as of the date of this report and are subject to change based on changes in market, economic, or other conditions. These views are not intended to be a forecast of future events and are no guarantee of future results.
INVESTMENT STRATEGY AND OUTLOOK
Extremes in market sentiment are only truly visible in hindsight, but it seems clear that the growth mania we have warned about over the past couple of years has reached a new plane. Indeed, it appears that many investors have dispensed with price-to-earnings or other traditional valuation metrics entirely. Some have chosen instead to value companies based on baroque concepts such as “total market opportunity,” while momentum investors have simply piled into the stocks that have already performed best. It seems that many investors have become almost oblivious to risk and are willing to invest in companies with fast-growing revenues but little or no intermediate-term prospect of actually turning a profit.
While stock valuations are not close to the stratospheric heights of the late 1990s, the current period of exuberance is worrisome in its own way because of the novel forces behind the market’s gains. Courtesy of the Federal Reserve’s extraordinary monetary easing, companies have enjoyed nearly a decade of cost-free financing, which has kept many subpar firms afloat and even growing. Moreover, cheap capital, often flowing through private-equity funds, has allowed start-ups to sell goods and services at a loss and take market share from incumbents. Astonishingly, given the record-low long-term rates that were available, much of the new debt fueling these adventures is short term and will be coming due in the next few years. Financial innovations are also at work. The growth of passive investing and the advent of exchange-traded funds have concentrated assets in stocks that have already done well and reduced the influence of value-sensitive active investors.
Eventually, a reckoning will come, but when it will arrive is far from certain. In mid-1999, we were equally convinced that the aging bull market’s foundations were unstable, but it was almost a year before the bear market began in earnest.
Moreover, events may play out better this time as extended but less extreme valuations slowly normalize rather than burst like a bubble. In the meantime, we are maintaining a relatively defensive posture while sticking to the careful research process that has served the fund well in past market cycles.
Respectfully submitted,
Brian W.H. BerghuisChairman of the fund’s Investment Advisory Committee
John F. WakemanExecutive vice president of the fund
July 17, 2018
The committee chairman has day-to-day responsibility for managing the fund and works with committee members in developing and executing the fund’s investment program.

srmgp_0618_P4Proof #
4
T. Rowe PRice Mid-caP GRowTh PoRTfolio
RISKS OF STOCK INVESTING
As with all stock and bond mutual funds, the fund’s share price can fall because of weakness in the stock or bond markets, a particular industry, or specific holdings. The financial markets can decline for many reasons, including adverse political or economic developments, changes in investor psychology, or heavy institutional selling. The prospects for an industry or company may deteriorate because of a variety of factors, including disappointing earnings or changes in the competitive environment. In addition, the investment manager’s assessment of companies held in a fund may prove incorrect, resulting in losses or poor performance even in rising markets. The stocks of mid-cap companies entail greater risk and are usually more volatile than the shares of larger companies. In addition, growth stocks can be volatile for several reasons. Since they usually reinvest a high proportion of earnings in their own businesses, they may lack the dividends usually associated with value stocks that can cushion their decline in a falling market. Also, since investors buy these stocks because of their expected superior earnings growth, earnings disappointments often result in sharp price declines.
GLOSSARY
Lipper indexes: Fund benchmarks that consist of a small number of the largest mutual funds in a particular category as defined by Lipper Inc.
Russell Midcap Growth Index: An unmanaged index that measures the performance of those Russell Midcap companies with higher price-to-book ratios and higher forecast growth values.
Russell Midcap Value Index: An unmanaged index that measures the performance of those Russell Midcap companies with lower price-to-book ratios and lower forecast growth values.
S&P 500 Index: An unmanaged index that tracks the stocks of 500 primarily large-cap U.S. companies.
Note: Frank Russell Company (Russell) is the source and owner of the Russell index data contained or reflected in these materials and all trademarks and copyrights related thereto. Russell® is a registered trademark of Russell. Russell is not responsible for the formatting or configuration of these materials or for any inaccuracy in T. Rowe Price Associates’ presentation thereof.
TWENTY-FIVE LARGEST HOLDINGS
Percent of Net Assets
6/30/18
Teleflex 2.4%
Textron 2.3
Microchip Technology 2.0
Keysight Technologies 1.9
Tapestry 1.8
dollar General 1.8
Roper Technologies 1.8
cooper companies 1.7
hologic 1.6
ideX 1.5
harris 1.5
willis Towers watson 1.5
Td ameritrade holding 1.5
Sensata Technologies holding 1.5
agilent Technologies 1.4
Progressive 1.3
Norwegian cruise line holdings 1.3
worldpay 1.3
fNf 1.3
fiserv 1.2
iac/interactivecorp 1.1
Ball 1.1
Verisk analytics 1.1
air Products & chemicals 1.0
Vail Resorts 1.0
Total 37.9%
Note: The information shown does not reflect any exchange-traded funds (ETFs), cash reserves, or collateral for securities lending that may be held in the portfolio.

srmgp_0618_P4Proof #
5
T. Rowe PRice Mid-caP GRowTh PoRTfolio
Six Months ended 6/30/18
BeST coNTRiBUToRS
Keysight Technologies 17¢
Textron 10
Red hat 7
cSRa** 7
TransUnion 7
Vail Resorts 7
Bioverativ** 7
dexcom 6
atlassian 6
envision healthcare 6
Total 80¢
woRST coNTRiBUToRS
alkermes -8¢
coherent -6
Bruker -5
alnylam Pharmaceuticals -5
Norwegian cruise line holdings -5
acuity Brands** -5
cboe Global Markets -4
Symantec -4
colfax -4
Valvoline -3
Total -49¢
12 Months ended 6/30/18
BeST coNTRiBUToRS
Textron 22¢
Keysight Technologies 20
Teleflex 17
Red hat 16
dollar General 15
Progressive 12
harris 11
TransUnion 11
Td ameritrade holding 10
Splunk 10
Total 144¢
*Position added.**Position eliminated.
woRST coNTRiBUToRS
envision healthcare -12¢
alkermes -10
Treehouse foods -10
MedNaX -8
equifax -7
incyte -6
acuity Brands** -6
hologic -6
Symantec* -6
Norwegian cruise line holdings -6
Total -77¢
CONTRIBUTIONS TO THE CHANGE IN NET ASSET VALUE

srmgp_0618_P4Proof #
6
T. Rowe PRice Mid-caP GRowTh PoRTfolio
GROWTH OF $10,000
This chart shows the value of a hypothetical $10,000 investment in the portfolio over the past 10 fiscal year periods or since inception (for portfolios lacking 10-year records). The result is compared with benchmarks, which include a broad-based market index and may also include a peer group average or index. Market indexes do not include expenses, which are deducted from portfolio returns as well as mutual fund averages and indexes.
6/186/176/166/156/146/136/126/116/106/096/08
MID-CAP GROWTH PORTFOLIO
Mid-Cap Growth Portfolio
Russell Midcap Growth Index
Lipper Variable Annuity Underlying Mid-Cap Growth Funds Average
$31,055
27,027
25,134
As of 6/30/18
Note: Performance for the II Class will vary due to its differing fee structure. See the returns table below.
30,000
25,000
20,000
15,000
10,000
$35,000
AVERAGE ANNUAL COMPOUND TOTAL RETURN
Periods Ended 6/30/18 1 Year 5 Years 10 Years
Mid-cap Growth Portfolio 14.29% 14.81% 12.00%
Mid-cap Growth Portfolio–ii 13.99 14.52 11.72
The fund’s performance information represents only past perfor-mance and is not necessarily an indication of future results. Current performance may be lower or higher than the performance data cited. Share price, principal value, and return will vary, and you may have a gain or loss when you sell your shares. For the most recent month-end performance, please contact a T. Rowe Price representa-tive at 1-800-469-6587 (financial advisors, or customers who have an advisor, should call 1-800-638-8790). Returns do not reflect taxes that the shareholder may pay on distributions or the redemption of shares. Total returns do not include charges imposed by your insurance company’s separate account. If these had been included, performance would have been lower.
This table shows how the portfolio would have performed each year if its actual (or cumulative) returns for the periods shown had been earned at a constant rate. Average annual total return figures include changes in principal value, reinvested dividends, and capital gain distributions. When assessing performance, investors should consider both short- and long-term returns.
FUND EXPENSE EXAMPLE
As a mutual fund shareholder, you may incur two types of costs: (1) transaction costs, such as redemption fees or sales loads, and (2) ongoing costs, including management fees, distribution and service (12b-1) fees, and other fund expenses. The following example is intended to help you understand your ongoing costs (in dollars) of investing in the fund and to compare these costs with the ongoing costs of investing in other mutual funds. The example is based on an investment of $1,000 invested at the beginning of the most recent six-month period and held for the entire period.
Shares of the fund are currently offered only through certain insurance companies as an investment medium for both variable annuity contracts and variable life insurance policies. Please note that the fund has two classes of shares: the original share class and II Class. II Class shares are sold through financial intermediaries, which are compensated for distribution, shareholder servicing, and/or certain administrative services under a Board-approved Rule 12b-1 plan.
Actual ExpensesThe first line of the following table (Actual) provides information about actual account values and actual expenses. You may use the information on this line, together with your account balance, to estimate the expenses that you paid over the period. Simply divide your account value by $1,000 (for example, an $8,600 account value divided by $1,000 = 8.6), then multiply the result by the number on the first line under the heading “Expenses Paid During Period” to estimate the expenses you paid on your account during this period.
Hypothetical Example for Comparison PurposesThe information on the second line of the table (Hypothetical) is based on hypothetical account values and expenses derived from the fund’s actual expense ratio and an assumed 5% per year rate of return before expenses (not the fund’s actual return). You may compare the ongoing costs of investing in the fund with other funds by contrasting this 5% hypothetical example and the 5% hypothetical examples that appear in the shareholder reports of the other funds. The hypothetical account values and expenses may not be used to estimate the actual ending account balance or expenses you paid for the period.
You should also be aware that the expenses shown in the table highlight only your ongoing costs and do not reflect any transaction costs, such as redemption fees or sales loads. Therefore, the second line of the table is useful in comparing ongoing costs only and will not help you determine the relative total costs of owning different funds. To the extent a fund charges transaction costs, however, the total cost of owning that fund is higher.

srmgp_0618_P4Proof #
7
T. Rowe PRice Mid-caP GRowTh PoRTfolio
FUND EXPENSE EXAMPLE (CONTINUED)
MID-CAP GROWTH PORTFOLIO
Expenses Beginning Ending Paid During Account Account Period* Value Value 1/1/18 to 1/1/18 6/30/18 6/30/18
Mid-Cap Growth Portfolioactual $1,000.00 $1,049.60 $4.32
hypothetical (assumes 5% return before expenses) 1,000.00 1,020.58 4.26
Mid-Cap Growth Portfolio–IIactual 1,000.00 1,048.00 5.59
hypothetical (assumes 5% return before expenses) 1,000.00 1,019.34 5.51
* Expenses are equal to the fund’s annualized expense ratio for the 6-month period, multiplied by the average account value over the period, multiplied by the number of days in the most recent fiscal half year (181), and divided by the days in the year (365) to reflect the half-year period. The annualized expense ratio of the Mid-Cap Growth Portfolio was 0.85%, and the Mid-Cap Growth Portfolio–II was 1.10%. Prior to July 1, 2018, the annual investment management fee for the fund was 0.85%. Effective July 1, 2018, Price Associates agreed to reduce the fund’s management fee to 0.84%. For the Mid-Cap Growth Portfolio, the actual ending account value and expenses paid during the period would have been $1,049.65 and $4.27, and the hypothetical ending account value and expenses paid during the period would have been $1,020.63 and $4.21, respectively, had the fund’s reduced management fee been in effect throughout the full 6-month period. For the Mid-Cap Growth Portfolio–II, the actual ending account value and expenses paid during the period would have been $1,048.05 and $5.54, and the hypothetical ending account value and expenses paid during the period would have been $1,019.39 and $5.46, respectively, had the fund’s reduced management fee been in effect throughout the full 6-month period.

srmgp_0618_P4Proof #
8
The accompanying notes are an integral part of these financial statements.
T. Rowe PRice Mid-caP GRowTh PoRTfolio
Unaudited
FINANCIAL HIGHLIGHTS
For a share outstanding throughout each period
Mid-Cap Growth Class
6 Months Ended
6/30/18 Year Ended 12/31/17 12/31/16 12/31/15 12/31/14 12/31/13
NET ASSET VALUE
Beginning of period $ 28.25 $ 25.57 $ 25.70 $ 27.88 $ 27.70 $ 22.00
Investment activities
Net investment loss (1) –(2) (0.04) (0.03) (0.05) (0.07) (0.08)
Net realized and unrealized gain / loss 1.40 6.39 1.66 1.85 3.62 8.10
Total from investment activities 1.40 6.35 1.63 1.80 3.55 8.02
Distributions
Net realized gain – (3.67) (1.76) (3.98) (3.37) (2.32)
NET ASSET VALUE
End of period $ 29.65 $ 28.25 $ 25.57 $ 25.70 $ 27.88 $ 27.70
Ratios/Supplemental Data
Total return(3) 4.96% 24.77% 6.26% 6.56% 13.12% 36.69%
Ratio of total expenses to average net assets 0.85%(4) 0.85% 0.85% 0.85% 0.85% 0.85%
Ratio of net investment loss to average net assets (0.02)% (4) (0.13)% (0.11)% (0.18)% (0.25)% (0.30)%
Portfolio turnover rate 11.5% 24.7% 28.9% 29.4% 26.1% 25.1%
Net assets, end of period (in thousands) $ 418,677 $ 411,412 $ 353,074 $ 350,626 $ 356,083 $ 342,210
(1) Per share amounts calculated using average shares outstanding method. (2) Amounts round to less than $0.01 per share. (3) Total return reflects the rate that an investor would have earned on an investment in the fund during each period,
assuming reinvestment of all distributions. Total return is not annualized for periods less than one year. (4) Annualized.

srmgp_0618_P4Proof #
9
The accompanying notes are an integral part of these financial statements.
T. Rowe PRice Mid-caP GRowTh PoRTfolio
Unaudited
FINANCIAL HIGHLIGHTS
For a share outstanding throughout each period
Mid-Cap Growth-II Class
6 Months Ended
6/30/18 Year Ended 12/31/17 12/31/16 12/31/15 12/31/14 12/31/13
NET ASSET VALUE
Beginning of period $ 27.11 $ 24.65 $ 24.85 $ 27.08 $ 26.99 $ 21.49
Investment activities
Net investment loss(1) (0.04) (0.11) (0.09) (0.12) (0.14) (0.14)
Net realized and unrealized gain / loss 1.34 6.15 1.61 1.79 3.52 7.91
Total from investment activities 1.30 6.04 1.52 1.67 3.38 7.77
Distributions
Net realized gain – (3.58) (1.72) (3.90) (3.29) (2.27)
NET ASSET VALUE
End of period $ 28.41 $ 27.11 $ 24.65 $ 24.85 $ 27.08 $ 26.99
Ratios/Supplemental Data
Total return(2) 4.80% 24.44% 6.03% 6.27% 12.82% 36.40%
Ratio of total expenses to average net assets 1.10%(3) 1.10% 1.10% 1.10% 1.10% 1.10%
Ratio of net investment loss to average net assets (0.27)% (3) (0.38)% (0.36)% (0.43)% (0.50)% (0.55)%
Portfolio turnover rate 11.5% 24.7% 28.9% 29.4% 26.1% 25.1%
Net assets, end of period (in thousands) $ 50,129 $ 52,926 $ 54,691 $ 52,528 $ 68,497 $ 63,572
(1) Per share amounts calculated using average shares outstanding method. (2) Total return reflects the rate that an investor would have earned on an investment in the fund during each period,
assuming reinvestment of all distributions. Total return is not annualized for periods less than one year. (3) Annualized.

srmgp_0618_P4Proof #
Shares $ Value(Cost and value in $000s)
Shares $ Value(Cost and value in $000s)
10
T. Rowe PRice Mid-caP GRowTh PoRTfolio
June 30, 2018 (Unaudited)
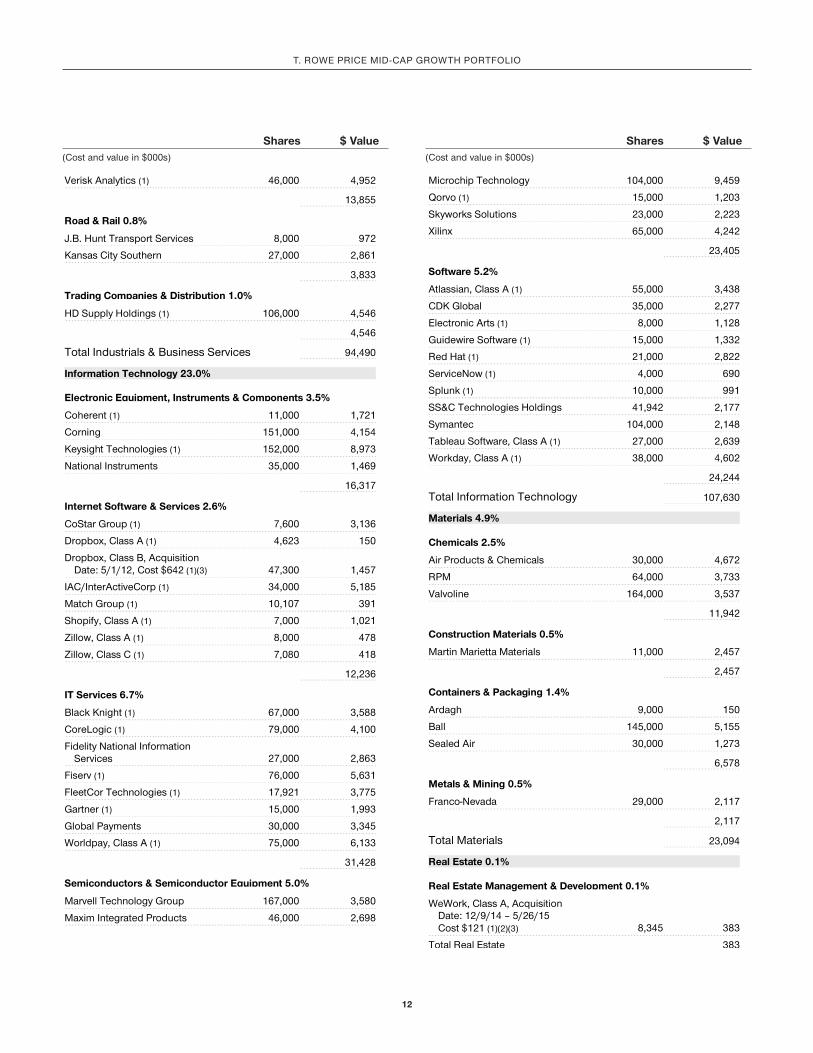
PORTFOLIO OF INVESTMENTS‡
COMMON STOCKS 92.7%
Consumer Discretionary 15.4%
Auto Components 0.9%
Aptiv 46,000 4,215
4,215
Automobiles 0.2%
Ferrari 8,000 1,080
1,080
Diversified Consumer Services 0.8%
ServiceMaster Global Holdings (1) 61,000 3,628
3,628
Hotels, Restaurants & Leisure 6.3%
Aramark 92,000 3,413
Darden Restaurants 14,000 1,499
Dunkin' Brands 39,000 2,694
Hilton Worldwide Holdings 23,000 1,821
Marriott International, Class A 30,000 3,798
MGM Resorts International 137,000 3,977
Norwegian Cruise Line Holdings (1) 130,000 6,142
Royal Caribbean Cruises 15,000 1,554
Vail Resorts 17,000 4,661
29,559
Internet & Direct Marketing Retail 0.7%
Expedia 26,000 3,125
3,125
Multiline Retail 1.8%
Dollar General 84,000 8,282
8,282
Specialty Retail 2.6%
Burlington Stores (1) 21,000 3,161
CarMax (1) 43,000 3,134
Michaels (1) 59,000 1,131
O'Reilly Automotive (1) 11,000 3,009
Ulta Beauty (1) 8,000 1,868
12,303
Textiles, Apparel & Luxury Goods 2.1%
PVH 11,000 1,647
Tapestry 181,000 8,454
10,101
Total Consumer Discretionary 72,293
Consumer Staples 2.0%
Food & Staples Retailing 1.1%
Casey's General Stores 29,000 3,047
Sprouts Farmers Market (1) 83,000 1,832
4,879
Food Products 0.9%
ConAgra Brands 52,000 1,858
TreeHouse Foods (1) 48,000 2,520
4,378
Total Consumer Staples 9,257
Energy 1.5%
Oil, Gas & Consumable Fuels 1.5%
ARC Resources (CAD) 78,000 806
Centennial Resource Development, Class A (1) 74,000 1,336
Concho Resources (1) 30,000 4,151
Venture Global LNG, Series B Acquisition Date: 3/8/18 Cost $60 (1)(2)(3) 20 101
Venture Global LNG, Series C Acquisition Date: 10/16/17 – 3/8/18, Cost $511 (1)(2)(3) 139 704
Total Energy 7,098
Financials 9.1%
Banks 0.9%
Fifth Third Bancorp 92,000 2,640
Webster Financial 24,000 1,529
4,169
Capital Markets 3.2%
CBOE Global Markets 38,000 3,955
KKR, Partnership, Class A 92,000 2,286
MarketAxess Holdings 7,000 1,385
Oaktree Capital, Partnership 19,000 773
TD Ameritrade Holding 125,000 6,846
15,245
Consumer Finance 0.3%
SLM Corporation (1) 136,000 1,557
1,557
Insurance 4.7%
Assurant 17,000 1,759
srmgp_0618_P4Proof #
11
Shares $ Value(Cost and value in $000s)
Shares $ Value(Cost and value in $000s)
T. Rowe PRice Mid-caP GRowTh PoRTfolio
Axis Capital Holdings 15,000 834
FNF Group 159,000 5,982
Progressive 106,000 6,270
Willis Towers Watson 46,000 6,974
21,819
Total Financials 42,790
Health Care 15.6%
Biotechnology 2.5%
Alkermes (1) 92,000 3,787
Alnylam Pharmaceuticals (1) 26,000 2,561
Incyte (1) 29,000 1,943
Madrigal Pharmaceuticals (1) 1,000 280
SAGE Therapeutics (1) 5,000 782
Seattle Genetics (1) 30,274 2,010
TESARO (1) 5,000 222
11,585
Health Care Equipment & Supplies 7.0%
Cooper 34,000 8,005
Dentsply Sirona 19,000 831
Dexcom (1) 17,000 1,615
Hologic (1) 187,000 7,433
IDEXX Laboratories (1) 6,000 1,308
Teleflex 42,000 11,265
West Pharmaceutical Services 23,000 2,284
32,741
Health Care Providers & Services 1.8%
Acadia Healthcare (1) 54,604 2,234
Envision Healthcare (1) 92,000 4,049
MEDNAX (1) 48,088 2,081
8,364
Health Care Technology 0.3%
athenahealth (1) 5,000 796
Veeva Systems, Class A (1) 12,000 922
1,718
Life Sciences Tools & Services 3.2%
Agilent Technologies 106,000 6,555
Bruker 153,000 4,443
Illumina (1) 5,000 1,397
IQVIA Holdings (1) 27,000 2,695
15,090
Pharmaceuticals 0.8%
Catalent (1) 90,000 3,770
3,770
Total Health Care 73,268
Industrials & Business Services 20.2%
Aerospace & Defense 4.8%
BWX Technologies 33,159 2,066
Harris 48,704 7,040
L3 Technologies 6,360 1,223
Maxar Technologies 24,320 1,229
Textron 167,000 11,007
22,565
Airlines 0.6%
United Continental Holdings (1) 38,000 2,650
2,650
Building Products 0.8%
Allegion 47,000 3,636
3,636
Commercial Services & Supplies 1.8%
ADT 89,000 770
KAR Auction Services 61,000 3,343
Waste Connections 57,264 4,311
8,424
Electrical Equipment 1.4%
Sensata Technologies Holding (1) 143,000 6,804
6,804
Industrial Conglomerates 1.8%
Roper Technologies 30,000 8,277
8,277
Machinery 4.2%
Colfax (1) 75,000 2,299
Fortive 57,000 4,395
Gardner Denver Holdings (1) 74,828 2,199
IDEX 53,000 7,234
Xylem 56,000 3,773
19,900
Professional Services 3.0%
Equifax 12,000 1,501
IHS Markit (1) 56,000 2,889
TransUnion 63,000 4,513
srmgp_0618_P4Proof #
12
Shares $ Value(Cost and value in $000s)
Shares $ Value(Cost and value in $000s)
T. Rowe PRice Mid-caP GRowTh PoRTfolio
Verisk Analytics (1) 46,000 4,952
13,855
Road & Rail 0.8%
J.B. Hunt Transport Services 8,000 972
Kansas City Southern 27,000 2,861
3,833
Trading Companies & Distribution 1.0%
HD Supply Holdings (1) 106,000 4,546
4,546
Total Industrials & Business Services 94,490
Information Technology 23.0%
Electronic Equipment, Instruments & Components 3.5%
Coherent (1) 11,000 1,721
Corning 151,000 4,154
Keysight Technologies (1) 152,000 8,973
National Instruments 35,000 1,469
16,317
Internet Software & Services 2.6%
CoStar Group (1) 7,600 3,136
Dropbox, Class A (1) 4,623 150
Dropbox, Class B, Acquisition Date: 5/1/12, Cost $642 (1)(3) 47,300 1,457
IAC/InterActiveCorp (1) 34,000 5,185
Match Group (1) 10,107 391
Shopify, Class A (1) 7,000 1,021
Zillow, Class A (1) 8,000 478
Zillow, Class C (1) 7,080 418
12,236
IT Services 6.7%
Black Knight (1) 67,000 3,588
CoreLogic (1) 79,000 4,100
Fidelity National Information Services 27,000 2,863
Fiserv (1) 76,000 5,631
FleetCor Technologies (1) 17,921 3,775
Gartner (1) 15,000 1,993
Global Payments 30,000 3,345
Worldpay, Class A (1) 75,000 6,133
31,428
Semiconductors & Semiconductor Equipment 5.0%
Marvell Technology Group 167,000 3,580
Maxim Integrated Products 46,000 2,698
Microchip Technology 104,000 9,459
Qorvo (1) 15,000 1,203
Skyworks Solutions 23,000 2,223
Xilinx 65,000 4,242
23,405
Software 5.2%
Atlassian, Class A (1) 55,000 3,438
CDK Global 35,000 2,277
Electronic Arts (1) 8,000 1,128
Guidewire Software (1) 15,000 1,332
Red Hat (1) 21,000 2,822
ServiceNow (1) 4,000 690
Splunk (1) 10,000 991
SS&C Technologies Holdings 41,942 2,177
Symantec 104,000 2,148
Tableau Software, Class A (1) 27,000 2,639
Workday, Class A (1) 38,000 4,602
24,244
Total Information Technology 107,630
Materials 4.9%
Chemicals 2.5%
Air Products & Chemicals 30,000 4,672
RPM 64,000 3,733
Valvoline 164,000 3,537
11,942
Construction Materials 0.5%
Martin Marietta Materials 11,000 2,457
2,457
Containers & Packaging 1.4%
Ardagh 9,000 150
Ball 145,000 5,155
Sealed Air 30,000 1,273
6,578
Metals & Mining 0.5%
Franco-Nevada 29,000 2,117
2,117
Total Materials 23,094
Real Estate 0.1%
Real Estate Management & Development 0.1%
WeWork, Class A, Acquisition Date: 12/9/14 – 5/26/15 Cost $121 (1)(2)(3) 8,345 383
Total Real Estate 383

srmgp_0618_P4Proof #
13
Shares $ Value(Cost and value in $000s)
Shares $ Value(Cost and value in $000s)
T. Rowe PRice Mid-caP GRowTh PoRTfolio
Utilities 0.9%
Gas Utilities 0.3%
Atmos Energy 18,000 1,622
1,622
Multi-Utilities 0.6%
Sempra Energy 24,000 2,787
2,787
Total Utilities 4,409
Total Common Stocks (Cost $269,511) 434,712
CONVERTIBLE PREFERRED STOCKS 0.5%
Information Technology 0.1%
Internet Software & Services 0.1%
Roofoods, Series F, Acquisition Date: 9/12/17, Cost $662 (1)(2)(3) 1,871 662
Total Information Technology 662
Real Estate 0.4%
Real Estate Management & Development 0.4%
WeWork, Series D-1, Acquisition Date: 12/9/14, Cost $362 (1)(2)(3) 21,721 996
WeWork, Series D-2, Acquisition Date: 12/9/14, Cost $284 (1)(2)(3) 17,066 782
Total Real Estate 1,778
Total Convertible Preferred Stocks (Cost $1,307) 2,440
SHORT-TERM INVESTMENTS 7.1%
Money Market Funds 7.1% T. Rowe Price Treasury Reserve
Fund, 1.88% (4)(5) 33,287,721 33,288
Total Short-Term Investments (Cost $33,288) 33,288
Total Investments in Securities
100.3% of Net Assets (Cost $304,106) $ 470,440
‡ Shares are denominated in U.S. dollars unless otherwise noted.
(1) Non-income producing (2) Level 3 in fair value hierarchy. See Note 2. (3)
Security cannot be offered for public resale without first being registered under the Securities Act of 1933 and related rules ("restricted security"). Acquisition date represents the day on which an enforceable right to acquire such security is obtained and is presented along with related cost in the security description. The fund has registration rights for certain restricted securities. Any costs related to such registration are borne by the issuer. The aggregate value of restricted securities (excluding 144A holdings) at period-end amounts to $5,085 and represents 1.1% of net assets.
(4) Seven-day yield (5) Affiliated Company
CAD Canadian Dollar

srmgp_0618_P4Proof #
14
The accompanying notes are an integral part of these financial statements.
T. Rowe PRice Mid-caP GRowTh PoRTfolio
The fund may invest in certain securities that are considered affiliated companies. As defined by the 1940 Act, an affiliated company is one in which the fund owns 5% or more of the outstanding voting securities, or a company that is under common ownership or control. The following securities were considered affiliated companies for all or some portion of the six months ended June 30, 2018. Net realized gain (loss), investment income, change in net unrealized gain/loss and purchase and sales cost reflect all activity for the period then ended.
Affiliate
Net Realized Gain(Loss)
Change in NetUnrealizedGain/Loss
InvestmentIncome
T. Rowe Price Treasury Reserve Fund $ — $ — $ 212 Totals $ —# $ — $ 212+ Supplementary Investment Schedule Affiliate
Value12/31/17
PurchaseCost
SalesCost
Value6/30/18
T. Rowe Price Treasury Reserve Fund $ 23,482 ¤ ¤ $ 33,288 $ 33,288^
# Capital gain distributions from mutual funds represented $0 of the net realized gain (loss). + Investment income comprised $212 of dividend income and $0 of interest income. ¤ Purchase and sale information not shown for cash management funds. ^ The cost basis of investments in affiliated companies was $33,288.
Affiliated Companies($000s)

srmgp_0618_P4Proof #
15
The accompanying notes are an integral part of these financial statements.
($000s, except shares and per share amounts)
T. Rowe PRice Mid-caP GRowTh PoRTfolio
June 30, 2018 (Unaudited)
STATEMENT OF ASSETS AND LIABILITIES
Assets
Investments in securities, at value (cost $304,106) $ 470,440
Receivable for investment securities sold 835
Dividends receivable 248
Receivable for shares sold 31
Cash 5
Foreign currency (cost $3) 3
Other assets 1
Total assets 471,563
Liabilities
Payable for investment securities purchased 1,599
Payable for shares redeemed 750
Investment management and administrative fees payable 408
Total liabilities 2,757
NET ASSETS $ 468,806 Net Assets Consist of:
Accumulated net investment loss $ (106)
Accumulated undistributed net realized gain 39,669
Net unrealized gain 166,334
Paid-in capital applicable to 15,885,930 shares of $0.0001 par value capital stock outstanding; 1,000,000,000 shares of the Corporation authorized 262,909
NET ASSETS $ 468,806 NET ASSET VALUE PER SHARE
Mid-Cap Growth Class ($418,676,702 / 14,121,425 shares outstanding) $ 29.65
Mid-Cap Growth – II Class ($50,129,153 / 1,764,505 shares outstanding) $ 28.41

srmgp_0618_P4Proof #
16
The accompanying notes are an integral part of these financial statements.
($000s)
STATEMENT OF OPERATIONS
T. Rowe PRice Mid-caP GRowTh PoRTfolio
Unaudited
6 Months Ended 6/30/18
Investment Income (Loss)
Income Dividend $ 1,959 Total income 1,959
Expenses Investment management and administrative expense 2,003 Rule 12b-1 fees - Mid-Cap Growth-II Class 62 Total expenses 2,065
Net investment loss (106) Realized and Unrealized Gain / Loss Net realized gain on securities 35,091 Change in net unrealized gain/loss on securities (12,206) Net realized and unrealized gain / loss 22,885 INCREASE IN NET ASSETS FROM OPERATIONS $ 22,779
srmgp_0618_P4Proof #
17
The accompanying notes are an integral part of these financial statements.
($000s)
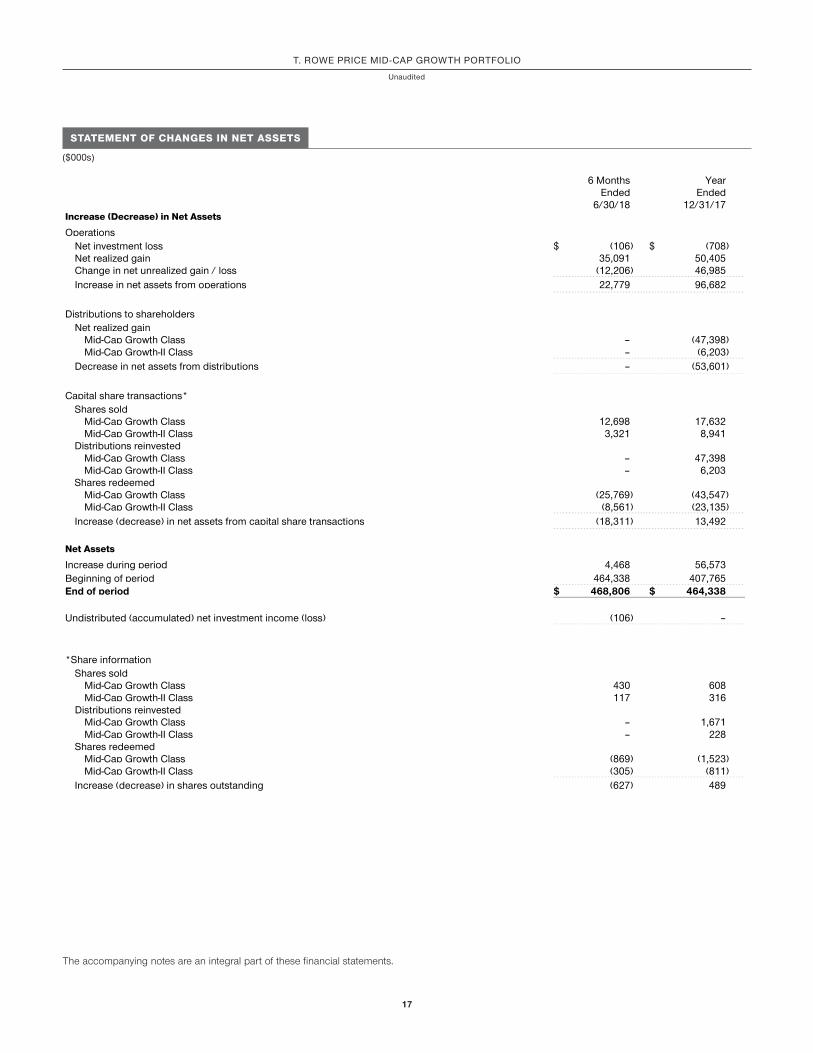
STATEMENT OF CHANGES IN NET ASSETS
T. Rowe PRice Mid-caP GRowTh PoRTfolio
Unaudited
6 Months Ended
6/30/18
Year Ended
12/31/17Increase (Decrease) in Net Assets
Operations Net investment loss $ (106) $ (708) Net realized gain 35,091 50,405 Change in net unrealized gain / loss (12,206) 46,985 Increase in net assets from operations 22,779 96,682
Distributions to shareholders
Net realized gain Mid-Cap Growth Class – (47,398) Mid-Cap Growth-II Class – (6,203)
Decrease in net assets from distributions – (53,601) Capital share transactions*
Shares sold Mid-Cap Growth Class 12,698 17,632 Mid-Cap Growth-II Class 3,321 8,941
Distributions reinvested Mid-Cap Growth Class – 47,398 Mid-Cap Growth-II Class – 6,203
Shares redeemed Mid-Cap Growth Class (25,769) (43,547) Mid-Cap Growth-II Class (8,561) (23,135)
Increase (decrease) in net assets from capital share transactions (18,311) 13,492 Net Assets
Increase during period 4,468 56,573 Beginning of period 464,338 407,765 End of period $ 468,806 $ 464,338 Undistributed (accumulated) net investment income (loss) (106) – *Share information
Shares sold Mid-Cap Growth Class 430 608 Mid-Cap Growth-II Class 117 316
Distributions reinvested Mid-Cap Growth Class – 1,671 Mid-Cap Growth-II Class – 228
Shares redeemed Mid-Cap Growth Class (869) (1,523) Mid-Cap Growth-II Class (305) (811)
Increase (decrease) in shares outstanding (627) 489

srmgp_0618_P4Proof #
18
NOTES TO FINANCIAL STATEMENTS
T. Rowe PRice Mid-caP GRowTh PoRTfolio
Unaudited
T. Rowe Price Equity Series, Inc. (the corporation) is registered under the Investment Company Act of 1940 (the 1940 Act). The Mid-Cap Growth Portfolio (the fund) is a diversified, open-end management investment company established by the corporation. Shares of the fund currently are offered only through certain insurance companies as an investment medium for both variable annuity contracts and variable life insurance policies. The fund seeks to provide long-term capital appreciation by investing in mid-cap stocks with potential for above-average earnings growth. The fund has two classes of shares: Mid-Cap Growth Portfolio (Mid-Cap Growth Class) and the Mid-Cap Growth Portfolio–II (Mid-Cap Growth-II Class). Mid-Cap Growth Portfolio–II Class shares are sold through financial intermediaries, which it compensates for distribution, shareholder servicing, and/or certain administrative services under a Board-approved Rule 12b-1 plan. Each class has exclusive voting rights on matters related solely to that class; separate voting rights on matters that relate to both classes; and, in all other respects, the same rights and obligations as the other class.
NOTE 1 - SIGNIFICANT ACCOUNTING POLICIES
Basis of Preparation The fund is an investment company and follows accounting and reporting guidance in the Financial Accounting Standards Board (FASB) Accounting Standards Codification Topic 946 (ASC 946). The accompanying financial statements were prepared in accordance with accounting principles generally accepted in the United States of America (GAAP), including, but not limited to, ASC 946. GAAP requires the use of estimates made by management. Management believes that estimates and valuations are appropriate; however, actual results may differ from those estimates, and the valuations reflected in the accompanying financial statements may differ from the value ultimately realized upon sale or maturity.
Investment Transactions, Investment Income, and Distributions Investment transactions are accounted for on the trade date basis. Income and expenses are recorded on the accrual basis. Realized gains and losses are reported on the identified cost basis. Dividends received from mutual fund investments are reflected as dividend income; capital gain distributions are reflected as realized gain/loss. Earnings on investments recognized as partnerships for federal income tax purposes reflect the tax character of such earnings. Dividend income and capital gain distributions are recorded on the ex-dividend date. Income tax-related interest and penalties, if incurred, are recorded as income tax expense. Income distributions, if any, are declared and paid by each class annually. Distributions to shareholders are recorded on the ex-dividend date. A capital gain distribution may also be declared and paid by the fund annually.
Currency Translation Assets, including investments, and liabilities denominated in foreign currencies are translated into U.S. dollar values each day at the prevailing exchange rate, using the mean of the bid and asked prices of such currencies against U.S. dollars as quoted by a major bank. Purchases and sales of securities, income, and expenses are translated into U.S. dollars at the prevailing exchange rate on the respective date of such transaction. The portion of the results of operations attributable to changes in foreign exchange rates on investments is not bifurcated from the portion attributable to changes in market prices. The effect of changes in foreign currency exchange rates on realized and unrealized security gains and losses is reflected as a component of security gains and losses.
Class Accounting Investment income, investment management and administrative expense, and realized and unrealized gains and losses are allocated to the classes based upon the relative daily net assets of each class. Mid-Cap Growth–II Class pays Rule 12b-1 fees, in an amount not exceeding 0.25% of the class’s average daily net assets.
New Accounting Guidance In March 2017, the FASB issued amended guidance to shorten the amortization period for certain callable debt securities held at a premium. The guidance is effective for fiscal years and interim periods beginning after December 15, 2018. Adoption will have no effect on the fund’s net assets or results of operations.
Indemnification In the normal course of business, the fund may provide indemnification in connection with its officers and directors, service providers, and/or private company investments. The fund’s maximum exposure under these arrangements is unknown; however, the risk of material loss is currently considered to be remote.

srmgp_0618_P4Proof #
19
T. Rowe PRice Mid-caP GRowTh PoRTfolio
NOTE 2 - VALUATION
The fund’s financial instruments are valued and each class’s net asset value (NAV) per share is computed at the close of the New York Stock Exchange (NYSE), normally 4 p.m. ET, each day the NYSE is open for business. However, the NAV per share may be calculated at a time other than the normal close of the NYSE if trading on the NYSE is restricted, if the NYSE closes earlier, or as may be permitted by the SEC.
Fair Value The fund’s financial instruments are reported at fair value, which GAAP defines as the price that would be received to sell an asset or paid to transfer a liability in an orderly transaction between market participants at the measurement date. The T. Rowe Price Valuation Committee (the Valuation Committee) is an internal committee that has been delegated certain responsibilities by the fund’s Board of Directors (the Board) to ensure that financial instruments are appropriately priced at fair value in accordance with GAAP and the 1940 Act. Subject to oversight by the Board, the Valuation Committee develops and oversees pricing-related policies and procedures and approves all fair value determinations. Specifically, the Valuation Committee establishes procedures to value securities; determines pricing techniques, sources, and persons eligible to effect fair value pricing actions; oversees the selection, services, and performance of pricing vendors; oversees valuation-related business continuity practices; and provides guidance on internal controls and valuation-related matters. The Valuation Committee reports to the Board and has representation from legal, portfolio management and trading, operations, risk management, and the fund’s treasurer.
Various valuation techniques and inputs are used to determine the fair value of financial instruments. GAAP establishes the following fair value hierarchy that categorizes the inputs used to measure fair value:
Level 1 – quoted prices (unadjusted) in active markets for identical financial instruments that the fund can access at the reporting date
Level 2 – inputs other than Level 1 quoted prices that are observable, either directly or indirectly (including, but not limited to, quoted prices for similar financial instruments in active markets, quoted prices for identical or similar financial instruments in inactive markets, interest rates and yield curves, implied volatilities, and credit spreads)
Level 3 – unobservable inputs
Observable inputs are developed using market data, such as publicly available information about actual events or transactions, and reflect the assumptions that market participants would use to price the financial instrument. Unobservable inputs are those for which market data are not available and are developed using the best information available about the assumptions that market participants would use to price the financial instrument. GAAP requires valuation techniques to maximize the use of relevant observable inputs and minimize the use of unobservable inputs. When multiple inputs are used to derive fair value, the financial instrument is assigned to the level within the fair value hierarchy based on the lowest-level input that is significant to the fair value of the financial instrument. Input levels are not necessarily an indication of the risk or liquidity associated with financial instruments at that level but rather the degree of judgment used in determining those values.
Valuation Techniques Equity securities listed or regularly traded on a securities exchange or in the over-the-counter (OTC) market are valued at the last quoted sale price or, for certain markets, the official closing price at the time the valuations are made. OTC Bulletin Board securities are valued at the mean of the closing bid and asked prices. A security that is listed or traded on more than one exchange is valued at the quotation on the exchange determined to be the primary market for such security. Listed securities not traded on a particular day are valued at the mean of the closing bid and asked prices for domestic securities and the last quoted sale or closing price for international securities.
For valuation purposes, the last quoted prices of non-U.S. equity securities may be adjusted to reflect the fair value of such securities at the close of the NYSE. If the fund determines that developments between the close of a foreign market and the close of the NYSE will affect the value of some or all of its portfolio securities, the fund will adjust the previous quoted prices to reflect what it believes to be the fair value of the securities as of the close of the NYSE. In deciding whether it is necessary to adjust quoted prices to reflect fair value, the fund reviews a variety of factors, including developments in foreign markets, the performance of U.S. securities markets, and the performance of instruments trading in U.S. markets that represent foreign securities and baskets of foreign securities. The fund may also fair value securities in other situations, such as when a particular foreign market is closed but the fund is open. The fund uses outside pricing services to provide it with quoted prices and information to evaluate or adjust those prices. The fund cannot predict how often it will use quoted prices and how often it will determine it necessary to adjust those prices to reflect fair value. As a means of evaluating its security valuation process, the fund routinely compares quoted prices, the next day’s opening prices in the same markets, and adjusted prices.

srmgp_0618_P4Proof #
20
T. Rowe PRice Mid-caP GRowTh PoRTfolio
Actively traded equity securities listed on a domestic exchange generally are categorized in Level 1 of the fair value hierarchy. Non-U.S. equity securities generally are categorized in Level 2 of the fair value hierarchy despite the availability of quoted prices because, as described above, the fund evaluates and determines whether those quoted prices reflect fair value at the close of the NYSE or require adjustment. OTC Bulletin Board securities, certain preferred securities, and equity securities traded in inactive markets generally are categorized in Level 2 of the fair value hierarchy.
Investments in mutual funds are valued at the mutual fund’s closing NAV per share on the day of valuation and are categorized in Level 1 of the fair value hierarchy. Assets and liabilities other than financial instruments, including short-term receivables and payables, are carried at cost, or estimated realizable value, if less, which approximates fair value.
Thinly traded financial instruments and those for which the above valuation procedures are inappropriate or are deemed not to reflect fair value are stated at fair value as determined in good faith by the Valuation Committee. The objective of any fair value pricing determination is to arrive at a price that could reasonably be expected from a current sale. Financial instruments fair valued by the Valuation Committee are primarily private placements, restricted securities, warrants, rights, and other securities that are not publicly traded.
Subject to oversight by the Board, the Valuation Committee regularly makes good faith judgments to establish and adjust the fair valuations of certain securities as events occur and circumstances warrant. For instance, in determining the fair value of an equity investment with limited market activity, such as a private placement or a thinly traded public company stock, the Valuation Committee considers a variety of factors, which may include, but are not limited to, the issuer’s business prospects, its financial standing and performance, recent investment transactions in the issuer, new rounds of financing, negotiated transactions of significant size between other investors in the company, relevant market valuations of peer companies, strategic events affecting the company, market liquidity for the issuer, and general economic conditions and events. In consultation with the investment and pricing teams, the Valuation Committee will determine an appropriate valuation technique based on available information, which may include both observable and unobservable inputs. The Valuation Committee typically will afford greatest weight to actual prices in arm’s length transactions, to the extent they represent orderly transactions between market participants, transaction information can be reliably obtained, and prices are deemed representative of fair value. However, the Valuation Committee may also consider other valuation methods such as market-based valuation multiples; a discount or premium from market value of a similar, freely traded security of the same issuer; or some combination. Fair value determinations are reviewed on a regular basis and updated as information becomes available, including actual purchase and sale transactions of the issue. Because any fair value determination involves a significant amount of judgment, there is a degree of subjectivity inherent in such pricing decisions, and fair value prices determined by the Valuation Committee could differ from those of other market participants. Depending on the relative significance of unobservable inputs, including the valuation technique(s) used, fair valued securities may be categorized in Level 2 or 3 of the fair value hierarchy.
Valuation Inputs The following table summarizes the fund’s financial instruments, based on the inputs used to determine their fair values on June 30, 2018 (for further detail by category, please refer to the accompanying Portfolio of Investments):
Assets
common Stocks $ 431,261 $ 2,263 $ 1,188 $ 434,712
convertible Preferred Stocks – – 2,440 2,440
Short-Term investments 33,288 – – 33,288
Total $ 464,549 $ 2,263 $ 3,628 $ 470,440
($000s) Total ValueLevel 3Level 2Level 1
There were no material transfers between Levels 1 and 2 during the six months ended June 30, 2018.

srmgp_0618_P4Proof #
21
T. Rowe PRice Mid-caP GRowTh PoRTfolio
Following is a reconciliation of the fund’s Level 3 holdings for the six months ended June 30, 2018. Gain (loss) reflects both realized and change in unrealized gain/loss on Level 3 holdings during the period, if any, and is included on the accompanying Statement of Operations. The change in unrealized gain/loss on Level 3 instruments held at June 30, 2018, totaled $233,000 for the six months ended June 30, 2018. Transfers into and out of Level 3 are reflected at the value of the financial instrument at the beginning of the period. During the six months, transfers out of Level 3 were because observable market data became available for the security.
investments in Securities
common Stocks $ 943 $ 233 $ 112 $ (100) $ 1,188
convertible Preferred Stocks 3,171 – – (731) 2,440
Total level 3 $ 4,114 $ 233 $ 112 $ (831) $ 3,628
($000s) EndingBalance6/30/18
TransfersOut of
Level 3Total
PurchasesGain (Loss)
During Period
BeginningBalance
12/31/17
NOTE 3 - OTHER INVESTMENT TRANSACTIONS
Consistent with its investment objective, the fund engages in the following practices to manage exposure to certain risks and/or to enhance performance. The investment objective, policies, program, and risk factors of the fund are described more fully in the fund’s prospectus and Statement of Additional Information.
Restricted Securities The fund may invest in securities that are subject to legal or contractual restrictions on resale. Prompt sale of such securities at an acceptable price may be difficult and may involve substantial delays and additional costs.
Other Purchases and sales of portfolio securities other than short-term securities aggregated $50,518,000 and $77,867,000 respectively, for the six months ended June 30, 2018.
NOTE 4 - FEDERAL INCOME TAXES
No provision for federal income taxes is required since the fund intends to continue to qualify as a regulated investment company under Subchapter M of the Internal Revenue Code and distribute to shareholders all of its taxable income and gains. Distributions determined in accordance with federal income tax regulations may differ in amount or character from net investment income and realized gains for financial reporting purposes. Financial reporting records are adjusted for permanent book/tax differences to reflect tax character but are not adjusted for temporary differences. The amount and character of tax-basis distributions and composition of net assets are finalized at fiscal year-end; accordingly, tax-basis balances have not been determined as of the date of this report.
At June 30, 2018, the cost of investments for federal income tax purposes was $305,423,000. Net unrealized gain aggregated $165,017,000 at period-end, of which $173,355,000 related to appreciated investments and $8,338,000 related to depreciated investments.
NOTE 5 - RELATED PARTY TRANSACTIONS
The fund is managed by T. Rowe Price Associates, Inc. (Price Associates), a wholly owned subsidiary of T. Rowe Price Group, Inc. (Price Group). The investment management and administrative agreement between the fund and Price Associates provides for an all-inclusive annual fee equal to 0.85% of the fund’s average daily net assets. The fee is computed daily and paid monthly. The all-inclusive fee covers investment management, shareholder servicing, transfer agency, accounting, and custody services provided to the fund, as well as fund directors’ fees and expenses. Interest, taxes, brokerage commissions, and other non-recurring expenses permitted by the investment management agreement are paid directly by the fund.

srmgp_0618_P4Proof #
22
T. Rowe PRice Mid-caP GRowTh PoRTfolio
The fund may invest its cash reserves in certain open-end management investment companies managed by Price Associates and considered affiliates of the fund: the T. Rowe Price Government Reserve Fund or the T. Rowe Price Treasury Reserve Fund, organized as money market funds, or the T. Rowe Price Short-Term Fund, a short-term bond fund (collectively, the Price Reserve Funds). The Price Reserve Funds are offered as short-term investment options to mutual funds, trusts, and other accounts managed by Price Associates or its affiliates and are not available for direct purchase by members of the public. Cash collateral from securities lending is invested in the T. Rowe Price Short-Term Fund. The Price Reserve Funds pay no investment management fees.
The fund may participate in securities purchase and sale transactions with other funds or accounts advised by Price Associates (cross trades), in accordance with procedures adopted by the fund’s Board and Securities and Exchange Commission rules, which require, among other things, that such purchase and sale cross trades be effected at the independent current market price of the security. During the six months ended June 30, 2018, the fund had no purchases or sales cross trades with other funds or accounts advised by Price Associates.
NOTE 6 - SUBSEQUENT EVENT
Effective July 1, 2018, the fund’s all-inclusive annual fee for investment management and administrative services was reduced from 0.85% to 0.84% of average daily net assets.
srmgp_0618_P4Proof #
23
T. Rowe PRice Mid-caP GRowTh PoRTfolio
INFORMATION ON PROXY VOTING POLICIES, PROCEDURES, AND RECORDS
A description of the policies and procedures used by T. Rowe Price funds and portfolios to determine how to vote proxies relating to portfolio securities is available in each fund’s Statement of Additional Information. You may request this document by calling 1-800-225-5132 or by accessing the SEC’s website, sec.gov.
The description of our proxy voting policies and procedures is also available on our corporate website. To access it, please visit the following Web page:
https://www3.troweprice.com/usis/corporate/en/utility/policies.html
Scroll down to the section near the bottom of the page that says, “Proxy Voting Policies.” Click on the Proxy Voting Policies link in the shaded box.
Each fund’s most recent annual proxy voting record is available on our website and through the SEC’s website. To access it through T. Rowe Price, visit the website location shown above, and scroll down to the section near the bottom of the page that says, “Proxy Voting Records.” Click on the Proxy Voting Records link in the shaded box.
HOW TO OBTAIN QUARTERLY PORTFOLIO HOLDINGS
The fund files a complete schedule of portfolio holdings with the Securities and Exchange Commission for the first and third quarters of each fiscal year on Form N-Q. The fund’s Form N-Q is available electronically on the SEC’s website (sec.gov); hard copies may be reviewed and copied at the SEC’s Public Reference Room, 100 F St. N.E., Washington, DC 20549. For more information on the Public Reference Room, call 1-800-SEC-0330.

srmgp_0618_P4Proof #
24
T. Rowe PRice Mid-caP GRowTh PoRTfolio
APPROVAL OF INVESTMENT MANAGEMENT AGREEMENT
Each year, the fund’s Board of Directors (Board) considers the continuation of the investment management agreement (Advisory Contract) between the fund and its investment advisor, T. Rowe Price Associates, Inc. (Advisor), on behalf of the fund. In that regard, at an in-person meeting held on March 5–6, 2018 (Meeting), the Board, including a majority of the fund’s independent directors, approved the continuation of the fund’s Advisory Contract. At the Meeting, the Board considered the factors and reached the conclusions described below relating to the selection of the Advisor and the approval of the Advisory Contract. The independent directors were assisted in their evaluation of the Advisory Contract by independent legal counsel, from whom they received separate legal advice and with whom they met separately.
In providing information to the Board, the Advisor was guided by a detailed set of requests for information submitted by independent legal counsel on behalf of the independent directors. In considering and approving the Advisory Contract, the Board considered the information it believed was relevant, including, but not limited to, the information discussed below. The Board considered not only the specific information presented in connection with the Meeting but also the knowledge gained over time through interaction with the Advisor about various topics. The Board meets regularly and, at each of its meetings, covers an extensive agenda of topics and materials and considers factors that are relevant to its annual consideration of the renewal of the T. Rowe Price funds’ advisory contracts, including performance and the services and support provided to the funds and their shareholders.
Services Provided by the AdvisorThe Board considered the nature, quality, and extent of the services provided to the fund by the Advisor. These services included, but were not limited to, directing the fund’s investments in accordance with its investment program and the overall management of the fund’s portfolio, as well as a variety of related activities such as financial, investment operations, and administrative services; compliance; maintaining the fund’s records and registrations; and shareholder communications. The Board also reviewed the background and experience of the Advisor’s senior management team and investment personnel involved in the management of the fund, as well as the Advisor’s compliance record. The Board concluded that it was satisfied with the nature, quality, and extent of the services provided by the Advisor.
Investment Performance of the FundThe Board took into account discussions with the Advisor and reports that it receives throughout the year relating to fund performance. In connection with the Meeting, the Board reviewed the fund’s net annualized total returns for the 1-, 2-, 3-, 4-, 5-, and 10-year periods as of September 30, 2017, and compared these returns with the performance of a peer group of funds with similar investment programs and a wide variety of other previously agreed-upon comparable performance measures and market data, including those supplied by Broadridge, which is an independent provider of mutual fund data.
On the basis of this evaluation and the Board’s ongoing review of investment results and factoring in the relative market conditions during certain of the performance periods, the Board concluded that the fund’s performance was satisfactory.
Costs, Benefits, Profits, and Economies of ScaleThe Board reviewed detailed information regarding the revenues received by the Advisor under the Advisory Contract and other benefits that the Advisor (and its affiliates) may have realized from its relationship with the fund, including any research received under “soft dollar” agreements and commission-sharing arrangements with broker-dealers. The Board considered that the Advisor may receive some benefit from soft-dollar arrangements pursuant to which research is received from broker-dealers that execute the fund’s portfolio transactions. The Board received information on the estimated costs incurred and profits realized by the Advisor from managing the T. Rowe Price funds. The Board also reviewed estimates of the profits realized from managing the fund in particular, and the Board concluded that the Advisor’s profits were reasonable in light of the services provided to the fund.
The Board also considered whether the fund benefits under the fee levels set forth in the Advisory Contract from any economies of scale realized by the Advisor. Under the Advisory Contract, the fund pays the Advisor a single fee, or all-inclusive management fee, which is based on the fund’s average daily net assets. The all-inclusive management fee includes investment management services and provides for the Advisor to pay all of the fund’s ordinary, recurring operating expenses except for interest, taxes, portfolio transaction fees, and any nonrecurring extraordinary expenses that may arise. The Advisor has generally implemented an all-inclusive management fee structure in situations where a fixed total expense ratio is useful for purposes of providing certainty of fees and expenses for the investors in these funds and has historically sought to set the initial all-inclusive fee rate at levels below the expense ratios of comparable funds to take into account the potential future
srmgp_0618_P4Proof #
25
T. Rowe PRice Mid-caP GRowTh PoRTfolio
economies of scale. Because the fund serves as an underlying option to variable annuity products, the all-inclusive fee structure is utilized to create certainty for the annuity providers’ overall pricing decisions and disclosures. Assets of the fund are included in the calculation of the group fee rate, which serves as a component of the management fee for many T. Rowe Price funds and declines at certain asset levels based on the combined average net assets of most of the T. Rowe Price funds (including the fund). Although the fund does not have a group fee component to its management fee, its assets are included in the calculation because the primary investment resources utilized to manage the fund are shared with other actively managed funds. The Board concluded that, based on the profitability data it reviewed and consistent with this all-inclusive management fee structure, the advisory fee structure for the fund continued to be appropriate.
Fees and ExpensesThe Board was provided with information regarding industry trends in management fees and expenses. Among other things, the Board reviewed data for peer groups that were compiled by Broadridge, which compared: (i) contractual management fees, total expenses, actual management fees, and nonmanagement expenses of the fund with a group of competitor funds selected by Broadridge (Expense Group) and (ii) total expenses, actual management fees, and nonmanagement expenses of the fund with a broader set of funds within the Lipper investment classification (Expense Universe). The Board considered the fund’s contractual management fee rate, actual management fee rate, and total expenses (all of which generally reflect the all-inclusive management fee rate and do not deduct the operating expenses paid by the Advisor as part of the overall management fee) in comparison with the information for the Broadridge peer groups. Broadridge generally constructed the peer groups by seeking the most comparable funds based on similar investment classifications and objectives, expense structure, asset size, and operating components and attributes and ranked funds into quintiles, with the first quintile representing the funds with the lowest relative expenses and the fifth quintile representing the funds with the highest relative expenses. The information provided to the Board indicated that the fund’s contractual management fee ranked in the fourth quintile (Expense Group), the fund’s actual management fee rate ranked in the fourth quintile (Expense Group) and fifth quintile (Expense Universe), and the fund’s total expenses ranked in the fourth quintile (Expense Group and Expense Universe).
The Board requested additional information from management with respect to the fund’s relative management fees and total expenses ranking in the fourth and fifth quintiles and reviewed and considered the information provided relating to the fund, other funds in the peer groups, and other factors that the Board determined to be relevant.
The Board also reviewed the fee schedules for institutional accounts and private accounts with similar mandates that are advised or subadvised by the Advisor and its affiliates. Management provided the Board with information about the Advisor’s responsibilities and services provided to subadvisory and other institutional account clients, including information about how the requirements and economics of the institutional business are fundamentally different from those of the mutual fund business. The Board considered information showing that the Advisor’s mutual fund business is generally more complex from a business and compliance perspective than its institutional account business and considered various relevant factors, such as the broader scope of operations and oversight, more extensive shareholder communication infrastructure, greater asset flows, heightened business risks, and differences in applicable laws and regulations associated with the Advisor’s proprietary mutual fund business. In assessing the reasonableness of the fund’s management fee rate, the Board considered the differences in the nature of the services required for the Advisor to manage its mutual fund business versus managing a discrete pool of assets as a subadvisor to another institution’s mutual fund or for an institutional account and that the Advisor generally performs significant additional services and assumes greater risk in managing the fund and other T. Rowe Price funds than it does for institutional account clients.
On the basis of the information provided and the factors considered, the Board concluded that the fees paid by the fund under the Advisory Contract are reasonable.
Approval of the Advisory ContractAs noted, the Board approved the continuation of the Advisory Contract. No single factor was considered in isolation or to be determinative to the decision. Rather, the Board concluded, in light of a weighting and balancing of all factors considered, that it was in the best interests of the fund and its shareholders for the Board to approve the continuation of the Advisory Contract (including the fees to be charged for services thereunder).
APPROVAL OF INVESTMENT MANAGEMENT AGREEMENT (CONTINUED)

srmgp_0618_P4Proof #
201808-544954 E305-051 8/18
100 East Pratt Street Baltimore, MD 21202
Call 1-800-225-5132 to request a prospectus or summary prospectus; each includes investment objectives, risks, fees, expenses, and other information that you should read and consider carefully before investing.
T. Rowe Price Investment Services, Inc.