semi-annual report entrepreneurshares series trust™
TRANSCRIPT

Semi-Annual Report
EntrepreneurShares Series Trust™
EntrepreneurShares Series Trust (“Trust”) is a registered investment company consisting of separate investment portfolios called “Funds.” This Semi-Annual Report relates solely to the following Funds:
Name Ticker SymbolERShares Global Fund ENTIXERShares US Small Cap Fund IMPAXERShares US Large Cap Fund IMPLX
December 31, 2020
175 Federal Street Suite #875
Boston, MA 02110 Toll Free: 877-271-8811


1
ERShares Global Fund
SCHEDULE OF INVESTMENTS SUMMARY TABLEDecember 31, 2020 (Unaudited)
Percentage of
Net Assets
Communications 16.21%Consumer Discretionary 7.43%Consumer Staples 1.27%Energy 0.00%Financials 1.85%Health Care 39.94%Industrials 2.85%Real Estate 0.00%Technology 29.58%Other Assets and Liabilities 0.87%Total 100.00%
Portfolio holdings and allocations are subject to change.
2The accompanying notes are an integral part of these financial statements.
Shares Fair Value
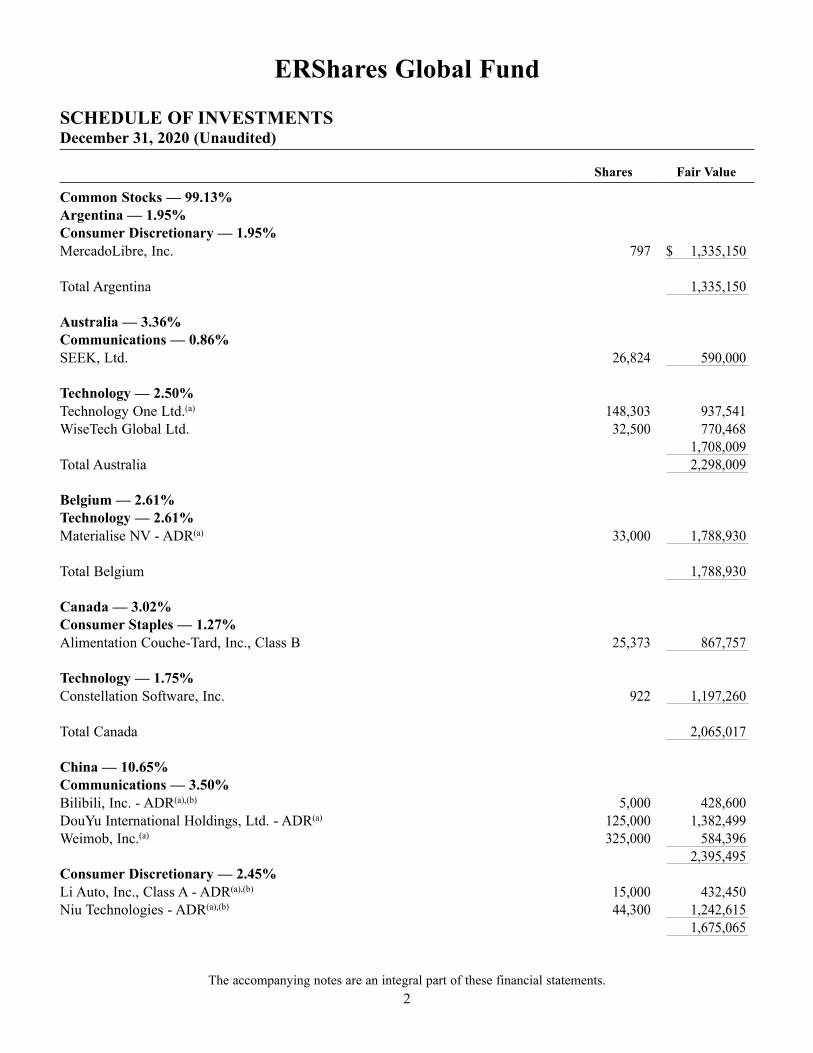
Common Stocks — 99.13%Argentina — 1.95%Consumer Discretionary — 1.95%MercadoLibre, Inc. 797 $ 1,335,150
Total Argentina 1,335,150
Australia — 3.36%Communications — 0.86%SEEK, Ltd. 26,824 590,000
Technology — 2.50%Technology One Ltd.(a) 148,303 937,541WiseTech Global Ltd. 32,500 770,468
1,708,009Total Australia 2,298,009
Belgium — 2.61%Technology — 2.61%Materialise NV - ADR(a) 33,000 1,788,930
Total Belgium 1,788,930
Canada — 3.02%Consumer Staples — 1.27%Alimentation Couche-Tard, Inc., Class B 25,373 867,757
Technology — 1.75%Constellation Software, Inc. 922 1,197,260
Total Canada 2,065,017
China — 10.65%Communications — 3.50%Bilibili, Inc. - ADR(a),(b) 5,000 428,600DouYu International Holdings, Ltd. - ADR(a) 125,000 1,382,499Weimob, Inc.(a) 325,000 584,396
2,395,495Consumer Discretionary — 2.45%Li Auto, Inc., Class A - ADR(a),(b) 15,000 432,450Niu Technologies - ADR(a),(b) 44,300 1,242,615
1,675,065
ERShares Global Fund
SCHEDULE OF INVESTMENTSDecember 31, 2020 (Unaudited)

3The accompanying notes are an integral part of these financial statements.
Shares Fair Value
Common Stocks (Continued)China (Continued)Financials — 1.67%Futu Holdings, Ltd. - ADR(a),(b) 25,000 $ 1,143,750
Health Care — 3.03%BeiGene Ltd. - ADR(a),(b) 3,250 839,768Sino Biopharmaceutical Ltd. 1,269,433 1,228,095
2,067,863Total China 7,282,173
Denmark — 3.08%Health Care — 3.08%Ascendis Pharma A/S - ADR(a) 4,892 815,888Genmab A/S(a) 3,204 1,295,294
2,111,182Total Denmark 2,111,182
France — 3.69%Health Care — 1.58%Cellectis S.A. - ADR(a) 40,000 1,082,400
Technology — 2.11%Teleperformance 4,350 1,441,737
Total France 2,524,137
Guernsey — 0.18%Financials — 0.18%Burford Capital Ltd. 12,791 124,366
Total Guernsey 124,366
Israel — 2.54%Communications — 1.00%Fiverr International, Ltd.(a) 3,500 682,850
Technology — 1.54%Check Point Software Technologies Ltd.(a) 7,931 1,054,109
Total Israel 1,736,959
ERShares Global Fund
SCHEDULE OF INVESTMENTS (Continued)December 31, 2020 (Unaudited)

4The accompanying notes are an integral part of these financial statements.
ERShares Global Fund
SCHEDULE OF INVESTMENTS (Continued)December 31, 2020 (Unaudited)
Shares Fair Value
Common Stocks (Continued)Japan — 2.63%Communications — 1.52%GMO internet, Inc. 36,334 $ 1,041,934
Consumer Discretionary — 1.11%Rakuten, Inc. 79,016 760,660
Total Japan 1,802,594
Luxembourg — 2.31%Communications — 2.31%Spotify Technology S.A.(a) 5,020 1,579,593
Total Luxembourg 1,579,593
Netherlands — 1.36%Technology — 1.36%Adyen N.V.(a) 400 930,898
Total Netherlands 930,898
Singapore — 0.36%Communications — 0.36%Sea Ltd. - ADR(a) 1,250 248,813
Total Singapore 248,813
Sweden — 1.02%Consumer Discretionary — 0.89%Evolution Gaming Group A.B. 6,000 608,780
Health Care — 0.13%Cellavision A.B. 2,316 86,418
Total Sweden 695,198
Switzerland — 3.80%Health Care — 3.80%CRISPR Therapeutics AG(a) 17,000 2,602,871
Total Switzerland 2,602,871

5The accompanying notes are an integral part of these financial statements.
Shares Fair Value
Common Stocks (Continued)United Kingdom — 1.06%Industrials — 1.06%HomeServe plc 51,915 $ 727,686
Total United Kingdom 727,686
United States — 55.51%Communications — 6.67%Roku, Inc.(a) 7,609 2,526,340Zillow Group, Inc., Class A(a) 15,000 2,039,100
4,565,440Consumer Discretionary — 1.03%Tesla, Inc.(a) 1,000 705,670
Health Care — 28.31%Accolade, Inc.(a),(b) 24,900 1,083,150Arcturus Therapeutics Holdings, Inc.(a) 12,000 520,560Beam Therapeutics, Inc.(a),(b) 8,000 653,120Castle Biosciences, Inc.(a) 13,000 872,950Exact Sciences Corp.(a) 10,000 1,324,900Intellia Therapeutics, Inc.(a),(b) 58,000 3,155,201Invitae Corp.(a),(b) 40,000 1,672,400Iovance Biotherapeutics, Inc.(a) 20,000 928,000Masimo Corp.(a) 6,776 1,818,543Personalis, Inc.(a) 16,000 585,760Regeneron Pharmaceuticals, Inc.(a) 1,587 766,696Seagen, Inc.(a) 10,000 1,751,400Teladoc Health, Inc.(a),(b) 5,776 1,154,969Twist Bioscience Corp.(a) 15,000 2,119,350Veracyte, Inc.(a) 20,000 978,800
19,385,799Industrials — 1.79%Cognex Corp. 15,281 1,226,835
Technology — 17.71%Bill.com Holdings, Inc.(a) 5,000 682,500Cloudflare, Inc.(a) 9,000 683,910Crowdstrike Holdings, Inc., Class A(a) 5,000 1,059,100Datadog, Inc.(a) 10,000 984,400Microchip Technology, Inc. 9,859 1,361,626Ontrak, Inc.(a),(b) 20,000 1,235,800Phreesia, Inc.(a) 25,000 1,356,500
ERShares Global Fund
SCHEDULE OF INVESTMENTS (Continued)December 31, 2020 (Unaudited)
6The accompanying notes are an integral part of these financial statements.
Shares Fair Value
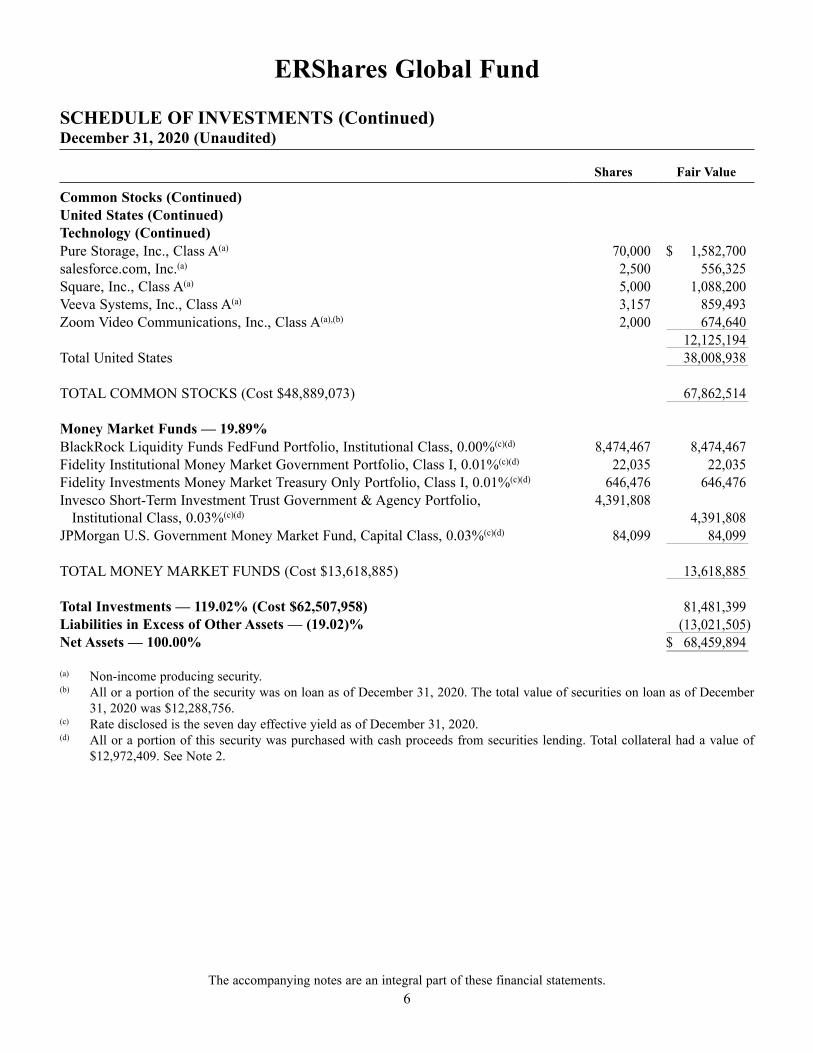
Common Stocks (Continued)United States (Continued)Technology (Continued)Pure Storage, Inc., Class A(a) 70,000 $ 1,582,700salesforce.com, Inc.(a) 2,500 556,325Square, Inc., Class A(a) 5,000 1,088,200Veeva Systems, Inc., Class A(a) 3,157 859,493Zoom Video Communications, Inc., Class A(a),(b) 2,000 674,640
12,125,194Total United States 38,008,938
TOTAL COMMON STOCKS (Cost $48,889,073) 67,862,514
Money Market Funds — 19.89%BlackRock Liquidity Funds FedFund Portfolio, Institutional Class, 0.00%(c)(d) 8,474,467 8,474,467Fidelity Institutional Money Market Government Portfolio, Class I, 0.01%(c)(d) 22,035 22,035Fidelity Investments Money Market Treasury Only Portfolio, Class I, 0.01%(c)(d) 646,476 646,476Invesco Short-Term Investment Trust Government & Agency Portfolio,
Institutional Class, 0.03%(c)(d)4,391,808
4,391,808JPMorgan U.S. Government Money Market Fund, Capital Class, 0.03%(c)(d) 84,099 84,099
TOTAL MONEY MARKET FUNDS (Cost $13,618,885) 13,618,885
Total Investments — 119.02% (Cost $62,507,958) 81,481,399Liabilities in Excess of Other Assets — (19.02)% (13,021,505)Net Assets — 100.00% $ 68,459,894
(a) Non-income producing security.(b) All or a portion of the security was on loan as of December 31, 2020. The total value of securities on loan as of December
31, 2020 was $12,288,756.(c) Rate disclosed is the seven day effective yield as of December 31, 2020.(d) All or a portion of this security was purchased with cash proceeds from securities lending. Total collateral had a value of
$12,972,409. See Note 2.
ERShares Global Fund
SCHEDULE OF INVESTMENTS (Continued)December 31, 2020 (Unaudited)

7
Percentage of Investments
Argentina 2.00%Australia 3.45%Belgium 2.68%Canada 1.30%Cayman Islands 10.92%Denmark 3.17%France 3.79%Guernsey 0.19%Israel 2.61%Japan 2.70%Netherlands 1.40%Singapore 0.37%Sweden 3.41%Switzerland 3.90%United Kingdom 1.09%United States 55.51%Total 100.00%
ERShares Global Fund
SCHEDULE OF INVESTMENTS COUNTRY OF RISK TABLE December 31, 2020 (Unaudited)

8
ERShares US Small Cap Fund
SCHEDULE OF INVESTMENTS SUMMARY TABLEDecember 31, 2020 (Unaudited)
Percentage of
Net Assets
Communications 2.59%Consumer Discretionary 5.01%Consumer Staples 0.71%Energy 1.80%Financials 6.54%Health Care 50.67%Industrials 4.03%Materials 0.92%Real Estate 3.23%Technology 22.21%Other Assets and Liabilities 2.29%Total 100.00%
Portfolio holdings and allocations are subject to change.

9The accompanying notes are an integral part of these financial statements.
Shares Fair Value
Common Stocks — 97.71%Communications — 2.59%Cargurus, Inc.(a) 96,464 $ 3,060,802HealthStream, Inc.(a) 46,764 1,021,326HUYA, Inc. - ADR(a),(b) 100,000 1,993,000
6,075,128Consumer Discretionary — 5.01%Freshpet, Inc.(a) 25,000 3,549,750GrowGeneration Corp.(a) 100,000 4,022,000Niu Technologies - ADR(a),(b) 148,800 4,173,840
11,745,590Consumer Staples — 0.71%AquaBounty Technologies, Inc.(a) 190,400 1,667,904
Energy — 1.80%Ameresco, Inc., Class A(a) 80,792 4,220,574
Financials — 6.54%Live Oak Bancshares, Inc. 132,025 6,265,906Pinnacle Financial Partners, Inc. 27,994 1,802,814Preferred Bank 27,585 1,392,215Trupanion, Inc.(a),(b) 49,000 5,865,790
15,326,725Health Care — 50.67%Accolade, Inc.(a),(b) 25,500 1,109,250Allogene Therapeutics, Inc.(a),(b) 41,800 1,055,032Arcturus Therapeutics Holdings, Inc.(a),(b) 110,000 4,771,800Arrowhead Pharmaceuticals, Inc.(a) 30,685 2,354,460Beam Therapeutics, Inc.(a),(b) 25,000 2,041,000Berkeley Lights, Inc.(a),(b) 9,100 813,631Castle Biosciences, Inc.(a) 25,000 1,678,750Cellectis S.A. - ADR(a) 70,300 1,902,318Corcept Therapeutics, Inc.(a) 177,300 4,638,168CRISPR Therapeutics AG(a),(b) 50,000 7,655,500Eagle Pharmaceuticals, Inc.(a) 35,815 1,667,905Editas Medicine, Inc.(a),(b) 80,000 5,608,800Exact Sciences Corp.(a) 34,702 4,597,668Fate Therapeutics, Inc.(a) 32,000 2,909,760Guardant Health, Inc.(a) 22,943 2,956,894Intellia Therapeutics, Inc.(a),(b) 150,000 8,160,001Invitae Corp.(a),(b) 135,000 5,644,350Ionis Pharmaceuticals, Inc.(a),(b) 34,463 1,948,538Iovance Biotherapeutics, Inc.(a) 80,000 3,712,000
ERShares US Small Cap Fund
SCHEDULE OF INVESTMENTSDecember 31, 2020 (Unaudited)

10The accompanying notes are an integral part of these financial statements.
Shares Fair Value
Common Stocks (Continued)Health Care (Continued)Kura Oncology, Inc.(a) 62,331 $ 2,035,730LeMaitre Vascular, Inc.(b) 65,173 2,639,507Madrigal Pharmaceuticals, Inc.(a),(b) 24,351 2,707,101Medpace Holdings, Inc.(a) 17,698 2,463,562Merit Medical Systems, Inc.(a) 31,915 1,771,602Natera, Inc.(a) 50,000 4,976,000Neurocrine Biosciences Inc.(a) 22,106 2,118,860Pacific Biosciences of California, Inc.(a),(b) 150,000 3,891,000Personalis, Inc.(a) 165,380 6,054,561Syros Pharmaceuticals, Inc.(a) 168,600 1,829,310Twist Bioscience Corp.(a) 50,000 7,064,500Ultragenyx Pharmaceutical, Inc.(a) 25,582 3,541,316Vapotherm, Inc.(a) 70,000 1,880,200Veracyte, Inc.(a) 140,000 6,851,599Zynex, Inc.(a),(b) 275,534 3,708,688
118,759,361Industrials — 4.03%Avalara, Inc.(a) 17,026 2,807,417Clean Harbors, Inc.(a) 41,966 3,193,613Insperity, Inc. 42,216 3,437,226
9,438,256Materials — 0.92%Encore Wire Corporation 35,700 2,162,349
Real Estate — 3.23%eXp World Holdings, Inc.(a) 85,300 5,384,136Medical Properties Trust, Inc. 99,957 2,178,063
7,562,199Technology — 22.21%Appfolio, Inc., Class A(a),(b) 9,658 1,738,826Bill.com Holdings, Inc.(a) 27,500 3,753,750Cloudflare, Inc.(a) 34,000 2,583,660Crowdstrike Holdings, Inc., Class A(a) 5,500 1,165,010Fastly, Inc.(a),(b) 30,000 2,621,100Impinj, Inc.(a) 50,316 2,106,731MongoDB, Inc.(a) 13,042 4,682,600Monolithic Power Systems, Inc.(b) 5,182 1,897,804
ERShares US Small Cap Fund
SCHEDULE OF INVESTMENTS (Continued)December 31, 2020 (Unaudited)

11The accompanying notes are an integral part of these financial statements.
Shares Fair Value
Common Stocks (Continued)Technology (Continued)Omnicell, Inc.(a) 33,938 $ 4,073,239Ontrak, Inc.(a),(b) 68,800 4,251,152PagerDuty, Inc.(a),(b) 165,000 6,880,500Phreesia, Inc.(a) 44,000 2,387,440Pure Storage, Inc., Class A(a) 140,000 3,165,400Schrodinger, Inc.(a) 25,000 1,979,500Super Micro Computer, Inc.(a) 100,761 3,190,093Vicor Corporation(a) 39,282 3,622,586Zscaler, Inc.(a) 9,750 1,947,173
52,046,564TOTAL COMMON STOCKS (Cost $161,590,205) 229,004,650
Money Market Funds — 20.09%BlackRock Liquidity Funds FedFund Portfolio, Institutional Class, 0.00%(c)(d) 30,677,569 30,677,569Fidelity Institutional Money Market Government Portfolio, Class I, 0.01%(c)(d) 79,767 79,767Fidelity Investments Money Market Treasury Only Portfolio, Class I, 0.01%(c)(d) 116,720 116,720Invesco Short-Term Investment Trust Government & Agency Portfolio,
Institutional Class, 0.03%(c)(d) 15,898,346 15,898,346JPMorgan U.S. Government Money Market Fund, Capital Class, 0.03%(c)(d) 304,439 304,439
TOTAL MONEY MARKET FUNDS (Cost $47,076,841) 47,076,841
Total Investments — 117.80% (Cost $208,667,046) 276,081,491Liabilities in Excess of Other Assets — (17.80)% (41,724,399)Net Assets — 100.00% $ 234,357,092
(a) Non-income producing security.(b) All or a portion of the security was on loan as of December 31, 2020. The total value of securities on loan as of December
31, 2020 was $43,656,269.(c) Rate disclosed is the seven day effective yield as of December 31, 2020.(d) All or a portion of this security was purchased with cash proceeds from securities lending. Total collateral had a value of
$46,960,121. See Note 2.
ERShares US Small Cap Fund
SCHEDULE OF INVESTMENTS (Continued)December 31, 2020 (Unaudited)

12
ERShares US Large Cap Fund
SCHEDULE OF INVESTMENTS SUMMARY TABLEDecember 31, 2020 (Unaudited)
Percentage of
Net Assets
Communications 21.88%Consumer Discretionary 5.86%Financials 1.94%Health Care 37.78%Technology 30.22%Other Assets and Liabilities 2.32%Total 100.00%
Portfolio holdings and allocations are subject to change.

13The accompanying notes are an integral part of these financial statements.
Shares Fair Value
Common Stocks — 97.68%Communications — 21.88%Alphabet, Inc., Class A(a) 1,400 $ 2,453,696DouYu International Holdings, Ltd. - ADR(a) 150,000 1,659,000Facebook, Inc., Class A(a) 12,000 3,277,920Netflix, Inc.(a) 10,386 5,616,022Roku, Inc.(a) 27,609 9,166,740Spotify Technology S.A.(a) 12,000 3,775,920Trade Desk, Inc. (The), Class A(a) 7,300 5,847,300VeriSign, Inc.(a) 16,212 3,508,277Zillow Group, Inc., Class A(a) 66,000 8,972,040
44,276,915Consumer Discretionary — 5.86%Amazon.com, Inc.(a) 1,000 3,256,930Copart, Inc.(a) 18,622 2,369,650Li Auto, Inc., Class A - ADR(a),(b) 40,000 1,153,200Tesla, Inc.(a) 6,000 4,234,020XPeng, Inc. - ADR(a) 20,000 856,600
11,870,400Financials — 1.94%BlackRock, Inc. 5,440 3,925,178
Health Care — 37.78%Arcturus Therapeutics Holdings, Inc.(a) 45,000 1,952,100Arrowhead Pharmaceuticals, Inc.(a) 57,498 4,411,822CRISPR Therapeutics AG(a) 52,000 7,961,719Danaher Corp. 10,000 2,221,400Editas Medicine, Inc.(a),(b) 50,000 3,505,500Exact Sciences Corp.(a) 35,000 4,637,150Intellia Therapeutics, Inc.(a) 70,000 3,808,000Invitae Corp.(a),(b) 140,000 5,853,400Ionis Pharmaceuticals, Inc.(a) 29,244 1,653,456Masimo Corp.(a) 22,850 6,132,483Pacific Biosciences of California, Inc.(a) 150,000 3,891,000Personalis, Inc.(a) 50,000 1,830,500Regeneron Pharmaceuticals, Inc.(a) 4,115 1,987,998ResMed, Inc. 16,125 3,427,530Seagen, Inc.(a) 27,679 4,847,700Teladoc Health, Inc.(a),(b) 34,196 6,837,832Twist Bioscience Corp.(a) 47,000 6,640,629United Therapeutics Corporation(a) 19,032 2,888,867Veracyte, Inc.(a) 40,000 1,957,600
76,446,686
ERShares US Large Cap Fund
SCHEDULE OF INVESTMENTSDecember 31, 2020 (Unaudited)

14The accompanying notes are an integral part of these financial statements.
Shares Fair Value
Common Stocks (Continued)Technology — 30.22%Bill.com Holdings, Inc.(a) 13,500 $ 1,842,750Cloudflare, Inc.(a) 42,500 3,229,575Crowdstrike Holdings, Inc., Class A(a) 15,000 3,177,300Datadog, Inc.(a) 44,000 4,331,360EPAM Systems, Inc.(a) 6,090 2,182,352Fastly, Inc.(a) 20,000 1,747,400Fortinet, Inc.(a) 20,156 2,993,771NVIDIA Corp. 8,783 4,586,483Okta, Inc.(a) 15,000 3,813,900RingCentral, Inc., Class A(a) 5,000 1,894,850salesforce.com, Inc.(a) 13,000 2,892,890Square, Inc., Class A(a) 35,500 7,726,220Synopsys, Inc.(a) 12,200 3,162,728Twilio, Inc., Class A(a) 20,000 6,769,999Ubiquiti, Inc. 8,000 2,228,080Veeva Systems, Inc., Class A(a) 11,785 3,208,466Zoom Video Communications, Inc., Class A(a),(b) 3,000 1,011,960Zscaler, Inc.(a) 21,750 4,343,693
61,143,777TOTAL COMMON STOCKS (Cost $150,427,813) 197,662,956
Money Market Funds — 7.02%BlackRock Liquidity Funds FedFund Portfolio, Institutional Class, 0.00%(c)(d) 9,273,488 9,273,488Fidelity Institutional Money Market Government Portfolio, Class I, 0.01%(c)(d) 24,113 24,113Invesco Short-Term Investment Trust Government & Agency Portfolio,
Institutional Class, 0.03%(c)(d) 4,805,893 4,805,893JPMorgan U.S. Government Money Market Fund, Capital Class, 0.03%(c)(d) 92,028 92,028
TOTAL MONEY MARKET FUNDS (Cost $14,195,522) 14,195,522
Total Investments — 104.70% (Cost $164,623,335) 211,858,478Liabilities in Excess of Other Assets — (4.70)% (9,516,933)Net Assets — 100.00% $ 202,341,545
(a) Non-income producing security.(b) All or a portion of the security was on loan as of December 31, 2020. The total value of securities on loan as of December
31, 2020 was $12,882,727.(c) Rate disclosed is the seven day effective yield as of December 31, 2020.(d) All or a portion of this security was purchased with cash proceeds from securities lending. Total collateral had a value of
$14,195,522. See Note 2.
ERShares US Large Cap Fund
SCHEDULE OF INVESTMENTS (Continued)December 31, 2020 (Unaudited)

15The accompanying notes are an integral part of these financial statements.
EntrepreneurShares Series Trust
STATEMENTS OF ASSETS AND LIABILITIESDecember 31, 2020 (Unaudited)
ERShares Global Fund
ERShares US Small Cap Fund
ERShares US Large Cap Fund
AssetsInvestments, at cost $ 62,507,958 $ 208,667,046 $ 164,623,335Investments, at fair value(a) 81,481,399 276,081,491 211,858,478Cash 2,841 — 4,723,792Receivable for fund shares sold — — 102,488Receivable for investments sold — 8,199,707 —Dividends and interest receivable 10,400 30,858 1,849Securities lending income receivable 7,625 20,070 1,741Tax reclaims receivable 23,642 496 366Prepaid expenses 6,606 6,045 7,374
Total Assets 81,532,513 284,338,667 216,696,088
LiabilitiesCollateral due to broker for securities loaned 12,972,409 46,960,121 14,195,522Due to custodian — 36,686 —Payable for fund shares redeemed — 2,321 —Payable for investments purchased — 2,779,204 —Payable to Adviser 74,224 159,005 115,715Payable to Administrator 5,609 14,907 15,508Accrued expenses and other liabilities 20,377 29,331 27,798
Total Liabilities 13,072,619 49,981,575 14,354,543Net Assets $ 68,459,894 $ 234,357,092 $ 202,341,545
Net Assets consist of:Paid-in capital 44,533,647 159,590,029 128,323,021Accumulated earnings 23,926,247 74,767,063 74,018,524
Net Assets $ 68,459,894 $ 234,357,092 $ 202,341,545Institutional Class
Net Assets $ 68,459,894 $ 234,357,092 $ 202,341,545Shares outstanding (unlimited number of shares authorized,
$0.01 par value) 3,308,432 15,389,336 10,745,522Net asset value, offering and redemption price per share $ 20.69 $ 15.23 $ 18.83
Redemption price per share (NAV * 98%)(a) $ 20.28 $ 14.93 $ 18.45
(a) Includes securities on loan of $12,288,756, $43,656,269 and $12,882,727 (See Note 2).

16The accompanying notes are an integral part of these financial statements.
ERShares Global Fund
ERShares US Small Cap Fund
ERShares US Large Cap Fund
Investment IncomeDividend income (net of foreign taxes withheld of
$6,304, $176 and $–) $ 142,435 $ 375,003 $ 237,331Interest income 95 218 287Securities lending income 63,746 99,569 6,331Total investment income 206,276 474,790 243,949
ExpensesAdvisory fees 381,843 730,249 583,846Fund accounting and administration fees 15,873 45,467 42,789Auditing fees 8,694 8,695 8,695Registration fees 8,496 11,673 12,109Transfer agent 8,307 15,043 14,972Custodian fees 6,071 4,433 4,428Legal fees 5,644 13,474 12,168Pricing fees 4,475 5,028 3,507Trustees’ fees and expenses 1,225 3,794 3,496Shareholder reporting fees 1,222 3,500 3,992Insurance expense 1,202 1,907 1,603Chief Compliance Officer fees 163 626 588Miscellaneous 7,273 4,623 4,525Total expenses 450,488 848,512 696,718Fees contractually waived by Adviser — (19,795) (22,889)Net operating expenses 450,488 828,717 673,829Net investment loss (244,212) (353,927) (429,880)
Net Realized and Change in Unrealized Gain (Loss) on Investments
Net realized gain (loss) on:Investments 11,713,258 28,125,191 33,991,461Foreign currency transactions 220 — —
Net realized gain 11,713,478 28,125,191 33,991,461
Change in unrealized appreciation on:Investments 6,618,071 44,104,116 17,581,873Foreign currency translations 1,246 5 12
Net change in unrealized appreciation 6,619,317 44,104,121 17,581,885Net realized and change in unrealized gain on investments 18,332,795 72,229,312 51,573,346Net increase in net assets resulting from operations $ 18,088,583 $ 71,875,385 $ 51,143,466
EntrepreneurShares Series Trust
STATEMENTS OF OPERATIONSFor the six months ended December 31, 2020 (Unaudited)

17The accompanying notes are an integral part of these financial statements.
Six Months Ended
December 31, 2020
Year Ended
June 30, 2020
(Unaudited)Increase (Decrease) in Net Assets from:Operations:
Net investment loss $ (244,212) $ (285,644)Net realized gain on investments and foreign currency transactions 11,713,478 413,872Net change in unrealized appreciation (depreciation) on investments and
foreign currency translations 6,619,317 4,970,093Net increase in net assets resulting from operations 18,088,583 5,098,321
Distributions to ShareholdersInstitutional ClassFrom earnings (6,630,435) (1,788,910)
Total distributions to shareholders (6,630,435) (1,788,910)
Capital Transactions Institutional ClassProceeds from shares sold 133,697 483,631Proceeds from redemption fees(a) — 77Reinvestment of distributions 5,884,564 1,436,494Cost of shares redeemed (250,353) (17,779,977)Net increase (decrease) in net assets resulting from capital transactions 5,767,908 (15,859,775)Total Increase (Decrease) in Net Assets 17,226,056 (12,550,364)
Net AssetsBeginning of period 51,233,838 63,784,202End of period $ 68,459,894 $ 51,233,838
Share Transactions Institutional ClassShares sold 6,292 30,378Shares issued in reinvestment of distributions 268,212 87,859Shares redeemed (12,226) (1,114,539)Net increase (decrease) in shares outstanding 262,278 (996,302)
(a) The Fund charges a 2% redemption fee on shares redeemed within 5 business days of purchase. Shares are redeemed at the NAV if held longer than 5 days.
ERShares Global Fund
STATEMENTS OF CHANGES IN NET ASSETS

18The accompanying notes are an integral part of these financial statements.
Six Months Ended
December 31, 2020
Year Ended
June 30, 2020
(Unaudited)Increase (Decrease) in Net Assets from:Operations:
Net investment loss $ (353,927) $ (72,820)Net realized gain on investments and foreign currency transactions 28,125,191 11,734,063Net change in unrealized appreciation (depreciation) on investments and
foreign currency translations 44,104,121 (8,945,811)Net increase in net assets resulting from operations 71,875,385 2,715,432
Distributions to ShareholdersInstitutional ClassFrom earnings (30,803,421) (9,831,600)
Total distributions to shareholders (30,803,421) (9,831,600)
Capital Transactions Institutional ClassProceeds from shares sold 665,789 13,368,391Proceeds from redemption fees(a) — 106Reinvestment of distributions 30,801,244 9,828,304Cost of shares redeemed (2,009,750) (12,963,251)Net increase (decrease) in net assets resulting from capital transactions 29,457,283 10,233,550Total Increase (Decrease) in Net Assets 70,529,247 3,117,382
Net AssetsBeginning of period 163,827,845 160,710,463End of period $ 234,357,092 $ 163,827,845
Share Transactions Institutional ClassShares sold 46,359 1,289,169Shares issued in reinvestment of distributions 1,845,491 823,831Shares redeemed (147,119) (115,447)Net increase (decrease) in shares outstanding 1,744,731 997,553
(a) The Fund charges a 2% redemption fee on shares redeemed within 5 business days of purchase. Shares are redeemed at the NAV if held longer than 5 days.
ERShares US Small Cap Fund
STATEMENTS OF CHANGES IN NET ASSETS

19The accompanying notes are an integral part of these financial statements.
Six Months Ended
December 31, 2020
Year Ended
June 30, 2020
(Unaudited)Increase (Decrease) in Net Assets from:Operations:
Net investment loss $ (429,880) $ (252,655)Net realized gain on investments and foreign currency transactions 33,991,461 37,691,888Net change in unrealized appreciation (depreciation) on investments and
foreign currency translations 17,581,885 (13,899,964)Net increase in net assets resulting from operations 51,143,466 23,539,269
Distributions to ShareholdersInstitutional ClassFrom earnings (36,057,302) (8,147,630)
Total distributions to shareholders (36,057,302) (8,147,630)
Capital Transactions Institutional ClassProceeds from shares sold 2,291,171 8,188,540Proceeds from redemption fees(a) 391 881Reinvestment of distributions 36,005,768 8,143,889Cost of shares redeemed (2,350,412) (13,737,301)Net increase (decrease) in net assets resulting from capital transactions 35,946,918 2,596,009Total Increase (Decrease) in Net Assets 51,033,082 17,987,648
Net AssetsBeginning of period 151,308,463 133,320,815End of period $ 202,341,545 $ 151,308,463
Share Transactions Institutional ClassShares sold 112,062 531,797Shares issued in reinvestment of distributions 1,794,904 534,727Shares redeemed (116,317) (898,773)Net increase (decrease) in shares outstanding 1,790,649 167,751
(a) The Fund charges a 2% redemption fee on shares redeemed within 5 business days of purchase. Shares are redeemed at the NAV if held longer than 5 days.
ERShares US Large Cap Fund
STATEMENTS OF CHANGES IN NET ASSETS

20The accompanying notes are an integral part of these financial statements.
ERShares Global Fund
FINANCIAL HIGHLIGHTS – Institutional Class
(For a share outstanding during each period)Six Months
Ended December 31, Year Ended June 30,
2020 2020 2019 2018 2017 2016(Unaudited)
Selected Per Share Data:Net asset value, beginning of period $ 16.82 $ 15.78 $ 16.07 $ 14.65 $ 11.81 $ 12.19
Investment operations:Net investment loss(a) (0.07) (0.08) (0.06) (0.10) (0.07) (0.07)Net realized and unrealized gain (loss) 6.12 1.61 0.16 2.77 2.91 (0.27)Total from investment operations 6.05 1.53 0.10 2.67 2.84 (0.34)
Less distributions to shareholders from:Net investment income — — — — — (0.04)Net realized gains (2.18) (0.49) (0.39) (1.25) — —
Total distributions (2.18) (0.49) (0.39) (1.25) — (0.04)
Net asset value, end of period $ 20.69 $ 16.82 $ 15.78 $ 16.07 $ 14.65 $ 11.81
Total Return(b) 35.24%(c) 9.80% 1.11% 18.65% 24.05% (2.75)%
Ratios and Supplemental Data:Net assets, end of period
(000 omitted) $ 68,460 $ 51,234 $ 63,784 $ 63,082 $ 26,933 $ 21,782Ratio of expenses to average net assets:
Before fees waived 1.47%(d) 1.49% 1.47% 1.53% 1.74% 2.52%After fees waived 1.47%(d) 1.49% 1.56% 1.70% 1.70% 1.70%
Ratio of net investment income (loss) to average net assets:Before fees waived (0.80)%(d) (0.51)% (0.27)% (0.47)% (0.57)% (1.43)%After fees waived (0.80)%(d) (0.51)% (0.36)% (0.64)% (0.53)% (0.61)%
Portfolio turnover rate 74%(c) 61% 23% 38% 65% 71%
(a) Based on average shares outstanding during the period.(b) Total returns would have been lower/higher had certain expenses not been waived/recovered by the advisor (see Note 3). Returns
shown do not reflect the deduction of taxes that a shareholder would pay on Fund distributions or redemptions of Fund shares.(c) Not annualized.(d) Annualized.

21The accompanying notes are an integral part of these financial statements.
ERShares US Small Cap Fund
FINANCIAL HIGHLIGHTS – Institutional Class
(For a share outstanding during each period)Six Months
Ended December 31, Year Ended June 30,
2020 2020 2019 2018 2017 2016(Unaudited)
Selected Per Share Data:Net asset value, beginning of period $ 12.01 $ 12.71 $ 15.27 $ 12.75 $ 9.72 $ 11.45
Investment operations:Net investment income (loss)(a) (0.02) (0.01) —(b) (0.02) 0.01 0.02Net realized and unrealized gain (loss) 5.51 0.11 (0.28) 3.89 3.04 (1.14)Total from investment operations 5.49 0.10 (0.28) 3.87 3.05 (1.12)
Less distributions to shareholders from:Net investment income — (0.01) — — (0.02) —(b)
Net realized gains (2.27) (0.79) (2.28) (1.35) — (0.61)Total distributions (2.27) (0.80) (2.28) (1.35) (0.02) (0.61)
Net asset value, end of period $ 15.23 $ 12.01 $ 12.71 $ 15.27 $ 12.75 $ 9.72
Total Return(c) 44.08%(d) 0.86% 1.58% 32.42% 31.39% (9.63)%
Ratios and Supplemental Data:Net assets, end of period
(000 omitted) $ 234,357 $ 163,828 $ 160,710 $ 159,435 $ 120,847 $ 130,705Ratio of expenses to average net assets:
Before fees waived 0.87%(e) 0.90% 0.89% 0.90% 0.90% 0.91%After fees waived 0.85%(e) 0.85% 0.85% 0.85% 0.85% 0.85%
Ratio of net investment income (loss) to average net assets:Before fees waived (0.38)%(e) (0.10)% (0.05)% (0.16)% (0.18)% 0.11%After fees waived (0.36)%(e) (0.05)% (0.01)% (0.11)% (0.13)% 0.17%
Portfolio turnover rate 75%(d) 139%(f) 43% 72% 53% 67%
(a) Based on average shares outstanding during the period.(b) Rounds to less than $0.005 per share. (c) Total returns would have been lower/higher had certain expenses not been waived/recovered by the advisor (see Note 3). Returns
shown do not reflect the deduction of taxes that a shareholder would pay on Fund distributions or redemptions of Fund shares.(d) Not annualized.(e) Annualized. (f) Given the abnormal market circumstances resulting from the COVID-19 situation, the Fund had taken a temporary defensive
position. As the market started to recover, the Fund has been reversing its temporary defensive position. This temporary implementation and reversion of the defensive position increased the Fund’s turnover.

22The accompanying notes are an integral part of these financial statements.
ERShares US Large Cap Fund
FINANCIAL HIGHLIGHTS – Institutional Class
(For a share outstanding during each period)Six Months
Ended December 31, Year Ended June 30,
2020 2020 2019 2018 2017 2016(Unaudited)
Selected Per Share Data:Net asset value, beginning of period $ 16.90 $ 15.17 $ 14.75 $ 12.61 $ 10.65 $ 10.77
Investment operations:Net investment income (loss)(a) (0.04) (0.03) —(b) (0.02) 0.04 0.07Net realized and unrealized gain (loss) 6.00 2.73 0.69 3.48 2.10 (0.12)Total from investment operations 5.96 2.70 0.69 3.46 2.14 (0.05)
Less distributions to shareholders from:Net investment income — — — (0.01) (0.06) (0.07)Net realized gains (4.03) (0.97) (0.27) (1.31) (0.12) —
Total distributions (4.03) (0.97) (0.27) (1.32) (0.18) (0.07)
Net asset value, end of period $ 18.83 $ 16.90 $ 15.17 $ 14.75 $ 12.61 $ 10.65
Total Return(c) 33.83%(d) 18.50% 5.09% 28.67% 20.26% (0.49)%
Ratios and Supplemental Data:Net assets, end of period
(000 omitted) $ 202,342 $ 151,308 $ 133,321 $ 124,392 $ 107,823 $ 88,495Ratio of expenses to average net assets:
Before fees waived 0.78%(e) 0.80% 0.79% 0.81% 0.82% 0.83%After fees waived 0.75%(e) 0.75% 0.75% 0.75% 0.75% 0.75%
Ratio of net investment income (loss) to average net assets:Before fees waived (0.51)%(e) (0.24)% (0.07)% (0.18)% 0.26% 0.59%After fees waived (0.48)%(e) (0.19)% (0.03)% (0.12)% 0.33% 0.67%
Portfolio turnover rate 75%(d) 149%(f) 0% 43% 43% 77%
(a) Based on average shares outstanding during the period.(b) Rounds to less than $0.005 per share. (c) Total returns would have been lower/higher had certain expenses not been waived/recovered by the advisor (see Note 3). Returns
shown do not reflect the deduction of taxes that a shareholder would pay on Fund distributions or redemptions of Fund shares.(d) Not annualized.(e) Annualized. (f) Given the abnormal market circumstances resulting from the COVID-19 situation, the Fund had taken a temporary defensive
position. As the market started to recover, the Fund has been reversing its temporary defensive position. This temporary implementation and reversion of the defensive position increased the Fund’s turnover.

23
1. ORGANIZATIONEntrepreneurShares™ Series Trust, a Delaware statutory trust (the “Trust”), was formed on July 1, 2010, and has authorized capital of unlimited shares of beneficial interest. The Trust is an open-end management investment company registered under the Investment Company Act of 1940, as amended (the “1940 Act”), and is authorized to issue multiple series and classes of shares. The ERShares Global Fund formerly known as the EntrepreneurShares Global Fund (the “Global Fund”), the ERShares US Small Cap Fund formerly known as the Entrepreneur U.S. Small Cap Fund (the “US Small Cap Fund”), and the ERShares US Large Cap Fund formerly known as the Entrepreneur U.S. Large Cap Fund (the “US Large Cap Fund”) (each separately a “Fund”, or collectively, the “Funds”) are each classified as a “diversified” series, as defined in the 1940 Act. The Funds are investment companies and, accordingly, follow the investment company accounting and reporting guidance of the Financial Accounting Standards Board Accounting Standards Codification Topic 946 – Investment Companies including Accounting Standards Update (“ASU”) 2013-08. The Global Fund commenced operations on November 11, 2010. The US Small Cap Fund commenced operations on December 17, 2013. The US Large Cap Fund commenced operations on June 30, 2014.
The investment objective of the Global Fund is long-term capital appreciation. The Global Fund seeks to achieve its objective by investing in equity securities of global companies with market capitalizations that are above $300 million at the time of initial purchase and possess entrepreneurial characteristics, as determined by EntrepreneurShares, LLC, the Global Fund’s sub-advisor, (the “Sub-Advisor”), and Seaport Global Advisors, LLC formerly known as Weston Capital Advisors, LLC, the Global Fund’s investment advisor (the “Global Advisor”). Dr. Joel M. Shulman has been the Global Fund’s portfolio manager since November 11, 2010 and Managing Director of the Advisor and President of the Sub-Advisor.
The investment objective of the US Small Cap Fund is long-term capital appreciation. The US Small Cap Fund seeks to achieve its objective by investing at least 80% of its net assets (plus any borrowing for investment purposes) in equity securities of U.S. companies with market capitalization above $300 million at the time of initial purchase and possess entrepreneurial characteristics, as determined by Capital Impact Advisors, LLC (the “Advisor”, collectively with the Global Advisor, the “Advisors”), the US Small Cap Fund’s investment advisor. Dr. Joel M. Shulman has been the US Small Cap Fund’s portfolio manager since December 17, 2013 and Chief Executive Officer of the Advisor.
The investment objective of the US Large Cap Fund is long-term capital appreciation. The US Large Cap Fund seeks to achieve its objective by investing in equity securities of U.S. companies with market capitalizations that are above $5 billion at the time of initial purchase and possess entrepreneurial characteristics, as determined by Capital Impact Advisors, LLC, the US Large Cap Fund’s investment advisor. Dr. Joel M. Shulman has been the US Large Cap Fund’s portfolio manager since June 30, 2014 and is Managing Director of the Advisor.
The Global Fund has registered three classes of shares: Class A shares, Retail Class shares and Institutional Class shares. The US Small Cap Fund and US Large Cap Fund each have registered two classes of shares: Institutional Class shares and Retail Class shares. Each share represents an equal proportionate interest in the assets and liabilities belonging to the applicable class and is entitled to such dividends and distributions out of income belonging to the applicable class as are declared by the EntrepreneurShares Series Trust Board of Trustees (the “Board”). On matters that affect the Fund as a whole, each class has the same voting and other rights and preferences as any other class. On matters that affect only one class, only shareholders of that class may vote. Each class votes separately on matters affecting only that class, or on matters expressly required to be voted on separately by state or federal law. Shares of each class of a series have the same voting and other rights and preferences as the other classes and series of the Trust for matters that affect the Trust as a whole. Currently, only Institutional Class shares of each of the Global Fund, US Small Cap Fund and US Large Cap are being offered.
EntrepreneurShares Series Trust
NOTES TO FINANCIAL STATEMENTSDecember 31, 2020 (Unaudited)

24
2. SUMMARY OF SIGNIFICANT ACCOUNTING POLICIESThe following is a summary of significant accounting policies consistently followed by the Funds in the preparation of their financial statements. These policies are in conformity with accounting principles generally accepted in the United States of America (“U.S. GAAP”).
Investment ValuationThe following is a summary of the Funds’ pricing procedures. It is intended to be a general discussion and may not necessarily reflect all pricing procedures followed by the Funds.
In determining the net asset value (“NAV”) of the Funds’ shares, securities that are listed on a national securities exchange (other than the National Association of Securities Dealers’ Automatic Quotation System (“NASDAQ”)) are valued at the last sale price on the day the valuation is made. Securities that are traded on NASDAQ under one of its three listing tiers, NASDAQ Global Select Market, NASDAQ Global Market and NASDAQ Capital Market, are valued at the NASDAQ Official Closing Price. Price information on listed securities is taken from the exchange where the security is primarily traded. Securities which are listed on an exchange but which are not traded on the valuation date are valued at the most recent bid price.
Unlisted securities held by the Funds are valued at the average of the quoted bid and ask prices in the over-the-counter market. Securities and other assets for which market quotations are not readily available are valued at their fair value as determined in good faith under procedures established by and under the general supervision and responsibility of the Board. Investments in registered open-end investment companies other than exchange-traded funds are valued at the reported NAV.
Short-term investments with 61 days or more to maturity at time of purchase are valued at fair market value through the 61st day prior to maturity, based on quotations received from market makers or other appropriate sources; thereafter, they are generally valued at amortized cost. There is no definitive set of circumstances under which the Funds may elect to use fair value procedures to value a security. Types of securities that the Funds may hold for which fair value pricing might be required include, but are not limited to: (a) illiquid securities, including restricted securities and private placements for which there is no public market; (b) options not traded on a securities exchange; (c) securities of an issuer that has entered into a restructuring; (d) securities whose trading has been halted or suspended, as permitted by the Securities and Exchange Commission (the “SEC”); (e) foreign securities, if an event or development has occurred subsequent to the close of the foreign market and prior to the close of regular trading on the New York Stock Exchange that would materially affect the value of the security; and (f) fixed income securities that have gone into default and for which there is not a current market value quotation.
Valuing securities at fair value involves greater reliance on judgment than securities that have readily available market quotations. There can be no assurance that the Funds could obtain the fair value price assigned to a security upon sale.
Securities that are not listed on an exchange are valued by the Funds’ Advisors, under the supervision of the Board. There is no single standard for determining the fair value of a security. Rather, in determining the fair value of a security, the Advisors and the Board take into account the relevant factors and surrounding circumstances, which may include: (1) the nature and pricing history (if any) of the security; (2) whether any dealer quotations for the security are available; (3) possible valuation methodologies that could be used to determine the fair value of the security; (4) the recommendation of the portfolio manager of the Funds with respect to the valuation of the security; (5) whether the same or similar securities are held by other funds managed by the Advisors or other funds and the method used to price the security in those funds; (6) the extent to which the fair value to be determined for the security will result from the use of data or formulae produced by third parties independent of the Advisors; and (7) the liquidity or illiquidity of the market for the security.
EntrepreneurShares Series Trust
NOTES TO FINANCIAL STATEMENTS (Continued)December 31, 2020 (Unaudited)

25
Fair Value MeasurementThe Funds have adopted authoritative fair valuation accounting standards which establish an authoritative definition of fair value and set out a hierarchy for measuring fair value. These standards require additional disclosures about the various inputs and valuation techniques used to develop the measurements of fair value, a discussion of changes in valuation techniques and related inputs during the year and expanded disclosure of valuation levels for major security types. The hierarchy gives the highest priority to unadjusted quoted prices in active markets for identical assets or liabilities (Level 1 measurement) and the lowest priority to unobservable inputs (Level 3 measurements). The three levels of the fair value hierarchy are as follows:
Level 1: Unadjusted quoted prices in active markets for identical assets that the Funds have the ability to access at the measurement date;
Level 2: Observable inputs other than quoted prices included in Level 1 that are observable for the asset either directly or indirectly. These inputs may include quoted prices for identical instruments on inactive markets, quoted prices for similar instruments, interest rates, prepayment spreads, credit risk, yield curves, default rates, and similar data;
Level 3: Significant unobservable inputs for the asset to the extent that relevant observable inputs are not available, representing the Funds’ own assumptions that a market participant would use in valuing the asset, and would be based on the best information available.
Inputs are used in applying the various valuation techniques and broadly refer to the assumptions that market participants use to make valuation decisions, including assumptions about risk. Inputs may include price information, volatility statistics, specific and broad credit data, liquidity statistics, and other factors. A financial instrument’s level within the fair value hierarchy is based on the lowest level of any input that is significant to the fair value measurement. However, the determination of what constitutes “observable” requires significant judgment by the Funds. The Funds consider observable data to be that market data which is readily available, regularly distributed or updated, reliable and verifiable, not proprietary, and provided by independent sources that are actively involved in the relevant market. The categorization of a financial instrument within the hierarchy is based upon the pricing transparency of the instrument and does not necessarily correspond to the Funds’ perceived risk of that instrument.
Investments whose values are based on quoted market prices in active markets, and are therefore classified within Level 1, include active listed equities and real estate investment trusts, and certain money market securities. Investments that trade in markets that are not considered to be active, but are valued based on quoted market prices, dealer quotations or alternative pricing sources supported by observable inputs are classified within Level 2. Investments classified within Level 3 have significant unobservable inputs, as they trade infrequently or not at all. During the period ended December 31, 2020, the Funds did not hold any instrument which used significant unobservable inputs (Level 3) in determining fair value. The tables below are a summary of the inputs used to value the Funds’ investments as of December 31, 2020.
Global Fund* Level 1 Level 2 Level 3 Total
Common Stocks $ 67,862,514 $ — $ — $ 67,862,514 Short-Term Investments 13,618,885 — — 13,618,885 Total Investments $ 81,481,399 $ — $ — $ 81,481,399
EntrepreneurShares Series Trust
NOTES TO FINANCIAL STATEMENTS (Continued)December 31, 2020 (Unaudited)

26
US Small Cap Fund* Level 1 Level 2 Level 3 Total
Common Stocks $ 229,004,650 $ — $ — $ 229,004,650 Short-Term Investments 47,076,841 — — 47,076,841 Total Investments $ 276,081,491 $ — $ — $ 276,081,491
US Large Cap Fund* Level 1 Level 2 Level 3 Total
Common Stocks $ 197,662,956 $ — $ — $ 197,662,956 Short-Term Investments 14,195,522 — — 14,195,522 Total Investments $ 211,858,478 $ — $ — $ 211,858,478
* For further information regarding security characteristic, please see the Schedules of Investments.
The Funds did not hold any investments at the end of the reporting period for which significant unobservable inputs (Level 3) were used in determining fair value; therefore, no reconciliation of Level 3 securities is included for this reporting period.
Use of Estimates and IndemnificationsThe preparation of the financial statements in conformity with U.S. GAAP requires management to make estimates and assumptions that affect the reported amounts and disclosures in these financial statements. Actual results could differ from those estimates.
In the normal course of business, the Trust, on behalf of the Funds, enters into contracts that contain a variety of representations which provide general indemnifications. The Trust’s maximum exposure under these arrangements is unknown; however, the Trust has not had claims or losses pursuant to these contracts and the Trust expects any risk of loss to be remote.
Federal Income TaxesThe Funds intend to continue to qualify as “regulated investment companies” under Sub-chapter M of the Internal Revenue Code of 1986, as amended. If so qualified, the Funds will not be subject to federal income tax to the extent they distribute substantially all of their net investment income and net realized gains to shareholders.
The Funds have reviewed all open tax years and major jurisdictions and concluded that the Funds did not have any tax positions that did not meet the “more-likely-than-not” threshold of being sustained by the applicable tax authority for the six months ended December 31, 2020. The Funds would recognize interest and penalties, if any, related to uncertain tax benefits in the Statements of Operations. During the six months ended December 31, 2020, the Funds did not incur any interest or penalties. Tax returns filed within the prior three years remain subject to examination by federal and state tax authorities.
Distribution to ShareholdersThe Funds intend to continue to distribute to their shareholders any net investment income and any net realized long or short-term capital gains, if any, at least annually. Distributions are recorded on the ex-dividend date. The Funds may periodically make reclassifications among certain of their capital accounts as a result of the characterization of certain income and realized gains determined annually in accordance with federal tax regulations that may differ from U.S. GAAP.
EntrepreneurShares Series Trust
NOTES TO FINANCIAL STATEMENTS (Continued)December 31, 2020 (Unaudited)

27
Allocation of ExpensesExpenses incurred by the Trust that do not relate to a specific fund of the Trust are allocated to the individual funds by or under the direction of the Board in such a manner as the Board determine to be fair and equitable.
Foreign Currency TransactionsThe Funds’ books and records are maintained in U.S. dollars. Foreign currency denominated transactions (i.e., fair value of investment securities, assets and liabilities, purchases and sales of investment securities and income and expenses) are translated into U.S. dollars at the current rate of exchange on the date of valuation. Purchases and sales of securities and income items denominated in foreign currencies are translated into U.S. dollars at the exchange rate in effect on the transaction date. The Funds do not separately report the effect of changes in foreign exchange rates from changes in market prices on securities held. Such fluctuations are included in net realized and unrealized gain or (loss) on investments in the Statements of Operations.
Realized foreign exchange gains or losses arise from sales of foreign currencies, currency gains (losses) realized between the trade and settlement dates on securities transactions and the difference between the recorded amounts of dividends, interest, foreign taxes withheld, and the U.S. dollar equivalent of the amounts actually received or paid. Net unrealized foreign exchange gains (losses) arise from the changes in foreign exchange rates on foreign denominated assets and liabilities other than investments in securities held at the end of the reporting period.
Investment Transactions and Investment IncomeInvestment transactions are recorded on the trade date. Dividend income, less any foreign tax withheld, is recognized on the ex-dividend date and interest income is recognized on an accrual basis, including amortization/accretion of premiums or discounts. Net realized gains or losses are determined using the high cost identification method.
Securities LendingEach Fund may lend portfolio securities constituting up to 33-1/3% of its total assets (as permitted by the 1940 Act) to unaffiliated broker-dealers, banks or other recognized institutional borrowers of securities, provided that the borrower at all times maintains cash, U.S. government securities or equivalent collateral or provides an irrevocable letter of credit in favor of the Fund equal in value to at least 102% of the value of loaned domestic securities and 105% of the value of loaned foreign securities on a daily basis. During the time portfolio securities are on loan, the borrower pays the lending Fund an amount equivalent to any dividends or interest paid on such securities, and such Fund may receive an agreed-upon amount of interest income from the borrower who delivered equivalent collateral or provided a letter of credit. Loans are subject to termination at the option of a Fund or the borrower. A Fund may pay reasonable administrative and custodial fees in connection with a loan of portfolio securities and may pay a negotiated portion of the interest earned on the cash or equivalent collateral to the borrower or placing broker. A Fund does not have the right to vote securities on loan, but could terminate the loan and regain the right to vote if that were considered important with respect to the investment.
The primary risk in securities lending is a default by the borrower during a sharp rise in price of the borrowed security resulting in a deficiency in the collateral posted by the borrower. The Funds will seek to minimize this risk by requiring that the value of the securities loaned be computed each day and additional collateral be furnished each day if required.
EntrepreneurShares Series Trust
NOTES TO FINANCIAL STATEMENTS (Continued)December 31, 2020 (Unaudited)

28
At December 31, 2020, the value of securities loaned and cash collateral received were as follows:
Value of Securities Loaned
Cash Collateral Received
Global Fund $ 12,288,756 $ 12,972,409US Small Cap Fund $ 43,656,269 $ 46,960,121US Large Cap Fund $ 12,882,727 $ 14,195,522
Securities purchased via reinvestment of cash collateral received as part of the securities lending program consisted of institutional money market funds with overnight and continuous maturities.
It is each Fund’s policy to obtain additional collateral from or return excess collateral to the borrower by the end of the next business day following valuation date of securities loaned. Therefore, the value of the collateral held may be temporarily less than required under the lending contract. As of December 31, 2020 the collateral consisted of BlackRock Liquidity Funds FedFund Portfolio – Institutional Class, Fidelity Investments Money Market Government Portfolio – Class I, Invesco Short-Term Investments Trust Government & Agency Portfolio – Institutional Class and JPMorgan U.S. Government Money Market Fund – Capital Class.
Disclosures about Offsetting Assets and LiabilitiesThe Funds are required to disclose information about offsetting and related arrangements to enable users of its financial statements to understand the effect of those arrangements on its financial position. The guidance requires retrospective application for all comparative periods presented. Management has evaluated the impact on the financial statement disclosures and determined that there is no effect. As there are no master netting arrangements relating to the Funds’ participation in securities lending, and all amounts related to securities lending are presented gross on the Funds’ Statement of Assets and Liabilities, no additional disclosures have been made on behalf of the Funds. Please refer to the Securities Lending Note for additional disclosures related to securities lending, including collateral related to securities on loan.
3. AGREEMENTS
Global Fund’s Investment Advisory AgreementSeaport Global Advisors, LLC, a related party of the Global Fund, oversees the performance of the Global Fund and is responsible for overseeing the management of the investment portfolio of the Global Fund. These services are provided under the terms of an investment advisory agreement between the Trust and Global Advisors, pursuant to which Global Advisors receives an annual advisory fee equal to 1.25% of the Global Fund’s average net assets.
Through November 1, 2021, the Advisor has agreed to waive and/or reimburse the Global Fund for its advisory fee, and to the extent necessary, bear other expenses, to limit the total annualized expenses (excluding borrowing and investment-related costs and fees, taxes, extraordinary expenses and fees and expenses of underlying funds) of the Institutional Class shares of the Global Fund to the amounts of 1.70% per annum of net assets attributable to such shares of the Global Fund.
EntrepreneurShares Series Trust
NOTES TO FINANCIAL STATEMENTS (Continued)December 31, 2020 (Unaudited)

29
Global Advisors shall be permitted to recover expenses it has borne subsequent to the effective date of this agreement (whether through reduction of its advisory fee or otherwise) in later periods to the extent that the Global Fund’s expenses fall below the annual rates set forth above, given that such a rate is not greater than the rate that was in place at the time of the waiver, provided, however, that the Global Fund is not obligated to pay any such reimbursed fees more than three years after the expense was incurred by Global Advisors.
Sub-Advisory services are provided to the Global Fund, pursuant to an agreement between Global Advisors and EntrepreneurShares, LLC. Under the terms of this sub-advisory agreement, Seaport Global Advisors, LLC, not the Global Fund, compensates the Sub-Advisor based on the Global Fund’s average net assets. Certain officers of Seaport Global Advisors, LLC are also officers of the Sub-Advisor. Dr. Shulman is a majority owner of both Global Advisors and the Sub-Advisor.
US Small Cap Fund and US Large Cap Fund Investment Advisory AgreementCapital Impact Advisors, LLC, a related party of the US Small Cap Fund and the US Large Cap Fund, oversees the performance of the US Small Cap Fund and the US Large Cap Fund and is responsible for overseeing the management of the investment portfolio of the US Small Cap Fund and the US Large Cap Fund. These services are provided under the terms of investment advisory agreements between the Trust and the Advisor, pursuant to which the Advisor receives an annual advisory fee equal to 0.75% of the US Small Cap Fund’s average net assets and 0.65% of the US Large Cap Fund’s average net assets.
Through November 1, 2021 for the US Small Cap Fund and the US Large Cap Fund, the Advisor has agreed to waive and/or reimburse the US Small Cap Fund and the US Large Cap Fund for its advisory fee, and to the extent necessary, bear other expenses, to limit the total annualized expenses (excluding borrowing and investment-related costs and fees, taxes, extraordinary expenses and fees and expenses of underlying funds) of the Institutional Class shares of the US Small Cap Fund to the amounts of 0.85% per annum of net assets attributable to such shares of the US Small Cap Fund and 0.75% per annum of net assets attributable to shares of the US Large Cap Fund. The Advisor shall be permitted to recover expenses it has borne subsequent to the effective date of this agreement (whether through reduction of its advisory fee or otherwise) in later periods to the extent that the US Small Cap Fund or the US Large Cap Fund’s expenses fall below the annual rates set forth above, given that such a rate is not greater than the rate that was in place at the time of the waiver, provided, however, that the US Small Cap Fund and the US Large Cap Fund are not obligated to pay any such reimbursed fees more than three years after the expense was incurred by Advisor.
Waived fees subject to recovery by year of expiration are as follows:
Year of Expiration Potential Recovery
US Small Cap Fund
US Large Cap Fund
6/30/2021 $ 29,800 $ 37,2206/30/2022 58,897 56,9456/30/2023 75,687 75,120
12/31/2023 19,795 22,889Total $ 184,179 $ 192,174
EntrepreneurShares Series Trust
NOTES TO FINANCIAL STATEMENTS (Continued)December 31, 2020 (Unaudited)

30
4. INCOME TAXESThe Funds plan to distribute substantially all of the net investment income and net realized gains that they have realized on the sale of securities. These income and gains distributions will generally be paid once each year, on or before December 31. The character of distributions made during the year for financial reporting purposes may differ from the characterization for federal income tax purposes due to differences in the recognition of income, expense or gain items for financial reporting and tax reporting purposes.
The tax character of distributions paid during the year ended June 30, 2020 and the year ended June 30, 2019 was as follows:
Global Fund US Small Cap Fund US Large Cap Fund
2020 2019 2020 2019 2020 2019
Distributions paid from:Ordinary income* $ — $ 909,544 $ 93,892 $ 5,656,660 $ — $ 611,730Long-term capital gains 1,788,910 586,867 9,737,708 18,957,000 8,147,630 1,679,617
Total distributions paid $ 1,788,910 $ 1,496,411 $ 9,831,600 $ 24,613,660 $ 8,147,630 $ 2,291,347
* For federal income tax purposes, distribution of short-term capital gains are treated as ordinary income distributions.
The Funds designate long-term capital gain dividends, pursuant to Internal Revenue Code Section 852(b)(3), the amount necessary to reduce the earnings and profits for the Funds related to net capital gains to zero for the tax year ended June 30, 2020.
Additionally, U.S. GAAP requires that certain components of net assets be reclassified between financial and tax reporting. These reclassifications have no effect on net assets or net asset value per share.
As of December 31, 2020, the tax cost of securities and the breakdown of unrealized appreciation (depreciation) for each Fund were as follows:
Global FundUS Small Cap Fund
US Large Cap Fund
Gross unrealized appreciation $ 21,193,896 $ 78,905,385 $ 53,360,950Gross unrealized depreciation (2,188,800) (4,020,423) (5,504,611)Net unrealized appreciation (depreciation) on investments 19,005,096 74,884,962 47,856,339Tax cost of investments 49,503,894 154,236,408 149,806,617
The table above differs from the financial statements due to timing differences related to the deferral of losses primarily due to wash sales.
EntrepreneurShares Series Trust
NOTES TO FINANCIAL STATEMENTS (Continued)December 31, 2020 (Unaudited)

31
As of June 30, 2020, the components of accumulated earnings/(deficit) on a tax basis were as follows:
Global FundUS Small Cap Fund
US Large Cap Fund
Undistributed ordinary income $ — $ — $ —Undistributed long-term capital gains 388,596 18,060,134 30,144,283Accumulated capital and other losses (246,687) (155,619) (243,985)Unrealized appreciation on investments 12,326,190 15,790,584 29,032,062Total accumulated earnings $ 12,468,099 $ 33,695,099 $ 58,932,360
As of June 30, 2020, the Global, US Small Cap and US Large Cap Funds had qualified late-year losses of $246,687, $155,619 and $243,985, respectively, which are deferred until fiscal year 2021 for tax purposes. Net late-year ordinary losses incurred after December 31 and within the taxable year and net late-year specified losses incurred after October 31 and within the taxable year are deemed to arise on the first day of the Funds’ next taxable year.
5. RELATED PARTIESAt December 31, 2020, certain officers of the Trust were also employees of the Advisors. However, these officers were not compensated directly by the Funds. Refer to Note 1 for more information.
6. BENEFICIAL OWNERSHIPThe beneficial ownership, either directly or indirectly, of more than 25% of the voting securities of a fund creates a presumption of control of a fund, under Section 2(a)(9) of the 1940 Act. As of December 31, 2020, for the benefit of its shareholders, MAC & Co., an affiliate of Global Fund, held 81.98% of the total Global Fund shares outstanding. As of December 31, 2020, for the benefit of its shareholders, MAC & Co., an affiliate of the US Small Cap Fund, held 90.91% of the total US Small Cap Fund shares outstanding. As of December 31, 2020, for the benefit of its shareholders, MAC & Co., an affiliate of the US Large Cap Fund, held 91.91% of the total US Large Cap Fund shares outstanding.
7. INVESTMENT TRANSACTIONSDuring the six months ended December 31, 2020, the aggregate purchases and sales of securities (excluding in-kind transactions and short-term securities) were:
Global FundUS Small Cap Fund
US Large Cap Fund
Purchases: $ 43,234,387 $ 137,682,272 $ 128,667,860Sales: $ 43,274,743 $ 141,536,131 $ 122,556,008
The Funds did not have any purchases or sales of U.S. Government Securities.
8. REDEMPTION FEESEach Fund imposes a redemption fee equal to 2% of the dollar value of the shares redeemed within five business days of the date of purchase. The redemption fee does not apply to shares purchased through reinvested distributions (dividends and capital gains) or through the automatic investment plan, shares held in retirement plans (if the plans request a waiver of the fee), or shares redeemed through designated systematic withdrawal plans.
EntrepreneurShares Series Trust
NOTES TO FINANCIAL STATEMENTS (Continued)December 31, 2020 (Unaudited)

32
9. SECTOR RISKIf a Fund has significant investments in the securities of issuers within a particular sector, any development affecting that sector will have a greater impact on the value of the net assets of the Fund than would be the case if the Fund did not have significant investments in that sector. In addition, this may increase the risk of loss in the Fund and increase the volatility of the Fund’s NAV per share. For instance, economic or market factors, regulatory changes or other developments may negatively impact all companies in a particular sector, and therefore the value of the Fund’s portfolio will be adversely affected. As of December 31, 2020, the Global, US Small Cap and US Large Cap Funds had 39.94%, 50.67% and 37.78% of the value of their net assets invested in stocks within the Health Care sector, respectively. As of December 31, 2020, the US Large Cap Fund had 30.22% of the value of its net assets invested in stocks within the Technology sector.
10. MARKET AND GEOPOLITICAL RISKThe increasing interconnectivity between global economies and financial markets increases the likelihood that events or conditions in one region or financial market may adversely impact issuers in a different country, region or financial market. Securities in the Funds’ portfolio may underperform due to inflation (or expectations for inflation), interest rates, global demand for particular products or resources, natural disasters, pandemics, epidemics, terrorism, regulatory events and governmental or quasi-governmental actions. The occurrence of global events similar to those in recent years, such as terrorist attacks around the world, natural disasters, social and political discord or debt crises and downgrades, among others, may result in market volatility and may have long term effects on both the U.S. and global financial markets. It is difficult to predict when similar events affecting the U.S. or global financial markets may occur, the effects that such events may have and the duration of those effects. Any such event(s) could have a significant adverse impact on the value and risk profile of the Funds’ portfolio. The current novel coronavirus (COVID-19) global pandemic and the aggressive responses taken by many governments, including closing borders, restricting international and domestic travel, and the imposition of prolonged quarantines or similar restrictions, as well as the forced or voluntary closure of, or operational changes to, many retail and other businesses, has had negative impacts, and in many cases severe negative impacts, on markets worldwide. It is not known how long such impacts, or any future impacts of other significant events described above, will or would last, but there could be a prolonged period of global economic slowdown, which may impact your Fund investment. Therefore, the Funds could lose money over short periods due to short-term market movements and over longer periods during more prolonged market downturns. During a general market downturn, multiple asset classes may be negatively affected. Changes in market conditions and interest rates can have the same impact on all types of securities and instruments. In times of severe market disruptions you could lose your entire investment.
11. FOREIGN INVESTMENT RISKThe Global Fund generally invests a significant portion of its total assets in securities principally traded in markets outside the U.S. The foreign markets in which the Global Fund invests in are sometimes open on days when the New York Stock Exchange (“NYSE”) is not open and the Global Fund does not calculate its NAV, and sometimes are not open on days when the NYSE is open and the Global Fund does calculate its NAV. Even on days on which both the foreign market and the NYSE are open, several hours may pass between the time when trading in the foreign market closes and the time at which the Global Fund calculates its NAV. That is generally the case for markets in Europe, Asia, Australia and other far eastern markets; the regular closing time of foreign markets in North and South America is generally the same as the closing time of the NYSE and the time at which the Global Fund calculate its NAV.
EntrepreneurShares Series Trust
NOTES TO FINANCIAL STATEMENTS (Continued)December 31, 2020 (Unaudited)

33
EntrepreneurShares Series Trust
NOTES TO FINANCIAL STATEMENTS (Continued)December 31, 2020 (Unaudited)
Foreign stocks, as an asset class, may underperform U.S. stocks, and foreign stocks may be more volatile than U.S. stocks. Risks relating to investment in foreign securities (including, but not limited to, depository receipts and participation certificates) include: currency exchange rate fluctuation; less available public information about the issuers of securities; less stringent regulatory standards; lack of uniform accounting, auditing and financial reporting standards; and country risk including less liquidity, high inflation rates, unfavorable economic practices and political instability. The risks of foreign investments are typically greater in emerging and less developed markets.
12. CORONAVIRUS (COVID-19) PANDEMICIn early 2020, an outbreak of a novel strain of coronavirus (COVID-19) emerged globally. This coronavirus has resulted in closing international borders, enhanced health screenings, healthcare service preparation and delivery, quarantines, cancellations, disruptions to supply chains and customer activity, as well as general public concern and uncertainty.
The impact of this outbreak has negatively affected the worldwide economy, as well as the economies of individual countries, the financial health of individual companies and the market in general in significant and unforeseen ways. The future impact of COVID-19 is currently unknown, and it may exacerbate other risks that apply to the Funds, including political, social and economic risks. Any such impact could adversely affect the Funds’ performance, the performance of the securities in which the Funds invest and may lead to losses on your investment in the Funds. The ultimate impact of COVID-19 on the financial performance of the Funds’ investments is not reasonably estimable at this time.
13. LIQUIDITY RISK MANAGEMENT PROGRAM The Funds have adopted and implemented a written liquidity risk management program as required by Rule 22e-4 (the “Liquidity Rule”) under the Investment Company Act of 1940, as amended. The program is reasonably designed to assess and manage each Fund’s liquidity risk, taking into consideration, among other factors, each Fund’s investment strategies and the liquidity of its portfolio investments during normal and reasonably foreseeable stressed conditions; its short and long-term cash flow projections; and its cash holdings and access to other funding sources.
During the six months ended December 31, 2020, the Board and the Trust’s Liquidity Risk Management Program Administrator (the “LPA”) reviewed each Fund’s investments and determined that each Fund held adequate levels of cash and highly liquid investments to meet shareholder redemption activities in accordance with applicable requirements. Accordingly, the Board and LPA concluded that (i) the Funds’ liquidity risk management program is reasonably designed to prevent violations of the Liquidity Rule and (ii) the Funds’ liquidity risk management program has been effectively implemented.
14. SUBSEQUENT EVENTS EVALUATIONManagement has evaluated the Funds’ related events and transactions that occurred through the date of issuance of the Funds’ financial statements.
There were no other events or transactions that occurred during this period that materially impacted the amounts or disclosures in the Funds’ financial statements.

34
EntrepreneurShares Series Trust
EXPENSE EXAMPLEDecember 31, 2020 (Unaudited)
As a Fund shareholder, you may incur two types of costs: (1) transaction costs, including commissions on trading, as applicable; and (2) ongoing costs, including advisory fees and other Fund expenses. These examples are intended to help you understand your ongoing costs (in dollars) of investing in a Fund and to compare these costs with the ongoing costs of investing in other mutual funds.
The expense examples below are based on an investment of $1,000 invested on July 1, 2020 and held through the period ended December 31, 2020.
The Actual Expense figures in the table below provide information about actual account values and actual expenses. You may use this information, together with the amount you invested, to estimate the expenses that you paid over the period. Simply divide your account value by $1,000 (for example, an $8,600 account value divided by $1,000 = 8.6), then multiply the result by the number in the table under the heading entitled “Actual Expenses Paid” to estimate the expenses you paid on your account during this period.
The Hypothetical Expense figures in the table below provide information about hypothetical account values and hypothetical expenses based on each Fund’s actual expense ratio and an assumed rate of return of 5% per year before expenses, which is not each Fund’s actual return. The hypothetical account values and expenses may not be used to estimate the actual ending account balance or expenses you paid for the period. You may use this information to compare the ongoing costs of investing in your Fund and other funds. To do so, compare this 5% hypothetical example with the 5% hypothetical examples that appear in the shareholder reports of the other funds.
Please note that the expenses shown in the table are meant to highlight your ongoing costs only and do not reflect any transactional costs. Further, the expenses do not include any brokerage commissions on investors’ purchases or redemptions of fund shares as described in the Funds’ prospectus. Therefore, the examples are useful in comparing ongoing costs only and will not help you determine the relative total cost of owning different funds. In addition, if these transactional costs were included, your costs would have been higher.
Beginning Account
Value July 1, 2020
Ending Account Value December 31,
2020 Expenses Paid During Period
Annualized Expense Ratio(a)
ERShares Global Fund Actual $1,000.00 $1,358.40 $8.77 1.47%Hypothetical(b) $1,000.00 $1,017.70 $7.51 1.47%
ERShares US Small Cap Fund Actual $1,000.00 $1,468.60 $5.27 0.85%
Hypothetical(b) $1,000.00 $1,020.86 $4.32 0.85%ERShares US Large
Cap Fund Actual $1,000.00 $1,290.00 $4.32 0.75%Hypothetical(b) $1,000.00 $1,021.37 $3.81 0.75%
(a) Expenses are equal to the average account value over the period multiplied by the Fund’s annualized expense ratio, multiplied by 184/365 (to reflect the one-half year period).
(b) Represents the hypothetical 5% annual return before taxes.

35
EntrepreneurShares Series Trust
ADDITIONAL INFORMATIONDecember 31, 2020 (Unaudited)
FACTORS CONSIDERED BY THE TRUSTEES IN APPROVAL OF THE RENEWAL OF INVESTMENT ADVISORY AGREEMENTS On September 23, 2020, all of the Trustees of EntrepreneurShares Series Trust (the “Trust”) met to discuss, among other things, the continuation of the investment advisory and sub-advisory agreements, if applicable, for the ERShares Global Fund (the “Global Fund”), the ERShares US Small Cap Fund (the “Small Cap Fund”), and the ERShares US Large Cap Fund (the “Large Cap Fund”) (collectively referred to as the “Funds”). In preparation for the meeting they reviewed materials addressing the review and consideration of the investment advisory agreements (the “Agreements”), which included a Gartenberg Memo to the Board of Trustees (the “Board”) from legal counsel, 15(c) analyses for the Funds, and the returns of each Fund and the Funds’ benchmark indices provided in the quarterly Board materials.
Seaport Global Advisors, LLC (“Seaport”) (formerly known as Weston Capital Advisors, LLC) is the Global Fund’s investment adviser, and EntrepreneurShares, LLC (“EntrepreneurShares”) is the Global Fund’s investment sub-adviser. Capital Impact Advisors, LLC (“Capital Impact Advisors”) is the investment adviser to the Small Cap Fund and the Large Cap Fund. Seaport, EntrepreneurShares, and Capital Impact Advisors are referred to herein as the “Advisers,” and the investment advisory agreements for the Global Fund, the Small Cap Fund, and the Large Cap Fund, along with the sub-advisory agreement for the Global Fund, are referred to herein as the “Advisory Agreements.” The Advisers are responsible for management of the investment portfolio of the Funds, and for overall management of the Funds’ business and affairs pursuant to the Advisory Agreements.
At the meeting, the Trustees had ample opportunity to consider matters they deemed relevant in considering the approval of the Advisory Agreements, and to request any additional information they considered reasonably necessary to their deliberations, without undue time constraints. In addition to the materials requested by the Trustees in connection with their consideration of the continuation of the Advisory Agreements, the Trustees received materials in advance of each regular quarterly meeting of the Board of Trustees that provided information relating to the services provided by the Advisers.
The Board then reviewed and discussed the written materials that were provided in advance of the Meeting and deliberated on the renewal of the Advisory Agreements. The Board relied upon the advice of independent legal counsel and their own business judgment in determining the material factors to be considered in evaluating the Advisory Agreements and the weight to be given to each such factor. The conclusions reached by the Board were based on a comprehensive evaluation of all of the information provided and were not the result of any one factor. Moreover, each Trustee may have afforded different weight to the various factors in reaching his conclusions with respect to the Advisory Agreements. In considering the renewal of the Advisory Agreements, the Board reviewed and analyzed various factors that they determined were relevant, including the factors enumerated below.
Nature and Quality of Investment Advisory ServicesThe Trustees concluded that the nature, extent and quality of the investment advisory services provided to the Funds by the Advisers are satisfactory, and that the nature and extent of the services provided by the Advisers are appropriate to assure that the Funds’ operations are conducted in compliance with applicable laws, rules and regulations. The Trustees considered the experience and knowledge of the Advisers’ personnel as well as information furnished by the Advisers throughout the year at regular Board meetings, which included reports on investment performance, shareholder services, regulatory compliance, and other services provided to the Funds. The Trustees concluded that they have a reasonable belief that the nature, extent and quality of services provided by the Advisers to the Funds are appropriate.

36
Comparative Fees and ExpensesThe Trustees concluded that the advisory fees and net expense ratios of the Funds were not unreasonable, and they believe that the following factors, among others, support these conclusions: (1) the long-term returns of the Funds are generally positive when compared to peers; and (2) the Funds are still relatively small in assets under management when compared to their peer groups, and the Advisers are subsidizing the expenses of the Funds to ensure the Funds remain competitive with other funds.
Comparison of Fee Structures of Other AccountsThe Trustees concluded that the differential in advisory fees between the Funds and the separate accounts managed by the Advisers are reasonable and concluded that the fee rates charged to the Funds in comparison to those charged to the Advisers’ other clients are not unreasonable.
PerformanceThe Trustees concluded that the performance of the Funds has generally been good on a relative basis and on an absolute basis, with periods of underperformance. They concluded that renewal of the Advisory Agreements was in the best interest of the Funds’ shareholders. They believe that the following factors, among others, support these conclusions: (1) the Advisers manage the Funds in a manner that is materially consistent with their stated investment objective and style; and (2) the long-term returns of the Funds are generally positive in comparison to the peer group.
Costs and ProfitabilityThe Trustees recognized that it is difficult to make comparisons of profitability from investment advisory contracts. The Trustees recognized that the Advisers are subsidizing the expenses of the Funds to ensure the Funds remain competitive with other funds. The Trustees concluded that the level of profitability realized by the Advisers from their provision of services to the Funds is reasonable, and, as noted above, that the overall expense ratios and investment advisory fees are fair and reasonable.
Economies of ScaleThe Trustees concluded that the current fees were appropriate at foreseeable asset levels without the need for breakpoints. They believe that the following factors, among others, support these conclusions: (1) based on the materials reviewed at the meeting and the size of the Funds, the Funds have not realized economies of scale; and (2) many of the Funds’ expenses increase as the Funds’ assets grow, such as the intermediary service fees and the costs of conducting research to explore additional investments.
ConclusionAfter reviewing the material provided for the meeting, management’s presentation, as well as other information regularly provided at the Board’s quarterly meetings throughout the year regarding the quality of services provided by the Advisers, the performance of the Funds, expense information, regulatory compliance issues, trading information and related matters and other factors deemed relevant by the Board, the Trustees, including all of the Independent Trustees, concluded that the Advisory Agreements are fair and reasonable and that the continuation of the Advisory Agreements is in the best interest of the Funds and their shareholders. Accordingly, the Trustees approved the continuation of the Advisory Agreements.
EntrepreneurShares Series Trust
ADDITIONAL INFORMATION (Continued)December 31, 2020 (Unaudited)

37
Availability of Quarterly Portfolio Holdings Schedule The Funds file complete schedules of portfolio holdings with the SEC for the first and third quarters of each fiscal year on Form N-PORT. These filings are available on the SEC’s website www.sec.gov. In addition, the Funds’ Form N-PORT is available without charge, upon request, by calling 1-877-271-8811.
Proxy Voting Policies and Procedures and Proxy Voting RecordA description of the Funds’ proxy voting policies and procedures and information regarding how the Funds voted proxies relating to portfolio securities during the most recent 12 month period ended June 30, is available (1) without charge, upon request, by calling 1-877-271-8811, and (2) on the SEC’s website at www.sec.gov.
EntrepreneurShares Series Trust
ADDITIONAL INFORMATION (Continued)December 31, 2020 (Unaudited)

38
EntrepreneurShares Series Trust
PRIVACY POLICY(Unaudited)
As part of the EntrepreneurShares fund family’s long tradition of trust, the confidentiality of personal information is paramount. We maintain high standards to safeguard your personal information. We will remain vigilant and professional in protecting that information and in using it in a fair and lawful manner. As part of this commitment to fulfilling your trust we have formulated this Privacy Policy.
Safeguarding Customer Information and DocumentsTo conduct regular business, we may collect nonpublic personal information from sources such as:
• Account Applications and other forms, which may include a customer’s name, address, social security number, and information about a customer’s investment goals and risk tolerances;
• Account History, including information about the transactions and balances in a customer’s account; and• Correspondence, written, telephonic, or electronic between a customer and Seaport Global Advisors, LLC;
Capital Impact Advisors, LLC; EntrepreneurShares, LLC, and/or any EntrepreneurShares Mutual Fund or Exchange-Traded Fund product; such as, ERShares Global Fund, ERShares US Large Cap Fund, ERShares US Small Cap, ERShares Entrepreneurs ETF, ERShares NextGen Entrepreneurs ETF, or service providers to Seaport Global Advisors, Capital Impact, EntrepreneurShares, and/or EntrepreneurShares’ Funds.
To conduct regular business, we collect non-public customer data in checklists, forms, in written notations, and in documentation provided to us by our customers for evaluation, registration, licensing or related consulting services. We also create internal lists of such data.
EntrepreneurShares will internally safeguard your nonpublic personal information by restricting access to only those employees who provide products or services to you or those who need access to your information to service your account. In addition, we will maintain physical, electronic and procedural safeguards that meet federal and/or state standards to guard your nonpublic personal information. Failure to observe EntrepreneurShares’ procedures regarding customer and consumer privacy will result in discipline and may lead to termination.
Sharing Nonpublic Personal and Financial InformationAs EntrepreneurShares shares nonpublic information solely to service our client accounts, we do not disclose any nonpublic personal information about our customers or former customers to anyone, except as permitted by law or otherwise disclosed herein.
EntrepreneurShares is committed to the privacy and protection of our customers’ personal and financial information. We will not share any such information with any affiliated or nonaffiliated third party except:
• When necessary to complete transactions in a customer account, such as clearing firm.• When required to service and/or maintain your account.• In order to resolve a customer dispute or inquiry.• With persons acting in a fiduciary or representative capacity on behalf of the customer.• With rating agencies, persons assessing compliance with industry standards, or to the attorneys, accountants
and auditors of the firm.• In connection with any sale and / or merger of EntrepreneurShares’ business.• To prevent or protect against actual or potential fraud, identity theft, unauthorized transactions, claims or other
liability.• To comply with all federal, state or local laws, rules, statutes and other applicable legal requirements.

39
EntrepreneurShares Series Trust
PRIVACY POLICY (Continued)(Unaudited)
• In connection with a written agreement to provide advisory services or investment management when the information is released solely for the purpose of providing products or services covered by pursuant to the EntrepreneurShares’ Wrap Fee Program.
• Upon the customer’s specific instruction, consent or request.Note: When we share your nonpublic information with any third party for the reasons listed above, we make certain that there are written restrictions in place regarding the use and/or disclosure of said information.
Opt-Out ProvisionsIt is not a policy of EntrepreneurShares to share nonpublic personal and financial information with affiliated or unaffiliated third parties except under the circumstances noted above. Since sharing under the circumstances noted above is necessary to service customer accounts or is mandated by law, there are no allowances made for clients to opt out.

This page intentionally left blank.

This page intentionally left blank.

ERShares Global Fund Investment AdvisorSeaport Global Advisors, LLC175 Federal Street, Suite #875
Boston, MA 02110
ERShares Global Fund Investment Sub-AdvisorEntrepreneurShares, LLC
175 Federal Street, Suite #875 Boston, MA 02110
ERShares US Small Cap Fund and ERShares US Large Cap Fund Investment AdvisorCapital Impact Advisors, LLC175 Federal Street, Suite #875
Boston, MA 02110
Independent Registered Public Accounting FirmBBD, LLP
1835 Market Street, 3rd Floor Philadelphia, PA 19103
CustodianUMB Bank, N.A.
928 Grand Boulevard, 5th Floor Kansas City, MO 64106
DistributorForeside Fund Services, LLCThree Canal Plaza, Suite 100
Portland, ME 04101
Administrator, Accountant, Transfer Agent and Dividend Disbursing AgentUltimus Fund Solutions, LLC
225 Pictoria Drive, Cincinnati, OH 45246
CounselThompson Hine LLP
41 South High Street, Suite 1700 Columbus, OH 43215
This report is intended only for the information of shareholders or those who have received the applicable Fund’s prospectus which contains information about that Fund’s management
fee and expenses. Please read the prospectus carefully before investing.