semi-annual report december 31, 2004 (unaudited) … report december 31, 2004 (unaudited) fund ... -...
TRANSCRIPT

Semi-Annual Report
December 31, 2004 (Unaudited)
Fund Advisor: Auxier Asset Management, LLC
5000 S.W. Meadows Rd. Suite 410
Lake Oswego, Oregon 97035
Toll Free: (877)-3Auxier or (877) 328-9437

1
AUXIER FOCUS FUND A MESSAGE TO OUR SHAREHOLDERS DECEMBER 31, 2004 Market Commentary We are pleased to provide you with the Fund's semi-annual report for the period ended December 31, 2004. The Auxier Focus Fund returned 7.59% for the six-month period ended December 31, 2004 and 10.73% for the full year 2004. This compares with respective returns of 7.18% and 10.88% for the S&P 500 Index. The Fund is categorized as “Moderate Allocation” by Morningstar because the common stock exposure has been less than 70% of total assets. The stock portion of the Fund returned over 16% for the year. For a longer term perspective, the Fund’s 5-year and since inception (7/9/99) average annual returns for the period ended December 31, 2004 were 8.93% and 8.69%, respectively. (Performance data quoted represents past performance and is no guarantee of future results. Current performance may be lower or higher than the performance data quoted. Investment return and principal value will fluctuate so that an investor’s shares, when redeemed, may be worth more or less than original cost. For the most recent month-end performance, please call (877) 328-9437 or visit the Fund’s website at www.auxierasset.com. The Fund charges a 2.00% redemption fee on shares purchased after October 11, 2004 and redeemed within six months of purchase.) The investment outlook for 2005 is a mixed bag. Strong corporate balance sheets, a favorable tax environment and improved governance, are offset by the specter of creeping inflation, rising interest rates and a fatigued consumer. Encouraging Developments
- Corporate balance sheets are improving. The debt to capitalization ratio of the S&P 500, excluding financial stocks, has fallen to 33% from 47% 15 years ago. Companies have over $2 trillion in cash which is about 20% of total market capitalization.
- Tax rates on dividends and capital gains are providing important savings incentives. Tax receipts have been proven to increase with lower rates. In addition, corporations should increasingly forsake retained earnings and making acquisitions with such an attractive dividend tax rate available. Most acquisitions destroy shareholder value. Hopefully more cash flows will now find their way back to the owners. Historically, 41% of the returns from stocks in the S&P 500 have come from dividends.
- Corporate governance is attracting greater scrutiny. Stock options will be expensed by mid-2005. Greater disclosure and accurate reporting should help restore investor confidence.
- The prospects for tort reform look more promising given a Republican President and GOP gains in the house and senate. Many class action suits of at least $5 million will shift from state courts to federal courts, which have traditionally been more business friendly. We own a number of companies that would potentially benefit enormously as the market tends to become overly pessimistic in valuing litigation risk.
- Health Savings Accounts (HSAs) are on the rise. HSAs are a strong first step in providing incentives for individuals to evaluate their health care costs while being rewarded for their savings efforts.
Areas of Increasing Risk - High levels of bullish sentiment are often a reliable contrarian indicator for market corrections. At year-end,
Investors Intelligence’ gauge of bullish sentiment exceeded 62%.
- Initial public offerings (new supply) totaled over $45 billion with 238 companies coming to market in 2004. We focus carefully on supply and demand in all markets.
- Inflation is ticking up. The Consumer Price Index (CPI) rose 3.3% for 2004. With the Federal Reserve’s “fed funds” rate at 2.25%, compared to an inflation rate of 3.3%, as measured by the CPI, we believe higher rates are imminent. The normal spread between inflation and fed funds is approximately 2%.
- According to Fitch Ratings, inflation of raw materials should add an additional $6,800-7,500 to the cost of a typical new home. Higher raw materials prices can squeeze profit margins, and higher inflation can lead to compression in price to earnings multiples.
- The full stimulative effects of a weak dollar typically take 18-22 months to be felt. This is a boon for multinationals but often has an adverse impact on interest rate levels. In the 1985-87 period, investors

2
AUXIER FOCUS FUND A MESSAGE TO OUR SHAREHOLDERS DECEMBER 31, 2004
underestimated the powerful stimulative effect of a weak dollar. The market was up 42% in 1987 before sharply higher interest rates spoiled the party. The S&P 500 finished the year up a scant 2%.
- Consumer borrowing has risen more than 50% over the past four years to $7 trillion. One third of recent borrowings are based on adjustable rates. The average household carries $14,000 in credit-card debt. We are long overdue for a consumer recession.
- If the dollar continues to decline, the Federal Reserve may be forced to raise rates much more aggressively, leaving those tethered to variable rate borrowing vulnerable. In 1994, the Fed had to move from ¼% increases to ¾% increases to support a declining currency. Such aggressive tightening measures can lead to great bargain hunting.
The macroeconomic backdrop for 2005 is more uncertain than it has been in some time. Nonetheless, it is important to seize opportunities created by a mixed macro outlook. In such an environment, careful investment selection and disciplined buying will be crucial. An added emphasis on management talent and capital allocation skills is warranted. Also, businesses that have low mandatory capital spending with substantial discretionary cash flow will have greater advantages. As always, we have a healthy respect for risk and the ability to wait for attractive valuations. Our first question when we invest is how much can we lose. Therefore, we try to quantify the risk factor to insure we are getting adequately paid for the risk taken, especially as a steward dealing with other peoples’ money. Opportunities in Health Care We are finding pockets of opportunity in the health care sector, which has been under duress due to an uncertain regulatory environment. While regulatory reforms have grabbed the headlines, we believe investors are giving short shrift to appealing long-term demographics. For example, according to recent government statistics, 65% of Americans are overweight. By 2010, one out of eight Americans will be in the 55-64 age bracket. By 2015, the number of seniors over 65 is projected to increase from approximately 35 million to over 45 million. We are simply getting older and fatter. We have found attractively priced companies such as health care insurers Wellpoint, Inc. and First Health Group Corp., cardiovascular device makers Guidant Corp. and Boston Scientific, hospital chains HCA, Inc. and Health Management Associates, Inc., plus pharmacies CVS Corp. and Priority Healthcare Corp. In addition, we note that scale is becoming more important in health care and has helped drive a wave of consolidation. We benefited directly in the fourth quarter from takeovers. Guidant Corp. was acquired by Johnson & Johnson and First Health Group Corp. by Coventry. Last, the major pharmaceutical stocks are trading at close to 30-year lows versus the market. They have been suffering from poor fundamentals and look attractive on a price basis. However, we are waiting for an improvement in operating conditions before getting more proactive in the shares. Global Distribution on Sale We are always on the lookout for high quality businesses at beaten down price levels. Some recent examples include: American International Group, Inc. fell 20% in October in the wake of New York Attorney General Elliot Spitzer’s investigation of the insurance industry. Similarly, scandals rocked Citigroup, Inc., which dipped to an attractive 10 times estimated 2005 earnings. Coca Cola Co. recently dropped to price levels 50% lower than 1998 levels due to poor managerial execution. All three companies possess world-class distribution systems that would cost a multiple of current market valuations to build from scratch. In addition, all three have the scale necessary for capturing growth in faster growing emerging markets. We believe the challenges faced by these companies are short-term in nature and mask the true underlying value of their franchises. They also provide a hedge against a declining dollar given their large international exposure. We appreciate your trust and support. Jeff Auxier

3
AUXIER FOCUS FUND A MESSAGE TO OUR SHAREHOLDERS DECEMBER 31, 2004 Before investing you should carefully consider the Fund’s investment objectives, risks, charges and expenses. This and other information is in the prospectus, a copy of which may be obtained by calling (877) 328-9437 or visiting the Fund’s website at www.auxierasset.com. Please read the prospectus carefully before you invest. Fund returns (i) assume the reinvestment of all dividends and capital gain distributions and (ii) would have been lower during the period if certain fees and expenses had not been waived. Performance shown is for the Fund’s Investor Class shares; returns for other share classes will vary. Performance for Investor Class shares for periods prior to December 10, 2004 reflects performance of the applicable share class of Auxier Focus Fund, a series of Unified Series Trust (the “Predecessor Fund”). Prior to January 3, 2003, the Predecessor Fund was a series of Ameriprime Funds. The performance of the Fund’s Investor Class shares for the period prior to December 10, 2004 reflects the expenses of the Predecessor Fund. As a non-diversified fund, the Fund will be subject to substantially more investment risk and potential for volatility than a diversified fund because its portfolio may at times focus on a limited number of companies. The S&P 500 Index is a broad-based, unmanaged measurement of changes in stock market conditions based on the average of 500 widely held common stocks. One cannot invest directly in an index. The views in this letter were those of the Fund Manager as of December 31, 2004 and may not reflect his views on the date this letter is first published or anytime thereafter. These views are intended to assist shareholders of the Fund in understanding their investments in the Fund and do not constitute investment advice. Forum Fund Services, LLC, Distributor. Effective March 1, 2005, Forum Fund Services, LLC will change its name to Foreside Fund Services, LLC.

AUXIER FOCUS FUNDSCHEDULE OF INVESTMENTSDECEMBER 31, 2004
Shares Security Description Value
Common Stock - 72.7%Basic Materials - 1.1%
11,000 Longview Fibre Co. 199,540$ 18,000 Plum Creek Timber Co., Inc. 691,920
891,460
Consumer Discretionary - 13.5%11,900 Catalina Marketing Corp. 352,597
4,900 CBRL Group, Inc. 205,065 8,000 Comcast Corp. † 266,240 4,000 Costco Wholesale Corp. 193,640
19,800 CVS Corp. 892,386 9,075 D.R. Horton, Inc. 365,813
34,150 Family Dollar Stores, Inc. 1,066,504 16,550 Gap, Inc. 349,536
2,000 Home Depot, Inc. 85,480 27,500 Interpublic Group of Cos., Inc. † 368,500 13,100 ITT Educational Services, Inc. † 622,905
8,000 Leapfrog Enterprises, Inc. † 108,800 45,947 Liberty Media Corp. Class A † 504,498
2,774 Liberty Media International, Inc. Class A † 128,242 3,700 Lowe's Cos., Inc. 213,083
48,600 Maximus, Inc. † 1,512,432 8,000 McDonald's Corp. 256,480 3,350 Nu Skin Enterprises, Inc. Class A 85,023 3,000 Office Depot, Inc. † 52,080 4,000 Southwest Airlines Co. 65,120
16,800 Tiffany & Co. 537,096 33,600 Time Warner, Inc. † 653,184
9,550 TJX Cos., Inc. 239,991 4,550 Tribune Co. 191,737 7,100 Wal-Mart Stores, Inc. 375,022 6,950 Weight Watchers International, Inc. † 285,437
11,000 Yum! Brands, Inc. 518,980 2,800 Zale Corp. † 83,636
10,579,507
Consumer Staples - 8.8%18,900 Altria Group, Inc, 1,154,790 43,000 Coca-Cola Co. 1,790,090 14,000 Diageo plc. ADR 810,320
225,500 DIMON, Inc. 1,515,360 4,000 Helen of Troy Ltd. † 134,440 9,000 Kraft Foods, Inc. 320,490 7,500 Kroger Co. † 131,550
20,600 National Beverage Corp. 171,392 2,000 Nestle SA ADR 130,815
27,600 Safeway, Inc. † 544,824 3,000 Standard Commercial Corp. 58,380 2,500 UST, Inc. 120,275
6,882,726
See Notes to Financial Statements. 4

AUXIER FOCUS FUNDSCHEDULE OF INVESTMENTSDECEMBER 31, 2004
Shares Security Description Value
Energy - 1.5%8,000 ChevronTexaco Corp. 420,080$
15,000 El Paso Corp. 156,000 200 LUKOIL ADR 24,280 500 PetroChina Company Ltd. ADR 26,845
2,950 Petroleo Brasileiro ADR 117,351 600 Sibneft ADR † 18,000 550 Surgutneftegaz ADR 20,625
17,000 Willbros Group, Inc. † 391,850 1,175,031
Financials - 21.6%6,400 American Express Co. 360,768
25,250 American International Group, Inc. 1,658,168 16,550 AON Corp. 394,883 35,600 Assurant Inc. 1,087,580 20,208 Bank of America Corp. 949,574
2,000 Bank of New York, Inc. 66,840 192 Berkshire Hathaway, Inc. Class B † 563,712
2,500 Cascade Financial Corp. 47,000 44,993 Citigroup, Inc. 2,167,763
8,000 Equifax, Inc. 224,800 14,900 Federal Home Loan Mortgage Corp. (Freddie Mac) 1,098,130
8,000 FirstService Corp. † 130,960 6,008 Gladstone Commercial Corp. 102,737
24,750 H&R Block, Inc. 1,212,750 5,544 JPMorgan Chase & Co. 216,271
15,150 Marsh & McLennan Cos., Inc. † 498,435 15,900 MBNA Corp. 448,221
7,950 Montpelier RE Holdings Ltd. 305,678 5,000 Morgan Stanley 277,600
10,000 Old Republic International Corp. 253,000 7,000 PMI Group, Inc. 292,250 4,000 SAFECO Corp. 208,960
33,577 St. Paul Travelers Cos., Inc. 1,244,699 2,600 Student Loan Corp. 478,400
65,300 Unumprovident Corp. 1,171,482 2,860 Washington Federal, Inc. 75,904
34,350 Washington Mutual, Inc. 1,452,318 16,988,883
Health Care - 14.8%8,750 Amgen, Inc. † 561,313
10,000 Apria Healthcare Group, Inc. † 329,500 13,500 Baxter International, Inc. 466,290
4,700 Cardinal Health, Inc. 273,305 50,212 Chronimed, Inc. † 327,884 17,050 Express Scripts, Inc. † 1,303,302 48,389 First Health Group Corp. † 905,358
5,800 Guidant Corp. 418,180 10,000 HCA, Inc. 399,600 68,700 Health Management Associates, Inc. 1,560,864
7,150 Medco Health Solutions, Inc. † 297,440 3,650 Merck & Co., Inc. 117,311
23,500 Pfizer, Inc. 631,915 73,757 Priority Healthcare Corp. Class B † 1,605,690
4,739 SeraCare Life Sciences, Inc. † 69,900 8,000 WellPoint, Inc. † 920,000
33,300 Wyeth 1,418,247 11,606,099
See Notes to Financial Statements. 5

AUXIER FOCUS FUNDSCHEDULE OF INVESTMENTSDECEMBER 31, 2004
Shares Security Description Value
Industrials - 0.9%3,000 Boeing Corp. 155,310$
11,500 Tyco International Ltd. 411,010 4,400 Waste Management, Inc. 131,736
698,056
Information Technology - 7.2%11,000 Automatic Data Processing, Inc. 487,850 36,700 BISYS Group, Inc. † 603,715 10,000 Ceridian Corp. † 182,800 59,550 Cypress Semiconductor Corp. † 698,522 53,400 eFunds Corp. † 1,282,134 20,000 Electronic Data Systems Corp. 462,000 30,500 Fair Isaac Corp. 1,118,740 10,220 First Data Corp. 434,759
549 Freescale Semiconductor, Inc. Class B † 10,080 5,000 Microsoft Corp. 133,550 7,700 SunGard Data Systems, Inc. † 218,141
5,632,291
Telecommunications - 2.5%4,975 Motorola, Inc. 85,570
35,650 SK Telecom Co, Ltd. ADR 793,212 27,650 Telefonos De Mexico SA ADR 1,059,548
1,938,330
Utilities - 0.8%24,000 Duke Energy Corp. 607,920
2,000 IDACORP, Inc. 61,140 669,060
Total Common Stock (Cost $47,518,375) 57,061,443
Rate
Preferred Stock - 4.5%Consumer Discretionary - 1.1%
18,375 Interpublic Group of Cos., Inc. 5.38 % 907,266
Energy - 0.1%2,000 El Paso Corp. 9.00 63,750
Financials - 2.1%19,300 St. Paul Travelers Cos., Inc. 9.00 1,292,714
9,800 Unumprovident Corp. 8.25 354,025 1,646,739
Utilities - 1.2%305 AEP Texas Central Co. 4.00 21,712 200 Boston Edison Co. 4.25 16,531 400 Cincinnati Gas & Electric Co. 4.00 30,400 300 Cincinnati Gas & Electric Co. 4.75 28,031
1,500 Connecticut Light & Power Co. 1.90 51,750 1,000 Connecticut Light & Power Co. 2.00 36,313 1,500 Connecticut Light & Power Co. 3.90 52,875 1,500 Dayton Power & Light Co. 3.90 110,109
400 Exelon Corp. 3.80 29,410 1,300 Great Plains Energy, Inc. 4.50 105,625 4,000 Hawaiian Electric Co. 4.25 61,250
300 Indianapolis Power & Light Co. 4.00 20,400 78 MidAmerican Energy Co. 3.30 4,899
See Notes to Financial Statements. 6

AUXIER FOCUS FUNDSCHEDULE OF INVESTMENTSDECEMBER 31, 2004
Shares Security Description Rate Maturity Value
80 MidAmerican Energy Co. 3.90 % 5,935$ 100 Monongahela Power Co. 4.40 7,398
1,300 Northern Indiana Public Services Co. 4.25 102,018 1,000 Pacific Enterprises Inc. - Sempra Energy 4.50 86,000
945 Public Service Electric & Gas Co. 4.08 74,891 8,800 TXU Europe Capital I 9.75 52,800
600 TXU US Holdings Co. 5.08 53,250 300 Westar Energy Inc. 4.25 22,069
973,666
Total Preferred Stock (Cost $3,416,923) 3,591,421
Exchange Traded Funds - 0.2%10,000 iShares MSCI Germany Index Fund (Cost $94,200) 186,300
Face Amount
Asset Backed Obligations - 1.1%51,794 Scotia Pacific Co., LLC 6.55 01/20/07 52,862
905,000 Scotia Pacific Co., LLC 7.11 01/20/14 787,916 Total Asset Backed Obligations (Cost $880,964) 840,778
Corporate Bonds - 6.0%Consumer Discretionary - 0.3%
95,000 AOL Time Warner, Inc. 5.63 05/01/05 95,883 50,000 Fruit of the Loom ∇ 7.38 11/15/23 -
135,000 General Motors Corp. 7.13 07/15/13 138,369 234,252
Energy - 0.8%220,000 Coastal Corp. 7.50 08/15/06 233,750 190,000 Coastal Corp. 6.70 02/15/07 195,600 115,000 Coastal Corp. 6.50 06/01/08 117,012
50,000 Newpark Resources, Inc. 8.63 12/15/07 50,875 597,237
Financials - 0.6%263,530 Finova Capital Corp. 7.50 11/15/09 129,130 100,000 GMAC 5.75 10/15/06 100,754 200,000 GMAC 6.88 09/15/11 205,232
435,116
Health Care - 1.4%705,000 Cardinal Health, Inc. 4.45 06/30/05 708,273 445,000 Tenet Healthcare Corp. 6.38 12/01/11 414,962
1,123,235
Industrials - 1.1%87,374 Grupo TMM SA 10.50 08/01/07 88,248 51,000 Waste Management, Inc. 7.00 05/15/05 51,536 94,000 Waste Management, Inc. 7.38 08/01/10 107,873
571,000 Waste Management, Inc. 7.65 03/15/11 653,500 901,157
Information Technology - 0.1%100,000 Danka Business Systems 10.00 04/01/08 96,500
See Notes to Financial Statements. 7

AUXIER FOCUS FUNDSCHEDULE OF INVESTMENTSDECEMBER 31, 2004
Shares Security Description Rate Maturity Value
Utilities - 1.7%445,000 Dominion Resources, Inc. 2.80 % 02/15/05 445,254$ 255,000 Indianapolis Power & Light Co. 8.00 10/15/06 270,790
65,000 Indianapolis Power & Light Co. 7.38 08/01/07 69,382 50,000 Monongahela Power 5.00 10/01/06 51,153
275,000 Sierra Pacific Power Co. 8.00 06/01/08 302,500 50,000 Southern California Edison 6.38 01/15/06 51,582
200,000 Southern Energy, Inc. - Mirant Corp. ∇ φ 7.90 07/15/09 150,000 1,340,661
Total Corporate Bonds (Cost $4,496,805) 4,728,158
Municipal Bonds - 1.6%1,500,000 Ontario Hydro Residual Strip † ± 5.42 10/01/20 538,956
706,000 Ontario Hydro Residual Strip † ± 5.48 11/27/20 249,544 1,095,000 Ontario Hydro Residual Strip † ± 5.57 10/15/21 363,279
235,000 Ontario Hydro Residual Strip † ± 5.56 08/18/22 74,629
Total Municipal Bonds (Cost $965,514) 1,226,408
Shares
Short-Term Investments - 14.5%Money Market Funds - 9.7%
3,906,790 CitiSM Institutional U.S. Treasury Reserves 3,906,790 3,727,173 CitiSM Institutional Cash Reserves Class O 3,727,173
Total Money Market Funds (Cost $7,633,963) 7,633,963
Principal
Money Market Deposit Account - 4.8%3,759,831 Citibank Money Market Deposit Account (Cost $3,759,831) 3,759,831
Total Investments in Securities - 100.6% (Cost $68,766,575)* 79,028,302$ Other Assets & Liabilities, Net - (0.6%) (509,962) NET ASSETS - 100.0% 78,518,340$
See Notes to Financial Statements. 8

AUXIER FOCUS FUNDSCHEDULE OF INVESTMENTSDECEMBER 31, 2004
PORTFOLIO HOLDINGS% of Total InvestmentsFinancials 24.1%Health Care 16.1%Consumer Discretionary 14.8%Consumer Staples 8.7%Information Technology 7.2%Utilities 3.8%Telecommunications 2.5%Energy 2.3%Basic Materials 2.0%Industrials 1.1%Money Market Funds 9.7%Money Market Deposit Account 4.8%Municipal Bonds 1.6%Asset Backed Obligations 1.1%Exchange Traded Funds 0.2%
100.0%
ADR American Depositary Receipt.† Non-income producing security.∇ Securities are currently in default on scheduled interest or principal payments.φ This security may be resold to ‘‘qualified institutional buyers’’ under Rule 144A or pursuant to Section 4 (2) of the Securities Act of 1933, as amended. As of December 31, 2004, the value of the security totaled $150,000, which represents 0.2% of net assets. Following is additional information on the security:
Security Acquisition Cost Acquisition Date Southern Energy, Inc. - Mirant Corp. $129,000 5/7/03
± Zero coupon bond. Interest rate presented is yield to maturity.*Cost for Federal income tax purposes is substantially the same as for financial statement purposes and net unrealized appreciation (depreciation) consists of:Gross Unrealized Appreciation $10,960,693Gross Unrealized Depreciation (698,966) Net Unrealized Appreciation (Depreciation) $10,261,727
See Notes to Financial Statements. 9
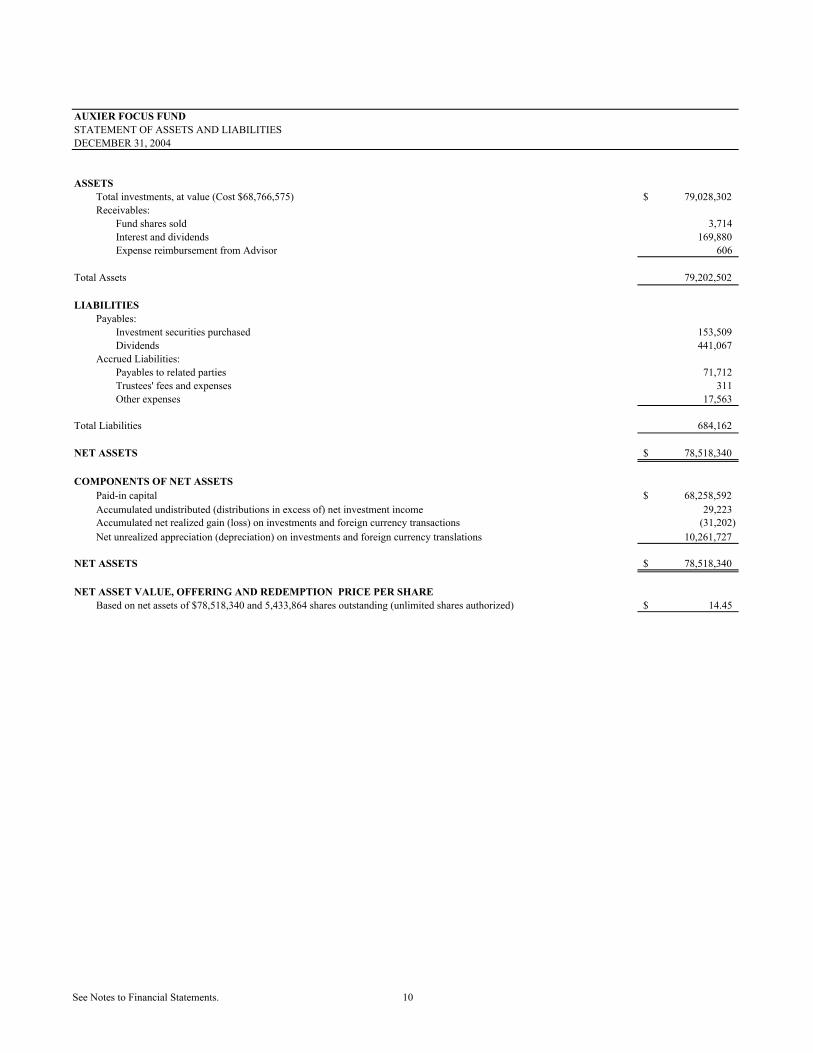
AUXIER FOCUS FUNDSTATEMENT OF ASSETS AND LIABILITIESDECEMBER 31, 2004
ASSETSTotal investments, at value (Cost $68,766,575) 79,028,302$ Receivables:
Fund shares sold 3,714 Interest and dividends 169,880 Expense reimbursement from Advisor 606
Total Assets 79,202,502
LIABILITIESPayables:
Investment securities purchased 153,509 Dividends 441,067
Accrued Liabilities:Payables to related parties 71,712 Trustees' fees and expenses 311 Other expenses 17,563
Total Liabilities 684,162
NET ASSETS 78,518,340$
COMPONENTS OF NET ASSETSPaid-in capital 68,258,592$ Accumulated undistributed (distributions in excess of) net investment income 29,223 Accumulated net realized gain (loss) on investments and foreign currency transactions (31,202) Net unrealized appreciation (depreciation) on investments and foreign currency translations 10,261,727
NET ASSETS 78,518,340$
NET ASSET VALUE, OFFERING AND REDEMPTION PRICE PER SHAREBased on net assets of $78,518,340 and 5,433,864 shares outstanding (unlimited shares authorized) 14.45$
See Notes to Financial Statements. 10

AUXIER FOCUS FUNDSTATEMENT OF OPERATIONSFOR THE SIX MONTHS ENDED DECEMBER 31, 2004
INVESTMENT INCOMEInterest income 274,481$ Dividend income (net foreign withholding taxes of $3,018) 489,253
Total Investment Income 763,734
EXPENSESInvestment advisor fees 476,022 Trustees' fees and expenses 606
Total Expenses 476,628 Fees waived and expenses reimbursed (606)
Net Expenses 476,022
NET INVESTMENT INCOME (LOSS) 287,712
NET REALIZED AND UNREALIZED GAIN (LOSS) ON INVESTMENTSAND FOREIGN CURRENCY TRANSACTIONSNet realized gain (loss) on investments and foreign currency transactions 855,658 Net change in unrealized appreciation (depreciation) on investments and foreign currency translations 4,570,056
NET REALIZED AND UNREALIZED GAIN (LOSS) ON INVESTMENTSAND FOREIGN CURRENCY TRANSACTIONS 5,425,714
INCREASE (DECREASE) IN NET ASSETS FROM OPERATIONS 5,713,426$
See Notes to Financial Statements. 11

AUXIER FOCUS FUNDSTATEMENTS OF CHANGES IN NET ASSETS
Six MonthsEnded Year Ended
December 31, 2004 June 30, 2004
OPERATIONSNet investment income (loss) 287,712$ 387,838$ Net realized gain (loss) on investments and foreign currency transactions 855,658 490,819 Net change in unrealized appreciation (depreciation) on investments 4,570,056 4,811,194 and foreign currency translations
Increase (Decrease) in Net Assets from Operations 5,713,426 5,689,851
DISTRIBUTIONS TO SHAREHOLDERS FROMNet investment income (441,067) (452,175) Net realized gains (1,322,191) -
Total Distributions to Shareholders (1,763,258) (452,175)
CAPITAL SHARE TRANSACTIONS Sale of shares: Investor Shares 15,770,000 36,909,246 Reinvestment of distributions: Investor Shares 1,306,249 451,024 Redemption of shares: Investor Shares (6,392,682) (3,853,565) Redemption fees: Investor Shares 43 -
Increase (Decrease) from Capital Share Transactions 10,683,610 33,506,705 Increase (Decrease) in Net Assets 14,633,778 38,744,381
NET ASSETSBeginning of Period 63,884,562 25,140,181 End of Period (a) 78,518,340$ 63,884,562$
SHARE TRANSACTIONSSale of shares: Investor Shares 1,157,754 2,752,156 Reinvestment of distributions: Investor Shares 91,282 34,143 Redemption of shares: Investor Shares (465,031) (289,608)
Increase (Decrease) in Shares 784,005 2,496,691
(a) Accumulated undistributed net investment income 29,223$ 182,578$
See Notes to Financial Statements. 12
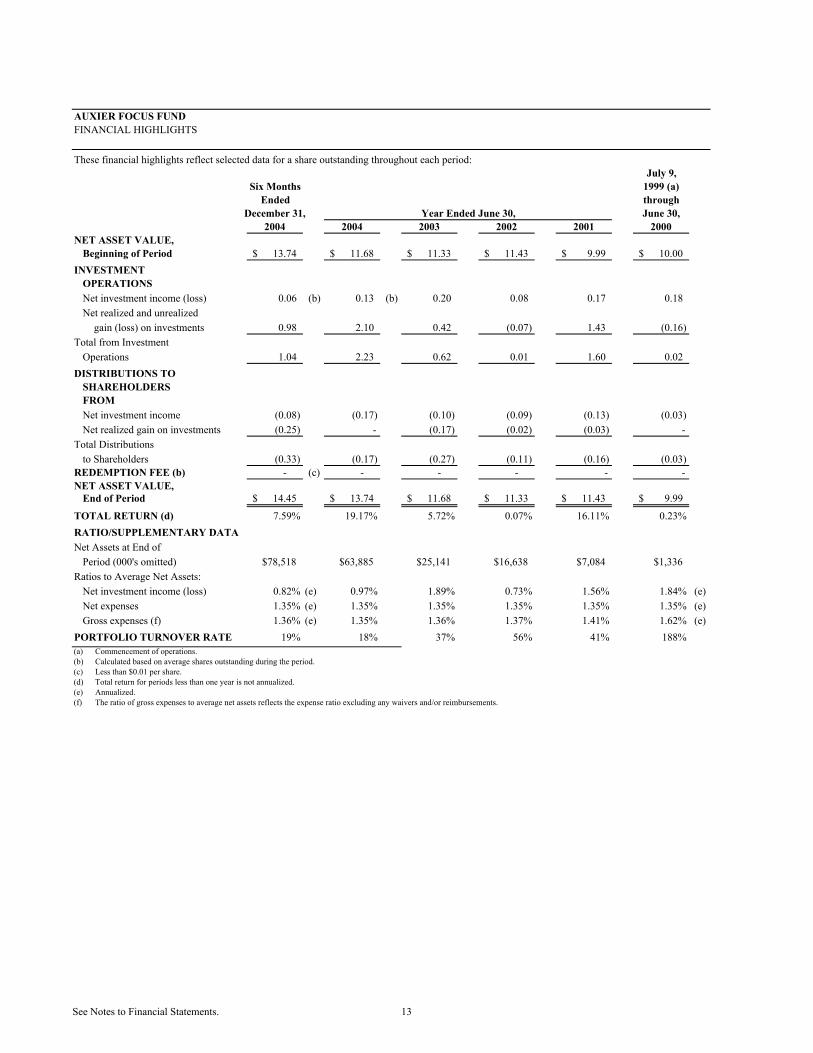
AUXIER FOCUS FUNDFINANCIAL HIGHLIGHTS
These financial highlights reflect selected data for a share outstanding throughout each period:July 9,
Six Months 1999 (a)Ended through
December 31, June 30,2004 2004 2003 2002 2001 2000
NET ASSET VALUE,Beginning of Period 13.74$ 11.68$ 11.33$ 11.43$ 9.99$ 10.00$
INVESTMENTOPERATIONSNet investment income (loss) 0.06 (b) 0.13 (b) 0.20 0.08 0.17 0.18 Net realized and unrealized
gain (loss) on investments 0.98 2.10 0.42 (0.07) 1.43 (0.16) Total from Investment
Operations 1.04 2.23 0.62 0.01 1.60 0.02 DISTRIBUTIONS TO
SHAREHOLDERSFROMNet investment income (0.08) (0.17) (0.10) (0.09) (0.13) (0.03) Net realized gain on investments (0.25) - (0.17) (0.02) (0.03) -
Total Distributionsto Shareholders (0.33) (0.17) (0.27) (0.11) (0.16) (0.03)
REDEMPTION FEE (b) - (c) - - - - -NET ASSET VALUE,
End of Period 14.45$ 13.74$ 11.68$ 11.33$ 11.43$ 9.99$
TOTAL RETURN (d) 7.59% 19.17% 5.72% 0.07% 16.11% 0.23%RATIO/SUPPLEMENTARY DATANet Assets at End of
Period (000's omitted) $78,518 $63,885 $25,141 $16,638 $7,084 $1,336Ratios to Average Net Assets:
Net investment income (loss) 0.82% (e) 0.97% 1.89% 0.73% 1.56% 1.84% (e)Net expenses 1.35% (e) 1.35% 1.35% 1.35% 1.35% 1.35% (e)Gross expenses (f) 1.36% (e) 1.35% 1.36% 1.37% 1.41% 1.62% (e)
PORTFOLIO TURNOVER RATE 19% 18% 37% 56% 41% 188%(a) Commencement of operations.(b) Calculated based on average shares outstanding during the period.(c) Less than $0.01 per share.(d) Total return for periods less than one year is not annualized.(e) Annualized. (f) The ratio of gross expenses to average net assets reflects the expense ratio excluding any waivers and/or reimbursements.
Year Ended June 30,
See Notes to Financial Statements. 13

14
AUXIER FOCUS FUND NOTES TO FINANCIAL STATEMENTS DECEMBER 31, 2004 Note 1. Organization This report relates to Auxier Focus Fund (the “Fund”), a non-diversified series of Forum Funds (the “Trust”). The Trust is a Delaware statutory trust that is registered as an open-end, management investment company under the Investment Company Act of 1940, as amended (the “Act”). The Trust currently has twenty-two investment portfolios. On December 10, 2004, the Fund acquired the assets and assumed the liabilities of Auxier Focus Fund, a series of Unified Series Trust (the “Predecessor Fund”) in a tax-free reorganization (the “Reorganization”). The Predecessor Fund maintained the same investment objective and investment policies as those of the Fund. Prior to January 3, 2003, the Predecessor Fund was a series of Ameriprime Funds (the “Ameriprime Fund”). On January 3, 2003, the Predecessor Fund acquired the assets and assumed the liabilities of the Ameriprime Fund in a tax-free reorganization. Under its Trust Instrument, the Trust is authorized to issue an unlimited number of the Fund’s shares of beneficial interest without par value. The Fund currently offers three classes of shares: Investor Shares, A Shares, and C Shares. Investor Shares commenced operations on July 9, 1999. As of December 31, 2004, A Shares and C Shares had not commenced operations. A Shares generally have a front-end sales charge. The Fund is intended for long-term investors. The Fund charges a contingent deferred sales charge of 1.00% on A and C shares purchased without an initial sales charge and redeemed less than one year after they are purchased. Income and realized and unrealized gains or losses on investments are allocated to each class of shares based on the ratio of the class’ net assets to the total net assets of the Fund. The Fund seeks long-term capital appreciation by investing primarily in a portfolio of common stocks that the Fund’s investment advisor believes offer growth opportunities at a reasonable price. Note 2. Summary of Significant Accounting Policies These financial statements are prepared in accordance with accounting principles generally accepted in the United States of America, which require management to make estimates and assumptions that affect the reported amounts of assets and liabilities, the disclosure of contingent assets and liabilities at the date of the financial statements, and the reported amounts of increase and decrease in net assets from operations during the fiscal year. Actual amounts could differ from those estimates. The following summarizes the significant accounting policies of the Fund: Security Valuation – Exchange traded securities for which market quotations are readily available are valued using the last reported sales price provided by independent pricing services as of the close of trading on the New York Stock Exchange (normally 4:00 p.m. Eastern time), on each Fund business day. In the absence of a sale, such securities are valued at the mean of the last bid and asked price. Non-exchange traded securities for which over-the-counter quotations are available are generally valued at the mean between the closing bid and asked prices. Money market instruments that mature in sixty days or less may be valued at amortized cost.
The Fund values securities at fair value pursuant to procedures adopted by the Board if (1) market quotations are insufficient or not readily available or (2) the Advisor believes that the prices or values available are unreliable. Security Transactions, Investment Income and Realized Gain and Loss – Investment transactions are accounted for on trade date. Dividend income is recorded on the ex-dividend date. Interest income is recorded as earned. Identified cost of investments sold is used to determine gain and loss for both financial statement and Federal income tax purposes. Foreign Currencies – Foreign currency amounts are translated into U.S. dollars as follows: (i) assets and liabilities at the rate of exchange at the end of the respective period; and (ii) purchases and sales of securities and income and expenses at the rate of exchange prevailing on the dates of such transactions. The portion of the results of operations arising from changes in the exchange rates and the portion due to fluctuations arising from changes in the market prices of securities are not isolated. These fluctuations are included with the net realized and unrealized gain or loss on investments.

15
AUXIER FOCUS FUND NOTES TO FINANCIAL STATEMENTS DECEMBER 31, 2004 Distributions to Shareholders – Distributions to shareholders from net investment income and net capital gains, if any, are declared and paid at least annually. Distributions are based on amounts calculated in accordance with applicable Federal income tax regulations, which may differ from generally accepted accounting principles. These differences are due primarily to differing treatments of income and gain on various investment securities held by the Fund, timing differences and differing characterizations of distributions made by the Fund. Federal Taxes – The Fund intends to qualify each year as a regulated investment company under Subchapter M of the Internal Revenue Code and distribute all its taxable income. In addition, by distributing in each calendar year substantially all its net investment income, capital gains and certain other amounts, if any, the Fund will not be subject to a Federal excise tax. Therefore, no Federal income or excise tax provision is required. Expense Allocation – The Trust accounts separately for the assets, liabilities and operations of each of its series. Expenses that are directly attributable to more than one series are allocated among the respective series in proportion to each series’ average daily net assets. Each share of each class of the Fund represents an undivided, proportionate interest in the Fund. The Fund’s class specific expenses include distribution fees, transfer agency fees, registration fees and certain expenses as determined by the Trust’s Board. Redemption Fees – To discourage short-term trading and market timing, the Fund charges a redemption fee of 2.00% of the net asset value of Investor Shares redeemed if the shares were purchased after October 11, 2004 and if the shares are owned less than 180 days. The Fund charges a redemption fee of 2.00% of the net asset value of A and C shares redeemed if the shares are owned less than 180 days. The fee is charged for the benefit of remaining shareholders and will be paid to the Fund to help offset future transaction costs. To calculate redemption fees, the Fund uses the first-in, first-out method to determine the holding period. Under this method, the date of redemption is compared with the earliest purchase date of the shares held in the account. The fee is accounted for as an addition to paid-in capital. The Fund reserves the right to modify the terms of or terminate the fee at any time. There are limited exceptions to the imposition of the redemption fee. The Fund collected $43 in redemption fees during the six months ended December 31, 2004. Restricted Securities – The Fund may invest in securities that are subject to legal or contractual restrictions on resale (“restricted securities”). Restricted securities may be resold in transactions that are exempt from registration under the Federal securities laws or, if the securities are registered, to the public. The sale or other disposition of these securities may involve additional expenses and the prompt sale of these securities at an acceptable price may be difficult. Information regarding the restricted securities held by the Fund is included in the Fund’s Schedule of Investments. Note 3. Advisory Fees, Servicing Fees and Other Transactions Investment Advisor – Auxier Asset Management, LLC (the “Advisor”) is the investment advisor to the Fund. Pursuant to a Management Agreement, the Advisor receives an advisory fee from the Fund at an annual rate of 1.35% of the Fund’s average daily net assets. Under the terms of the Management Agreement, the Advisor is obligated to pay all expenses of the Fund, except brokerage costs, taxes, borrowing costs, commissions, certain compensation and expenses of the Trustees and extraordinary and non-recurring expenses. Administration and Other Services – Citigroup Global Transaction Services, through its various affiliates (collectively “Citigroup”), provides administration, portfolio accounting, and transfer agency services to the Fund.

16
AUXIER FOCUS FUND NOTES TO FINANCIAL STATEMENTS DECEMBER 31, 2004 Distribution – Forum Fund Services, LLC is the Fund’s distributor (the “Distributor”). The Distributor is not affiliated with the Advisor, Citigroup or its affiliated companies. Under a Distribution Plan adopted pursuant to Rule 12b-1 under the Act with respect to A Shares and C Shares, the Fund pays the Distributor a fee at an annual rate of 0.25% of the average daily net assets of A Shares and up to 1.00% of the average daily net assets of C Shares. The Distributor may pay some or all of these fees to various financial institutions, including the Advisor, that provide distribution or shareholder services. The Distribution Plan obligates the Fund to pay the Distributor compensation for the Distributor’s services and not as reimbursement for certain expenses incurred. For the six months ended December 31, 2004, the Distributor did not receive any fees. Effective March 1, 2005, the Distributor will change its name to Foreside Fund Services, LLC. Under a Compliance Services Agreement with the Trust, the Distributor provides a Chief Compliance Officer (“CCO”) to the Trust as well as certain additional compliance support functions. Certain Trustees and officers of the Trust are directors, officers, or employees of the aforementioned companies. No officer, except for the CCO, is compensated by the Trust. Note 4. Waiver of Fees and Reimbursement of Expenses The Advisor has contractually agreed to waive a portion of its fee and reimburse certain expenses so that net expenses of Investor Shares, A Shares and C Shares do not exceed 1.35%, 1.35% and 2.10%, respectively, of that class’ average daily net assets through October 31, 2005. For the six months ended December 31, 2004, the Advisor waived fees of $606.
Note 5. Security Transactions The cost of purchases and proceeds from sales of securities (including maturities), other than short-term investments, were $22,954,980 and $10,501,683, respectively, for the six months ended December 31, 2004. Note 6. Change in Accountants On March 14, 2004, Cohen McCurdy, Ltd. (“Cohen”) replaced McCurdy & Associates CPA’s, Inc. (“McCurdy”) as the Fund’s auditors for the fiscal year ending June 30, 2004, effective upon the resignation of McCurdy. Upon receipt of notice that Cohen was selected as the Fund’s auditor, McCurdy, whose audit practice was acquired by Cohen, resigned as independent auditors to the Fund. McCurdy’s reports on the Fund’s financial statements for the fiscal year ended June 30, 2003 contained no adverse opinion or a disclaimer of opinion nor were they qualified or modified as to uncertainty, audit scope or accounting principles. During the fiscal year ended June 30, 2003 through the date of engagement of Cohen, there were no disagreements with McCurdy on any matter of accounting principles or practices, financial statement disclosure, or auditing scope or procedure which, if not resolved to the satisfaction of McCurdy, would have caused McCurdy to make reference to the subject matter of the disagreements in connection with its reports on the Fund’s financial statements for such periods. Neither the Fund nor anyone on its behalf consulted with Cohen on items which (i) concerned the application of accounting principles to a specified transaction, either completed or proposed or the type of audit opinion that might be rendered on the Fund’s financial statements as a result of such consultations or (ii) concerned the subject of a disagreement with McCurdy or a reportable event. Pursuant to the Reorganization, Deloitte & Touche LLP replaced Cohen as the Fund’s auditors.

17
AUXIER FOCUS FUND NOTES TO FINANCIAL STATEMENTS DECEMBER 31, 2004 Note 7. Proxy Voting Information A description of the policies and procedures that the Fund uses to determine how to vote proxies relating to securities held in the Fund’s portfolio is available, without charge and upon request, by calling (877) 328-9437, on the Fund’s web site at http://www.auxierasset.com/focus_fund.htm and on the SEC’s website at http://www.sec.gov. The Predecessor Fund’s voting record for the 12-month period ended June 30, 2004 is available, without charge and upon request, by calling (877) 328-9437 and on the SEC’s web site at http://www.sec.gov. Note 8. Availability of Quarterly Portfolio Schedules Effective June 30, 2004, the Fund files its complete schedule of portfolio holdings with the SEC for the first and third quarters of each fiscal year on Form N-Q. The Fund’s Form N-Q is available, without charge, on the SEC’s website at http://www.sec.gov or may be reviewed and copied at the SEC’s Public Reference Room in Washington, DC. The Predecessor Fund’s Form N-Q for the quarter ended September 30, 2004 is available, without charge, on the SEC’s web site at http://www.sec.gov or may be reviewed and copied at the SEC’s Public Reference Room in Washington, DC. Information on the operation of the Public Reference Room may be obtained by calling (800) SEC-0330. Note 9. Shareholder Expenses As a shareholder of the Fund, you incur two types of costs: (1) transaction costs for certain share classes, including sales charges (loads) on purchases and redemptions; redemption fees; and (2) ongoing costs, including management fees; Rule 12b-1 distribution fees and other Fund expenses. This example is intended to help you understand your ongoing costs (in dollars) of investing in the Fund and to compare these costs with the ongoing costs of investing in other mutual funds. The following example is based on $1,000 invested at the beginning of the period and held for the entire period from July 1, 2004, through December 31, 2004. Actual Expenses – The “Actual Return” row in the table below provides information about actual account values and actual expenses. You may use the information in this line, together with the amount you invested, to estimate the expenses that you paid over the period. Simply divide your account value by $1,000 (for example, an $8,600 account value divided by $1,000 = 8.6), then multiply the result by the number in the “Expenses Paid During Period” column to estimate the expenses you paid on your account during this period. The Fund charges redemption fees, which are not included in the following table. If they were, the estimate of expenses you paid during the period would be higher, and your ending account value lower, by these amounts. Hypothetical Example for Comparison Purposes – The “Hypothetical Return” row in the table below provides information about hypothetical account values and hypothetical expenses based on the Fund’s actual expense ratio and an assumed rate of return of 5% per year before expenses, which is not the Fund’s actual return. The hypothetical account values and expenses may not be used to estimate the actual ending account balance or expenses you paid for the period. You may use this information to compare the ongoing cost of investing in the Fund and other funds. To do so, compare this 5% hypothetical example with the 5% hypothetical examples that appear in the shareholder reports of other funds. The Fund charges redemption fees, which are not included in the following table. If they were, the estimate of expenses you paid during the period would be higher, and your ending account value lower, by these amounts.

18
AUXIER FOCUS FUND NOTES TO FINANCIAL STATEMENTS DECEMBER 31, 2004 Expenses shown in the table are meant to highlight your ongoing costs only and do not reflect any transactional costs, such as sales charges (loads) for certain share classes, redemption fees or exchange fees. Therefore, the “Hypothetical Return” row in the table is useful in comparing ongoing costs only, and will not help you determine the relative total costs of owning different funds. In addition, if these transactional costs had been included, your costs would have been higher.
Beginning
Account Value July 1, 2004
Ending
Account Value December 31, 2004
Expenses
Paid During Period (a)
Annual Expense
Ratio Investor Shares Actual Return $1,000.00 $1,075.92 $7.06 1.35% Hypothetical Return $1,000.00 $1,018.40 $6.87 1.35%
(a) Expenses are equal to the fund’s annualized expense ratio of 1.35%, multiplied by the average account value over
the period, multiplied by the number of days in most recent fiscal half-year/365 (to reflect the half-year period).

FOR MORE INFORMATION
P.O. Box 446 Portland, Maine 04112
(877)-3AUXIER (877) 328-9437
INVESTMENT ADVISOR
Auxier Asset Management 5000 S.W. Meadows Road
Suite 410 Lake Oswego, Oregon 97035
TRANSFER AGENT
Forum Shareholder Services, LLC P.O. Box 446
Portland, Maine 04112