semaspec test method for determination of surface ... · determination of surface roughness by...
TRANSCRIPT

SEMATECHTechnology Transfer 90120400B-STD
SEMASPEC Test Method forDetermination of Surface Roughness
by Contact Profilometry for GasDistribution System Components

© 1996 SEMATECH, Inc.
SEMATECH and the SEMATECH logo are registered service marks of SEMATECH, Inc.
SEMASPEC Test Method for Determination of Surface Roughness byContact Profilometry for Gas Distribution System Components
Technology Transfer # 90120400B-STDSEMATECH
February 22, 1993
Abstract: This SEMASPEC describes the determination of numerical values for surface roughness ofcomponents used in ultra-high purity gas distribution systems. Application of this test method isexpected to yield comparable data among components tested for the purposes of qualification forinstallation. This document is in development as an industry standard by SemiconductorEquipment and Materials International (SEMI). When available, adherence to the SEMI standardis recommended.
Keywords: Surface Roughness, Facilities, Gas Distribution Systems, Specifications, Components, ComponentTesting
Authors: Jeff Riddle
Approvals: Jeff Riddle, Project ManagerVenu Menon, Program ManagerJackie Marsh, Director of Standards ProgramGene Feit, Director, Contamination Free ManufacturingJohn Pankratz, DirectorJeanne Cranford, Technical Information Transfer Team Leader


Technology Transfer # 90120400B-STD SEMATECH
1
SEMASPEC #90120400B-STD
SEMASPEC Test Method for Determination of Surface Roughness by ContactProfilometry for Gas Distribution System Components
1. Introduction
Semiconductor cleanrooms are serviced by high-purity gas distribution systems. Thisdocument presents a test method that may be applied for the evaluation of one or morecomponents considered for use in such systems.
1.1 Purpose
1.1.1 The purpose of this document is to define a method for testing components beingconsidered for installation into a high-purity gas distribution system. Application of thistest method is expected to yield comparable data among components tested for purposesof qualification for this installation.
1.1.2 This method describes the determination of numerical values for surface roughness.
1.2 Scope
1.2.1 Surface feature sizes from 0.25 µm (10 µin.) Ra to 3.0 µm (120 µin.) Ra are measuredusing this method.
1.2.2 A statistical analysis of a profilometer graphic output that describes a fractal dimensionmeasurement is included in the Appendix. The resulting numerical value is referred to asthe fractal-based roughness, RF.
1.3 Limitations
1.3.1 Surfaces having roughness indices greater than 0.25 µm (10 µin.) Ra may be reliablymeasured with a typical surface contact type instrument, provided that the instrumentchosen is capable of resolving features on the order of 0.10 µm (4.0 µin.).
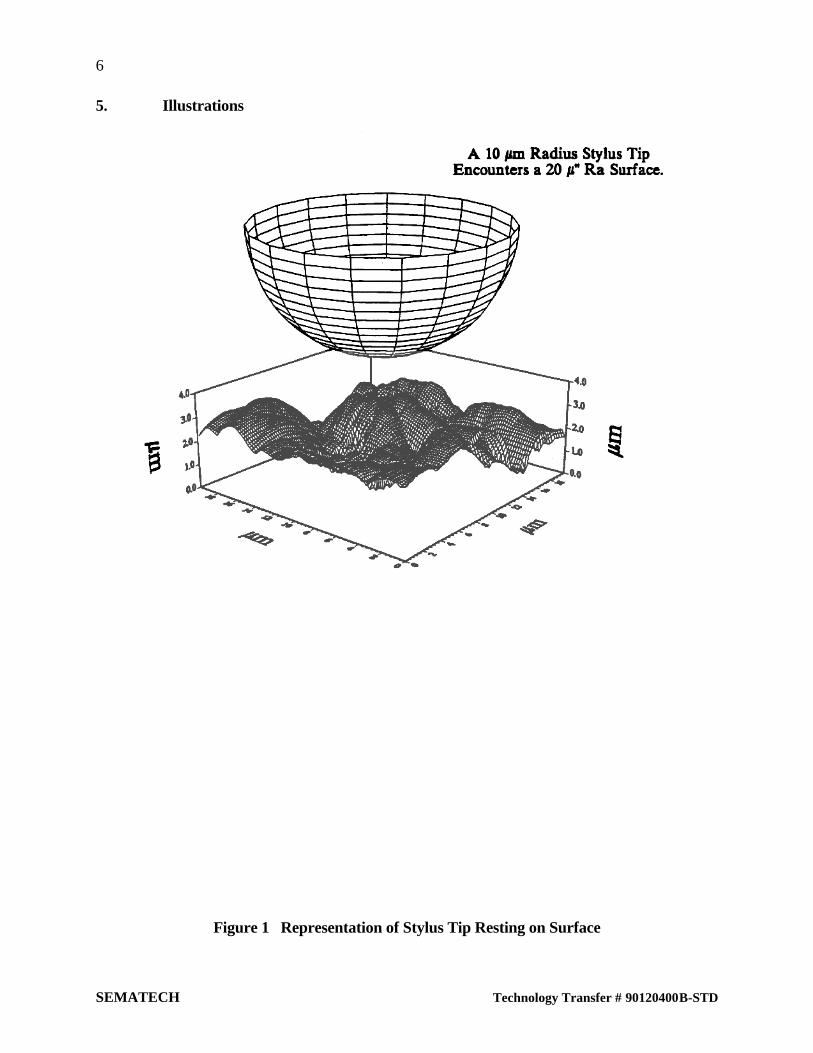
1.3.2 Surfaces having roughness indices equal to or less than 0.25 µm (10 µin.) Ra should bemeasured with a non-contact surface analyzer. For most stylus-based profilometers,0.25–µm (10–µin.) Ra represents the lower detection limit (LDL) with reasonableaccuracy. (Figure 1 graphically highlights the difficulty of measurement). Refer to X1.1for possible contact measurement of surfaces under 0.25 µm.
1.3.3 The direction (or lay) of regular surface features (e.g., grooves), relative to the stylusstroke direction, can substantially affect the reported roughness index. To avoiddiscrepancies arising from such situations (such as in cases where a pronounced layexists), the sample lay must be oriented at a 90 degree angle to the direction of stylusmovement. In many cases, this will require mechanical rotation of the sample to obtainsuch a directional orientation. If this is not possible, as could be the case for very smallpassageways etc., the exception must be noted along with the reported data.
SEMATECH Technology Transfer # 90120400B-STD
2
2. Reference Documents
2.1 ANSI1
ANSI B.46.1-85 Surface Texture (Surface Roughness, Waviness, and Lay),ANSI/ASME 1985
ANSI Y14.36-1987Surface Texture Symbols, ANSI/ASME. 1987
2.2 ASTM2
ASTM. E673-89a Standard Terminology Relating to Surface Analysis, 1989
2.3 Military Standards3
MIL STD 105D
MIL STD 414
2.4 International Standards Organization. ISO 4287 Part 1.
3. Terminology
3.1 distinct bores—the total number of individual bores per test component. Includes in-linebores of different sizes and orientations and each leg of a shaped component or fitting.
3.2 feature size—any measurable three dimensional surface irregularity, not necessarilyoriented to any particular reference plane.
3.3 lay—the general direction of orientation of major surface features.
3.4 Ra—roughness average. The arithmetic average of the absolute values of the measureprofile height deviations taken within the sampling length and measured from thegraphical centerline. [ANSI B46.1 1985]
3.5 Ry—the distance between two lines parallel to the mean line that contact the extremeupper and lower points on the profile within the roughness sampling length. (Ry issometimes referred to as Rmax). [ANSI B46.1]
3.6 Rz—the average distance between the five highest peaks and the five deepest valleyswithin the sampling length measured from a line parallel to the mean line and notcrossing the profile. [ISO 4287 Part 1]
3.7 SA index—(surface area index) the area of a best fit plane (or ideal surface) subtractedfrom the actual area calculated for the surface, divided by the ideal area, and multipliedby 1,000. (See Section 4.4.3.6 for algebraic definition.)
1 American National Standards Institute, 1430 Broadway, New York, NY 10018
2 American Society for Testing and Materials, 1916 Race St., Philadelphia, PA 19103
3 Available from Naval Publications and Forms Center, 5801 Tabor Ave., Philadelphia, PA 19120

Technology Transfer # 90120400B-STD SEMATECH
3
3.8 surface—the boundary that separates an object from another object, substance, or space.[ANSI B46.1 1985]
[Note: In chromium enhanced stainless steel alloys, the surface is the first 50 to 100angstroms of material.]
3.9 standard conditions—101.3 kPa, 0.0 °C (14.73 psia, 32 °F).
3.10 standard test conditions—101.3 kPa, 21 °C (14.73 psia, 70 °C), Rh 45%-65%.
3.11 surface profile—the contour of the surface in a plane perpendicular to the surface unlesssome other angle is specified. [ANSI B46.1 1985]
3.12 surface roughness—the finer irregularities of the surface texture, usually including thoseirregularities that result from the inherent action of the production process. Examplesinclude traverse feed marks and other irregularities within the limits of the roughnesssampling length. [ANSI B46.1 1985]
3.13 surface texture—repetitive or random deviation from the nominal surface that forms thethree-dimensional topography of the surface. Includes roughness, waviness, lay, andflaws. [ANSI B46.1 1985]
3.14 wetted surface—any component internal surface that will come into contact with theprocess media contained by the component during normal operation.
4. Test Protocol
4.1 Test Conditions
4.1.1 Precautions
4.1.1.1 This test method may involve hazardous materials, operations, and equipment. This testmethod does not purport to address the safety considerations associated with its use. It isthe responsibility of the user to establish appropriate safety and health practices anddetermine the applicability of regulatory limitations before using this method.
4.1.2 When measuring a surface with a stylus (contact) type of profilometer, care must betaken to avoid undue force being applied to the stylus tip. For example, do not permit thetip to visibly score the surface. Such visible scoring is to be distinguished from normalscoring, which is visible under a microscope. If the surface is visibly scored, the tip mustbe examined with a microscope and replaced if damaged; the test must in any case berepeated using a nonscored area of the surface.
4.1.3 The surfaces to be analyzed should be clean and free from loose debris. If this is not thecase, the surfaces should be cleaned before proceeding.
4.1.4 The stylus tip should be examined for conformance to the requirements of ANSI B46.1.
4.1.5 The instrument used for the analysis must have a current calibration certificate(unexpired date).
4.1.6 For certification purposes, the testing must be carried out under cleanroom and laminarairflow conditions, with controlled temperature, humidity, and vibration, per 3.12.1. Theclass of the cleanroom should be compatible with the class of the component under test.

SEMATECH Technology Transfer # 90120400B-STD
4
4.2 Apparatus
4.2.1 Materials—See ANSI 46B.1.
4.2.1.1 A standard inspection table, typically constructed of marble or granite, with anti-vibration mounts, is to be used.
4.2.2 Instrumentation
4.2.2.1 Instruments shall be calibrated using standard laboratory practices and manufacturer'srecommendations.
4.2.3 Setup and schematic
4.3 Test Procedures
4.3.1 Sample preparation
4.3.1.1 The sample must be adequately supported to prevent relative movement between thesample and measuring instrument.
4.3.1.2 The sample surface must lie in a plane at a 90° angle to the axis of measurement for themeasuring instrument to avoid unduly high readings from compound angles.
4.3.1.3 If all bores and/or wetted surfaces are accessible to the stylus probe, then testing may becarried out non-destructively. Otherwise, each inaccessible area must be exposed bysectioning of representative samples.
4.3.1.4 Sectioned samples are to be cleaned of sectioning artifacts and/or debris with a suitablesolvent, DI water rinse, and nitrogen drying technique.
4.3.1.5 Bores are to be rotated about the probe axis to provide for lateral traverse in addition tolongitudinal traverse to ensure that any readings obtained will reflect maximumexcursions due to the "lay" of each surface.
4.3.1.6 Repeat the procedure for each bore and/or wetted surface.
4.3.2 Randomly select five places to be measured for each unique area of a surface to beanalyzed.
4.3.3 Set the effective response cut-off to 0.8 mm (0.03 in.) for all instrument types.
4.3.4 Set the traverse distance at 3.75 mm (0.150 in.) or at the available surface length,whichever is less.
4.3.5 Take profilometry readings per the manufacturer's instruction manual, with theexceptions required by this test method.
4.4 Data Analysis
4.4.1 At the completion of testing, a table of data points, together with their location and adescription of the component, will have been produced. These data must then beanalyzed to produce a single roughness average (Ra) reading to describe the surface ofthe component under test.
Technology Transfer # 90120400B-STD SEMATECH
5
4.4.2 The data must be recorded in tabular format. The table shall include all themeasurements made, with entries for Ra, Rmax, Rz, and Ry. Ra is the preferred reading todescribe a surface for its particulate entrapment and sorption capabilities.
4.4.3 The recorded data should be kept on file as backup information to justify the numericalvalues reported.
4.4.4 An information sheet should accompany the reported data table providing such detailsas:
Profilometer Type and Model (with calibration date)Cut-off and MagnificationStylus Type and SizeNumber of Readings per Sample
4.4.5 To avoid undue restriction on any existing practice, the data may be presented in any ofthe formats defined in ANSI B46.1. However, the equivalent Ra value must also bepresented along with any other parameter.
4.4.6 A single value may be obtained for a component from the profilometer readingsresulting from each traverse of the stylus, by reporting the estimate of the mean of allvalues obtained, adjusted to a 95% Upper Confidence Interval for the data.
4.4.7 Data Presentation
4.4.7.1 If a contact method of surface roughness analysis results in a surface indication of lessthan 0.25 µm (10 µin.) Ra, then this must be reported as "less than 0.25 µm (10 µin.)."
4.5 Statistical Analysis
4.5.1 Profilometers typically perform an analysis of the stylus deflection or profile as theaverage of five successive readings in each traverse of the stylus; this calculated data isreported as a variety of parameters. (See Section 3.)
4.5.2 To obtain a statistical significance from the reported data, at least 16 data points must beobtained for each component tested.
For example, typical two-way diaphragm valves might require as few as six times five(30) readings to as many as eight times five (40) readings, depending on the design of thevalve. A single piece of tubing, however, would require four sets of five readings (20),one set from each end of each end-piece and from each end of the center piece.
For nondestructive testing of tubing, only two times five (10) readings would be obtainedfor each piece of tube, one set of five from either end. But the readings from successivetubing lengths would then be considered as comprising one sample.
SEMATECH Technology Transfer # 90120400B-STD
6
5. Illustrations
Figure 1 Representation of Stylus Tip Resting on Surface

APPENDIXES(Supplementary Information)
Technology Transfer # 90120400B-STD SEMATECH
7
X1. Alternative Methods
X1.1 Method for contact measurement of surfaces under 0.25 µm.
X1.1.1 The useful range of a contact type measurement can be extended to 0.125 µm (5 µin.) Ra
if special apparatus is available to provide consistently accurate, NIST traceable results atthis lower value; such special apparatus must be operated under standard test conditionsand, in addition, be isolated from vertical and horizontal vibration amplitudes less than0.01 µm.
X1.1.2 Stylus tips with a radius less than the 10 µm (400 µin.) defined in ANSI B46.1 areavailable and can be used to overcome the limitations of the large stylus–to–surface–feature aspect ratio resulting from the use of the standard stylus tip radius. Usage of sucha tip would, however, necessitate an NIST traceable calibration surface having a 0.125–µm (5–µin.) Ra or 0.0625–µm (2.5–µin.) Ra standard surface to justify the results soobtained.
[Note: The above considerations are based on a general rule stating that surfaceroughness measurement errors become significant when the smallest Ra measurementobtained is greater that one twentieth the radius of the stylus tip (recent ANSI B46.1committee opinion). For example:For a 10–µm (400–µin.) stylus tip radius: 400/20 = 20.0 µin. Ra.
(10/20)= (0.50 µm) Ra.
For a 5–µm (200–µin.) stylus tip radius: 200/20 = 10.0 µin. Ra.
(5/20)= 0.25 µm) Ra.
For a 2.5–µm (100–µin.) stylus tip radius: 100/20 = 5.0 µin. Ra.
(2.5/20)= (0.13 µm) Ra.
X1.1.3 The underlying assumptions on which instruments based on the ANSI B46.1 standardrely may not be applicable to surfaces produces by non-tooled methods (i.e., electro-polishing or other chemical methods).
X2. Method for Fractal Based Surface Roughness Characterization for the ContactProfilometry Test
X2.1 Purpose—This method describes an additional figure of merit to consider adding to thedata presentation table, the fractal-based roughness parameter (RF).
X2.2 Scope—The scope of this method encompasses fractal-roughness determination for onlythose profiles obtained from surfaces by contact stylus profilometry and for only thosesurfaces found in high purity gas applications. The only fractal dimension measurementdescribed here is the box dimension. The resulting numerical value is referred to as thefractal-based roughness, RF.
X2.3 Limitations—Comparisons between RF values are only valid between similar profilingmethods, i.e., identical trace lengths, identical scaling of feature heights (see below), andidentical means of profile acquisition. Therefore, the method described here is only acomparison between profiles and not an absolute measurement of fractal dimension.

APPENDIXES(Supplementary Information)
SEMATECH Technology Transfer # 90120400B-STD
8
X2.4 Definitions—See X.2.10.
Box—A square grouping of pixels used as a sizing element (tile element) by thealgorithm.
Box count—The number of boxes of a given size required to cover (tile over) the profile(see Figure X2.1).
Box dimension—The fractal dimension determined by the box counting method.
Box height—Pixel height of box multiplied by micrometer/pixel factor (determined byprofile's scaling factor) to yield box's equivalent height in micrometers. (Seedefinition for scaling factor.)
Box width—Width, in pixels, of boxes used to tile over profile.
Break point—Bend or discontinuity in the box count plot.
Feature height—The height of features on the surface profile. The feature heights on thex–axis of the log-log plot are back-calculated from the box height.
Fractal-based roughness—Roughness as represented by the slope of the box countingplot.
Log-log plot—The plot of the base-10 logarithm of the box counts versus the base-10logarithm of the normalized box size, or the linear data plotted on a logarithmicscale.
Normalized box size—Box width, in pixels, divided by grid width, in pixels.
Pixel—A box equal in width to the distance between two consecutive data points on the profile.Groupings of pixels comprise boxes.
Profile—Surface representation as defined in ANSI B.46, obtained from contactprofilometry.
RF—Fractal-based roughness. RF is the slope of the log-log plot.
Scaling factor—Amplification of profile's feature height values, held constant betweenprofiles to allow comparison. (For the profiles covered here, the scaling factor waskept at a value of 60.)
Scan length—The length of the continuous profile.
Sizing element—Box of integer width and height in pixels. The height of this box is onlysensitive to profile features of equal height or taller.
Slope—The slope of the log-log plot of box count versus box height. The value of thisslope is the same as the value of RF.

APPENDIXES(Supplementary Information)
Technology Transfer # 90120400B-STD SEMATECH
9
X2.5 Procedure
X2.5.1 Begin with profile data expressed as a consecutive series of height measurements takenover a trace length of 1.25 mm.
X2.5.2 Multiply all height measurements by 60.
X2.5.3 Define a pixel as a unit square of height and width equal to the distance betweenconsecutive data points.
X2.5.4 Define a box as a square of integer multiples of pixels. For example, box 2 is two pixelsby two pixels, box 3 is 3 × 3, etc.
X2.5.5 Define a grid of rows and columns for each size box. The grid should be as long as theprofile scan length and one box taller than the maximum feature height over the length ofthe profile.
X2.5.6 For each box size perform the following steps:
Superimpose the grid over the profile so that the bottom of the grid is even with thelowest point on the profile. Count the number of boxes in the grid which contain aportion of the profile.
Move the grid downward relative to the profile by one pixel and recount the number ofnon-empty boxes.
Repeat the downward stepping of the grid relative to the profile N-1 times for a box sizeof N pixels. Compare the count from each step and keep the lowest count.
X2.6 Plot the log (box count) versus the log (box height in pixels/total profile length in pixels)for all the boxes. Back-calculate from the box height in pixels to the box height inmicrometers. Use this box height as the feature height along the x–axis of the log-logplot.
The fractal roughness RF is the slope of the plot between box 3 and box 15 or the highestbox before the slope becomes 1 on the log-log plot.
The deviation from ideal at the small box end of the plot is an indication of the deviationof the profile from an ideally flat surface. (See box count plot in Figures X2.1 andX2.2.)
X2.7 Statistical Analysis—Standard deviations should be no larger than ± .03 in the value ofthe slope of the log-log plot.
X2.8 Data Presentation
Report the value of the slope determined in Section X2.6 and the size range (inmicrometers) over which it was determined.
APPENDIXES(Supplementary Information)
SEMATECH Technology Transfer # 90120400B-STD
10
X2.9 Additional References
X2.9.1 B.B. Mandelbrot. The Fractal Geometry of Nature. Freeman, New York. 1983.
X2.9.2 B.B. Mandelbrot. "Fractals in Physics." Proceedings of the Sixth Trieste InternationalSymposium. Ed. L. Pietronero and E. Tosatti. Elsevier Science Publishing Co.,New York. 1986:10.
X2.9.3 S. Chesters, H.Y. Wen, M. Lundin, and G. Kasper. Applied Surface Science, v. 40.1989:185-192.
X2.9.4 S. Chesters, H.C. Wang, and G. Kasper. "A Fractal-Based Method for DescribingSurface Texture." Solid State Technology. Jan. 1991:73-77.
X2.10 Principle of the box counting algorithm
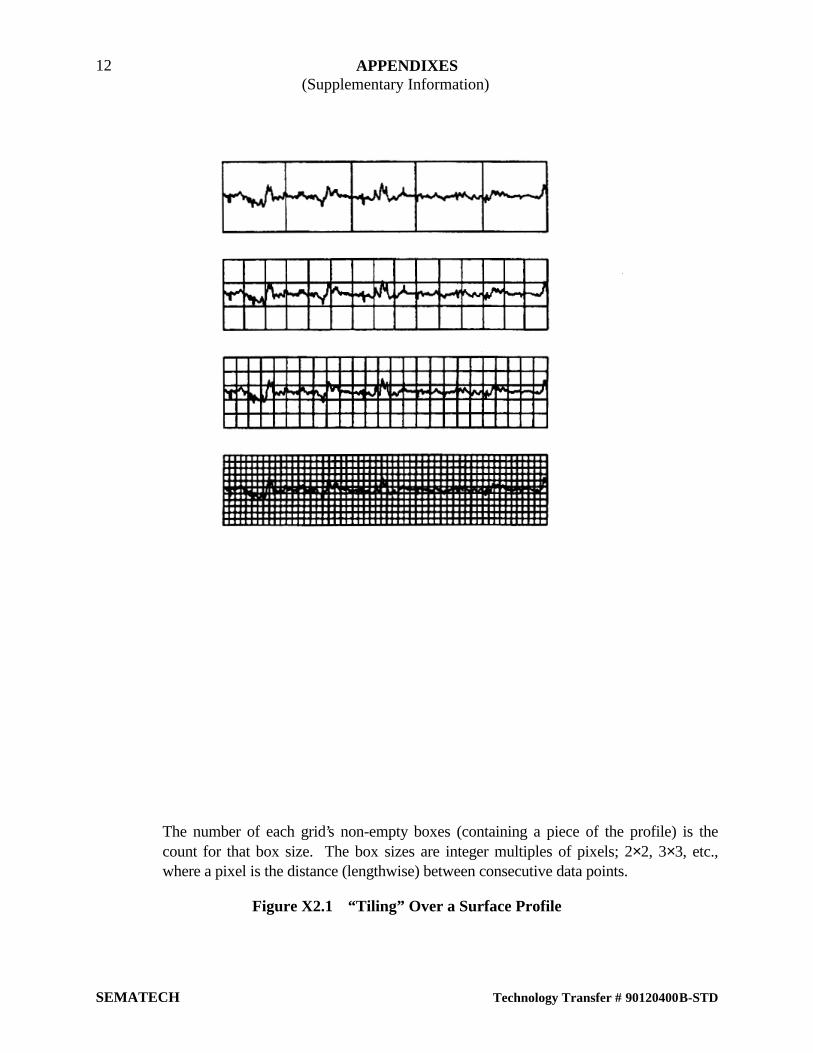
X2.10.1 An explanation of the principles and determination of fractal dimensions can be found inthe reference. The fractal dimensions of surface profiles are approximated by the boxdimensions. Scaling factors are discussed in X.2.10.3. The algorithm used to determinethe box dimension counts the number of boxes which are required to cover, or tile-over,the surface profile. Varying the size of the boxes also varies the ‘profile covering’ count.The relative change in the count versus size is related to the profile’s box dimension. Anexample of what is meant by tiling over a profile with boxes of different sizes is shownin Figure X2.1 for three different box heights.
X2.10.2 Box size—The box size is defined in terms of pixels. A pixel is the width between twoconsecutive profile data points. A square box is defined as one having both height andwidth equal to some N pixels, where N is an integer. The size of the boxes are increasedin steps from 1 to 20, defining a range of box sizes (i.e., box size 1 is a 1 × 1 pixel box,and box size 20 is 20 × 20 pixels).
X2.10.3 Profile Heights—The profile heights are scaled up by a factor of 60 prior to boxcounting. In terms of actual dimensions, the feature heights perceived by the boxes arenow scaled down by a factor of 60; box 1 now sizes features 1/60 µm (.017 µm) high,and box 20 measures features 0.33 µm high.
X2.10.4 Grid—Determination of the most efficient covering arrangement for each box size isapproximated by overlaying the profile with grids of N pixel `mesh' size. Figure X2.1illustrates this for four different mesh sizes. The left edge of the grid is aligned with theleft end of the profile, and the number of nonempty grid squares (i.e., a grid squarecontaining a piece of the profile) is counted for each box size used. Counts of nonemptyboxes are obtained for each grid of 2 × 2, 3 × 3, ..., 20 × 20.
X2.10.5 Box count—The starting location for the profile within the grid is stepped up or downand the count is repeated; the lowest count obtained in this manner for each box size istaken as the best count. The box count is then plotted versus the feature height (back-calculated from the box size and scaling factor) on a log-log scale.

APPENDIXES(Supplementary Information)
Technology Transfer # 90120400B-STD SEMATECH
11
X2.10.6 Slope calculation—Box heights equal to or larger than the profile's tallest feature heightcan be covered in one pass across the grid. In Figure X2.4, the slope at the large end ofthe x–axis is about equal to 1. Each box whose height is in this size range is able to tileover the profile in one pass across the grid. Therefore, the roughness remainsunperceived by these boxes, and the slope in this range is the same as it would be if theprofile were smooth. This range of data should not be included in the overall plot's slopecalculation. The slope of the best straight line over the remaining entire plot is thefractal-based roughness, RF.
Figures X2.3 and X2.4 illustrate the plot of box count against feature size.
An ideally flat surface has a profile that is also perfectly flat and a box count plot slopeof 1. Any deviation from this ideal slope of 1 measures the profile's roughness.
APPENDIXES(Supplementary Information)
SEMATECH Technology Transfer # 90120400B-STD
12
The number of each grid’s non-empty boxes (containing a piece of the profile) is thecount for that box size. The box sizes are integer multiples of pixels; 2×2, 3×3, etc.,where a pixel is the distance (lengthwise) between consecutive data points.
Figure X2.1 “Tiling” Over a Surface Profile

APPENDIXES(Supplementary Information)
Technology Transfer # 90120400B-STD SEMATECH
13
Figure X2.2 is an example of how tiling over with boxes of different sizes results indifferent box counts (length = 1.25 mm, height = 3 µm). The larger boxes do not ‘detect’smaller features. The boxes only detect those features of the same height, or taller. Thefeature size in the log-log plot (Figures X2.3 and X2.4) is the box’s height, back-calculated to micrometers, according to the profile’s scaling factor.
Figure X2.2 Overlaying a Surface Profile with Grids of Different "Mesh" Sizes

APPENDIXES(Supplementary Information)
SEMATECH Technology Transfer # 90120400B-STD
14
Figure X2.3 Fractal Roughness (RF) and Break Points, – 1.05 RF

APPENDIXES(Supplementary Information)
Technology Transfer # 90120400B-STD SEMATECH
15
Figure X2.4 Fractal Roughness (RF) and Break Points, – 1.19 RF
APPENDIXES(Supplementary Information)
SEMATECH Technology Transfer # 90120400B-STD
16
NOTICE: SEMATECH DISCLAIMS ALL WARRANTIES, EXPRESS ORIMPLIED, INCLUDING THE IMPLIED WARRANTIES OF MERCHANTABILITYAND FITNESS FOR A PARTICULAR PURPOSE. SEMATECH MAKES NOWARRANTIES AS TO THE SUITABILITY OF THIS METHOD FOR ANYPARTICULAR APPLICATION. THE DETERMINATION OF THE SUITABILITYOF THIS METHOD IS SOLELY THE RESPONSIBILITY OF THE USER.


SEMATECH Technology Transfer2706 Montopolis Drive
Austin, TX 78741
http://www.sematech.org