selling the tsp: from organizational pain to productivity … · role objectives executive (cxo)...
TRANSCRIPT

All Rights Reserved © Valores Corporativos Softtek S.A. de C.V. 2010.
Selling the TSP: From Organizational Pain
to Productivity GainsAgustín De La Maza
TSP Symposium 2010
Pittsburgh, PA. Sep/2010
Agenda
Softtek’s TSP Implementation Context & Challenges
Sales Cycle & Innovation Adoption Cycle
Selling & Adopting the TSP
Performance Gaps
Relative Advantage / Improved Capabilities
All Rights Reserved © Valores Corporativos Softtek S.A. de C.V. 2010.
Value Justification
Perceptions Management
Implementation Concerns & Objections
Results Analysis
Conclusions
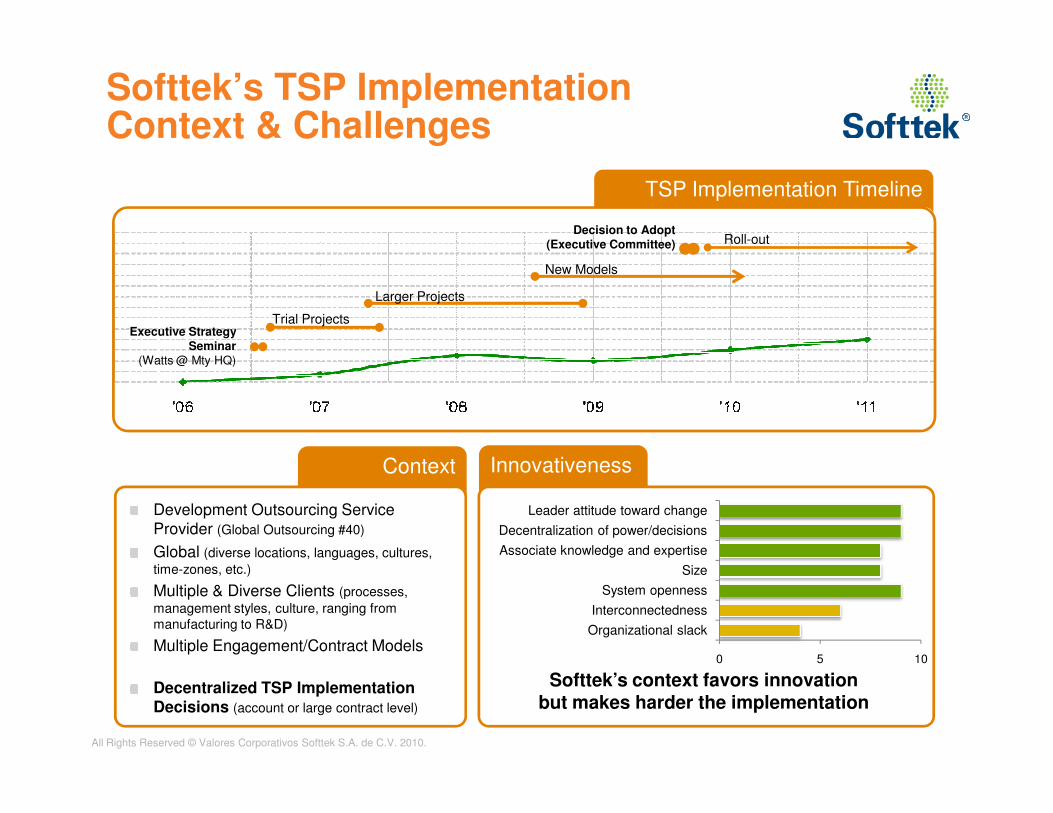
Softtek’s TSP Implementation Context & Challenges
TSP Implementation Timeline
Executive Strategy Seminar
(Watts @ Mty HQ)
Trial Projects
Larger Projects
New Models
Roll-outDecision to Adopt
(Executive Committee)
All Rights Reserved © Valores Corporativos Softtek S.A. de C.V. 2010.
Context
Development Outsourcing Service Provider (Global Outsourcing #40)
Global (diverse locations, languages, cultures,
time-zones, etc.)
Multiple & Diverse Clients (processes,
management styles, culture, ranging from
manufacturing to R&D)
Multiple Engagement/Contract Models
Decentralized TSP Implementation Decisions (account or large contract level)
Innovativeness
Softtek’s context favors innovationbut makes harder the implementation
0 5 10
Organizational slack
Interconnectedness
System openness
Size
Associate knowledge and expertise
Decentralization of power/decisions
Leader attitude toward change

Solution Sales CycleS
ale
s C
ycle Solution
Development
Latent “Pain”
Admitted “Pain”
Vision of Solution
Value Justification
Buyer is not looking for the innovation/solution.Seller “activates” pain/need.
Buyer is looking for a solution to a specific pain/need.
Seller & buyer agree on the desirable “new capabilities”to address the pain/need (vision of solution). Seller demonstrates capability acquisition with a “solution”.
Seller & buyer identify and quantify benefits (in thebuyers context) and solution implementation costs.
All Rights Reserved © Valores Corporativos Softtek S.A. de C.V. 2010.
Sa
les C
ycle
Solution Implementation
Implementation Planning
Sale Closure
Implementation Support
Results Analysis
buyers context) and solution implementation costs.
Buyer identifies consequences of the adoption and risks/concerns about the implementation process.
Seller & buyer negotiate the price and otherimplementation terms. Buyer decides to acquirethe solution.
Seller provides implementation guidance and support to buyer.
Seller performs follow-up analysis on theachievement of the “new capabilities” and benefitsof the implementation.

Situational Fluency
All Rights Reserved © Valores Corporativos Softtek S.A. de C.V. 2010.

Innovation Adoption CycleA
do
ptio
n C
ycle
Innovation Assessment
Awareness
Understanding
Relative Advantage
Cost/Benefit Analysis
Identify the existence of an “innovation” and“filter” it according to current context and needs.
How does it work? Why does it work? Cause-effect analysis.
Will it work for me? Will it be better than my “status quo”?
Quantify benefits and implementation costs within the adopters context.
All Rights Reserved © Valores Corporativos Softtek S.A. de C.V. 2010.
Ad
op
tion
Cycle
Innovation Implementation
Trial orRecommendation
Decision to Adopt / Reject
Implementation
Confirmation
within the adopters context.
Try the innovation on a limited scope or ask for recommendation to “opinion leaders”. Risk analysis.
Is it affordable? Decide to adopt or reject the innovation.
Integrate the innovation into current practice/routine.
Assess the costs and benefits and decideto continue or discontinue implementation.

Synchronization of Sales & Adoption Cycles
Sa
les C
ycle Solution
Development
Latent “Pain”
Admitted “Pain”
Vision of Solution
Value Justification
Ad
op
tion
Cycle
Innovation Assessment
Awareness
Understanding
Relative Advantage
Cost/Benefit Analysis
All Rights Reserved © Valores Corporativos Softtek S.A. de C.V. 2010.
This cycle repeats for each unit of implementation (trials & roll-out)
Sa
les C
ycle
Solution Implementation
ImplementationPlanning
Sale Closure
ImplementationSupport
Results Analysis
Ad
op
tion
Cycle
Innovation Implementation
Cost/Benefit Analysis
Trial orRecommendation
Decision to Adopt / Reject
Implementation
Confirmation

Selling & Adopting the TSP
All Rights Reserved © Valores Corporativos Softtek S.A. de C.V. 2010.

Pains (Performance Gaps)
Loss of market share, sales opportunities, budget or jobs.
Performance Gaps & Innovation AwarenessRoles
Exe
cu
tive
(C
xO
)
Sr.
Ma
na
ge
r (G
DC
Mgr)
Mid
-Ma
na
ge
r (B
RM
/ O
L)
Pro
ject M
gr.
/ T
ea
m L
ea
de
r
Te
am
Me
mb
er
Clie
nt
Role Objectives
Competitiveness * * * * * *
All Rights Reserved © Valores Corporativos Softtek S.A. de C.V. 2010.
Loss of market share, sales opportunities, budget or jobs.
Unreliable EV/Revenue reports, missed deadlines without
warning, defective delivered product.
Project cost over-runs, missed deadlines.
Lack of skilled resources for staffing projects.
Lack of personal commitment (indifference),
lack of empowerment, employee turn-over.
Project or contract cancellation, contractual penalties.
Lack of personal time (damaged relations, sickness,
tiredness)
Competitiveness
Predictability
Profitability
Capabilities Generation
Personal Development & Pride
Customer Satisfaction
Quality of Life
* * * * * *
* * * * *
* * * *
* * *
* * * *
* * * *
* * *

Cost of Poor Cycle-time Estimation Reliable Teamwork
TSP’s Relative Advantage (Improved Capabilities)
All Rights Reserved © Valores Corporativos Softtek S.A. de C.V. 2010.
Cost of Poor Quality
Reduction
Defect density drops to 1/3 of the
original density
Cost of fixing defects detected on FT, ST, UAT and Production drops by 50%
at least
Cycle-time Reduction
Development time remains
unchanged
Number of test-cycles is cut by 30%
Elapsed time on ST and UAT drops
by 50% at least
Estimation Accuracy
On-time delivery for most of the
cycles with formal launch/relaunch
CPI ranging between 0.8
and 1.05
Significant reduction of
after-hours work
Reliable Visibility
Reliable plans (complete,
fine-grained)
Less surprises: EV doesn’t “stall”
or drop during late stages of the
project
Teamwork
Increased team member’s
commitment and ownership
Positive side-effects on
employee satisfaction and turnover rates
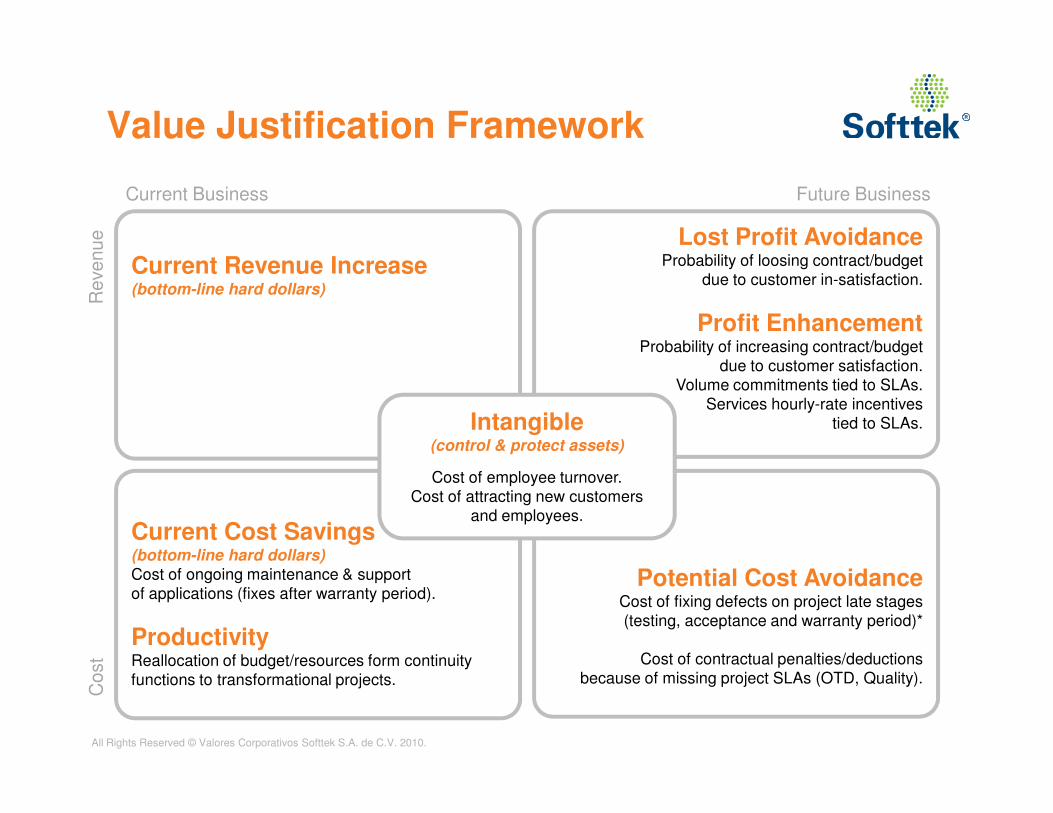
Value Justification Framework
Current Revenue Increase (bottom-line hard dollars)
Lost Profit AvoidanceProbability of loosing contract/budget
due to customer in-satisfaction.
Profit EnhancementProbability of increasing contract/budget
due to customer satisfaction.Volume commitments tied to SLAs.
Services hourly-rate incentives
Current Business Future Business
Revenue
All Rights Reserved © Valores Corporativos Softtek S.A. de C.V. 2010.
Services hourly-rate incentives
tied to SLAs.
Current Cost Savings (bottom-line hard dollars)
Cost of ongoing maintenance & support of applications (fixes after warranty period).
ProductivityReallocation of budget/resources form continuity functions to transformational projects.
Potential Cost AvoidanceCost of fixing defects on project late stages (testing, acceptance and warranty period)*
Cost of contractual penalties/deductionsbecause of missing project SLAs (OTD, Quality).
Intangible(control & protect assets)
Cost of employee turnover.Cost of attracting new customers
and employees.
Cost
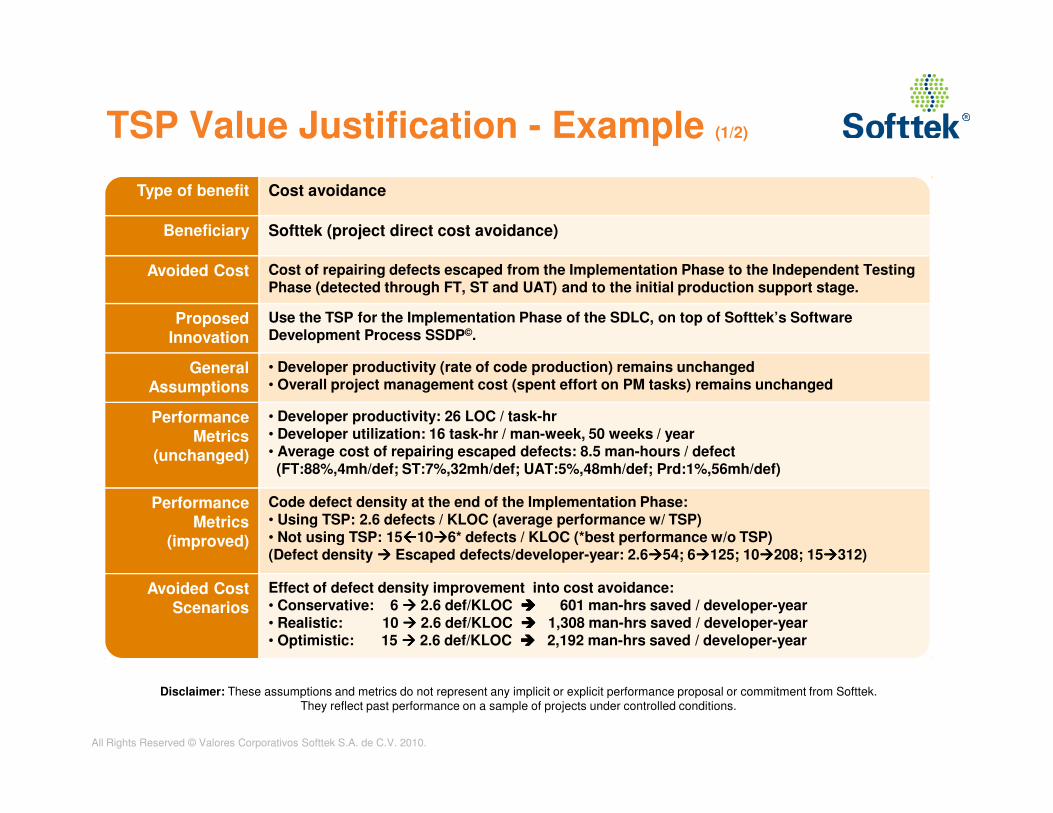
TSP Value Justification - Example (1/2)
Type of benefit Cost avoidance
Beneficiary Softtek (project direct cost avoidance)
Avoided Cost Cost of repairing defects escaped from the Implementation Phase to the Independent Testing Phase (detected through FT, ST and UAT) and to the initial production support stage.
Proposed Innovation
Use the TSP for the Implementation Phase of the SDLC, on top of Softtek’s Software Development Process SSDP©.
General Assumptions
• Developer productivity (rate of code production) remains unchanged• Overall project management cost (spent effort on PM tasks) remains unchanged
All Rights Reserved © Valores Corporativos Softtek S.A. de C.V. 2010.
Performance Metrics
(unchanged)
• Developer productivity: 26 LOC / task-hr• Developer utilization: 16 task-hr / man-week, 50 weeks / year• Average cost of repairing escaped defects: 8.5 man-hours / defect(FT:88%,4mh/def; ST:7%,32mh/def; UAT:5%,48mh/def; Prd:1%,56mh/def)
Performance Metrics
(improved)
Code defect density at the end of the Implementation Phase:• Using TSP: 2.6 defects / KLOC (average performance w/ TSP)• Not using TSP: 15����10����6* defects / KLOC (*best performance w/o TSP)(Defect density ���� Escaped defects/developer-year: 2.6����54; 6����125; 10����208; 15����312)
Avoided Cost Scenarios
Effect of defect density improvement into cost avoidance:• Conservative: 6 ���� 2.6 def/KLOC ���� 601 man-hrs saved / developer-year• Realistic: 10 ���� 2.6 def/KLOC ���� 1,308 man-hrs saved / developer-year• Optimistic: 15 ���� 2.6 def/KLOC ���� 2,192 man-hrs saved / developer-year
Disclaimer: These assumptions and metrics do not represent any implicit or explicit performance proposal or commitment from Softtek.They reflect past performance on a sample of projects under controlled conditions.

TSP Value Justification - Example (2/2)
Implementation Cost (one time)
Cost in man-hours, per developer, prorated to one year period:• Training attendance (PSP Fundamentals): 56 man-hours• Internal Trainer (PSP Fundamentals) (56 hrs, 1.5x cost, 10 attendants/group): 8 man-hours
ImplementationCost (on-going)
Cost in man-hours, per developer, summarized to one year period:• Launches & re-launches attendance (14 days/yr): 112 man-hours• Coach for launches & re-launches (14 days/yr, 7 developers/launch, 2x cost): 32 man-hours• Coach for on-going support (1 hr/developer-week, 2x cost): 100 man-hours
ImplementationCost (total)
Total cost of implementation: 308 man-hours / developer-year Note: some additional indirect costs related to the TSP initiative should be taken into account (coaching structure, support tools, SEI Partnership fees, etc.)
All Rights Reserved © Valores Corporativos Softtek S.A. de C.V. 2010.
Net Benefit Effect of defect density improvement into cost avoidance:• Conservative: 6 ���� 2.6 def/KLOC ���� 293 man-hrs saved / developer-year• Realistic: 10 ���� 2.6 def/KLOC ���� 1,000 man-hrs saved / developer-year• Optimistic: 15 ���� 2.6 def/KLOC ���� 1,884 man-hrs saved / developer-year
Note: To convert these results into hard-dollars, an hourly rate must be applied to the developer man-hour.Note: These benefits can be added to post-production support cost savings and others.
Key Questions What’s your current defect density after the developers deliver their code to the first independent testing group?What’s your average cost of fixing defects once they are detected by an independent testing group on late stages of the project?
Disclaimer: These assumptions and metrics do not represent any implicit or explicit performance proposal or commitment from Softtek.They reflect past performance on a sample of projects under controlled conditions.

Perception of “early adopters”
Relative Advantage:Almost consensus about advantages in software quality and overall project cost & cycle-time improvement.
Compatibility:Compatible with Softtek’s process-oriented culture. Not compatible with previous individual's experiences and beliefs.
Complexity: Need for specific tools, coaching and management support. Needs 2–3 weeks for training and launching the project with the entire team, usually unavailable.
Complexity
Compatibility
Relative Advantage
All Rights Reserved © Valores Corporativos Softtek S.A. de C.V. 2010.
Trialability:Feedback is available short-term after trial projects’ start-up.
Observability:Project overall success or failure was not clearly attributed only to the TSP usage, but also to other combined factors (such as requirements quality and team member seniority).
Cost of implementation: Is perceived as “high” when managers have not attended the seminars and haven’t done their Cost-Benefit Analysis by themselves.
Perception is usually stronger than “objective evidence”
0% 20% 40% 60% 80% 100%
Observability
Trialability
Early adopters’ perception after project conclusion(post-mortem surveys assessing 5 key attributes that
influence the rate of adoption of innovations)

Implementation Concerns & Objections
Reinvent your “Market Offering” to
Customers
Reinvention
Transformation
Examples:External commitment management,
current engagement models,current “rules” don´t allow implementation.
Examples:
Project management style,
All Rights Reserved © Valores Corporativos Softtek S.A. de C.V. 2010.
Change the
“Organizational Culture & Policies”
with Executives
Transformation
Manage goals, resources and priorities with Senior Managers
Management
Project management style, compatibility with previous experiences,
consequences to individuals(discipline, performance visibility &
recognition).
Examples: Team availability, project
schedule/budget availability,implementation support &
overhead.
Results Analysis
Benchmark between TSP and non-TSP projects
The easiest one is “defect density measured by
the first independent-test team”
Use your own performance metrics
to fine-tune your value justification models
“Observability” of results
Recognize successful projects
All Rights Reserved © Valores Corporativos Softtek S.A. de C.V. 2010.
Recognize successful projects
Apply “perception surveys” about the
TSP usage and its benefits
Leverage “diffusion of innovation networks” within the organization
Identify opinion leaders and engage them into
the roll-out program
Make public the opinion of “innovators” and “early adopters”
Pay attention to “informal” communication about
the TSP adoption program
Close the Loop

Conclusions
No pain, no change; each role may have different pains
Use a sales strategy and situational fluency support
Justify benefits in “hard-dollars” to gain executive sponsorship
All Rights Reserved © Valores Corporativos Softtek S.A. de C.V. 2010.
Perception is stronger than “objective data” for the majority of the community; identify opinion leaders and
work on their perception
Deal with implementation concerns & objections at the
proper organizational level
TSP roll-outs are –as any other “diffusion of innovations” initiative–sociologic transformation endeavors and not technical training programs

Questions
Agustín De La Maza
All Rights Reserved © Valores Corporativos Softtek S.A. de C.V. 2010.
Agustín De La MazaApplication Development
Global Practice Manager [email protected]