self-supervised hyperboloid representations from logical
TRANSCRIPT

Self-Supervised Hyperboloid Representations from LogicalQueries over Knowledge Graphs
Nurendra Choudhary1, Nikhil Rao2, Sumeet Katariya2, Karthik Subbian2, Chandan K. Reddy1,21Department of Computer Science, Virginia Tech, Arlington, VA
2Amazon, Palo Alto, [email protected],{nikhilsr,katsumee,ksubbian}@amazon.com,[email protected]
ABSTRACTKnowledge Graphs (KGs) are ubiquitous structures for informationstorage in several real-world applications such as web search, e-commerce, social networks, and biology. Querying KGs remains afoundational and challenging problem due to their size and complex-ity. Promising approaches to tackle this problem include embeddingthe KG units (e.g., entities and relations) in a Euclidean space suchthat the query embedding contains the information relevant to itsresults. These approaches, however, fail to capture the hierarchi-cal nature and semantic information of the entities present in thegraph. Additionally, most of these approaches only utilize multi-hop queries (that can be modeled by simple translation operations)to learn embeddings and ignore more complex operations such asintersection, and union of simpler queries. To tackle such complexoperations, in this paper, we formulate KG representation learningas a self-supervised logical query reasoning problem that utilizestranslation, intersection and union queries over KGs. We proposeHyperboloid Embeddings (HypE), a novel self-supervised dynamicreasoning framework, that utilizes positive first-order existentialqueries on a KG to learn representations of its entities and relationsas hyperboloids in a Poincaré ball. HypE models the positive first-order queries as geometrical translation, intersection, and union.For the problem of KG reasoning in real-world datasets, the pro-posed HypE model significantly outperforms the state-of-the artresults. We also apply HypE to an anomaly detection task on a popu-lar e-commerce website product taxonomy as well as hierarchicallyorganized web articles and demonstrate significant performanceimprovements compared to existing baseline methods. Finally, wealso visualize the learned HypE embeddings in a Poincaré ball toclearly interpret and comprehend the representation space.
CCS CONCEPTS• Computing methodologies→ Reasoning about belief andknowledge; Knowledge representation and reasoning; Representa-tion of mathematical objects.
KEYWORDSRepresentation learning, knowledge graphs, hyperbolic space, rea-soning queries
This paper is published under the Creative Commons Attribution 4.0 International(CC-BY 4.0) license. Authors reserve their rights to disseminate the work on theirpersonal and corporate Web sites with the appropriate attribution.WWW ’21, April 19–23, 2021, Ljubljana, Slovenia© 2021 IW3C2 (International World Wide Web Conference Committee), publishedunder Creative Commons CC-BY 4.0 License.ACM ISBN 978-1-4503-8312-7/21/04.https://doi.org/10.1145/3442381.3449974
ACM Reference Format:Nurendra Choudhary1, Nikhil Rao2, Sumeet Katariya2, Karthik Subbian2,Chandan K. Reddy1,2. 2021. Self-Supervised Hyperboloid Representationsfrom Logical Queries over Knowledge Graphs. In Proceedings of the WebConference 2021 (WWW ’21), April 19–23, 2021 ,Ljubljana, Slovenia. ACM,New York, NY, USA, 12 pages. https://doi.org/10.1145/3442381.3449974
1 INTRODUCTIONKnowledge Graphs (KGs) organize information as a set of enti-ties connected by relations. Positive first-order existential (PFOE)queries such as translation, intersection, and union over these enti-ties aid in effective information extraction from massive data (seeFigure 1 for an example PFOE query). Efficient handling of suchqueries on KGs is of vital importance in a range of real-world ap-plication domains including search engines, dialogue systems, andrecommendation models. However, the large size of KGs and highdegrees of the nodes therein makes traversal for querying a com-putationally challenging or, in some cases, even an impossible task[43]. One way to resolve this issue is to learn representations forthe KG units (entities and relations) in a latent (generally Euclidean)space such that algebraic or logical operations can be applied toextract relevant entities. Robust representation learning of KG unitshas several real-world applications including KG information ex-traction [20], entity classification [46], and anomaly detection [22].
Figure 1: An example of PFOE querying in the E-commerceproduct network. The product space of Adidas and Nike in-tersects with Footwear to narrow the search space. A unionover these spaces yields our final set of entity results.
Earlier approaches to representation learning in KGs model enti-ties and relations as vectors in the Euclidean space [7, 31, 48]. Thisis suboptimal due to the constant size of a point’s answer spacewhich does not capture the variations induced by different queries.Specifically, broad queries (Nike) should intuitively cover a largerregion of the answer space compared to specific queries (Nikerunning shoes for men). In the recently proposed Query2Boxmodel [35], the authors demonstrated the effectiveness of complexgeometries (such as hyper-rectangles) with varying offsets that con-trol the size of an answer space according to a query’s complexity.
arX
iv:2
012.
1302
3v2
[cs
.LG
] 1
5 Fe
b 20
21
WWW ’21, April 19–23, 2021, Ljubljana, Slovenia Choudhary et al.
However, such architectures lack the ability to capture hierarchicalinformation that is prevalent in many KGs. Furthermore, previousrepresentation learning methods in heterogeneous graphs (or KGs)[16, 25, 26, 51] solely focus on one-hop or multi-hop reasoning overrelations. Such frameworks enable static and optimized computa-tional graphs, but lead to poor retrieval from complex intersectionand union queries. Dynamic computational graphs, which are ableto modify their network architecture with a switch mechanism(discussed in Section 3.5) can significantly alleviate this problem.
Although Euclidean spaces have proven to be effective for rep-resentation learning in various domains [3], several hierarchicaldatasets (including graph data) in the fields of network sciencesand E-commerce taxonomies demonstrate a latent non-Euclideananatomy [8]. The introduction of hyperbolic algebraic operations[17] have led to the proliferation of hyperbolic neural networkssuch as Hyperbolic-GCN (H-GCN) [12] and Hyperbolic Attention(HAT) networks [19]. These frameworks leverage the hyperbolicanatomy of hierarchical datasets and show a significant perfor-mance boost compared to their Euclidean counterparts. To the bestof our knowledge, there is no existing work that (i) utilizes dy-namic computational graphs on the hyperbolic space, (ii) appliescomplex hyperbolic geometries such as hyperboloids for represen-tation learning. Additionally, the static computational graphs ofH-GCN and HAT limit their learning capability to a single prob-lem, generally, multi-hop (translation) reasoning. This severelylimits their applicability to representation learning on KGs sincetranslations can only utilize single entities. More complex inter-sections and unions not only use more entities, but are alsomore representative of real-world KG queries.While solvingunion and intersection queries is more challenging, they enablebetter representation learning [4]. Traversing over the entities inKGs facilitates an intuitive way of constructing a query-reasoningproxy task (refer Section 4.3) that enables representation learningof entities and relations. These representations, in a self-supervisedframework, can further provide enriched features in downstreamtasks with smaller annotated datasets (such as anomaly detection),thus alleviating the issue of data scarcity.
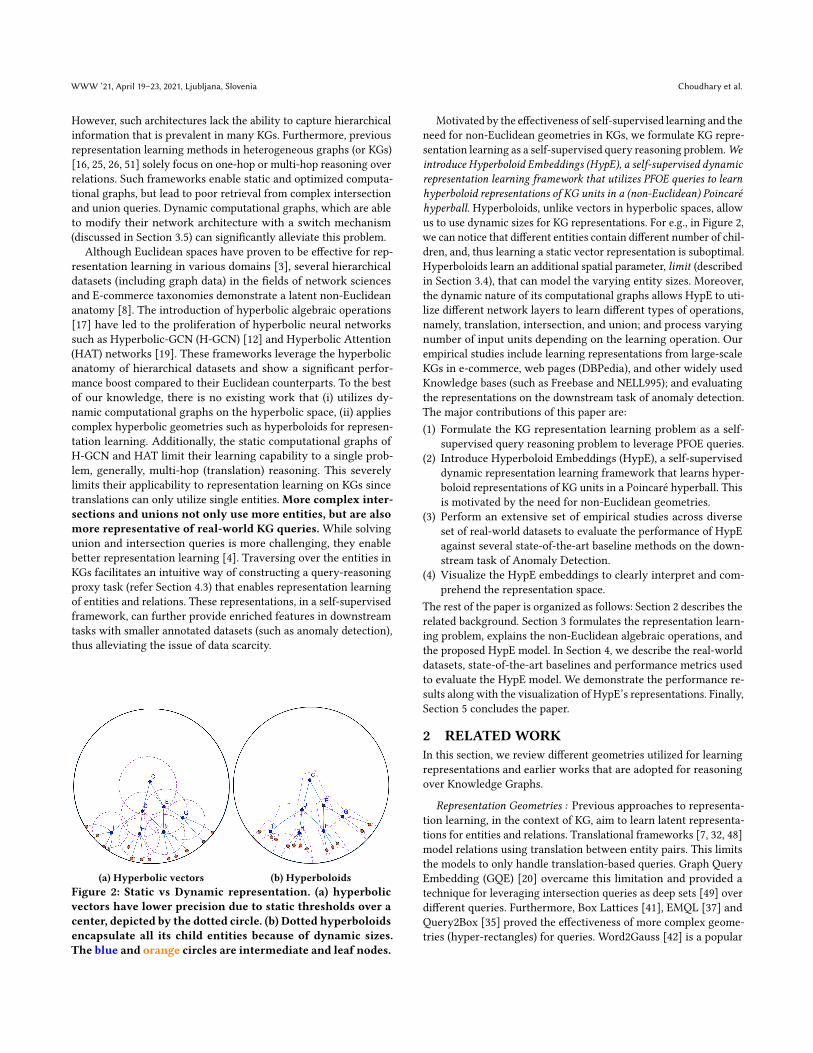
(a) Hyperbolic vectors (b) HyperboloidsFigure 2: Static vs Dynamic representation. (a) hyperbolicvectors have lower precision due to static thresholds over acenter, depicted by the dotted circle. (b) Dotted hyperboloidsencapsulate all its child entities because of dynamic sizes.The blue and orange circles are intermediate and leaf nodes.
Motivated by the effectiveness of self-supervised learning and theneed for non-Euclidean geometries in KGs, we formulate KG repre-sentation learning as a self-supervised query reasoning problem.Weintroduce Hyperboloid Embeddings (HypE), a self-supervised dynamicrepresentation learning framework that utilizes PFOE queries to learnhyperboloid representations of KG units in a (non-Euclidean) Poincaréhyperball. Hyperboloids, unlike vectors in hyperbolic spaces, allowus to use dynamic sizes for KG representations. For e.g., in Figure 2,we can notice that different entities contain different number of chil-dren, and, thus learning a static vector representation is suboptimal.Hyperboloids learn an additional spatial parameter, limit (describedin Section 3.4), that can model the varying entity sizes. Moreover,the dynamic nature of its computational graphs allows HypE to uti-lize different network layers to learn different types of operations,namely, translation, intersection, and union; and process varyingnumber of input units depending on the learning operation. Ourempirical studies include learning representations from large-scaleKGs in e-commerce, web pages (DBPedia), and other widely usedKnowledge bases (such as Freebase and NELL995); and evaluatingthe representations on the downstream task of anomaly detection.The major contributions of this paper are:(1) Formulate the KG representation learning problem as a self-
supervised query reasoning problem to leverage PFOE queries.(2) Introduce Hyperboloid Embeddings (HypE), a self-supervised
dynamic representation learning framework that learns hyper-boloid representations of KG units in a Poincaré hyperball. Thisis motivated by the need for non-Euclidean geometries.
(3) Perform an extensive set of empirical studies across diverseset of real-world datasets to evaluate the performance of HypEagainst several state-of-the-art baseline methods on the down-stream task of Anomaly Detection.
(4) Visualize the HypE embeddings to clearly interpret and com-prehend the representation space.
The rest of the paper is organized as follows: Section 2 describes therelated background. Section 3 formulates the representation learn-ing problem, explains the non-Euclidean algebraic operations, andthe proposed HypE model. In Section 4, we describe the real-worlddatasets, state-of-the-art baselines and performance metrics usedto evaluate the HypE model. We demonstrate the performance re-sults along with the visualization of HypE’s representations. Finally,Section 5 concludes the paper.
2 RELATEDWORKIn this section, we review different geometries utilized for learningrepresentations and earlier works that are adopted for reasoningover Knowledge Graphs.
Representation Geometries : Previous approaches to representa-tion learning, in the context of KG, aim to learn latent representa-tions for entities and relations. Translational frameworks [7, 32, 48]model relations using translation between entity pairs. This limitsthe models to only handle translation-based queries. Graph QueryEmbedding (GQE) [20] overcame this limitation and provided atechnique for leveraging intersection queries as deep sets [49] overdifferent queries. Furthermore, Box Lattices [41], EMQL [37] andQuery2Box [35] proved the effectiveness of more complex geome-tries (hyper-rectangles) for queries. Word2Gauss [42] is a popular
Self-Supervised Hyperboloid Representations from Logical Queries over Knowledge Graphs WWW ’21, April 19–23, 2021, Ljubljana, Slovenia
NLP technique that learns Gaussian embeddings for words. DNGE[39] utilizes a dynamic network to learn Gaussian embeddings forentities in a graph. These Gaussian representations cannot be in-tuitively extended to KGs because they are not closed under morecomplex PFOE queries (intersection or union of Gaussians does notyield a Gaussian). Furthermore, they rely on properties of the Eu-clidean space to learn representations, which are proven ineffectiveat capturing the prevalent hierarchical features of a KG [17].
Representation Learning on Graphs : One of the fundamentalproblems in KG is to aggregate the neighbor information of nodeswhile learning representations. Node embedding techniques suchas Node2Vec [18] and DeepWalk [34] aggregate the neighbors’ fea-tures by modeling the node’s dependence on its neighbors. Cheb-Net [13] uses Chebyshev ploynomials and filters node features inthe graph Fourier domain. GCN [23] constrains the parameters ofChebNet to alleviate overfitting and shows improved performance.Graph-BERT [51] and MAGNN [16] provide a self-supervised learn-ing model utilizing the tasks of masking and metapath aggregation,respectively. In another line of research, Miller et al. [28] utilizesnon-parametric Bayesian frameworks for link prediction on socialnetworks. Zhu [52] further improved the approach with a max-margin framework. KGAT [44] is another popular approach thatutilizes attention networks over entities and relations with a TransR[24] loss function to learn representations for user recommendation.These methods rely on relational properties and thus are effective inhandling translational problems such as multi-hop reasoning. How-ever, they are ineffective at handling more complex PFOE queriessuch as intersection and union.
Other popular multi-hop graph networks such as Graph Atten-tion Network (GAT) [40] and Graph Recurrent Network (GRN) [36]have previously shown impressive results in reasoning-based QAtasks. However, hyperbolic flavors of these networks, H-GNN [17],H-GCN [11, 12] and H-GAT [19] argue that hierarchical datasetsfollow the anatomy of hyperbolic space and show improved per-formance over their Euclidean counterparts. Nonetheless, theseapproaches are still limited by the constant answer space that doesnot consider the varying fluctuations of complex queries.
Self-supervised learning [14, 21, 29, 47] utilizes large unanno-tated datasets to learn representations that can be fine-tuned toother tasks that have relatively smaller amount of annotated data.Traversing over the entities in KGs facilitates an intuitive way ofconstructing a query-reasoning proxy task (refer Section 4.3) thatenables representation learning of entities and relations. Theserepresentations, in turn, are employed in downstream tasks withscarce datasets such as anomaly detection.
The proposed HypE model utilizes a self-supervised learningframework that leverages both simple and complex PFOE queries tolearn hyperboloid (with varying limits) representations of KG unitsin a Poincaré ball to efficiently capture hierarchical information.
3 PROPOSED FRAMEWORKIn this section, we first provide the standard method of queryingknowledge graphs. Then, we set up the problem and describe thedetails of our model that learns representations of entities andrelations from reasoning queries over Knowledge Graphs (KG).
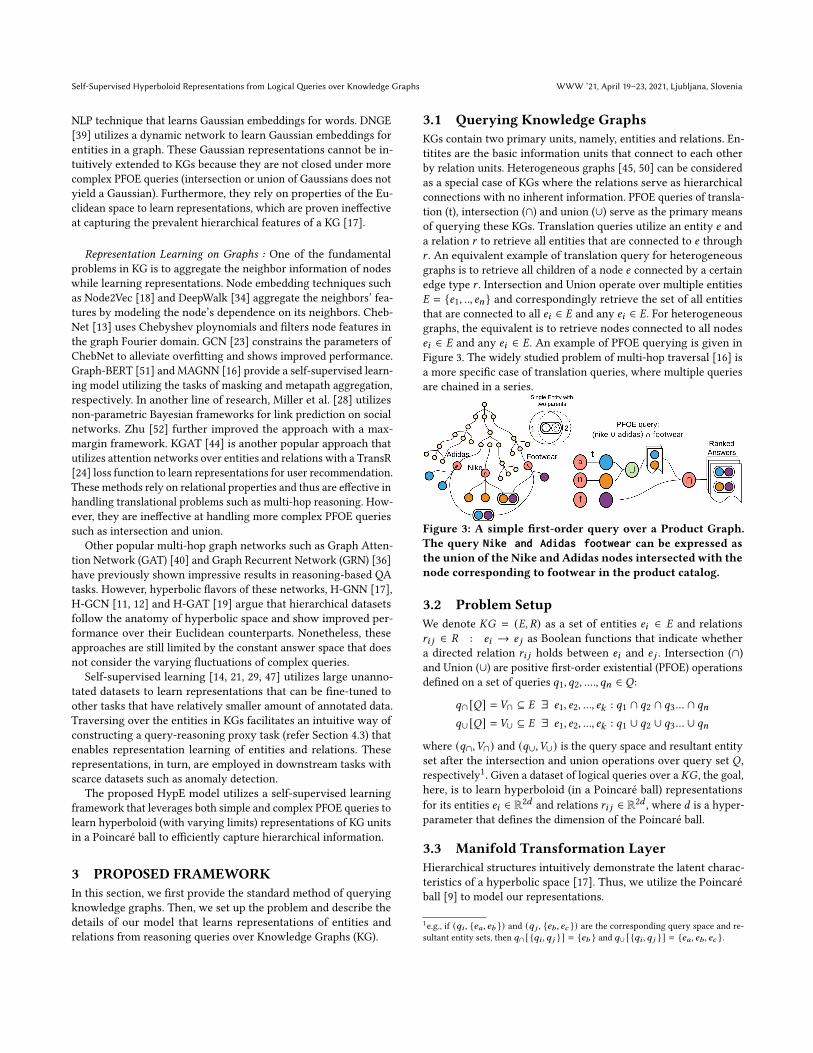
3.1 Querying Knowledge GraphsKGs contain two primary units, namely, entities and relations. En-titites are the basic information units that connect to each otherby relation units. Heterogeneous graphs [45, 50] can be consideredas a special case of KGs where the relations serve as hierarchicalconnections with no inherent information. PFOE queries of transla-tion (t), intersection (∩) and union (∪) serve as the primary meansof querying these KGs. Translation queries utilize an entity 𝑒 anda relation 𝑟 to retrieve all entities that are connected to 𝑒 through𝑟 . An equivalent example of translation query for heterogeneousgraphs is to retrieve all children of a node 𝑒 connected by a certainedge type 𝑟 . Intersection and Union operate over multiple entities𝐸 = {𝑒1, .., 𝑒𝑛} and correspondingly retrieve the set of all entitiesthat are connected to all 𝑒𝑖 ∈ 𝐸 and any 𝑒𝑖 ∈ 𝐸. For heterogeneousgraphs, the equivalent is to retrieve nodes connected to all nodes𝑒𝑖 ∈ 𝐸 and any 𝑒𝑖 ∈ 𝐸. An example of PFOE querying is given inFigure 3. The widely studied problem of multi-hop traversal [16] isa more specific case of translation queries, where multiple queriesare chained in a series.
Figure 3: A simple first-order query over a Product Graph.The query Nike and Adidas footwear can be expressed asthe union of the Nike and Adidas nodes intersected with thenode corresponding to footwear in the product catalog.
3.2 Problem SetupWe denote 𝐾𝐺 = (𝐸, 𝑅) as a set of entities 𝑒𝑖 ∈ 𝐸 and relations𝑟𝑖 𝑗 ∈ 𝑅 : 𝑒𝑖 → 𝑒 𝑗 as Boolean functions that indicate whethera directed relation 𝑟𝑖 𝑗 holds between 𝑒𝑖 and 𝑒 𝑗 . Intersection (∩)and Union (∪) are positive first-order existential (PFOE) operationsdefined on a set of queries 𝑞1, 𝑞2, ...., 𝑞𝑛 ∈ 𝑄 :
𝑞∩ [𝑄] = 𝑉∩ ⊆ 𝐸 ∃ 𝑒1, 𝑒2, ..., 𝑒𝑘 : 𝑞1 ∩ 𝑞2 ∩ 𝑞3 ... ∩ 𝑞𝑛𝑞∪ [𝑄] = 𝑉∪ ⊆ 𝐸 ∃ 𝑒1, 𝑒2, ..., 𝑒𝑘 : 𝑞1 ∪ 𝑞2 ∪ 𝑞3 ... ∪ 𝑞𝑛
where (𝑞∩,𝑉∩) and (𝑞∪,𝑉∪) is the query space and resultant entityset after the intersection and union operations over query set 𝑄 ,respectively1. Given a dataset of logical queries over a 𝐾𝐺 , the goal,here, is to learn hyperboloid (in a Poincaré ball) representationsfor its entities 𝑒𝑖 ∈ R2𝑑 and relations 𝑟𝑖 𝑗 ∈ R2𝑑 , where 𝑑 is a hyper-parameter that defines the dimension of the Poincaré ball.
3.3 Manifold Transformation LayerHierarchical structures intuitively demonstrate the latent charac-teristics of a hyperbolic space [17]. Thus, we utilize the Poincaréball [9] to model our representations.
1e.g., if (𝑞𝑖 , {𝑒𝑎, 𝑒𝑏 }) and (𝑞 𝑗 , {𝑒𝑏 , 𝑒𝑐 }) are the corresponding query space and re-sultant entity sets, then 𝑞∩ [ {𝑞𝑖 , 𝑞 𝑗 }] = {𝑒𝑏 } and 𝑞∪ [ {𝑞𝑖 , 𝑞 𝑗 }] = {𝑒𝑎, 𝑒𝑏 , 𝑒𝑐 }.

WWW ’21, April 19–23, 2021, Ljubljana, Slovenia Choudhary et al.
Figure 4: Manifold Transformation of Euclidean geometries(rectangles) to a Poincaré ball (horocycle enclosures).
3.3.1 Transformation from Euclidean Space. The transformationfrom Euclidean to hyperbolic space (H𝑛, 𝑔H), given in [17], is de-fined by the manifold H𝑛 = {𝑥 ∈ R𝑛 : ∥𝑥 ∥ < 1} with the Reiman-nian metric , 𝑔H, where:
𝑔H𝑥 = _2𝑥 𝑔E where _𝑥 B2
1 − ∥𝑥 ∥2(1)
𝑔E = I𝑛 being the Euclidean identity metric tensor, and ∥𝑥 ∥ is theEuclidean norm of 𝑥 . _𝑥 is the conformal factor between the Eu-clidean and hyperbolic metric tensor set to a conventional curvatureof -1. Eq. (1) allows us to convert a Euclidean metric to hyperbolic.Thus, the distance between points 𝑥,𝑦 ∈ H𝑛 is derived as:
𝑑H (𝑥,𝑦) = cosh−1(1 + 2 ∥𝑥 − 𝑦∥2(
1 − ∥𝑥 ∥2) (1 − ∥𝑦∥2
) ) (2)
3.3.2 Gyrovector Spaces. Algebraic operations such as addition andscalar product which are straightforward in the Euclidean spacecannot be directly applied in hyperbolic space. Gyrovector spacesallow for the formalization of these operations in hyperbolic space.
Ganea et al. [17] provide the gyrovector operations relevant totraining neural networks. The gyrovector operations for Poincaréball of radius 𝑐 are Möbius addition (⊕𝑐 ), Möbius subtraction (⊖𝑐 ),exponential map (exp𝑐𝑥 ), logarithmic map (log𝑐𝑥 ) and Möbius scalarproduct (⊙𝑐 ).
𝑥 ⊕𝑐 𝑦 B(1 + 2𝑐 ⟨𝑥,𝑦⟩ + 𝑐 ∥𝑦∥2
)𝑥 +
(1 − 𝑐 ∥𝑥 ∥2
)𝑦
1 + 2𝑐 ⟨𝑥,𝑦⟩ + 𝑐2∥𝑥 ∥2∥𝑦∥2𝑥 ⊖𝑐 𝑦 B 𝑥 ⊕𝑐 −𝑦
exp𝑐𝑥 (𝑣) B 𝑥 ⊕𝑐(tanh
(√𝑐_𝑐𝑥 ∥𝑣 ∥
2
)𝑣
√𝑐 ∥𝑣 ∥
)log𝑐𝑥 (𝑦) B
2√𝑐_𝑐𝑥
tanh−1(√𝑐 ∥ − 𝑥 ⊕𝑐 𝑦∥
) −𝑥 ⊕𝑐 𝑦∥ − 𝑥 ⊕𝑐 𝑦∥
𝑟 ⊙𝑐 𝑥 B exp𝑐0 (𝑟𝑙𝑜𝑔𝑐0 (𝑥)), ∀𝑟 ∈ R, 𝑥 ∈ H
𝑛𝑐
Here,B denotes assignment operation for Möbius operations. Also,the norm of 𝑥,𝑦 can subsume the scaling factor 𝑐 . Hence, in HypE,training can be done with a constant 𝑐 or trainable 𝑐 . We empiricallyvalidate this assumption in our experiments (Section 4.4). Figure 4shows an example of the manifold transformation from Euclideanspace to a Poincaré ball of unit radius. HypE extends the operationsto handle complex geometries, explained in Section 3.4.
3.4 Dynamic Reasoning Framework : HypEWe aim to learn hyperboloid (made of two parallel pairs of arc-aligned horocycles) embeddings for all the entities and relationsin the KG. An arc-aligned horocyle (Figure 5(a)) is a partial circlethat is parallel to the diameter of a Poincaré ball and orthogonally
(a) Horocycles in a Poincaré ball. (b) CDFE is the hyperboloid.Figure 5: Horocycles and hyperboloids in a Poincaré ball.The hyperboloid is composed of two parallel pairs of arc-aligned horocycles.
Figure 6: An overview of the proposed HypE architec-ture. The architecture utilizes a switch mechanism to con-nect/disconnect different layers according to the query oper-ator signal (t,∩,∪). The blue, red and green switches are con-nected for translation, intersection and union operations,respectively (and disconnected otherwise). The yellow andpink circles depict the center and limit of KG units, respec-tively. This figure is best viewed in color.
intersects its boundaries at two points. A hyperboloid embedding(see Figure 5(b)) 𝑒 = (cen(𝑒), lim(𝑒)) ∈ R2𝑑 is characterized by:
𝐻𝑒 == {𝑣 ∈ R𝑑 : cen(𝑒) ⊖𝑐 lim(𝑒) ≤ 𝑣 ≤ cen(𝑒) ⊕𝑐 lim(𝑒)}
where == denotes strict equivalence and ≤ is element-wise inequalityand cen(𝑡), lim(𝑡) ∈ R𝑑 are center of the hyperboloid and positiveborder limit (lim(𝑡) ≥ 0) of the enclosing horocycle from the center,respectively. The overview of the architecture is given in Figure6. From the KG, we derive the following types of directed edgerelations to build our dynamic computational graph for learningembeddings.
Self-Supervised Hyperboloid Representations from Logical Queries over Knowledge Graphs WWW ’21, April 19–23, 2021, Ljubljana, Slovenia
Distance between hyperboloid and entity point (d): Given aquery hyperboloid 𝑞 ∈ R2𝑑 and entity center 𝑣 ∈ R𝑑 , the distancebetween them is defined as:
𝑑ℎ𝑦𝑝 (𝑣, 𝑞) = 𝑑𝑜𝑢𝑡 (𝑣, 𝑞) ⊕𝑐 𝛾𝑑𝑖𝑛 (𝑣, 𝑞) (3)𝑑𝑜𝑢𝑡 (𝑣, 𝑞) = ∥𝑀𝑎𝑥 (𝑑H (𝑣, 𝑞𝑚𝑎𝑥 ), 0) +𝑀𝑎𝑥 (𝑑H (𝑞𝑚𝑖𝑛, 𝑣), 0)∥1𝑑𝑖𝑛 (𝑣, 𝑞) = ∥𝑐𝑒𝑛(𝑞) ⊖𝑐 𝑀𝑖𝑛(𝑞𝑚𝑎𝑥 , 𝑀𝑎𝑥 (𝑞𝑚𝑖𝑛, 𝑣))∥1
𝑞𝑚𝑖𝑛 = 𝑐𝑒𝑛(𝑞) ⊖𝑐 𝑙𝑖𝑚(𝑞), 𝑞𝑚𝑎𝑥 = 𝑐𝑒𝑛(𝑞) ⊕𝑐 𝑙𝑖𝑚(𝑞)where 𝑑𝑜𝑢𝑡 represents the distance of the entity to limits of thehyperboloid and 𝑑𝑖𝑛 is the distance of the entity from the hyper-boloid’s border to its center. 𝛾 is a scalar weight (set to 0.5 in ourexperiments) and ∥𝑥 ∥1 is the 𝐿1-norm of x.Translation (t): Each relation 𝑟 ∈ 𝑅 is equipped with a relationembedding 𝑟 = 𝐻𝑦𝑝𝑒𝑟𝑏𝑜𝑙𝑜𝑖𝑑𝑟 ∈ R2𝑑 . Given an entity embedding𝑒 ∈ 𝐸, we model its translation (𝑜𝑡 ) and distance from the resultentities 𝑣𝑡 ∈ 𝑉𝑡 ⊆ 𝐸 (𝑑𝑡 ) as follows:
𝑜𝑡 = 𝑒 ⊕𝑐 𝑟, 𝑑𝑡 (𝑣) = 𝑑ℎ𝑦𝑝 (𝑣𝑡 , 𝑜𝑡 ) (4)
This provides us with the translated hyperboloid with a new centerand larger limit (lim(𝑟 ) ≥ 0). A sample operation is illustrated inFigure 7(a).Intersection (∩):Wemodel the intersection of a set of hyperboloidembeddings 𝑄∩ = {𝑒1, 𝑒2, 𝑒3, ..., 𝑒𝑛} as 𝑜∩ and entity distance fromthe result entities 𝑣∩ ∈ 𝑉∩ ⊆ 𝐸 as 𝑑∩ where:
𝑜∩ = (cen(𝑄∩), lim(𝑄∩)) (5)
cen(𝑄∩) =∑︁𝑖
𝑎𝑖 ⊙𝑐 cen(𝑒𝑖 ); 𝑎𝑖 =exp(𝑓 (𝑒𝑖 ))∑𝑗 exp(𝑓 (𝑒𝑖 )
(6)
lim(𝑄∩) = min({lim(𝑒1), ..., lim(𝑒𝑛)}) ⊙𝑐 𝜎 (𝐷𝑆 ({𝑒1, ..., 𝑒𝑛}))
𝐷𝑆 ({𝑒1, .., 𝑒𝑛}) = 𝑓(1𝑛
𝑛∑︁𝑖=1
𝑓 (𝑒𝑖 ))
(7)
𝑑∩ (𝑣∩) = 𝑑ℎ𝑦𝑝 (𝑣∩, 𝑜∩) (8)
where ⊙𝑐 is the Möbius scalar product, 𝑓 (.) : R2𝑑 → R𝑑 is themultilayer perceptron (MLP), 𝜎 (.) is the sigmoid function and𝐷𝑆 (.)is the permutation invariant deep architecture, namely, DeepSets[49].𝑀𝑖𝑛(.) and exp(.) are element-wise minimum and exponentialfunctions. The new center and limit are calculated by an attentionlayer [1] over the hyperboloid centers and DeepSets for shrinkingthe limits, respectively. Figure 7(b) depicts a sample intersection.Union (∪): Unlike intersection, union operations are not closedunder hyperboloids (union of hyperboloids is not a hyperboloid).Hence, the distance of entities from the union query space (𝑑∪) isdefined as theminimum distance from any hyperboloid in the union.For a set of hyperboloid embeddings 𝑄∪ = {𝑒1, 𝑒2, 𝑒3, ..., 𝑒𝑛}, unionspace is given by 𝑜∪ and distance from result entities 𝑣∪ ∈ 𝑉∪ ⊆ 𝐸by 𝑑∪, where
𝑜∪ = 𝑄∪ (9)
𝑑∪ (𝑣∪) = min({𝑑ℎ𝑦𝑝 (𝑣∪, 𝑒𝑖 ) ∀𝑒𝑖 ∈ 𝑜∪}
)(10)
Note that, since union is not closed under hyperboloids it cannot beapplied before the other operations. We circumvent this problem byutilizing Disjunctive Normal Form (DNF) transformation [35] onour logical queries. This allows us to push all the union operations
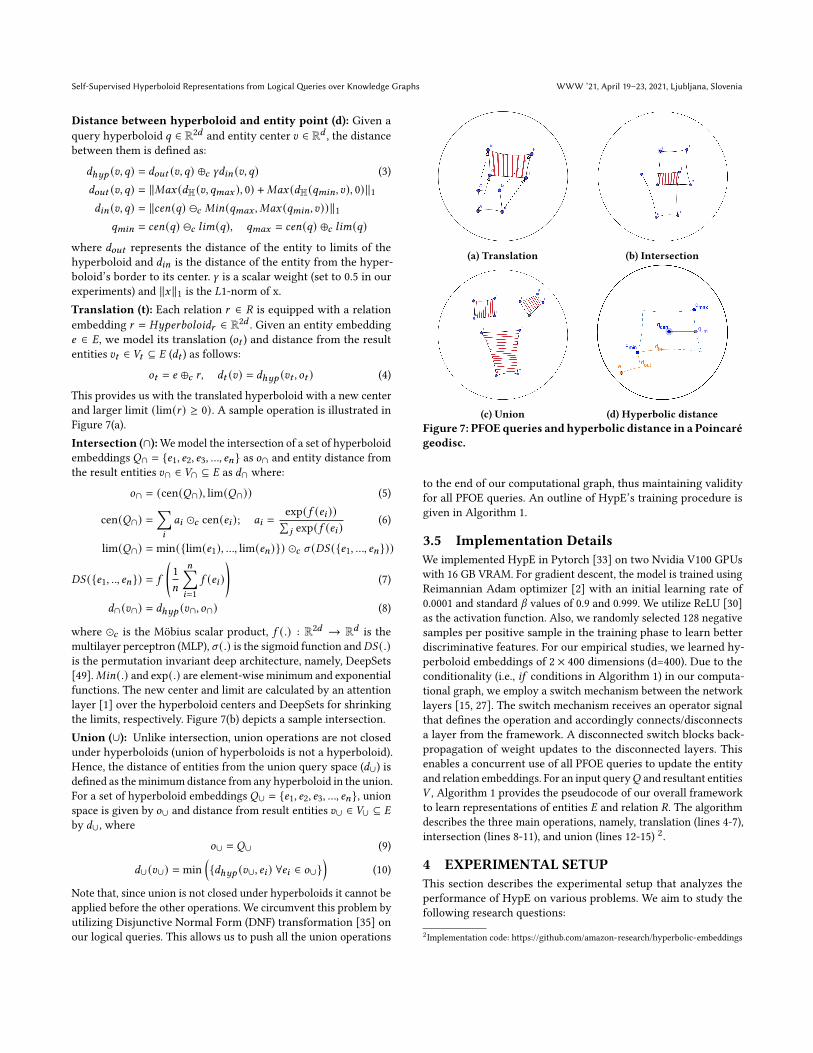
(a) Translation (b) Intersection
(c) Union (d) Hyperbolic distanceFigure 7: PFOEqueries andhyperbolic distance in a Poincarégeodisc.
to the end of our computational graph, thus maintaining validityfor all PFOE queries. An outline of HypE’s training procedure isgiven in Algorithm 1.
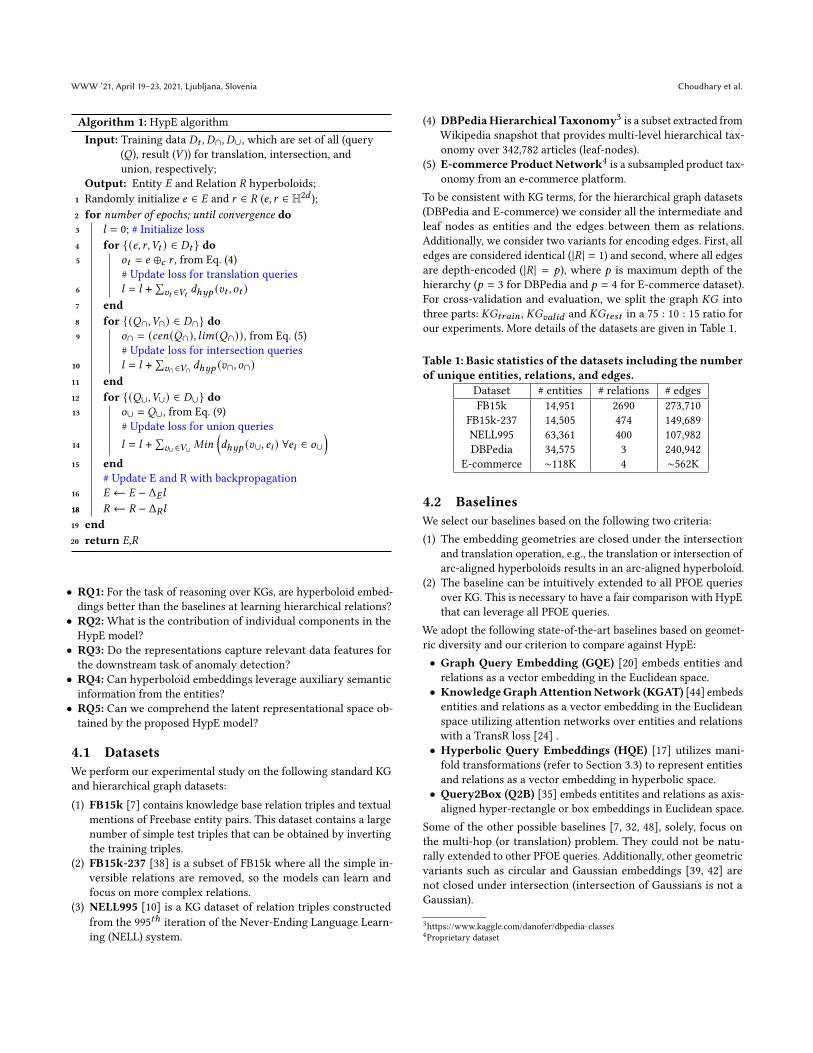
3.5 Implementation DetailsWe implemented HypE in Pytorch [33] on two Nvidia V100 GPUswith 16 GB VRAM. For gradient descent, the model is trained usingReimannian Adam optimizer [2] with an initial learning rate of0.0001 and standard 𝛽 values of 0.9 and 0.999. We utilize ReLU [30]as the activation function. Also, we randomly selected 128 negativesamples per positive sample in the training phase to learn betterdiscriminative features. For our empirical studies, we learned hy-perboloid embeddings of 2 × 400 dimensions (d=400). Due to theconditionality (i.e., if conditions in Algorithm 1) in our computa-tional graph, we employ a switch mechanism between the networklayers [15, 27]. The switch mechanism receives an operator signalthat defines the operation and accordingly connects/disconnectsa layer from the framework. A disconnected switch blocks back-propagation of weight updates to the disconnected layers. Thisenables a concurrent use of all PFOE queries to update the entityand relation embeddings. For an input query𝑄 and resultant entities𝑉 , Algorithm 1 provides the pseudocode of our overall frameworkto learn representations of entities 𝐸 and relation 𝑅. The algorithmdescribes the three main operations, namely, translation (lines 4-7),intersection (lines 8-11), and union (lines 12-15) 2.
4 EXPERIMENTAL SETUPThis section describes the experimental setup that analyzes theperformance of HypE on various problems. We aim to study thefollowing research questions:2Implementation code: https://github.com/amazon-research/hyperbolic-embeddings
WWW ’21, April 19–23, 2021, Ljubljana, Slovenia Choudhary et al.
Algorithm 1: HypE algorithmInput: Training data 𝐷𝑡 , 𝐷∩, 𝐷∪, which are set of all (query
(𝑄), result (𝑉 )) for translation, intersection, andunion, respectively;
Output: Entity 𝐸 and Relation 𝑅 hyperboloids;1 Randomly initialize 𝑒 ∈ 𝐸 and 𝑟 ∈ 𝑅 (𝑒, 𝑟 ∈ H2𝑑 );2 for number of epochs; until convergence do3 𝑙 = 0; # Initialize loss4 for {(𝑒, 𝑟,𝑉𝑡 ) ∈ 𝐷𝑡 } do5 𝑜𝑡 = 𝑒 ⊕𝑐 𝑟 , from Eq. (4)
# Update loss for translation queries6 𝑙 = 𝑙 +∑
𝑣𝑡 ∈𝑉𝑡 𝑑ℎ𝑦𝑝 (𝑣𝑡 , 𝑜𝑡 )7 end8 for {(𝑄∩,𝑉∩) ∈ 𝐷∩} do9 𝑜∩ = (𝑐𝑒𝑛(𝑄∩), 𝑙𝑖𝑚(𝑄∩)), from Eq. (5)
# Update loss for intersection queries10 𝑙 = 𝑙 +∑
𝑣∩∈𝑉∩ 𝑑ℎ𝑦𝑝 (𝑣∩, 𝑜∩)11 end12 for {(𝑄∪,𝑉∪) ∈ 𝐷∪} do13 𝑜∪ = 𝑄∪, from Eq. (9)
# Update loss for union queries14 𝑙 = 𝑙 +∑
𝑣∪∈𝑉∪ 𝑀𝑖𝑛(𝑑ℎ𝑦𝑝 (𝑣∪, 𝑒𝑖 ) ∀𝑒𝑖 ∈ 𝑜∪
)15 end
# Update E and R with backpropagation16 𝐸 ← 𝐸 − Δ𝐸𝑙1818 𝑅 ← 𝑅 − Δ𝑅𝑙19 end20 return E,R
• RQ1: For the task of reasoning over KGs, are hyperboloid embed-dings better than the baselines at learning hierarchical relations?• RQ2: What is the contribution of individual components in theHypE model?• RQ3: Do the representations capture relevant data features forthe downstream task of anomaly detection?• RQ4: Can hyperboloid embeddings leverage auxiliary semanticinformation from the entities?• RQ5: Can we comprehend the latent representational space ob-tained by the proposed HypE model?
4.1 DatasetsWe perform our experimental study on the following standard KGand hierarchical graph datasets:(1) FB15k [7] contains knowledge base relation triples and textual
mentions of Freebase entity pairs. This dataset contains a largenumber of simple test triples that can be obtained by invertingthe training triples.
(2) FB15k-237 [38] is a subset of FB15k where all the simple in-versible relations are removed, so the models can learn andfocus on more complex relations.
(3) NELL995 [10] is a KG dataset of relation triples constructedfrom the 995𝑡ℎ iteration of the Never-Ending Language Learn-ing (NELL) system.
(4) DBPediaHierarchical Taxonomy3 is a subset extracted fromWikipedia snapshot that provides multi-level hierarchical tax-onomy over 342,782 articles (leaf-nodes).
(5) E-commerce Product Network4 is a subsampled product tax-onomy from an e-commerce platform.
To be consistent with KG terms, for the hierarchical graph datasets(DBPedia and E-commerce) we consider all the intermediate andleaf nodes as entities and the edges between them as relations.Additionally, we consider two variants for encoding edges. First, alledges are considered identical (|𝑅 | = 1) and second, where all edgesare depth-encoded (|𝑅 | = 𝑝), where 𝑝 is maximum depth of thehierarchy (𝑝 = 3 for DBPedia and 𝑝 = 4 for E-commerce dataset).For cross-validation and evaluation, we split the graph 𝐾𝐺 intothree parts: 𝐾𝐺𝑡𝑟𝑎𝑖𝑛 , 𝐾𝐺𝑣𝑎𝑙𝑖𝑑 and 𝐾𝐺𝑡𝑒𝑠𝑡 in a 75 : 10 : 15 ratio forour experiments. More details of the datasets are given in Table 1.
Table 1: Basic statistics of the datasets including the numberof unique entities, relations, and edges.
Dataset # entities # relations # edgesFB15k 14,951 2690 273,710
FB15k-237 14,505 474 149,689NELL995 63,361 400 107,982DBPedia 34,575 3 240,942
E-commerce ∼118K 4 ∼562K
4.2 BaselinesWe select our baselines based on the following two criteria:(1) The embedding geometries are closed under the intersection
and translation operation, e.g., the translation or intersection ofarc-aligned hyperboloids results in an arc-aligned hyperboloid.
(2) The baseline can be intuitively extended to all PFOE queriesover KG. This is necessary to have a fair comparison with HypEthat can leverage all PFOE queries.
We adopt the following state-of-the-art baselines based on geomet-ric diversity and our criterion to compare against HypE:• Graph Query Embedding (GQE) [20] embeds entities andrelations as a vector embedding in the Euclidean space.• KnowledgeGraphAttentionNetwork (KGAT) [44] embedsentities and relations as a vector embedding in the Euclideanspace utilizing attention networks over entities and relationswith a TransR loss [24] .• Hyperbolic Query Embeddings (HQE) [17] utilizes mani-fold transformations (refer to Section 3.3) to represent entitiesand relations as a vector embedding in hyperbolic space.• Query2Box (Q2B) [35] embeds entitites and relations as axis-aligned hyper-rectangle or box embeddings in Euclidean space.
Some of the other possible baselines [7, 32, 48], solely, focus onthe multi-hop (or translation) problem. They could not be natu-rally extended to other PFOE queries. Additionally, other geometricvariants such as circular and Gaussian embeddings [39, 42] arenot closed under intersection (intersection of Gaussians is not aGaussian).
3https://www.kaggle.com/danofer/dbpedia-classes4Proprietary dataset

Self-Supervised Hyperboloid Representations from Logical Queries over Knowledge Graphs WWW ’21, April 19–23, 2021, Ljubljana, Slovenia
Table 2: Performance comparison of HypE (ours) against the baselines to study the efficacy of the Query-Search space. Thecolumns present the different query structures and averages over them. The final row presents the Average Relative Improve-ment (%) of HypE compared to Query2Box over all datasets. E-Vector and H-Vector are vectors in Euclidean and hyperbolicspace, respectively. Best results for each dataset are shown in bold.
Metrics Hits@3 Mean Reciprocal RankDataset Model 1t 2t 3t 2∩ 3∩ 2∪ ∩𝒕 𝒕∩ ∪𝒕 Avg 1t 2t 3t 2∩ 3∩ 2∪ ∩𝒕 𝒕∩ ∪𝒕 AvgFB15k GQE (E-Vector) .636 .345 .248 .515 .624 .376 .151 .310 .273 .386 .505 .320 .218 .439 .536 .300 .139 .272 .244 .330
KGAT (E-Vector) .711 .379 .276 .553 .667 .492 .181 .354 .302 .435 .565 .352 .243 .471 .573 .393 .167 .311 .270 .372HQE (H-Vector) .683 .365 .265 .451 .589 .438 .135 .283 .290 .389 .543 .339 .233 .384 .506 .350 .125 .249 .259 .332Q2B (Box) .786 .413 .303 .590 .710 .608 .211 .397 .330 .483 .654 .373 .274 .488 .602 .468 .194 .339 .301 .410HypE (Hyperboloid) .809 .486 .365 .598 .728 .610 .206 .406 .410 .513 .673 .439 .330 .495 .617 .470 .189 .347 .374 .437
FB15k GQE (E-Vector) .404 .214 .147 .262 .390 .164 .087 .162 .155 .221 .346 .193 .145 .250 .355 .145 .086 .156 .151 .203-237 KGAT (E-Vector) .436 .227 .167 .293 .422 .202 .069 .135 .174 .236 .373 .205 .165 .280 .384 .179 .068 .130 .170 .217
HQE (H-Vector) .440 .231 .171 .265 .387 .195 .083 .162 .183 .235 .376 .209 .169 .253 .352 .173 .082 .156 .179 .217Q2B (Box) .467 .240 .186 .324 .453 .239 .050 .108 .193 .251 .400 .225 .173 .275 .378 .198 .105 .180 .178 .235HypE (Hyperboloid) .572 .366 .255 .399 .527 .225 .145 .246 .282 .335 .490 .343 .237 .339 .440 .186 .305 .410 .260 .334
NELL GQE (E-Vector) .417 .231 .203 .318 .454 .200 .081 .188 .139 .248 .311 .193 .175 .273 .399 .159 .078 .168 .130 .210995 KGAT (E-Vector) .486 .249 .218 .331 .467 .285 .107 .200 .151 .277 .362 .208 .188 .284 .410 .227 .103 .179 .141 .234
HQE (H-Vector) .477 .250 .219 .270 .413 .267 .091 .153 .166 .256 .355 .209 .189 .232 .363 .213 .088 .137 .155 .216Q2B (Box) .555 .266 .233 .343 .480 .369 .132 .212 .163 .306 .413 .227 .208 .288 .414 .266 .125 .193 .155 .254HypE (Hyperboloid) .618 .359 .312 .400 .563 .441 .143 .227 .278 .371 .460 .306 .279 .336 .486 .318 .135 .207 .264 .310
DBPedia GQE (E-Vector) .673 .006 N.A. .873 .879 .402 .160 .668 0.00 .406 .502 .005 N.A. .749 .773 .32 .154 .597 0.00 .344|𝑅 | = 1 KGAT (E-Vector) .753 .007 N.A. .937 .940 .526 .192 .762 0.00 .457 .561 .006 N.A. .804 .825 .419 .185 .682 0.00 .387
HQE (H-Vector) .422 .003 N.A. 1.00 1.00 .138 .109 .182 .001 .296 .314 .003 N.A. .859 .879 .110 .105 .163 .001 .270Q2B (Box) .832 .007 N.A. 1.00 1.00 .649 .224 .856 0.00 .508 .619 .006 N.A. .840 .863 .468 .212 .779 0.00 .421HypE (Hyperboloid) .897 .009 N.A. 1.00 1.00 .708 .294 .935 .001 .546 .668 .008 N.A. .840 .863 .511 .278 .853 .001 .447
DBPedia GQE (E-Vector) .730 .565 N.A. .873 .879 .534 .213 .705 .027 .504 .544 .421 N.A. .651 .656 .398 .159 .526 .020 .375|𝑅 | = 𝑝 KGAT (E-Vector) .816 .621 N.A. .937 .940 .699 .255 .804 .030 .567 .608 .463 N.A. .698 .700 .521 .190 .599 .022 .422
HQE (H-Vector) .456 .182 N.A. 1.00 1.00 .184 .143 .192 .143 .367 .339 .135 N.A. .744 .744 .137 .106 .143 .106 .273Q2B (Box) .901 .676 N.A. 1.00 1.00 .863 .297 .903 .033 .630 .670 .503 N.A. .744 .744 .642 .221 .672 .025 .469HypE (Hyperboloid) .970 .756 N.A. 1.00 1.00 .940 .388 .985 .046 .676 .722 .563 N.A. .744 .744 .700 .289 .733 .034 .503
Avg. Improv. (%) (HypE vs Q2B) 15.0 39.2 67.0 4.1 4.7 13.0 28.5 12.9 7.3 14.4 14.9 38.4 59.8 4.4 5.0 12.9 39.5 17.9 64.9 18.5
4.3 RQ1: Efficacy of the Query-Search spaceTo analyze the efficacy of the query space obtained from the HypEmodel, we compare it against the state-of-the-art baselines on thefollowing reasoning query structures:(1) Single operator queries include multi-level translation (1t,
2t, and 3t) multi-entity intersection (2∩, 3∩) and multi-entityunion queries (2∪). 1t, 2t, and 3t denote translation with 1,2 and 3 consecutive relations, respectively. 2∩ and 2∪ standfor intersection and union over two entities, respectively. 3∩represents intersection over three entities.
(2) Compound queries contain multiple operators chained in se-ries to get the final result. Our experiments analyze∩𝑡 (intersection-translation), 𝑡∩ (translation-intersection) and∪𝑡 (union-translation).
The above queries are illustrated in Figure 8.
Figure 8: Logical query structures designed to compareHypE against baselines. The blue, red, and green units de-note translation, intersection, and union operations, respec-tively.
We extract the ground truth query-entity pairs by traversing thedatasets [35]. The models are trained on queries from 𝐾𝐺𝑡𝑟𝑎𝑖𝑛 andvalidated on𝐾𝐺𝑣𝑎𝑙𝑖𝑑 . The final evaluation metrics are calculated on𝐾𝐺𝑡𝑒𝑠𝑡 . We utilize Euclidean norm and hyperbolic distance (given inEq. (3)) to measure the distance between query embeddings and itsresultant entities in Euclidean and hyperbolic spaces, respectively.The sorted query-entity distances are the ranked results for thegiven query.
Table 3: Performance comparison ofHypE (ours) against thebaselines on an e-commerce dataset for multi-level transla-tion queries. We assume GQE (E-vector) as a baseline andreport relative improvements against that for all the meth-ods. The numbers are in percentages. Best results for eachdataset are shown in bold.5Metrics Hits@3 Mean Reciprocal RankDataset Model 1t 2t 3t 1t 2t 3t|𝑅 | = 1 GQE (E-Vector) 0.0 0.0 0.0 0.0 0.0 0.0
KGAT (E-Vector) 12.12 10.9 0.0 0.0 -36.2 -57.3HQE (H-Vector) -34.8 -51.6 0.0 -34.7 -56.6 0.0Q2B (Box) 30.3 4.7 200 23.5 7.5 0.0HypE (Hyperboloid) 38.6 98.4 200 38.8 79.2 100
|𝑅 | = 𝑝 GQE (E-Vector) 0.0 0.0 0.0 0.0 0.0 0.0KGAT (E-Vector) 12.2 10.7 0.0 11.5 9.5 0.0HQE (H-Vector) 38.8 92.9 350 38.5 90.5 600Q2B (Box) 17.3 37.5 0.0 23.1 19.0 0.0HypE (Hyperboloid) 122.3 298.2 8350 192.3 471.4 9900
Given a test query 𝑞𝑡𝑒𝑠𝑡 , let the true ranked result entities be𝐸𝑟𝑒𝑠𝑢𝑙𝑡 and model’s ranked output be 𝐸𝑜𝑢𝑡𝑝𝑢𝑡 = {𝑒𝑜1, 𝑒𝑜2, ..., 𝑒𝑜𝑛}.The evaluation metrics used in our work are Hits@K andMean
5Due to the sensitive nature of the proprietary dataset, we only report relative results.

WWW ’21, April 19–23, 2021, Ljubljana, Slovenia Choudhary et al.
Table 4: Ablation study results. The first column presents the model variants compared against the final HypE model. Avg-1tand Avg-1,2,3t variants only utilize average center aggregation because other aggregation variants only apply when intersec-tions are involved.HypE-TCpresents theHypE variantwith trainable curvature. Themetrics reported in the table are averagedacross evaluation on all the datasets. Finer evaluation results are provided in the Appendix B. Best results are shown in bold.
Metrics Hits@3 Mean Reciprocal RankModel Variants 1t 2t 3t 2∩ 3∩ 2∪ ∩𝒕 𝒕∩ ∪𝒕 Avg 1t 2t 3t 2∩ 3∩ 2∪ ∩𝒕 𝒕∩ ∪𝒕 AvgHypE-Avg-1t .651 .274 .153 .383 .414 .484 .099 .235 .135 .312 .538 .238 .149 .309 .332 .366 .108 .216 .126 .264HypE-Avg-1,2,3t .650 .353 .213 .431 .474 .486 .133 .280 .187 .352 .532 .306 .204 .345 .381 .366 .140 .256 .171 .297HypE-Avg .650 .432 .272 .479 .535 .487 .167 .325 .239 .392 .525 .373 .258 .381 .429 .366 .172 .296 .215 .330HypE-DS .630 .432 .267 .488 .555 .451 .165 .356 .238 .392 .511 .376 .257 .399 .460 .344 .172 .326 .213 .334HypE-TC .656 .439 .275 .490 .565 .488 .177 .374 .243 .406 .530 .379 .262 .391 .458 .368 .184 .340 .216 .342HypeE (final) .656 .438 .275 .490 .564 .488 .177 .373 .242 .405 .530 .378 .262 .390 .458 .368 .184 .340 .215 .341
Reciprocal Rank (MRR). The metrics are given by:
𝐻𝐼𝑇𝑆@𝐾 (𝑞𝑡𝑒𝑠𝑡 ) =1𝐾
𝐾∑︁𝑘=1
𝑓 (𝑒𝑜𝑘 ) , 𝑓 (𝑒𝑜𝑘 ) ={1, if 𝑒𝑜𝑘 ∈ 𝐸𝑟𝑒𝑠𝑢𝑙𝑡0, otherwise
𝑀𝑅𝑅(𝑞𝑡𝑒𝑠𝑡 ) =1𝑛
𝑛∑︁𝑖=1
1𝑓 (𝑒𝑜𝑖 )
, 𝑓 (𝑒𝑜𝑖 ) ={𝑖, if 𝑒𝑜𝑖 ∈ 𝐸𝑟𝑒𝑠𝑢𝑙𝑡∞, otherwise
From the results in Table 2, we observe that, on average, HypEoutperforms the current baselines in translation, single, and com-pound operator queries by 15%-67%, 4%-13%, and 7%-28%, respec-tively. The performance improvement linearly increases with higherquery depth (1𝑡 < 2𝑡 < 3𝑡 ). Furthermore, we notice that uniquedepth encoding (|𝑅 | = 𝑑) outperforms identical depth encoding(|𝑅 | = 1) by 23% in DBPedia. Because of our subsampling strategy,the E-commerce Product Network is disjoint (i.e., there are severalintermediate nodes that do not share children). Hence, the numberof intersection queries are extremely low and insufficient for train-ing HypE or baselines. However, we can still train the translationqueries, and the results are shown in Table 3, where we report rela-tive performance improvements with respect to the GQE baseline.For the sake of completeness, results on intersection and unionqueries are given in the Appendix C.
4.4 RQ2: Ablation StudyIn this section, we empirically analyze the importance of differentlayers adopted in the HypE model. For this, we experiment withdifferent variations of the center aggregation layer; Average (HypE-Avg), Attention (HypE) (refer to Eq. (6)) and Deepsets (HypE-DS)(refer to Eq. (7)). Furthermore, we test the exclusion of intersectionand unions to comprehend their importance in the representationlearning process. We adopt two variants of HypE; one trained ononly 1t queries (HypE-Avg-1t) and the other trained on all transla-tion queries (HypE-Avg-1,2,3t). Table 4 presents the performancemetrics of different variants on the query processing task, aver-aged across all the datasets including the E-commerce dataset. Theresults are provided in Table 4.
Firstly, we observe that the exclusion of intersection and unionqueries results in a significant performance decrease by 25% (Avg-1,2,3t vs HypE). Furthermore, removing deeper queries such as2t and 3t, also results in an additional decrease by 17% (Avg-1tvs Ag-1,2,3t). The tests on different aggregation layers prove thatAttention is better than average and Deepsets by 23.5% and 14.5%,respectively. Additionally, we notice that employing a trainablecurvature results in a slight performance improvement of 0.3%.However, given the incremental performance boost but significantincrease in the number of parameters (∼10K) that the trainable
curvature adds to the framework, we ignore this component in thefinal HypE model.
As explained in Section 3.4, the final HypE model adopts aPoincaré ball manifold with non-trainable curvature, in additionto attention and Deepsets layer for center and limit aggregation,respectively. Additionally, HypE leverages all PFOE queries.
4.5 RQ3: Performance on Anomaly DetectionIn this experiment, we utilize the entity and relation representations,trained on the DBPedia Hierarchical Taxonomy and E-commerceProduct Network with query processing task, to identify productsthat might be anomalously categorized. We consider identifyingthe anomalous children by three levels of parents (i.e., taxonomylevels); 𝑃1, 𝑃2 and 𝑃3. The motivating application is to categorizeitems that are potentially mis-categorized by sellers into the morerelevant (correct) part of the product taxonomy.
Table 5: Results on Miscategorized Article Anomaly Detec-tion in DBPedia dataset. Best results are shown in bold andthe second best results are underlined. P, R, and F1 representPrecision, Recall, and F-score, respectively.
P-Level 1 2 3Dataset Models P R F1 P R F1 P R F1DBPedia GQE .512 .369 .428 .549 .446 .492 .576 .409 .479|𝑅 | = 𝑝 KGAT .523 .375 .437 .552 .448 .495 .578 .416 .484
HQE .529 .385 .446 .556 .45 .497 .586 .424 .492Q2B .589 .479 .527 .589 .479 .528 .597 .481 .532HypE .590 .479 .528 .648 .482 .552 .650 .486 .557HypE-SI .591 .479 .529 .648 .483 .553 .651 .486 .557HypE-SC .601 .501 .546 .662 .563 .608 .705 .563 .626
Table 6: Results on Miscategorized Product Anomaly De-tection in E-commerce Product Networks. Best results areshown in bold and the second best results are underlined.The improvements are relative to theGQEbaseline. P, R, andF1 represent Precision, Recall, and F-score, respectively.6
P-Level 1 2 3Dataset Models P R F1 P R F1 P R F1E- GQE 0.0 0.0 0.0 0.0 0.0 0.0 0.0 0.0 0.0commerce KGAT 2.2 1.8 2.1 0.6 0.5 0.7 0.2 1.6 1.1|𝑅 | = 𝑝 HQE 3.4 4.5 4.1 1.2 1.0 1.1 1.7 3.5 2.8
Q2B 15.1 29.9 23.4 7.2 7.4 7.4 3.6 17.5 11.3HypE 15.3 29.9 23.4 18.0 8.4 12.8 16.6 18.5 17.2HypE-SI 15.5 29.9 23.7 18.0 8.4 12.5 16.4 18.8 17.2HypE-SC 17.4 35.8 27.5 20.6 26.4 23.7 22.3 37.6 30.8
We construct a pseudo-tree, where all parent nodes are infusedwith 10% noise of randomly sampled anomalous leaf nodes fromdifferent parts of the dataset. The goal of the model is to learn repre-sentations from this pseudo-tree and identify anomalous leaf nodes6Due to the sensitive nature of the proprietary dataset, we only report relative results.

Self-Supervised Hyperboloid Representations from Logical Queries over Knowledge Graphs WWW ’21, April 19–23, 2021, Ljubljana, Slovenia
Table 7: Example ofAnomalies in the E-commerce dataset. Themodels predict “MISCAT” and “TRUE” tags formis-categorized andtruly-categorized items, respectively. Correct and Incorrect tags are given in green and red color, respectively. HypE performsbetter thanQuery2Box (Q2B) as we consider higher level of parents because hyperbolic space is better at capturing hierarchicalfeatures. Also, HypE-SC is able to utilize semantic information to improve prediction.
Product Title Parent PredictionCategory P-level Q2B HypE HypE-SC
ASICS Women’s Gel-Venture 7 Trail Running Shoes, 5.5M, Graphite Grey/Dried Berry Rompers 1 TRUE TRUE MISCATinktastic Family Cruise Youth T-Shirt Youth X-Large (18-20) Pacific Blue 35074 Calvin Klein 1 TRUE MISCAT MISCATCalvin Klein Men’s Cotton Classics Multipack Crew Neck T-Shirts Calvin Klein 1 MISCAT MISCAT TRUEEpic Threads Big Girls Paint Splatter Distressed Girlfriend Denim Jeans (Dark Wash, 10) Wool & Blends 2 MISCAT MISCAT TRUENew Balance Women’s Crag V1 Fresh Foam Trail Running Shoe, Black/Magnet/Raincloud Wool & Blends 2 TRUE MISCAT MISCATFifth Harmony Vintage Photo Blue T Shirt (M) Customer Segment 2 TRUE TRUE MISCATBilly Bills Playoff Shirt Buffalo T-Shirt Let’s Go Buffalo Tee Customer Segment 2 MISCAT TRUE TRUEKanu Surf Toddler Karlie Flounce Beach Sport 2-Piece Swimsuit, Ariel Blue, 4T Brand Stores 3 TRUE MISCAT MISCATThe North Face Infant Glacier ¼ Snap, Mr. Pink, 0-3 Months US Infant Brand Stores 3 MISCAT TRUE TRUEArtisan Outfitters Mens Surfboard Shortboard Batik Cotton Hawaiian Shirt Specialty Stores 3 MISCAT TRUE TRUEPUMA Unisex-Kid’s Astro Kick Sneaker, Peacoat-White-teamgold, 3 M US Little Kid Specialty Stores 3 TRUE TRUE MISCAT
(a) DBPedia Taxonomy (b) E-commerce Product NetworksFigure 9: Visualization of HypE representations for samples from hierarchical datasets in Poincaré ball. The hyperboloidshave been scaled up 10 times for better comprehension. The blue (intermediate nodes) circles are annotated with their entitynames and orange circles (leaf nodes) depict articles and products in (a) and (b), respectively.
of the immediate parent nodes. From the set of all intermediatenodes 𝐾𝐺𝑃 , given a parent 𝑝 ∈ 𝐾𝐺𝑃 and its originial set of children𝐶+ = 𝑐ℎ𝑖𝑙𝑑𝑟𝑒𝑛(𝑝) and randomly sampled set of anomalous children𝐶− = 𝑐ℎ𝑖𝑙𝑑𝑟𝑒𝑛 (𝐾𝐺𝑃 \ {𝑝}), the aim here is to identify 𝑐 ∈ 𝐶− from𝐶+ ∪𝐶−. We use Precision, Recall and F1-score as the evaluationmetrics for this experiment.
The results (given in Table 5 and Table 6) show that, althoughHypE has comparable performance to baselines at 𝑃1, it outper-forms the baselines bymore than 5% at 𝑃2 and 𝑃3. This demonstratesthe robustness of HypE to noisy data and its capability of capturingrelevant hierarchical features (as F1 on 𝑃3 > 𝑃2 > 𝑃1) for down-stream tasks. Furthermore, the specific task is critical in e-commercesearch as irrelevant results impede a smooth user experience. Table7 presents some qualitative examples from the E-commerce dataset.
4.6 RQ4: Leveraging Semantic InformationKGs generally also contain additional auxiliary information withinthe entities. In this section, we test the possibility of leveraging thesemantic information in the DBPedia (article titles) and E-commerce(product titles) dataset to improve representations. We study two
methods to connect HypE with FastText embeddings [6] of thecorresponding titles:
• Semantic Initiation (SI) initiates the HypE’s entities with se-mantic embeddings and learns new HypE-SI embeddings withthe query-processing task (given in Section 4.3).• Semantic Collaboration (SC) concatenates the HypE’s pre-trained entity representations with semantic embeddings.
We investigate the performance of these methods on the task ofanomaly detection. The results of the experiments are given inTables 5 and 6. The results demonstrate that HypE-SI shows nosignificant performance improvement over HypE. That is, a goodsemantic initialization of the vectors does not result in better repre-sentations. This is reasonable, since the semantic embeddings arelearnt in the Euclidean space, and several transformations occur be-tween the initialization and final representations. This also meansthat the learning framework is robust to initialization. We observea performance improvement of 2% − 8% in case of HypE-SC whencompared to HypE. This suggests the ubiquity of HypE since hierar-chical representations can be independently augmented with otherauxiliary features to solve more complex tasks. From the examples

WWW ’21, April 19–23, 2021, Ljubljana, Slovenia Choudhary et al.
given in Table 7, we can observe that HypE-SI is able to leveragesemantic information from product title and category name to enrichHypE’s hierarchical information to produce better predictions. Theadditional semantic information is especially useful for productmiscategorization. In the absence of semantic information, HypEwill merely learn representations based on the noisy graph and willlose discriminative information between outliers and correct nodes.
4.7 RQ5: Visualization of the Poincaré ballWe extract representative examples of different operations fromour dataset and visualize them in a 2-dimensional Poincaré ball ofunit radius. We employ Principal Component Analysis (PCA) [5]for dimensionality reduction (R2𝑑 → R2) of the hyperboloids inPoincaré ball.
Figure 9 depicts the HypE representations in a Poincaré ball man-ifold. Notice that the density of nodes increases superlinearly fromthe center towards the circumference, which is analogous to thesuperlinear increase in the number of nodes from root to the leaves.Thus, HypE is able to learn a better distinction between differenthierarchy levels, when compared to the Euclidean distance-basedbaselines, which conform to a linear increase. Furthermore, weobserve that hyperboloid intersections in DBPedia Taxonomy (Fig-ure 9(a)) capture entities with common parents. Also, the disjointnature of E-commerce Product Networks (Figure 9(b)) is illustratedby disjoint non-intersecting hyperboloids in the latent space. Inaddition, we can also notice that the learnable limit parameter ad-justs the size of hyperboloids to accomodate its varying numberof leaf nodes. Thus, the complex geometry of HypE is able to im-prove its precision over vector baselines that, generally, utilize staticthresholds over distance of the resultant entities from query points.
5 CONCLUSIONIn this paper, we presented Hyperboloid Embeddings (HypE) model,a novel self-supervised learning framework that utilizes dynamicquery-reasoning over KGs as a proxy task to learn representationsof entities and relations in a hyperbolic space. We demonstrate theefficacy of a hyperbolic query-search space against state-of-the-art baselines over different datasets. Furthermore, we also showthe effectiveness of hyperboloid representations in complex down-stream tasks and study methods that can leverage node’s auxiliaryinformation to enrich HypE features. Additionally, we analyze thecontribution of HypE’s individual components through an abla-tion study. Finally, we present our hyperboloid representations in a2-dimensional Poincaré ball for better comprehensibility.
REFERENCES[1] Dzmitry Bahdanau, Kyunghyun Cho, and Yoshua Bengio. 2014. Neural Machine
Translation by Jointly Learning to Align and Translate. In International Conferenceon Learning Representations. http://arxiv.org/abs/1409.0473
[2] Gary Becigneul and Octavian-Eugen Ganea. 2019. Riemannian Adaptive Op-timization Methods. In International Conference on Learning Representations.https://openreview.net/forum?id=r1eiqi09K7
[3] Yoshua Bengio, Aaron Courville, and Pascal Vincent. 2013. Representationlearning: A review and new perspectives. IEEE transactions on pattern analysisand machine intelligence 35, 8 (2013), 1798–1828.
[4] Yoshua Bengio, Aaron C. Courville, and Pascal Vincent. 2012. UnsupervisedFeature Learning and Deep Learning: A Review and New Perspectives. CoRRabs/1206.5538 (2012). arXiv:1206.5538 http://arxiv.org/abs/1206.5538
[5] Christopher M Bishop et al. 1995. Neural networks for pattern recognition. Oxforduniversity press.
[6] Piotr Bojanowski, Edouard Grave, Armand Joulin, and Tomas Mikolov. 2017. En-riching Word Vectors with Subword Information. Transactions of the Associationfor Computational Linguistics 5 (2017), 135–146. https://doi.org/10.1162/tacl_a_00051
[7] Antoine Bordes, Nicolas Usunier, Alberto Garcia-Duran, Jason Weston, and Ok-sana Yakhnenko. 2013. Translating Embeddings for Modeling Multi-relationalData. In Advances in Neural Information Processing Systems 26. 2787–2795.
[8] Michael M Bronstein, Joan Bruna, Yann LeCun, Arthur Szlam, and Pierre Van-dergheynst. 2017. Geometric deep learning: going beyond euclidean data. IEEESignal Processing Magazine 34, 4 (2017), 18–42.
[9] James W Cannon, William J Floyd, Richard Kenyon, Walter R Parry, et al. 1997.Hyperbolic geometry. Flavors of geometry 31 (1997), 59–115.
[10] Andrew Carlson, Justin Betteridge, Bryan Kisiel, Burr Settles, Estevam R Hr-uschka Jr, and Tom M Mitchell. 2010. Toward an architecture for never-endinglanguage learning.. In Aaai, Vol. 5. Atlanta.
[11] Ines Chami, Adva Wolf, Da-Cheng Juan, Frederic Sala, Sujith Ravi, and Christo-pher Ré. 2020. Low-Dimensional Hyperbolic Knowledge Graph Embeddings.In Proceedings of the 58th Annual Meeting of the Association for Computa-tional Linguistics. Association for Computational Linguistics, Online, 6901–6914.https://doi.org/10.18653/v1/2020.acl-main.617
[12] Ines Chami, Zhitao Ying, Christopher Ré, and Jure Leskovec. 2019. Hyperbolicgraph convolutional neural networks. In Advances in neural information process-ing systems. 4868–4879.
[13] Michaël Defferrard, Xavier Bresson, and Pierre Vandergheynst. 2016. Convolu-tional neural networks on graphs with fast localized spectral filtering. InAdvancesin neural information processing systems. 3844–3852.
[14] Carl Doersch and Andrew Zisserman. 2017. Multi-task self-supervised visuallearning. In Proceedings of the IEEE International Conference on Computer Vision.2051–2060.
[15] Yuchun Fang, Zhengyan Ma, Zhaoxiang Zhang, Xu-Yao Zhang, and Xiang Bai.2017. Dynamic Multi-Task Learning with Convolutional Neural Network. InIJCAI. 1668–1674. https://doi.org/10.24963/ijcai.2017/231
[16] Xinyu Fu, Jiani Zhang, Ziqiao Meng, and Irwin King. 2020. MAGNN: MetapathAggregated Graph Neural Network for Heterogeneous Graph Embedding. InProceedings of The Web Conference 2020. 2331–2341.
[17] Octavian Ganea, Gary Bécigneul, and Thomas Hofmann. 2018. Hyperbolic neuralnetworks. In Advances in neural information processing systems. 5345–5355.
[18] Aditya Grover and Jure Leskovec. 2016. node2vec: Scalable feature learning fornetworks. In Proceedings of the 22nd ACM SIGKDD international conference onKnowledge discovery and data mining. 855–864.
[19] Caglar Gulcehre, Misha Denil, Mateusz Malinowski, Ali Razavi, Razvan Pascanu,Karl Moritz Hermann, Peter Battaglia, Victor Bapst, David Raposo, Adam Santoro,and Nando de Freitas. 2019. Hyperbolic Attention Networks. In InternationalConference on Learning Representations.
[20] Will Hamilton, Payal Bajaj, Marinka Zitnik, Dan Jurafsky, and Jure Leskovec.2018. Embedding logical queries on knowledge graphs. In Advances in neuralinformation processing systems. 2026–2037.
[21] Amir Jamaludin, Timor Kadir, and Andrew Zisserman. 2017. Self-supervisedlearning for spinal MRIs. In Deep Learning in Medical Image Analysis and Multi-modal Learning for Clinical Decision Support. Springer, 294–302.
[22] B. Jia, C. Dong, Z. Chen, K. Chang, N. Sullivan, and G. Chen. 2018. Pattern Dis-covery and Anomaly Detection via Knowledge Graph. In 2018 21st InternationalConference on Information Fusion (FUSION). 2392–2399.
[23] Thomas N Kipf and MaxWelling. 2017. Semi-supervised classification with graphconvolutional networks. In International Conference on Learning Representations.
[24] Hailun Lin, Yong Liu,WeipingWang, Yinliang Yue, and Zheng Lin. 2017. Learningentity and relation embeddings for knowledge resolution. Procedia ComputerScience 108 (2017), 345–354.
[25] Xi Victoria Lin, Richard Socher, and Caiming Xiong. 2018. Multi-Hop KnowledgeGraph Reasoning with Reward Shaping. In Proceedings of the 2018 Conference onEmpirical Methods in Natural Language Processing. Association for ComputationalLinguistics, Brussels, Belgium, 3243–3253. https://doi.org/10.18653/v1/D18-1362
[26] Weijie Liu, Peng Zhou, Zhe Zhao, Zhiruo Wang, Qi Ju, Haotang Deng, and PingWang. 2020. K-BERT: Enabling Language Representation with Knowledge Graph..In AAAI. 2901–2908.
[27] Moshe Looks, Marcello Herreshoff, DeLesley Hutchins, and Peter Norvig. 2017.Deep Learning with Dynamic Computation Graphs. In International Conferenceon Learning Representations.
[28] Kurt Miller, Michael I Jordan, and Thomas L Griffiths. 2009. Nonparametric latentfeature models for link prediction. In Advances in neural information processingsystems. 1276–1284.
[29] Arsha Nagrani, Joon Son Chung, Samuel Albanie, and Andrew Zisserman. 2020.Disentangled speech embeddings using cross-modal self-supervision. In ICASSP2020-2020 IEEE International Conference on Acoustics, Speech and Signal Processing(ICASSP). IEEE, 6829–6833.
[30] Vinod Nair and Geoffrey E. Hinton. 2010. Rectified Linear Units Improve Re-stricted Boltzmann Machines. In Proceedings of the 27th International Conference

Self-Supervised Hyperboloid Representations from Logical Queries over Knowledge Graphs WWW ’21, April 19–23, 2021, Ljubljana, Slovenia
on International Conference on Machine Learning (Haifa, Israel) (ICML’10). Omni-press, Madison, WI, USA, 807–814.
[31] Maximilian Nickel, Lorenzo Rosasco, and Tomaso Poggio. 2016. Holographic Em-beddings of Knowledge Graphs. In Proceedings of the Thirtieth AAAI Conferenceon Artificial Intelligence (Phoenix, Arizona) (AAAI’16). AAAI Press, 1955–1961.
[32] Maximilian Nickel, Volker Tresp, and Hans-Peter Kriegel. 2011. A three-waymodel for collective learning on multi-relational data.. In ICML, Vol. 11. 809–816.
[33] Adam Paszke, Sam Gross, and et. al. Massa, Francisco. 2019. PyTorch: An Im-perative Style, High-Performance Deep Learning Library. In Advances in NeuralInformation Processing Systems 32. 8024–8035.
[34] Bryan Perozzi, Rami Al-Rfou, and Steven Skiena. 2014. Deepwalk: Online learningof social representations. In Proceedings of the 20th ACM SIGKDD internationalconference on Knowledge discovery and data mining. 701–710.
[35] Hongyu Ren*, Weihua Hu*, and Jure Leskovec. 2020. Query2box: Reasoningover Knowledge Graphs in Vector Space Using Box Embeddings. In Interna-tional Conference on Learning Representations. https://openreview.net/forum?id=BJgr4kSFDS
[36] Linfeng Song, Yue Zhang, Zhiguo Wang, and Daniel Gildea. 2018. A Graph-to-Sequence Model for AMR-to-Text Generation. In Proceedings of the 56th AnnualMeeting of the Association for Computational Linguistics (Volume 1: Long Papers).Association for Computational Linguistics, Melbourne, Australia, 1616–1626.https://doi.org/10.18653/v1/P18-1150
[37] Haitian Sun, Andrew O Arnold, Tania Bedrax-Weiss, Fernando Pereira, andWilliam W Cohen. 2020. Faithful Embeddings for Knowledge Base Queries.Advances in Neural Information Processing Systems 33 (2020).
[38] Kristina Toutanova, Danqi Chen, Patrick Pantel, Hoifung Poon, Pallavi Choud-hury, and Michael Gamon. 2015. Representing Text for Joint Embedding of Textand Knowledge Bases. In Proceedings of the 2015 Conference on Empirical Meth-ods in Natural Language Processing. Association for Computational Linguistics,Lisbon, Portugal, 1499–1509. https://doi.org/10.18653/v1/D15-1174
[39] George Fletcher ulong Pei, Xin Du and Mykola Pechenizkiy. 2019. Dynamic Net-work Representation Learning via Gaussian Embedding. NeurIPS 2019 Workshopon Graph Representation Learning (2019).
[40] Petar Veličković, Guillem Cucurull, Arantxa Casanova, Adriana Romero, PietroLiò, and Yoshua Bengio. 2018. Graph Attention Networks. In International Confer-ence on Learning Representations. https://openreview.net/forum?id=rJXMpikCZ
[41] Luke Vilnis, Xiang Li, Shikhar Murty, and Andrew McCallum. 2018. ProbabilisticEmbedding of Knowledge Graphs with Box Lattice Measures. In Proceedings ofthe 56th Annual Meeting of the Association for Computational Linguistics (Volume1: Long Papers). Association for Computational Linguistics, Melbourne, Australia,263–272. https://doi.org/10.18653/v1/P18-1025
[42] Luke Vilnis and Andrew McCallum. 2015. Word Representations via GaussianEmbedding.. In ICLR. http://arxiv.org/abs/1412.6623
[43] Quan Wang, Zhendong Mao, Bin Wang, and Li Guo. 2017. Knowledge graphembedding: A survey of approaches and applications. IEEE Transactions onKnowledge and Data Engineering 29, 12 (2017), 2724–2743.
[44] Xiang Wang, Xiangnan He, Yixin Cao, Meng Liu, and Tat-Seng Chua. 2019. Kgat:Knowledge graph attention network for recommendation. In Proceedings of the25th ACM SIGKDD International Conference on Knowledge Discovery & DataMining. 950–958.
[45] XiaoWang, Houye Ji, Chuan Shi, Bai Wang, Yanfang Ye, Peng Cui, and Philip S Yu.2019. Heterogeneous graph attention network. In TheWorldWideWeb Conference.2022–2032.
[46] W. X. Wilcke, P. Bloem, V. de Boer, R. H. van t Veer, and F. A. H. van Harme-len. 2020. End-to-End Entity Classification on Multimodal Knowledge Graphs.arXiv:2003.12383 [cs.AI]
[47] Xing Xu, Huimin Lu, Jingkuan Song, Yang Yang, Heng Tao Shen, and XuelongLi. 2019. Ternary adversarial networks with self-supervision for zero-shot cross-modal retrieval. IEEE transactions on cybernetics 50, 6 (2019), 2400–2413.
[48] Bishan Yang, Wen-tau Yih, Xiaodong He, Jianfeng Gao, and Li Deng. 2015. Em-bedding entities and relations for learning and inference in knowledge bases. InInternational Conference on Learning Representations.
[49] Manzil Zaheer, Satwik Kottur, Siamak Ravanbakhsh, Barnabas Poczos, Russ RSalakhutdinov, and Alexander J Smola. 2017. Deep sets. In Advances in neuralinformation processing systems. 3391–3401.
[50] Chuxu Zhang, Dongjin Song, Chao Huang, Ananthram Swami, and Nitesh V.Chawla. 2019. Heterogeneous Graph Neural Network. In Proceedings of the 25thACM SIGKDD International Conference on Knowledge Discovery and Data Mining(Anchorage, AK, USA) (KDD ’19). Association for Computing Machinery, NewYork, NY, USA, 793–803. https://doi.org/10.1145/3292500.3330961
[51] Jiawei Zhang, Haopeng Zhang, Li Sun, and Congying Xia. 2020. Graph-Bert:Only Attention is Needed for Learning Graph Representations. arXiv preprintarXiv:2001.05140 (2020).
[52] Jun Zhu. 2012. Max-Margin Nonparametric Latent Feature Models for LinkPrediction. In Proceedings of the 29th International Conference onMachine Learning(Edinburgh, Scotland) (ICML’12). Omnipress, Madison, WI, USA, 1179–1186.
A HYPERBOLIC VS EUCLIDEAN DISTANCESTo better analyze the impact of adopting hyperbolic space, weneed to understand its distinction from the Euclidean space inhandling hierarchy. For this, we study the intra-level and inter-level Euclidean and hyperbolic distance between entities at differentlevels of the dataset. Let us say 𝐸𝑝 is the set of entities at level 𝑃𝑝in the E-commerce Product Networks dataset. For the analysis, wecalculate two sets of distances; intra-level (Δ𝑖𝑛𝑡𝑟𝑎) and inter-level(Δ𝑖𝑛𝑡𝑒𝑟 ) distance as follows:
Δ𝑖𝑛𝑡𝑟𝑎 (𝑃𝑝 ) =∑ |𝐸𝑝 |𝑖=0
∑ |𝐸𝑝 |𝑗=𝑖
𝛿 (𝑒𝑖 , 𝑒 𝑗 )|𝐸𝑝 |
(|𝐸𝑝 | − 1
) (11)
Δ𝑖𝑛𝑡𝑒𝑟 (𝑃𝑝1, 𝑃𝑝2) =∑ |𝐸𝑝1 |𝑖=0
∑ |𝐸𝑝2 |𝑗=0 𝛿 (𝑒𝑖 , 𝑒 𝑗 )
|𝐸𝑝1 | × |𝐸𝑝2 |(12)
𝛿 (. , .) is replaced with Euclidean norm (on Query2Box representa-tions) and hyperbolic distance (𝑑ℎ𝑦𝑝 on HypE representations) tounderstand the difference between the hierarchical separation ofentities in the two spaces.
In the Δ𝑖𝑛𝑡𝑟𝑎 results (depicted in Figure 10), we observe that,with increasing level of hierarchy the distance between entities atdifferent levels remains constant in the case of Euclidean space andshows a clear decreasing trend for hyperbolic space. This indicatesdenser clustering of entities at the same level. Additionally, theΔ𝑖𝑛𝑡𝑒𝑟 results, illustrated in Figure 11, depict a linear increase indistance between inter-level entities in the Euclidean space and asuperlinear growth in the hyperbolic space. This shows that hy-perbolic space also learns clusters such that inter-level entities arefarther apart compared to Euclidean space. This nature of inter-leveldiscrimination and intra-level aggregation demonstrates the supe-rior ability of hyperbolic spaces at capturing hierarchical features.
Figure 10: Intra-level Euclidean (Q2B) and Hyperbolic(HypE) distances. The graph presents Δ𝑖𝑛𝑡𝑟𝑎 of entity sets atdifferent hierarchy levels, given on the x-axis.
B ABLATION STUDY: FINER RESULTSThe finer results, across all datasets, of our Ablation study, describedin Section 4.4, are given in Tables 8 and 9. We observe that, on aver-age over all types of reasoning queries, a combination of attentionaggregation for centers and Deepsets aggregation for limits resultsin the best performance across all the datasets. Thus, we utilize thiscombination in our final model.

WWW ’21, April 19–23, 2021, Ljubljana, Slovenia Choudhary et al.
Table 8: Performance comparison of HypE (ours) against the baselines to study the efficacy of its Query-Search space. Thecolumns present different query structures and averages values. The final row presents the Average Relative Improvement (%)of HypE compared to Query2Box over all datasets. Best results for each dataset are shown in bold.
Metrics Hits@3 Mean Reciprocal RankDataset Model 1t 2t 3t 2∩ 3∩ 2∪ ∩𝒕 𝒕∩ ∪𝒕 Avg 1t 2t 3t 2∩ 3∩ 2∪ ∩𝒕 𝒕∩ ∪𝒕 AvgFB15k HypE-Avg-1t .803 .304 .202 .468 .534 .606 .115 .256 .228 .395 .683 .276 .188 .392 .448 .467 .111 .221 .219 .338
HypE-Avg-1,2,3t .803 .392 .282 .527 .612 .608 .155 .305 .317 .446 .675 .355 .257 .438 .513 .467 .144 .262 .296 .380HypE-Avg .802 .479 .361 .585 .690 .609 .194 .353 .405 .497 .667 .433 .325 .483 .578 .467 .177 .302 .373 .422HypE-DS .777 .479 .354 .596 .717 .564 .192 .387 .403 .496 .649 .437 .324 .506 .620 .439 .176 .333 .370 .428HypE-TC .809 .486 .365 .598 .729 .610 .206 .406 .410 .513 .674 .439 .331 .495 .617 .470 .189 .348 .375 .437HypeE (final) .809 .486 .365 .598 .728 .610 .206 .406 .410 .513 .673 .439 .330 .495 .617 .470 .189 .347 .374 .437
FB15k HypE-Avg-1t .567 .229 .141 .312 .387 .223 .081 .155 .157 .258 .498 .216 .135 .269 .319 .185 .179 .261 .152 .258-237 HypE-Avg-1,2,3t .567 .295 .197 .351 .444 .224 .109 .185 .218 .292 .492 .277 .185 .300 .366 .185 .233 .309 .206 .291
HypE-Avg .567 .361 .252 .390 .500 .225 .137 .214 .279 .325 .486 .338 .234 .331 .412 .185 .286 .357 .259 .323HypE-DS .549 .361 .247 .398 .519 .208 .135 .234 .277 .324 .473 .341 .233 .347 .442 .174 .285 .393 .257 .327HypE-TC .573 .366 .256 .399 .528 .225 .146 .246 .283 .335 .490 .344 .238 .339 .440 .186 .306 .411 .260 .335HypeE (final) .572 .366 .255 .399 .527 .225 .145 .246 .282 .335 .490 .343 .237 .339 .440 .186 .305 .410 .260 .334
NELL HypE-Avg-1t .614 .225 .173 .313 .413 .438 .080 .143 .155 .286 .467 .192 .159 .266 .353 .316 .079 .131 .154 .240995 HypE-Avg-1,2,3t .613 .290 .241 .352 .474 .439 .108 .170 .215 .323 .462 .247 .217 .297 .404 .316 .103 .156 .209 .270
HypE-Avg .612 .354 .309 .391 .534 .440 .135 .197 .275 .359 .456 .302 .275 .328 .455 .316 .127 .180 .263 .299HypE-DS .594 .354 .303 .399 .554 .408 .134 .216 .273 .359 .444 .304 .274 .344 .488 .297 .126 .198 .261 .304HypE-TC .618 .360 .313 .400 .563 .442 .144 .228 .278 .371 .461 .306 .279 .336 .487 .319 .135 .207 .264 .310HypeE (final) .618 .359 .312 .400 .563 .441 .143 .227 .278 .371 .460 .306 .279 .336 .486 .318 .135 .207 .264 .310
DBPedia HypE-Avg-1t .963 .473 N.A. .782 .734 .933 .216 .621 .026 .521 .713 .374 N.A. .589 .540 .696 .170 .467 .020 .390|𝑅 | = 𝑝 HypE-Avg-1,2,3t .962 .609 N,A. .880 .841 .936 .291 .739 .036 .588 .724 .455 N.A. .658 .619 .696 .221 .553 .027 .438
HypE-Avg .961 .745 N.A. .978 .948 .938 .366 .856 .045 .655 .715 .555 N.A. .726 .697 .696 .271 .638 .034 .486HypE-DS .932 .745 N.A. .997 .985 .869 .362 .938 .045 .654 .697 .560 N.A. .741 .738 .654 .270 .703 .034 .490HypE-TC .971 .757 N.A. 1.00 1.00 .941 .388 .986 .047 .677 .722 .563 N.A. .745 .745 .701 .289 .733 .034 .504HypeE (final) .970 .756 N.A. 1.00 1.00 .940 .388 .985 .046 .676 .722 .563 N.A. .744 .744 .700 .289 .733 .034 .503
Table 9: Performance comparison of HypE (ours) against the baselines on E-commerce dataset to study the efficacy of themodel’s Query-Search space. The columns present the different query structures and averages over them. The final rowpresents the Average Relative Improvement (%) of HypE compared to Query2Box over all datasets. Best results for each datasetare given in bold.7
Metrics Hits@3 Mean Reciprocal RankDataset Model 1t 2t 3t 2∩ 3∩ 2∪ ∩𝒕 𝒕∩ ∪𝒕 Avg 1t 2t 3t 2∩ 3∩ 2∪ ∩𝒕 𝒕∩ ∪𝒕 AvgE- HypE-Avg-1t 0.0 0.0 0.0 0.0 0.0 0.0 0.0 0.0 0.0 0.0 0.0 0.0 0.0 0.0 0.0 0.0 0.0 0.0 0.0 0.0commerce HypE-Avg-1,2,3t 0.0 28.6 39.4 12.5 0.0 0.5 0.0 50.0 39.8 13.0 -1.0 28.5 36.8 13.3 0.0 0.0 0.0 100 35.3 12.6|𝑅 | = 𝑝 HypE-Avg -0.3 57.1 77.7 25.0 0.0 0.9 0.0 50.0 78.7 26.0 -2.3 57.0 72.8 23.3 0.0 0.0 0.0 100 70.6 24.2
HypE-DS -3.3 57.1 74.5 27.5 0.0 -6.8 0.0 50.0 76.9 26.0 -4.9 58.3 71.9 30.0 0.0 -6.1 0.0 100 69.4 26.3HypE-TC 0.7 60.0 80.9 27.5 0.0 0.9 0.0 50.0 81.5 31.0 -1.3 59.6 75.4 30.0 0.0 0.6 0.0 200 70.6 28.4HypE (final) 0.7 59.3 79.8 27.5 0.0 0.9 0.0 50.0 80.6 30.0 -1.3 58.9 75.4 26.7 0.0 0.6 0.0 100 70.6 28.4
Table 10: Performance comparison of HypE (ours) againstthe baselines on an e-commerce dataset for intersection andunion queries. We fix GQE (E-vector) to be our baseline andreport the relative improvements against that for all themethods. The numbers are in percentages. Best results foreach dataset are shown in bold.Metrics Hits@3 Mean Reciprocal RankDataset Model 2∩ 3∩ 2∪ ∩𝒕 𝒕∩ ∪𝒕 2∩ 3∩ 2∪ ∩𝒕 𝒕∩ ∪𝒕|𝑅 | = 1 GQE 0.0 0.0 0.0 0.0 0.0 0.0 0.0 0.0 0.0 0.0 0.0 0.0
KGAT 53.8 2850 30.8 200 300 0.0 -36.2 -57.3 24.4 -60 -45.5 0.0HQE 0.0 0.0 -57.7 0.0 -50.0 1500 -58.5 -99 -61 -80 -90.9 1100Q2B -1.9 -50 32.7 0.0 50 0.0 -59.6 -99 53.7 -80 -81.8 0.0HypE -1.9 -50 119.2 0.0 50 1500 -59.6 -99 107.3 -80 -81.8 1100
|𝑅 | = 𝑝 GQE 0.0 0.0 0.0 0.0 0.0 0.0 0.0 0.0 0.0 0.0 0.0 0.0KGAT 0.0 0.0 30.2 0.0 2600 0.0 -8.8 0.0 31.3 -25 0.0 0.0HQE 0.0 0.0 0.0 -50 0.0 19400 11.8 0.0 0.0 -75 0.0 14400Q2B 0.0 0.0 95.3 0.0 200 0.0 11.8 0.0 59.4 -75 100 0.0HypE 0.0 0.0 416.3 0.0 2600 19400 11.8 0.0 415.6 -75 100 14400 Figure 11: Inter-level Euclidean (Q2B) and Hyperbolic
(HypE) distances. Each graph presents Δ𝑖𝑛𝑡𝑒𝑟 between entitypairs of a source hierarchical level, given by the graph labeland the other hierarchy levels in the dataset, given on thex-axis.
C E-COMMERCE RESULTSThe intersection and union results on the e-commerce datasets,described in Section 4.3, are given in Table 10.7Due to the sensitive nature of the proprietary dataset, we only report relative results.