self-sufficiency among social services clients in...
TRANSCRIPT

REPORT OF THE JOINT LEGISLATIVE AUDIT AND REVIEW COMMISSION
Self-Sufficiency Among Social Services Clients in Virginia
TO THE GOVERNOR AND THE GENERAL ASSEMBLY OF VIRGINIA
HOUSE DOCUMENT NO. 33
COMMONWEALTH OF VIRGINIA RICHMOND 2006
In Brief…
Self-Sufficiency Among Social Services Clients in Virginia
House Joint Resolution 193 di-rected the Joint Legislative Au-dit and Review Commission (JLARC) to assess the effec-tiveness of the social services system, as measured by changes in client self-sufficiency. During this review, JLARC staff found that the ma-jority of Virginia’s social services clients become more financially independent over time, but that few of them appear to achieve complete self-sufficiency and the ability to meet their families’ needs without the aid of gov-ernment assistance. Since the enactment of welfare reform in 1995, the Virginia social ser-vices system has enabled many individuals who receive cash assistance from the Temporary Assistance for Needy Families (TANF) program to transition into the workforce through the Virginia Initiative for Employ-ment not Welfare (VIEW) pro-gram. However, the VIEW program’s primary focus on ex-pediting employment has not resulted in the achievement of self-sufficiency for most partici-pants. Moreover, the primary intent of benefit programs other than TANF is not to help clients fully achieve self-sufficiency, but rather to act as a safety net. Consequently, the social ser-vices system remains neither designed nor intended to pro-vide non-TANF clients with the services they need to move be-yond poverty and achieve self-sufficiency. This report provides options and recommendations to build upon existing programs in order to help more low-income families become self-sufficient.
JLARC on the Web: http://jlarc.state.va.us
Members of the Joint Legislative Audit and Review Commission
Chairman Delegate Lacey E. Putney
Vice-Chairman Senator Thomas K. Norment, Jr.
Delegate Vincent F. Callahan, Jr. Senator John H. Chichester Senator Charles J. Colgan Delegate M. Kirkland Cox Delegate H. Morgan Griffith Delegate Frank D. Hargrove, Sr. Delegate Johnny S. Joannou Delegate Dwight C. Jones Delegate Harry J. Parrish Senator Walter A. Stosch Delegate Leo C. Wardrup, Jr. Senator Martin E. Williams
Mr. Walter J. Kucharski, Auditor of Public Accounts
Director Philip A. Leone
JLARC Staff for This Report
Hal Greer, Division Chief Nathalie Molliet-Ribet, Project Leader Paula Lambert Brad Marsh Elisabeth Thomson Joan Irby Michelle Hebert-Giffen
Copyright 2005, Commonwealth of Virginia.
Preface
House Joint Resolution 193 (2004) directed the Joint Legislative Audit and Review Commission (JLARC) to assess the extent to which Virginia’s social services system has succeeded in ena-bling its clients to improve their financial independence and achieve self-sufficiency. JLARC staff analyzed the financial outcomes of 14,500 social services benefit recipients between 2002 and 2004, conducted site visits of human services and workforce development agencies in 15 localities, and held interviews with State Department of Social Services and other State agency staff.
The study found that the majority of Virginia’s social services clients decreased their reliance on government assistance over the course of two years, but that they seldom achieved self-sufficiency. Even the families who improved their financial independence earned too little to move out of poverty and to provide for their basic needs. As a result, most families studied con-tinued to receive government benefits to supplement their income. Finally, many social services clients were foregoing a significant income opportunity by not claiming tax credits for which they are eligible.
Since the enactment of welfare reform in 1995, many cash assistance recipients have obtained jobs after participating in the Virginia Initiative for Employment not Welfare (VIEW) program. However, most former VIEW participants have not been able to achieve self-sufficiency, in part because the program focuses primarily on immediate job placement without emphasizing the importance of job quality or preparing clients for long-term job retention and career advance-ment. This report includes recommendations that build upon the current VIEW framework to foster better long-term outcomes.
The study also highlights that the primary intent of benefit programs other than VIEW is not to help clients fully achieve self-sufficiency, but rather to act as a safety net. Consequently, the social services system remains neither designed nor intended to provide non-VIEW clients with the services they need to move beyond poverty and achieve self-sufficiency. The report rec-ommends providing services aimed at improving job retention and career advancement for these clients.
On behalf of the JLARC staff, I would like to express my appreciation to the State Department of Social Services and local departments of social services throughout the Commonwealth for their assistance during this study.
Philip A. Leone Director
January 24, 2006
m JJLLAARRCC RReeppoorrtt SSuummmmaarryySSeellff--SSuuffffiicciieennccyy AAmmoonnggSSoocciiaall SSeerrvviicceess CClliieennttss iinn VViirrggiinniiaa
While the majority of Virginia’s social services clients become more financially independent over time, few of them appear to achieve complete self-sufficiency and the ability to meet their families’ needs without the aid of government assistance. Since the enactment of welfare reform in 1995, the Virginia social services system has enabled many individuals who re-ceive cash assistance from the Temporary Assistance for Needy Families (TANF) program to transition into the work-force through the Virginia Initiative for Employment not Welfare (VIEW) program. However, the VIEW program’s primary focus on expediting employment has not resulted in the achievement of self-sufficiency for most participants. Moreover, the primary intent of benefit programs other than TANF is not to help cli-ents fully achieve self-sufficiency, but rather to act as a safety net. Consequently, the social services system remains neither designed nor intended to provide non-TANF clients with the services they need to move beyond poverty and achieve self-sufficiency.
House Joint Resolution 193 directed the Joint Legislative Audit and Review Commission (JLARC) to assess the extent to which Virginia’s social services system has succeeded in ena-bling its clients to improve their financial independence and achieve self-sufficiency. This report describes the results of that assessment and provides options and recommendations to help more low-income families become self-sufficient. For purposes of this study, self-sufficiency has been defined as having sufficient income to provide for a family’s basic needs without relying on government assistance. In addition, the study focused on the achievement of self-sufficiency by able-bodied adults.
Majority of Social Services Families Become More Financially Independent, but Few Achieve Complete Financial Independence
Over the course of the two-year period studied (from July 2002 to September 2004), the majority of social services clients im-proved their financial independence and reduced their reliance on government assistance. While most families who became more financially independent also advanced closer to self-sufficiency, some had less total economic resources at the end of the two-year period. In addition, most families earned, on average, too little to move beyond poverty and to provide for
JLARC Report Summary i

their families’ basic needs. As a result, most families contin-ued to receive government benefits to supplement their in-come.
Majority of Families Improved Their Financial Independ-ence. Nearly 60 percent of the 14,500 families studied for this report became more financially independent and reduced their reliance on government assistance at the end of the two-year period studied, as shown in the figure below. The benefit re-cipients most likely to improve their financial independence were TANF recipients participating in the VIEW program, closely followed by Food Stamp recipients who did not receive cash assistance through TANF during the study period. Fami-lies that received TANF benefits without participating in the VIEW program were the least likely to decrease their reliance on government assistance.
Families generally improved their financial independence as a result of one of the following three changes:
• Increased wages; • Increased child support collections; or • Reduction in government assistance.
In contrast, the families who did not improve their financial in-dependence experienced significant setbacks in wages that prompted a greater reliance on government assistance.
Improved financial independence appears to be strongly linked to wages, which are driven by clients’ ability to obtain employ-ment and advance in the workplace. The families who in-creased their financial independence over the two-year period also achieved higher employment levels and wages by the end
Proportion of Families Who Improved Their Financial Independence Between July 2002 and September 2004 Source: JLARC analysis of data from federal and State agencies.
Families LessFinancially Families More
Independent
41%
59%
Financially(N = 5,890) Independent
(N = 8,573) VIEW TANF 65%
Food Stamp 62%Non-TANF
Non-VIEW TANF 48%
JLARC Report Summary ii

of the period studied, as illustrated in the figure on the follow-ing page. To achieve these results, the vast majority of clients obtained new jobs that paid higher wages or offered more hours. While employment and increased wages were associ-ated with improved financial independence across all benefit programs, VIEW participants and Food Stamp recipients who were not enrolled in TANF experienced these positive changes to a greater degree than non-VIEW TANF recipients, partially explaining the differences in the proportion of recipients who became more financially independent in each program.
Changes in Employment and Wages During Period Studied Source: JLARC staff analysis of data from the Virginia Employment Commission.
Percent Employed Average Annual Wages (for Employed Clients)
Families More Financially
Independent (N = 8,573)
Families Less
Financially Independent
(N = 5,890)
$12,999 $12,167 59%
34%
$17,368
$12,191 59%
82%+ 39% + 42%
-42%
+ 7%
Jul-Dec 2002 Sept 2004 Jul-Dec 2002 Sept 2004
Collection of child support payments was another significant component of increased income for families who improved their financial independence. Both the proportion of families who collected child support payments and the average amount collected increased significantly among those who became more financially independent. The most dramatic increase in child support collections occurred among families who re-ceived TANF benefits, a trend that may be linked to the fact that TANF recipients must cooperate with the Division of Child Support Enforcement (DCSE) in seeking child support pay-ments.
In addition to increasing their income, most families who be-came more financially independent also experienced signifi-cant decreases in the amount of government assistance they were receiving by the end of the period studied. Half of fami-lies who became more financially independent no longer re-
JLARC Report Summary iii
-
ceived Food Stamp benefits, and the proportion of more finan-cially independent families receiving cash assistance declined by more than 60 percent.
A Quarter of Families Who Improved Their Financial Inde-pendence Did Not Advance Closer to Self-Sufficiency. Improved financial independence does not always result in progress toward self-sufficiency. While the majority of families who became more financially independent also advanced closer to self-sufficiency, one-quarter of them experienced a decline in their total economic resources and were generally less capable of meeting their basic needs at the end of the two-year period studied. The total financial resources of these families decreased because their income either did not in-crease sufficiently to offset the amount of government assis-tance they lost, or because they reduced their reliance on gov-ernment assistance without a simultaneous increase in income.
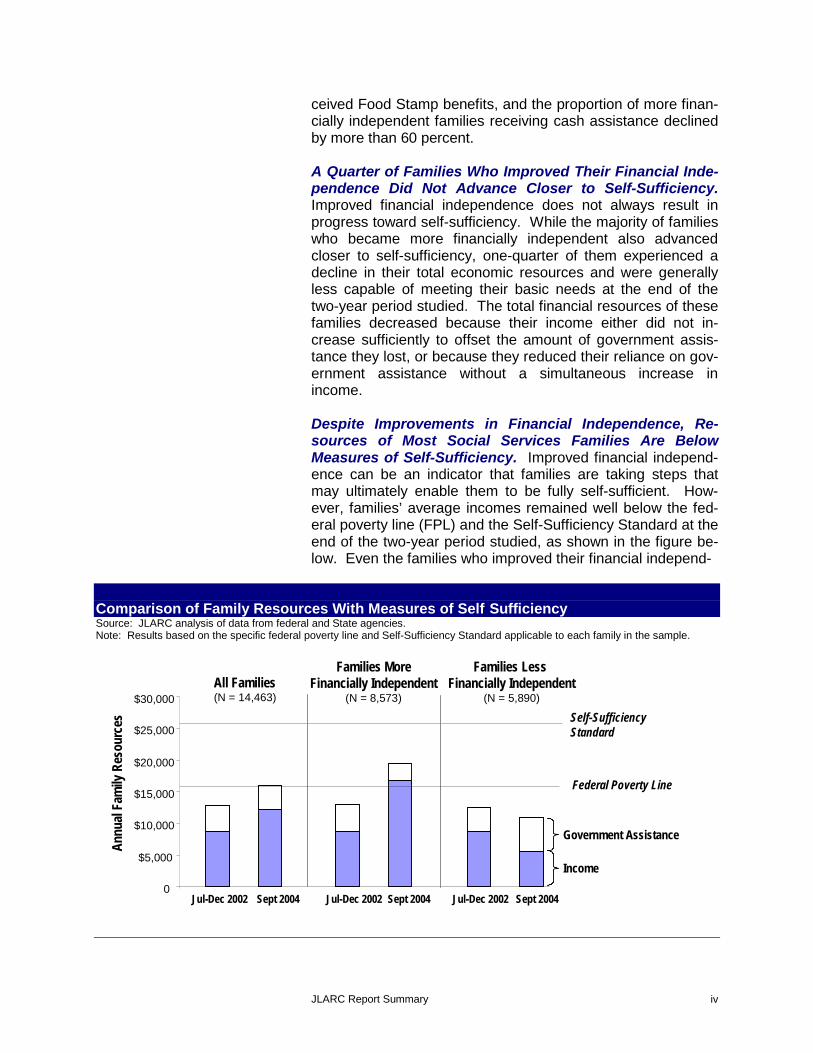
Despite Improvements in Financial Independence, Re-sources of Most Social Services Families Are Below Measures of Self-Sufficiency. Improved financial independ-ence can be an indicator that families are taking steps that may ultimately enable them to be fully self-sufficient. How-ever, families’ average incomes remained well below the fed-eral poverty line (FPL) and the Self-Sufficiency Standard at the end of the two-year period studied, as shown in the figure be-low. Even the families who improved their financial independ-
Comparison of Family Resources With Measures of Self SufficiencySource: JLARC analysis of data from federal and State agencies.Note: Results based on the specific federal poverty line and Self-Sufficiency Standard applicable to each family in the sample.
Families More Families Less All Families Financially Independent Financially Independent
$30,000 (N = 14,463) (N = 8,573) (N = 5,890)
Annu
al F
amily
Res
ourc
es
$25,000
$20,000
$15,000
$10,000
$5,000
0 Jul-Dec 2002 Sept 2004 Jul-Dec 2002 Sept 2004 Jul-Dec 2002 Sept 2004
Self-Sufficiency Standard
Federal Poverty Line
Government Assistance
Income
JLARC Report Summary iv
-
ence earned, on average, only $17,000 per year and remained far from being fully self-sufficient.
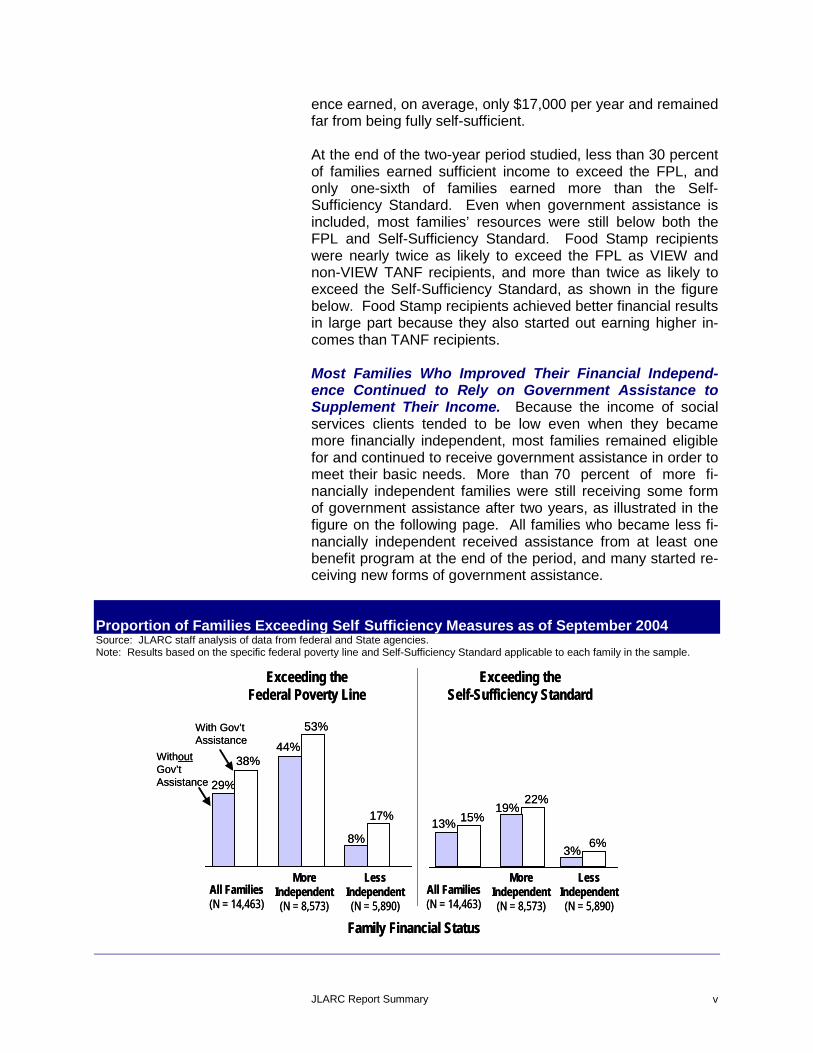
At the end of the two-year period studied, less than 30 percent of families earned sufficient income to exceed the FPL, and only one-sixth of families earned more than the Self-Sufficiency Standard. Even when government assistance is included, most families’ resources were still below both the FPL and Self-Sufficiency Standard. Food Stamp recipients were nearly twice as likely to exceed the FPL as VIEW and non-VIEW TANF recipients, and more than twice as likely to exceed the Self-Sufficiency Standard, as shown in the figure below. Food Stamp recipients achieved better financial results in large part because they also started out earning higher in-comes than TANF recipients.
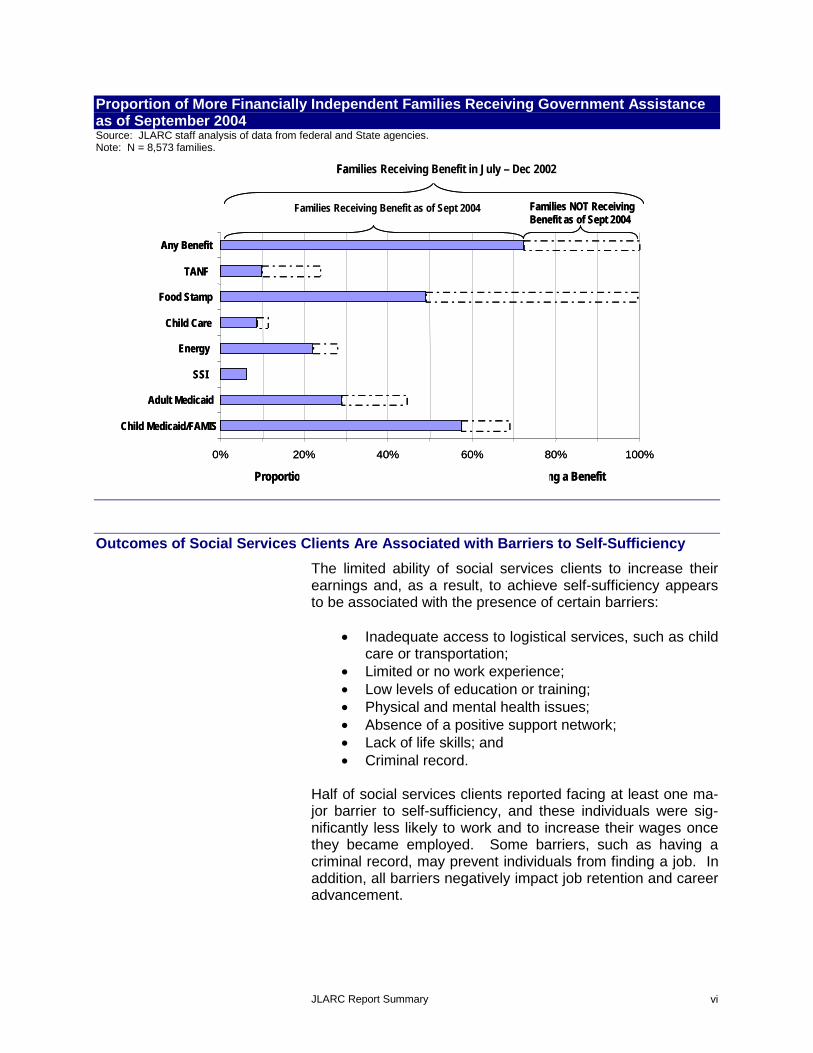
Most Families Who Improved Their Financial Independ-ence Continued to Rely on Government Assistance to Supplement Their Income. Because the income of social services clients tended to be low even when they became more financially independent, most families remained eligible for and continued to receive government assistance in order to meet their basic needs. More than 70 percent of more fi-nancially independent families were still receiving some form of government assistance after two years, as illustrated in the figure on the following page. All families who became less fi-nancially independent received assistance from at least one benefit program at the end of the period, and many started re-ceiving new forms of government assistance.
Proportion of Families Exceeding Self Sufficiency Measures as of September 2004 Source: JLARC staff analysis of data from federal and State agencies.Note: Results based on the specific federal poverty line and Self-Sufficiency Standard applicable to each family in the sample.
Exceeding thExcee eding the Federal Poverty LineFederal Poverty Line
With Gov’tWith Gov’t 53%53%AssistanceAssistance 44%44%
WithoutWithout 38%38%Gov’Gov t’tAssistanceAssistance 29%29%
17%17%
8%8%
MoreMore LessLess All Families IndependentAll Families Independent IndependentIndependent(N = 14,463) (N = 8,573)(N = 14,463) (N = 8,573) (N( = 5,890)N = 5,890)
Exceeding thExcee eding the Self-Sufficiency StandardSelf-Sufficiency Standard
22%22%19%19%
13%13% 15%15%
6%6%3%3%
MoreMore LessLess All Families IndependentAll Families Independent IndependentIndependent(N = 14,463) (N = 8,573)(N = 14,463) (N = 8,573) (N( = 5,890)N = 5,890)
Family Financial StatusFamily Financial Status
JLARC Report Summary v
Families Receiving Benefit as of Sept 2004
More Financially Independent Families Receivi
milies Receiving Benefit in July Dec 2002
Proportion of More Financially Independent Families Receiving Government Assistance as of September 2004 Source: JLARC staff analysis of data from federal and State agencies. Note: N = 8,573 families.
FaFa
Families Receiving Benefit as of Sept 2004 Families NOT ReceivingFamilies NOT ReceivingBenefit as of Sept 2004Benefit as of Sept 2004
–milies Receiving Benefit in July – Dec 2002
Child Medicaid/FAMIS
Adult Medicaid
SSI
Energy
Child Care
Food Stamp
TANF
Any Benefit
Child Medicaid/FAMIS
Adult Medicaid
SSI
Energy
Child Care
Food Stamp
TANF
Any Benefit
0% 20% 40% 60% 80% 100%0% 20% 40% 60% 80% 100%
Proportion ofProportion of More Financially Independent Families Receivi ng a Benefitng a Benefit
Outcomes of Social Services Clients Are Associated with Barriers to Self-Sufficiency The limited ability of social services clients to increase their earnings and, as a result, to achieve self-sufficiency appears to be associated with the presence of certain barriers:
• Inadequate access to logistical services, such as child care or transportation;
• Limited or no work experience; • Low levels of education or training; • Physical and mental health issues; • Absence of a positive support network; • Lack of life skills; and • Criminal record.
Half of social services clients reported facing at least one ma-jor barrier to self-sufficiency, and these individuals were sig-nificantly less likely to work and to increase their wages once they became employed. Some barriers, such as having a criminal record, may prevent individuals from finding a job. In addition, all barriers negatively impact job retention and career advancement.
JLARC Report Summary vi

Virginia’s VIEW Program Could Be Modified to Better Address the Barriers to Self-Sufficiency Most Prevalent Among TANF Recipients
While the State has been very successful in helping TANF re-cipients obtain a job through the VIEW program, the financial outcomes of former recipients suggest that employment alone represents only a first step toward economic self-sufficiency. Most former VIEW participants have not been able to achieve self-sufficiency and eliminate their reliance on government as-sistance, in part because the program focuses primarily on immediate job placement without emphasizing the importance of job quality or preparing clients for long-term job retention and career advancement. In addition, able-bodied TANF re-cipients who are temporarily exempt from VIEW work require-ments, primarily while they are pregnant or caring for young children, receive neither support nor positive incentives to ad-vance closer to self-sufficiency. Despite the current limita-tions, the VIEW program provides a useful framework upon which to build the next phase of welfare reform in Virginia, which could help more low-income families to realize the goal of self-sufficiency through a sustained focus on barriers to self-sufficiency, better job quality, and preparation for career ad-vancement.
Some TANF Recipients Could Engage in the VIEW Pro-gram Sooner. Clients who are mandated to participate in the VIEW program are significantly more likely than VIEW-exempt TANF recipients to become employed, increase their wages, and improve their financial independence. Yet, nearly 40 per-cent of able-bodied TANF recipients were temporarily exempt from the VIEW program at the start of the period studied, pri-marily because they were caring for a young child or were pregnant, and many of them did not ultimately enter the VIEW program. As a result, many TANF recipients are neither pro-vided with the services that could help them to advance closer to self-sufficiency nor held accountable for their progress. To engage a greater number of TANF recipients in VIEW, the du-ration of the exemption provided to mothers of young children could be shortened, and actions could be taken to promote the benefits of volunteering for the program.
Recommendation 1. The General Assembly may wish to consider amending §63.2-609 of the Code of Virginia to ex-empt from TANF work requirements parents or caretakers who personally care for a child under 12 months of age in-stead of 18 months.
Emphasis on Addressing Barriers to Self-Sufficiency Could Have Longer-Term Outlook. While the VIEW pro-gram is designed to address barriers that may prevent clients from securing initial employment, the structure of the program
JLARC Report Summary vii
does not currently facilitate the resolution of such barriers. Case managers initially work with clients to create a service plan aimed at alleviating common barriers, but they lack the ability to enforce compliance with the plans once clients obtain a full-time job. Left unaddressed, these barriers will likely con-tinue to affect clients and threaten their ability to retain their jobs and further advance toward self-sufficiency. These nega-tive effects suggest that the focus on alleviating or removing barriers should remain throughout clients’ involvement with the VIEW program, even after they have obtained a job.
To foster better long-term outcomes, it may be necessary for the VIEW program to elevate the importance of addressing barriers to the level of participating in work activities. One method might be to allow case managers to impose sanctions for failure to comply with the activities listed in clients’ service plans.
Focus on Quality Job Placements Could Be Improved. Al-though the social services system has effectively assisted VIEW participants with securing employment, many clients remain underemployed and earn less than they need to ade-quately provide for their families. Currently, the VIEW program appears to place limited attention on job quality. As a result, the social services system may be missing an opportunity to improve clients’ first employment experience so that it not only meets their immediate needs but also leads to long-term op-portunities that will bring them closer to self-sufficiency. To improve the quality of VIEW participants’ employment oppor-tunities, the current employment focus of the program could be shifted to encompass job quality, and this shift could be re-flected in program policies and practices.
Recommendation 2. The Secretary of Health and Human Resources and the Virginia Department of Social Services should adopt a dual employment focus for the VIEW pro-gram, emphasizing both expeditious job placement and job quality in order to ensure that more participants secure jobs that offer higher wages, opportunities for advancement with an employer, or access to viable career paths. The Secre-tary and Department should consider how the VIEW program could be restructured to increase the proportion of partici-pants who are able to obtain such higher quality jobs.
The Virginia Workforce Network (VWN) has the expertise to help staff and clients of the social services system improve job quality. However, it does not appear that many effective local partnerships have been forged between the social services system and the VWN. Because VIEW participants tend to lack marketable skills, it is important for them to have access to and use existing employment and career advancement infor-
JLARC Report Summary viii

mation available in workforce centers to make better job deci-sions. However, despite the statutory obligation of the VWN and the social services system to help VIEW participants achieve self-sufficiency, they have not collaborated effectively to maximize the employment opportunities of VIEW clients.
Recommendation 3. The Secretaries of Health and Human Resources and Commerce and Trade should consider what factors have limited effective collaboration between the social services system and the Virginia Workforce Network and what measures can be taken to develop an effective partner-ship in order to provide more VIEW participants with existing information about job opportunities and career development.
Emphasis on Combining Job Placement with Training and Education Could Be Strengthened. Without acquiring mar-ketable skills, VIEW participants are unlikely to advance into positions that pay a self-sufficient wage. While the VIEW pro-gram’s emphasis on job placement has been highly beneficial to participants, local department staff and numerous studies indicate that participation in training or education activities is also essential to increasing the number of social services cli-ents who achieve self-sufficiency. Nineteen states currently give their TANF recipients this flexibility. Most of these states allow TANF recipients to pursue training or education for up to ten hours a week, while working for at least 20 hours. Numer-ous studies have demonstrated that this mixed approach pro-duces the highest levels of employment and wage gains among TANF recipients, compared to strategies that focus ex-clusively on job placement or on education and training. Therefore, the State may wish to establish a pilot project that would assess the effectiveness and costs of a mixed approach in Virginia, and identify specific practices that produce the most successful results.
Recommendation 4. The General Assembly may wish to consider establishing a pilot project in which the statutory re-quirement placing priority on obtaining full-time employment would be waived, and VIEW participants would be allowed the flexibility to divide their 30-hour participation requirement between work and up to ten hours of training or education.
In addition, because VIEW participants typically enter the pro-gram with few marketable skills and, in many cases, without a high school diploma or GED, it is unrealistic to expect that all clients will acquire the competencies necessary to earn self-sufficient wages during their two years in the program, espe-cially given the program’s current emphasis on full-time em-ployment. However, clients who leave the program do not consistently have a long-term education and training plan that
JLARC Report Summary ix
positions them to move toward self-sufficiency, and are often not aware of how to access the training and education re-sources available to achieve this goal. Moreover, despite the availability of career planning services and funding for training or education, few former VIEW participants appear to utilize workforce centers to improve their earnings potential.
Recommendation 5. The Virginia Department of Social Services should (1) encourage local departments to raise awareness of workforce center services among VIEW par-ticipants; and (2) require the development of a long-term education and training plan for all VIEW participants.
Recommendation 6. The Secretaries of Health and Human Resources, Commerce and Trade, and Education should consider measures the State can take to increase short-term training programs through workforce centers or other entities that would be available to current and former clients of the social services system to enhance their skills and provide them with a greater opportunity to obtain quality jobs.
Focus on Self-Sufficiency Could Be Expanded Beyond TANF Recipients The concept of shared accountability that transformed the pro-vision of cash assistance through TANF was not applied to programs that provide other benefits such as Food Stamps or Medicaid. As a result, most of these program participants are not subject to the requirements or expectations applied to TANF recipients. In addition, the social services system’s op-erations are not structured to provide the majority of these cli-ents with the services and incentives that could support their advancement toward self-sufficiency. Yet, it appears that cli-ents who do not receive cash assistance are also experiencing long-term difficulties that preclude them from securing jobs that pay self-sufficient wages, and a quarter of these families eventually come to rely on TANF benefits.
Shift in Priorities and Resources Would Be Needed to Es-tablish Self-Sufficiency as a Goal for All Recipients. Be-cause the goal of benefit programs other than TANF is not to help families achieve self-sufficiency but rather to act as a safety net that supplements low-income families’ resources, a fundamental question is whether the State should avail more low-income families of the services they need to become more financially independent. One argument in favor of providing such services is that most families receiving government as-sistance appear unable to attain self-sufficiency on their own and likely will continue to rely on various government pro-grams if they do not receive support services.
JLARC Report Summary x

However, there is limited infrastructure within the social ser-vices system that can be built upon to assist non-TANF benefit recipients, and priorities and resources would need to be shifted in order to provide all Department of Social Services (DSS) clients with the same level of services and resources that are currently provided through the VIEW program. Fol-lowing the principles that guided welfare reform, this shift would entail promoting personal accountability combined with providing services that would alleviate barriers to employment and promote job retention and career advancement.
Personal Accountability Could Be Emphasized. Most able-bodied recipients of government assistance are not required to work or cooperate with child support enforcement authorities, although these requirements appear to be associated with gains in financial independence. While the federal govern-ment has not granted states the flexibility to impose work re-quirements upon benefit recipients who do not participate in TANF, Virginia could choose to make cooperation with DCSE a condition of eligibility for Food Stamp and Child Care Sub-sidy benefits.
From a financial standpoint, child support payments can help families advance closer to self-sufficiency. Families who col-lect child support payments could receive, on average, an ad-ditional $3,000 per year, and would likely be able to reduce their reliance on government assistance.
Recommendation 7. The General Assembly may wish to consider whether the Code of Virginia should be amended to require participants in the Food Stamp and Child Care Sub-sidy programs to cooperate with the Division of Child Support Enforcement as a condition of program participation, as is currently required of participants in the TANF program.
Providing Assessment and Service Referrals Could Help Clients Overcome Barriers to Self-Sufficiency. Benefit re-cipients may be unable to obtain better jobs because they face barriers that have not been addressed, such as mental health issues or a lack of occupational skills or education. Although clients throughout the social services system tend to face simi-lar barriers, only the VIEW program formally assesses the presence of barriers and makes appropriate referrals based on the assessment. As a result, many low-income families may be unaware of the issues that preclude them from advancing toward self-sufficiency or may lack the guidance necessary to remove these hurdles.
A number of options exist to enhance the role of the social ser-vices system with respect to removing barriers to self-sufficiency for its non-TANF clients. A low-cost option would
JLARC Report Summary xi
be for local departments to consistently provide clients with in-formation about agency and community partners that offer commonly needed services. In addition, screeners or eligibility workers could identify major barriers and make service refer-rals. Finally, case managers could help clients schedule and access services, and follow up on their effectiveness.
Job Placement and Career Advancement Initiatives Could Help Clients Advance Closer to Self-Sufficiency. The so-cial services system does not systematically attempt to link the majority of its clients with services that could facilitate their transition into employment or better jobs. To expand access to the type of employment services that non-TANF clients need to advance toward self-sufficiency, the social services system could build upon the existing Food Stamp Employment and Training (FSET) program to provide the level of employ-ment, training, and education services that is currently avail-able only to VIEW participants. The scope of this expansion could range from providing more services only to current pro-gram participants, to engaging all able-bodied Food Stamp re-cipients. Maximizing enrollment in this program would lead to higher overall costs, particularly if child care is provided to parents. However, the State’s portion of this investment would be only half of the total because the federal government would match additional FSET expenditures at a rate of 50 percent.
Recommendation 8. The Secretary of Health and Human Resources and the Virginia Department of Social Services should develop a pilot project in which the intensity of ser-vices provided through the Food Stamp Employment and Training program would be increased to the level provided through the VIEW program, and participation would be ex-panded to all Food Stamp recipients who choose to volunteer for the program. The pilot project should include an evalua-tion component to assess program costs and effectiveness, and to provide a basis upon which to evaluate whether statewide expansion should be pursued.
Rather than, or in conjunction with, building in-house capacity, the social services system could act as a facilitator in linking its clients with resources available at local workforce centers. The VWN is the only significant source of case management and funding for non-TANF DSS clients who wish to pursue training and education, and is required by law to serve low-income individuals. However, as previously discussed with re-spect to VIEW participants, it does not appear that coordina-tion between the VWN and social services system is consis-tently taking place. Moreover, the VWN has generally failed to proactively engage social services clients who most need their services in order to achieve self-sufficiency, as evidenced by the low proportion (four percent) of benefit recipients who have
JLARC Report Summary xii
received intensive case management or training services at a workforce center. While the VWN could play a greater role in helping benefit recipients advance toward self-sufficiency, funding limitations and distance may prevent workforce cen-ters from being able to serve all social services clients who could benefit from their assistance.
Recommendation 9. The Secretaries of Health and Human Resources and Commerce and Trade should consider what factors have limited effective collaboration between the social services system and the Virginia Workforce Network, and what measures can be taken to develop an effective partner-ship in order to provide more non-VIEW clients with (1) exist-ing information about job opportunities and career develop-ment; and (2) career guidance and access to training or education that are not available through the social services system.
State Department of Social Services Could Better Support Local Departments’ Self-Sufficiency Initiatives. Most of the work required to help clients achieve self-sufficiency is con-ducted at the local level, but DSS could do more to support lo-cal efforts. To date, DSS has made only limited attempts to partner with local departments to support the implementation of new initiatives. Specifically, DSS could help local depart-ments to: secure additional funding by providing grant funding application and administration support, forge regional partner-ships, and learn about and disseminate effective practices adopted by other departments or states. This additional sup-port could facilitate the local implementation of initiatives that foster self-sufficiency for all clients.
Underutilized Tax Credits Could Advance Social Services Clients Closer to Self-Sufficiency
Unclaimed tax credits administered by the federal and State government could be a large source of additional income for clients of the social services system. While the majority of these families appear to be eligible for several types of federal and State tax credits, many do not claim these credits, as illus-trated in the figure on the next page.
If the families who receive financial assistance through DSS claimed each tax credit for which they are eligible, their aver-age annual resources could increase by thousands of dollars.
JLARC Report Summary xiii

$170 million for 66,000 families
$41 million for 59,000 families
$21 million for 44,000 families
$3 million for 25,000 families
Potential Tax Credit Opportunity for Families Receiving DSS Benefits (2005 EstimateSource: JLARC staff analysis of 2003 State income tax returns and July 2005 Virginia Department of Social Services caseload.
Percent ClaimedPercent Claimed Potential OpportunityPotential Opportunity
Credit for Low-Income Individuals
Child and Dependent Care Tax Credit
Child Credit
Earned Income Tax Credit
Credit for Low-Income Individuals
Child and Dependent Care Tax Credit
Child Credit
Earned IncomeTax Credit
$170 million for 66,000 families
$41 million for 59,000 families
$21 million for 44,000 families
$3 million for 25,000 families
0% 20% 40% 60% 80% 100%0% 20% 40% 60% 80% 100%
This increase in resources would benefit clients and the State by:
• Raising the proportion of families who reduce their re-liance on government assistance;
• Lifting more families out of poverty and above the Self-Sufficiency Standard; and
• Bringing a substantial amount of additional federal dol-lars into the State’s economy.
To increase the proportion of eligible families who receive tax credits, the State could follow a two-pronged approach:
• Raise awareness among clients of the social services system about the existence and benefits of tax credits; and
• Link potentially eligible clients with tax preparation services.
The Virginia tax return form could be amended to require tax-payers to indicate whether they have claimed the federal earned income tax credit (EITC). This information could then be used by DSS to conduct targeted outreach to those clients who appear to be eligible for but have not claimed the EITC in prior years. During the tax preparation process, families could claim not only the EITC but also other credits for which they are eligible.
JLARC Report Summary xiv

Recommendation 10. The General Assembly may wish to consider amending the Code of Virginia to require the Vir-ginia Department of Taxation to obtain from taxpayers who file a Virginia individual income tax return the following infor-mation: (1) whether they claimed the federal Earned Income Tax Credit, and (2) the amount claimed.
Recommendation 11. The General Assembly may wish to consider amending §58.1-3 of the Code of Virginia to expand the authority of the Tax Commissioner to share with the Vir-ginia Department of Social Services information about its cli-ents’ filing status, number and type of dependents, and whether they have claimed the federal Earned Income Tax Credit.
While a lack of awareness may be a significant factor prevent-ing Virginia low-income families from claiming tax credits, an-other barrier may be the lack of access to tax preparation as-sistance. Although free tax preparation sites administered by volunteers are the best option for low-income families who need guidance, these sites would not be able to meet the de-mand that would likely result from a strong outreach effort to DSS clients. To increase the number of free tax sites, addi-tional volunteers would have to be recruited in areas that are currently underserved. Because of the potential benefits that their clients could derive from obtaining tax credits, DSS should use its staff to identify and contact potentially eligible clients, and lead a statewide recruitment campaign that would target volunteers from all potential private and public sources.
Recommendation 12. The Secretary of Health and Human Resources and the Virginia Department of Social Services should continue to make Earned Income Tax Credit outreach an agency priority. The Department of Social Services should allocate existing State staff as needed to make the necessary contacts with families who may be eligible for the federal tax credit and to recruit volunteers who can provide tax preparation support to those filers seeking to claim the credit. The Department of Social Services should develop and present a plan for conducting this outreach to the House Appropriations Committee and the Senate Finance Commit-tee by September 1, 2006, and begin outreach efforts for the 2006 tax year.
Innovative Local Practices Enable Some Local Departments to Better Facilitate Clients’ Progress Toward Self-Sufficiency
While the social services system has not consistently enabled clients to fully achieve self-sufficiency, some local departments have adopted supplemental practices in an attempt to help
JLARC Report Summary xv

more families achieve greater financial independence. Fre-quently, these local departments are led by directors who cre-ate and communicate a clear vision and goals related to self-sufficiency; engage staff in realizing their vision; and measure the agency’s performance against stated goals.
Innovative practices adopted by local departments use the flexibility they have been granted by a locally-administered system to individualize clients’ experiences and provide a full array of services built through collaboration. The following ini-tiatives appear to enhance the ability of agency staff to better identify the needs of families and improve service availability so that clients are better equipped to advance toward self-sufficiency:
• Formal barrier assessment tools that improve consis-tency and reliability in assessing the needs of clients;
• Emphasis on job quality and balancing employment with education and training to foster long-term success;
• Job readiness courses that result in better access to resources, services, and skills that can support ad-vancement toward self-sufficiency;
• Service provision and referrals for non-TANF clients; • Strong collaborative partnerships across organizations
that serve common clients built through regular com-munication, co-location, or regional initiatives; and
• Outreach to local employers to enhance clients’ ability to find and maintain quality employment.
JLARC Report Summary xvi

TTaabbllee ooff CCoonntteennttss
Chapter Page
1 Defining and Measuring Self-Sufficiency
2 Financial Assistance for Low-Income Families
3 Changes in Client Self-Sufficiency
4 Barriers to Self-Sufficiency
5 Improving the Outcomes of TANF Recipients
6 Self-Sufficiency Efforts Beyond TANF
7 Tax Credit Opportunities
8 Innovative Local Practices 105
Appendixes 119
1
9
23
39
53
75
95

Cha
pter 11 DDeeffiinniinngg aanndd MMeeaassuurriinngg
SSeellff--SSuuffffiicciieennccyyIn
Sum
mar
y... The notion of self-sufficiency is primarily rooted in the nation’s reform of
welfare programs which took place in the mid-1990s. At that time, self-sufficiency was advanced as a critical goal for families receiving cash assistance. Although the concept has become an important component of social policy, no standard definition of self-sufficiency appears to exist in Virginia or the nation, making it difficult to evaluate to what degree the goal of self-sufficiency has been attained. For purposes of this study, self-sufficiency has been defined as having sufficient income to provide for a family’s basic needs without relying on government assistance. The federal poverty line and the Self-Sufficiency Standard are two benchmarks that can be used to measure whether families ultimately achieve complete self-sufficiency. In addition, changes in financial in-dependence can be used to assess the extent to which clients are re-ducing their reliance on government assistance over time.
The effectiveness of Virginia’s social services system in help-ing its clients achieve self-sufficiency not only affects families’ well-being, but can also trigger long-term financial conse-quences for the federal, State, and local governments that provide financial assistance to citizens in need. House Joint Resolution 193 (Appendix A) directs the Joint Legislative Audit and Review Commission (JLARC) to assess the extent to which Virginia’s social services system has succeeded in ena-bling its clients to advance toward and achieve self-sufficiency. The primary research methods used to conduct this assess-ment included site visits to 15 localities, a quantitative analysis of changes in the financial situation of nearly 14,500 social services clients over the course of 27 months, and a survey of 500 former and current clients. More details about these methods are provided in Appendix B. In addition, common ac-ronyms are defined in Appendix C.
DEFINING SELF-SUFFICIENCY Decreased reliance on government assistance has traditionally been used to measure the success of welfare reform. This measure captures whether families are less dependent on the social services system to meet their needs, but it does not consider families’ economic well-being. As a result, some families who are less reliant on government assistance may not be closer to self-sufficiency because their incomes remain too low to adequately support their needs. A more compre-
Chapter 1: Defining and Measuring Self-Sufficiency 1

The definition of self-sufficiency is for a family to achieve a level of in-come necessary to meet its basic needs without having to rely on govern-ment assistance.
hensive definition of self-sufficiency integrates the concept of reliance on government assistance with that of income ade-quacy. Based on a review of social policy literature and inter-views with staff of the social services system in Virginia, the most appropriate definition of self-sufficiency for purposes of this study is for a family to achieve a level of income that is sufficient to meet its basic needs without having to rely on government assistance.
Identifying Basic Needs Before the income level to adequately support a family can be determined, it is necessary to identify the goods and services that are basic necessities for self-sufficient families. At the most fundamental level, families must be able to purchase food and clothing and secure safe, stable housing arrange-ments. In addition, working parents should be able to access reliable child care and transportation.
Access to health care is also considered a basic need in the context of this study, although this commodity may not be as basic as food or shelter. Being able to receive medical care appears to be critical to long-term well-being and the ability to be a reliable and productive employee. Because good health impacts the ability to work, which is a significant component of becoming and remaining self-sufficient, it follows that access to health care should be included as a basic necessity.
Determining Income Level Necessary to Meet Basic Needs While the needs of self-sufficient families can be readily estab-lished, it is more problematic to determine how much income a family has to earn to secure access to these basic necessities. A review of the literature on social services programs revealed two primary benchmarks that can be used to gauge whether a family earns enough to meet its basic needs:
• The federal poverty threshold, most commonly known as the federal poverty line (FPL), which is widely used in the context of social services programs as a yard-stick for poverty; and
• The Self-Sufficiency Standard, which quantifies the cost of providing for a family in every major Virginia locality.
While the FPL is an established metric, its adequacy as a meaningful measure of poverty has been widely criticized. Moreover, not living in poverty is not the same as being fully self-sufficient. The Self-Sufficiency Standard addresses many of the concerns raised about the FPL, yet it is not as widely known and accepted. Using both measures in tandem creates
Chapter 1: Defining and Measuring Self-Sufficiency 2

The FPL is frequently used to reflect the income level that families must exceed in order to not be living in poverty.
The Self-Sufficiency Stan-dard represents the in-come required for families to meet their basic needs such as food, housing, child care, transportation, and health care.
a useful spectrum of self-sufficiency levels against which to compare the income of families served by the social services system.
Income Relative to the Federal Poverty Line. The FPL is frequently used to reflect the income level that families must exceed in order to not be living in poverty. To exceed the poverty line in 2005, a family of three would need to earn more than $16,090. Because of its association with poverty, the FPL is used as the basis to determine eligibility for many safety net benefit programs.
Created in the mid-1960s, the FPL was not developed as an item-by-item budget with specific amounts assigned to each consumption category. Instead, the threshold was set to equal three times a family’s food budget because, in 1955, food ex-penses were estimated to represent one-third of families’ total expenses.
Since its creation, the FPL has changed yearly only to reflect cost-of-living increases, while its basic methodology has re-mained the same. The FPL is highly consistent over time, making it easy to use for comparative purposes, and it varies based on family size to reflect the incremental costs of raising larger families.
The FPL has been widely criticized by academic and public researchers as outdated, improperly constructed, and inflexi-ble. Foremost among these criticisms is that the FPL does not capture the mix of necessities that face today’s families such as child care, which was not as frequently required when the measure was created. Furthermore, the poverty line is a na-tional estimate that does not incorporate cost-of-living differ-ences across the country, or across localities. As a result, this poverty indicator may not provide an accurate measure of the income needed for families to advance beyond poverty and meet their basic economic needs.
Income Relative to the Self-Sufficiency Standard. The con-cerns associated with the FPL were, in large part, addressed through a project to develop a methodology for calculating a Self-Sufficiency Standard that could be implemented in every state. Funded by the Ford Foundation, this initiative aimed to identify the income required for families to meet their basic needs. Unlike the FPL, the Self-Sufficiency Standard is the sum of costs assigned to all basic necessities, including food, housing, child care, transportation, health care, other inciden-tals, and taxes, which are offset by tax credits. In addition, these costs account for variations in family composition and the age of children, two aspects that are found to impact the income required to meet a family’s basic needs. More detailed
Chapter 1: Defining and Measuring Self-Sufficiency 3
Many states, including Vir-ginia, chose to adopt the Self-Sufficiency Standard methodology and devel-oped their own standard.
information on the background and methodology behind the Self-Sufficiency Standard is included in Appendix D.
Many states chose to adopt this methodology to create their own standard, including Virginia, which first calculated a stan-dard for each locality in 2002. In 2006, the Virginia Depart-ment of Social Services will begin updating the Self-Sufficiency Standard annually to assess the degree to which its current and former clients achieve self-sufficiency.
This comprehensive approach highlights the substantial dis-connect between traditional measures such as the federal poverty line, and what it takes to live “adequately” according to the Self-Sufficiency Standard’s methodology. For example, a family of three composed of a parent, a preschooler, and a school-age child would not be considered poor, according to the federal poverty guidelines, if they earned more than $16,090 in the Norfolk area. In contrast, the Self-Sufficiency Standard indicates that this family needs nearly twice this amount, or approximately $30,000, to afford the necessities listed above and be considered self-sufficient. By way of comparison, the median family income for the City of Norfolk was $50,000 in 2005.
Although the methodology used to calculate the Self-Sufficiency Standard appears to be sound, one concern is that the value assigned to each cost category may, in some cases, overstate real-world costs while other assumptions may be too conservative. For example, the Self-Sufficiency Standard uses the 75th percentile of market child care costs in its calcu-lation, which some may argue is inaccurate because not all parents use formal child care providers. In contrast, the Self-Sufficiency Standard assumes that all families can secure em-ployer-sponsored health insurance coverage, yet research has shown that only half of low-income workers have access to this employer-paid benefit. While it may be difficult to assess whether the Self-Sufficiency Standard is an accurate estimate for every family in the State, it provides a useful benchmark against which to gauge the income adequacy of a group of low-income families.
Defining Government Assistance Families who earn adequate income to meet their basic needs generally do not have to rely on government assistance. How-ever, most self-sufficient families receive some level of benefit from the government. To properly characterize financial inde-pendence and self-sufficiency, it is important to draw a distinc-tion between government assistance, which is available only to low-income families, and other types of benefits that are more broadly available and not solely predicated upon income level.
Chapter 1: Defining and Measuring Self-Sufficiency 4
Government assistance refers to means-tested programs such as TANF, Food Stamp, Medicaid, and FAMIS.
For example, government benefits such as Social Security re-tirement income or Medicare are available to all U.S. families who meet certain requirements. In contrast, government as-sistance is available only to low-income families who cannot afford certain necessities such as food, shelter, or health in-surance.
In the context of this study, clients of the social services sys-tem who receive benefits from means-tested programs such as Temporary Assistance for Needy Families (TANF), Food Stamps, Supplemental Security Income (SSI), Medicaid, or Family Access to Medical Insurance Security (FAMIS) are not considered self-sufficient. Conversely, whether a family re-ceives benefits from other government programs not limited to low-income individuals is not relevant to the determination of self-sufficiency.
Although Medicaid and FAMIS are forms of government assis-tance, they differ from other means-tested programs because they provide access to medical care as needed rather than di-rect income subsidies. The value of this benefit is difficult to assign because it varies with individual usage: families who receive more medical care derive a greater value from these two programs than families with limited medical expenditures. Consequently, this study considers the government assistance provided through the Medicaid and FAMIS programs sepa-rately from other programs that offer direct income subsidies.
MEASURING CLIENT OUTCOMES Having defined self-sufficiency, the second step in examining this concept is to measure the economic changes experienced by clients of the social services system. Changes in clients’ economic situation are measured in two ways in this report. The first measures the number of clients who improved their financial independence over time. The second measures the change in the number of clients who earn enough to be con-sidered self-sufficient. Together, these measures offer insight into the extent to which clients of the social services system are reducing their reliance on government assistance and how frequently they are able to meet their families’ needs without the aid of government assistance.
Improved Financial Independence A fundamental component of achieving self-sufficiency is to no longer rely on government assistance. However, staff of the Virginia social services system indicate that it can take many years for clients to reach this point. Consequently, considering the extent to which families reduce (rather than eliminate) their
Chapter 1: Defining and Measuring Self-Sufficiency 5
reliance on government assistance may more fully capture the positive effect that the social services system has had on those clients who have improved their financial independence during a finite period of time, but have not yet attained com-plete self-sufficiency. In addition, it is important to measure changes in financial independence relative to each family’s ini-tial economic situation, because those can vary widely.
There is no generally accepted measure of changes in finan-cial independence. As a result, JLARC staff developed a met-ric that incorporates two primary indicators to determine whether a family has increased their financial independence and is less reliant on government assistance over time. Using this metric, families are characterized as being more financially independent if, over time, they derive:
• A greater share of their total resources from their own income; and
• A lesser share of their total resources from government assistance.
Attaining Self-Sufficiency Because the ultimate goal should be for families to become fully self-sufficient, it is also important to consider how many clients of the social services system are able to earn enough to meet their families’ basic needs. Families who are more fi-nancially independent may not be self-sufficient if their income remains too low to secure basic necessities. To measure whether their resources are adequate to meet their needs, the income of families can be compared to the FPL and the Self-Sufficiency Standard to determine how many families meet and exceed these thresholds.
Considering both the FPL and the Self-Sufficiency Standard may be insightful because each measure captures a different level of economic well-being. Generally, a family requires a higher level of income to meet the Standard than the FPL in most Virginia localities.
NOT ALL SOCIAL SERVICES CLIENTS CAN BE EXPECTED TO ACHIEVE SELF-SUFFICIENCY
Clients of the social services system are a heterogeneous group who rely on government assistance for a diverse set of reasons. Because of this diversity, the goal of self-sufficiency may not be applicable to every client of the social services system.
Chapter 1: Defining and Measuring Self-Sufficiency 6
-
For elderly or disabled in-dividuals, achieving self-sufficiency may not be a sensible or attainable goal.
The factors that cause families to apply for government assis-tance can be temporary, such as losing employment or being unable to work due to a short-term medical condition. Other factors may be more chronic, such as limited education or substance abuse issues, which create barriers to employment but may be addressed by programs or services. Temporary conditions that can affect families’ need for government assis-tance also include pregnancy or caring for young children.
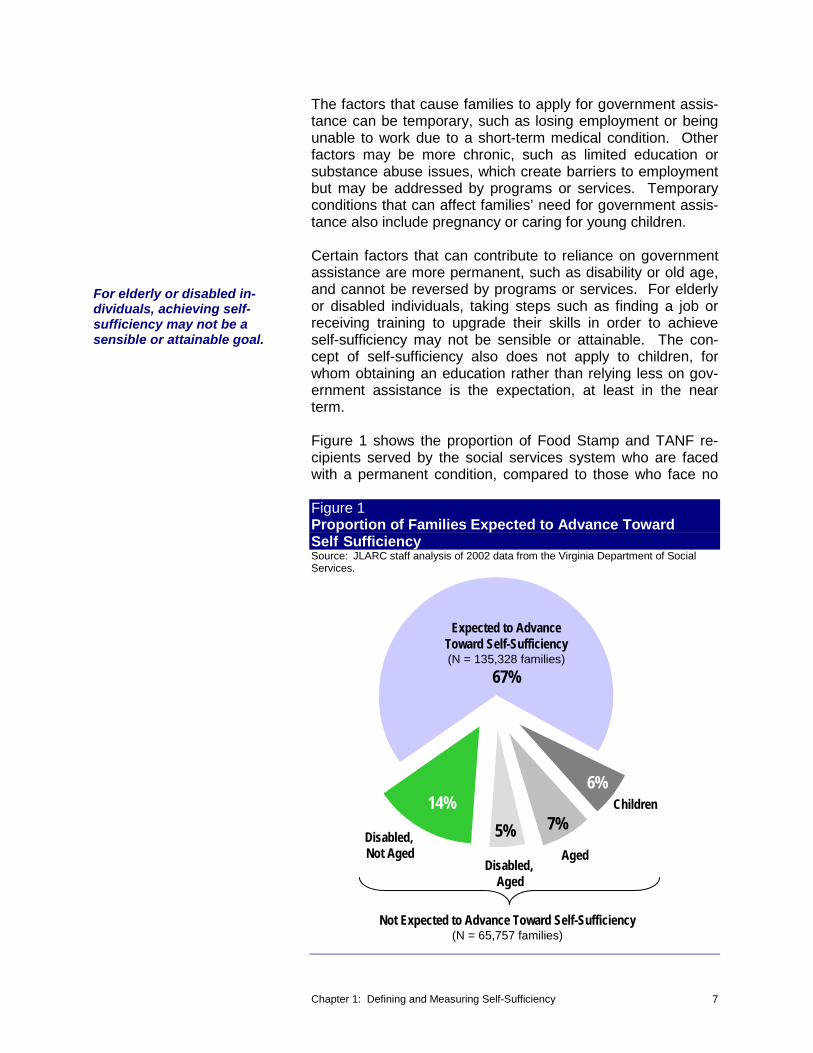
Certain factors that can contribute to reliance on government assistance are more permanent, such as disability or old age, and cannot be reversed by programs or services. For elderly or disabled individuals, taking steps such as finding a job or receiving training to upgrade their skills in order to achieve self-sufficiency may not be sensible or attainable. The con-cept of self-sufficiency also does not apply to children, for whom obtaining an education rather than relying less on gov-ernment assistance is the expectation, at least in the near term.
Figure 1 shows the proportion of Food Stamp and TANF re-cipients served by the social services system who are faced with a permanent condition, compared to those who face no
Figure 1 Proportion of Families Expected to Advance Toward Self SufficiencySource: JLARC staff analysis of 2002 data from the Virginia Department of Social Services.
Expected to Advance Toward Self-Sufficiency (N = 135,328 families)
67%
6%
7% 14% Children
Disabled, Not Aged Aged
Disabled, Aged
5%
Not Expected to Advance Toward Self-Sufficiency (N = 65,757 families)
Chapter 1: Defining and Measuring Self-Sufficiency 7

long-term impediment to achieving self-sufficiency. Based on an analysis of the characteristics of families who received Food Stamp or TANF benefits in 2002, the notion of self-sufficiency appears to apply to approximately two-thirds of these recipients.
The idea that certain populations, such as aged or disabled in-dividuals, are not expected to become self-sufficient is gener-ally accepted, as demonstrated through permanent exemp-tions from work requirements that have been incorporated in several assistance programs (described in more detail in the following chapter).
Chapter 1: Defining and Measuring Self-Sufficiency 8
Cha
pter 22 FFiinnaanncciiaall AAssssiissttaannccee ffoorr
LLooww--IInnccoommee FFaammiilliieessIn
Sum
mar
y... The Virginia Department of Social Services administers the largest as-
sistance programs available to low-income Virginians. While these pro-grams share the common purpose of helping families meet their basic needs, they differ in many other respects. Most notably, only the TANF program has the stated goal of enabling families in poverty to reach self-sufficiency, while other programs focus on providing low-income families with a safety net for acquiring basic necessities. Moreover, only partici-pants in the TANF, Food Stamp, and Child Care Subsidy programs are expected to work, and many of them receive exemptions from work re-quirements. Supportive services such as intensive case management, employment assistance, and child care are primarily limited to the group of benefit recipients subject to work requirements. Finally, time limits on the receipt of government assistance apply only to some TANF and Food Stamp recipients.
The Virginia social services system is a state-supervised, lo-cally administered system in which the Virginia Department of Social Services (DSS) provides supervision and management to 120 local departments of social services responsible for administering most of the State’s social programs. The sys-tem includes more than 50 programs and services that support vulnerable children and adults in Virginia. This study focuses solely on the social services programs administered by local departments that provide families with benefits, because fami-lies who receive such assistance are generally not considered to be self-sufficient.
Benefit programs administered by local departments share the common purpose of enabling low-income Virginians to meet their basic needs, but they differ in many other respects. First, there is wide variation in the eligibility criteria that families must meet in order to participate. In addition, the programs are guided by different goals and, consequently, impose a wide range of requirements upon their participants and provide varying levels of support services. Finally, funding for each program relies on federal, State, and local resources to differ-ent degrees.
Chapter 2: Financial Assistance for Low-Income Families 9
Program Benefits, Eligibility, and Participation The social services system administers and oversees four ma-jor benefit programs available to low-income, able-bodied families:
• Food Stamps; • Temporary Assistance for Needy Families (TANF); • Child Care Subsidy; and • Energy Assistance.
In addition, the social services system is responsible for de-termining applicants’ eligibility for the Medicaid and Family Ac-cess to Medical Insurance Security (FAMIS) programs, al-though these programs are implemented and overseen by the Department of Medical Assistance Services (DMAS).
While the Food Stamp program offers a benefit that is re-deemable for the purchase of pre-approved foods, TANF pro-vides cash assistance that can be used to supplement fami-lies’ income. Low-income families can also obtain subsidies to defray the cost of child care, as well as subsidies to help pay their heating and cooling bills through the Energy Assistance program. Medicaid and FAMIS provide access to medical care for uninsured families who cannot afford health insurance coverage on their own.
DSS administers other benefit programs that are outside the scope of this study. For example, programs such as Auxiliary Grant or Crisis Assistance provide financial assistance to low-income individuals, but they tend to be smaller programs that benefit specific populations that are not expected to advance toward self-sufficiency, such as the elderly.
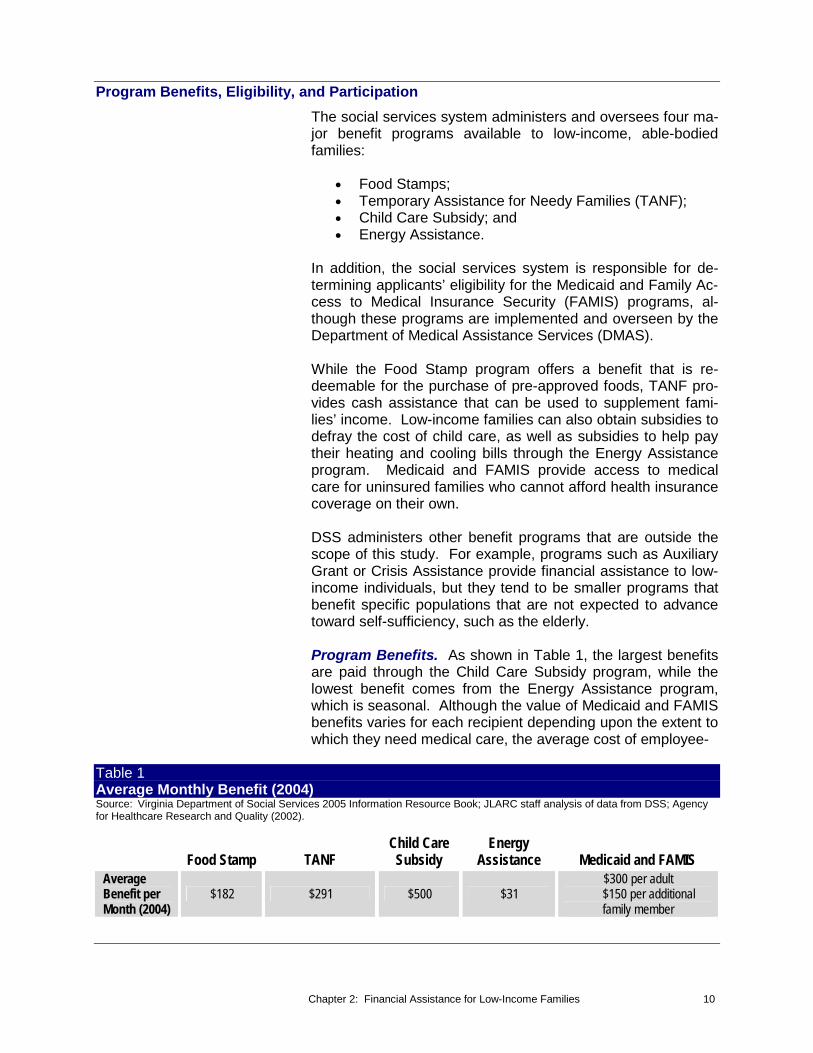
Program Benefits. As shown in Table 1, the largest benefits are paid through the Child Care Subsidy program, while the lowest benefit comes from the Energy Assistance program, which is seasonal. Although the value of Medicaid and FAMIS benefits varies for each recipient depending upon the extent to which they need medical care, the average cost of employee-
Table 1 Average Monthly Benefit (2004)Source: Virginia Department of Social Services 2005 Information Resource Book; JLARC staff analysis of data from DSS; Agency for Healthcare Research and Quality (2002).
Child Care Energy Food Stamp TANF Subsidy Assistance Medicaid and FAMIS
Average Benefit per Month (2004)
$182 $291 $500 $31 $300 per adult $150 per additional family member
Chapter 2: Financial Assistance for Low-Income Families 10

As the income of DSS clients reaches certain thresholds, they lose eligi-bility for some benefits.
sponsored health insurance in Virginia can be used as a refer-ence. The cost to covered employees averages $300 per month for a single adult, and $150 per month for each addi-tional family member.
Program Eligibility Criteria. While the specific rules for de-termining program eligibility are very complex, families are generally evaluated for participation based on two criteria (Ta-ble 2):
• Amount of financial resources; and • Family status.
The maximum amount of income that a family can earn in or-der to remain eligible for benefit programs ranges from 25 to 200 percent of the federal poverty line. As the income of DSS clients reaches certain thresholds, they lose eligibility for some benefits. Figure 2 illustrates how this trend would affect a single parent with two children who receives each of the bene-fits previously mentioned. As this family’s income increases, it first loses eligibility for adult Medicaid coverage, followed by TANF cash assistance. The last benefits for which this family would lose eligibility are child care subsidies and child health care.
TANF recipients who are required to work remain eligible for cash assistance at higher income levels than other TANF re-cipients. This difference is designed to provide families with positive incentives to work and increase their earnings while continuing to receive assistance through the TANF program. As a result, while TANF recipients who are not required to
Table 2 Benefit Program Monthly Eligibility Criteria for a Family of Three (2005)Source: JLARC staff analysis of Virginia Department of Social Services program policy manuals. Note: Assumes a locality in Group II, which is composed of localities with mid-range cost of living.
Food Child Care Energy Stamp TANF Subsidy Assistance Medicaid and FAMIS
Financial Resources
Family Status
Income < $1,700
Work-exempt: Income < $320
Work-mandatory: Income < $1,000
Income $2,000 to $2,500 (regional)
Income < $1,700
Income less than: • Children: $2,700 • Pregnant women: $2,500 • Able-bodied adults, work-
exempt: $320 • Able-bodied adults, work-
mandatory: $360 None Child with one
absent parent Child under 13
None None
Chapter 2: Financial Assistance for Low-Income Families 11

Figure 2 Decline in Government Assistance as Monthly Income Increases (Based on a Family Consisting of a Single Parent With Two ChildrenSource: JLARC staff analysis of Virginia Department of Social Services program policy manuals. Notes: (1) Assumes a locality in Group II, which is composed of localities with mid-range cost of living.
(2) Value placed on Medicaid and FAMIS benefits was derived from the average employee contribution for family health insurance coverage provided by Virginia employers.
Amount of Benefits that Could Be Received by Family of Three
$1,850
Medicaid / FAMIS – Children
$300
Medicaid (Adult) $300
Energy Assistance
$30 Child Care Subsidy
$500
TANF (Required to Work)
$320
Food Stamps
$400
0 $650 $1,000 $1,300 (100% FPL)
$1,700 (130% FPL)
$2,700 (200% FPL)
$2,000 (160% FPL)
Gross Monthly Income
$ $$
Decline in Government Assistance as FamilEarns More Income
Decline in Government Assistance as FamilyEarns More Income
work can only earn up to $322 a month before they lose eligi-bility, working families remain eligible for TANF benefits until their monthly income exceeds $1,000.
Until they exceed specific income thresholds, families continue to receive the same amount of TANF and Energy Assistance benefits, and remain covered by Medicaid and FAMIS even if their income changes. In contrast, the amount of benefits re-ceived through the Food Stamp and Child Care Subsidy pro-grams varies with income. Food Stamp benefits diminish at a rate of approximately one dollar for every three dollars of addi-tional income, while child care subsidies decrease by ten cents for every additional dollar earned.
To be eligible for TANF and child care subsidies, families must also care for a dependent child. Regardless of their income level, families who no longer care for a child under 18 will cease to receive TANF benefits, and will lose their ability to obtain child care subsidies when their youngest child turns 13.
Chapter 2: Financial Assistance for Low-Income Families 12

Nearly all families who re-ceive TANF benefits par-ticipate in multiple pro-grams.
Program Participation. While most families do not receive assistance through every benefit program, many families par-ticipate in multiple programs. It is estimated that 42 percent of families receive benefits from more than one program (Figure 3). Nearly all families who receive TANF benefits participate in multiple programs, while a significant number of families who receive child or adult health care do not collect any other benefits.
The social services system handled more than 830,000 cases in 2004 across the individual programs described in this chap-ter (Table 3). However, because more than 40 percent of families participate in more than one program, this figure over-states the number of families who are served by the system. Based on an analysis of recipients of these programs in 2002, it is estimated that the social services system serves nearly 517,000 families through these programs in 2005.
Figure 3 Proportion of Families Who Receive Benefits From Multiple Programs (2002)Source: JLARC staff analysis of 2002 data from the Virginia Department of Social Services and the Department of MedicalAssistance Services. Note: N = 421,436 families.
0% 20% 40% 60% 80% 100%
Number of Benefits Received
Overall
Child Health Care
1 Adult Health Care
2 Energy Assistance
3
Food Stamp 4
5TANF
Program Goals and Performance Measures
Individual benefit pro-grams administered by DSS have different stated purposes that are not al-ways directly related to self-sufficiency.
While the social services system appears to have an overarch-ing goal of promoting self-sufficiency for all its clients, individ-ual benefit programs administered by DSS have different stated purposes that are not always directly related to self-sufficiency (Table 4). The latest strategic plan for the Virginia Department of Social Services describes the mission of the social services system as “helping people triumph over pov-erty,” and sets out the goal to “promote self-sufficiency” for its clients. In addition, the mandate for this study (Appendix A) requests JLARC staff to “assess the effectiveness of the social services system as measured by changes in customer self-sufficiency.”
Chapter 2: Financial Assistance for Low-Income Families 13

Table 3 Number of Cases and Benefit Recipients by Program (July 2004)Source: Virginia Department of Social Services 2005 Information Resource Book; Department of Medical Assistance Services 2004 Statistical Record. Notes: 1 2004 monthly average.
2 Includes only children served. Food Child Care Energy Medicaid and
Stamp TANF Subsidy Assistance FAMIS1
Number of Cases 192,439 35,966 33,214 128,376 475,926 Number of Individuals 436,637 79,516 58,2352 n/a 623,241
Table 4 Program Goals and Performance Measures of Benefit Programs Source: Virginia JLARC staff analysis of Virginia Department of Social Services program policy manuals; Virginia Food Stamp Em-ployment and Training Program Plan of Operations (FFY 2005); Virginia Independence Program Monthly Report (August 2005).
Food Child Care Energy Medicaid and Stamp TANF Subsidy Assistance FAMIS
Goals Alleviate hunger and malnutrition
Offer Virginians living in poverty the opportunity to: • Achieve economic
independence • Acquire work
experience and skills necessary to be self-sufficient
• Contribute materially to their own self-sufficiency
Provide financial resources to find and afford quality child care
Provide assistance to households that use a high proportion of their income to cool and heat their homes
Provide medical care
Performance Measures (All Recipients)
Timeliness of processing applications
Payment accuracy
Participation rate
Timeliness of processing applications
Payment accuracy
None None Timeliness and accuracy of application processing
Performance Measures (Work-Mandatory Only)
Percent working Work participation
Percent 3-month job retention
Average wage
None None None
This broad language suggests a focus on measuring and im-proving the self-sufficiency of all DSS clients, regardless of the benefit program in which they are enrolled. However, the only major benefit program that the social services system adminis-ters with the stated goal of achieving self-sufficiency is Vir-
Chapter 2: Financial Assistance for Low-Income Families 14

With the exception of the TANF program, the pri-mary goal of major benefit programs has remained focused on providing low-income families with a safety net for acquiring basic necessities.
For most programs, the timeliness of processing applications and accuracy of payments are the pri-mary metrics that gauge how effectively and effi-ciently the safety net is deployed.
ginia’s TANF program. As a result, few other program meas-ures are aligned with indicators of self-sufficiency.
Program Goals. With the exception of the TANF program, the primary goal of major benefit programs has remained fo-cused on providing low-income families with a safety net for acquiring basic necessities such as food, medical care, safe shelter, and child care. In contrast, the current structure of the TANF program represents a substantial departure from its predecessor, the Aid to Families with Dependent Children (AFDC) program. Since its implementation in Virginia in 1997, TANF no longer operates purely as a safety net for the poorest families, but also seeks to provide recipients with the tools and experiences they need to achieve self-sufficiency. Federal welfare reform also affected the Food Stamp program. Able-bodied, childless adults became subject to a three-month time limit (six months in Virginia) on the receipt of benefits, which can only be waived if the individual works for 20 or more hours per week or resides in a locality with high unemployment.
Unlike federal welfare reform, which aimed to reduce the num-ber of cash assistance recipients, many of the other program changes that have been implemented in recent years at both the State and federal levels have focused on increasing par-ticipation and expanding the reach of the safety net. FAMIS was established in 2001 as a supplement to the Medicaid pro-gram to reach children in families that earn too much money to be eligible for Medicaid, but cannot afford private health insur-ance. The implementation of the program, along with strong outreach efforts, led to a dramatic decrease in the number of uninsured low-income children in the State. It is estimated that 80,000 more children are protected by health insurance than before FAMIS was implemented, although another 50,000 un-insured children may still be eligible for FAMIS or Medicaid and are not yet enrolled. In addition, the Food Stamp Reau-thorization Act of 2002 increased states’ flexibility in conduct-ing eligibility determinations, which allowed Virginia to stream-line its eligibility requirements and reach more families in need.
Performance Measures. For most programs, the timeliness of processing applications and accuracy of payments are the primary metrics that gauge how effectively and efficiently the safety net is deployed. In addition, Food Stamp participation rates are tracked to capture how effectively the program is reaching eligible families.
Additional measures exist for programs that contain a work component. These are the only measures that capture client outcomes and consequently provide an indication of changes in self-sufficiency. The TANF program tracks the proportion of recipients who obtain a job and the percentage of workers who retain their job for at least three months. The proportion of
Chapter 2: Financial Assistance for Low-Income Families 15
Program Requirements
Families who participate in certain benefit programs are expected to work unless they meet certain exemptions.
able-bodied, childless Food Stamp recipients who are working is also measured. In addition, federal agencies track these measures to award high-performance bonuses to those states that perform particularly well. Virginia has received bonuses for its administration of the TANF program in the last four years.
To facilitate the achievement of program goals and promote family well-being, some benefit recipients are subject to certain requirements. While most recipients must meet general re-quirements related to family well-being, only TANF, Food Stamp, and Child Care Subsidy recipients are obligated to work in order to receive benefits. However, a large proportion of TANF and Food Stamp recipients are exempt from working (Table 5). Only clients who are required to work receive ac-cess to individual and family support services that help them transition from government assistance to work, in part because they can receive assistance only for a limited period of time.
General Requirements. General requirements are imposed upon TANF as well as Medicaid and FAMIS participants to promote overall family well-being. To help increase their in-come, TANF recipients and adults applying for Medicaid cov-erage must cooperate with the Division of Child Support En-forcement in establishing paternity for their children and seeking child support payments. Because education is an im-portant component of achieving self-sufficiency, TANF recipi-ents must also ensure that their children attend school. Fi-nally, TANF recipients as well as Medicaid and FAMIS participants must keep their children’s immunizations up to date.
Exemptions from Work Requirements. Families who par-ticipate in certain benefit programs are expected to work unless they meet an exemption. Compared to other programs, the most stringent work requirements are placed upon Child Care Subsidy recipients. Without exception, families who re-ceive subsidies must be working or attending school on a full-time basis. In contrast, Medicaid, FAMIS, and Energy Assis-tance clients do not have to satisfy any work requirements in order to receive benefits.
While both TANF and Food Stamp recipients can become ex-empt from work requirements for several reasons, exemptions are more stringent for TANF recipients. Specifically, Food Stamp recipients are not required to work if a child under 18 years of age is present in their household. In contrast, TANF recipients are exempt from work requirements if they have a child who is under 18 months of age. In addition, Food Stamp recipients are not required to work past age 50, while this age
Chapter 2: Financial Assistance for Low-Income Families 16

Table 5 Benefit Program Requirements and LimitationsSource: JLARC staff analysis of Virginia Department of Social Services program policy manuals; Virginia Food Stamp Employment and Training Program Plan of Operations (FFY2005); Virginia Independence Program Monthly Report (August 2005).
Child Care Energy Medicaid and Food Stamp TANF Subsidies Assistance FAMIS
None Cooperate inestablishing paternityonly if applying for adult
Chapter 2: Financial A
ssistance for Low-Incom
e Families
GeneralRequirements
Cooperate in establishing paternity
Immunize children
Ensure children attend school
None None
Medicaid
Immunize childrenExemptionsfrom WorkParticipation
Child under 18 years oldMonths 4-9 of pregnancyUnder 18 Over 50Caring for incapacitated personIn school / training half-timeUnfit to work In drug / alcohol rehabLocal unemployment > 10%
Child under 18 months oldMonths 4-9 of pregnancyUnder 16Over 60Caring for incapacitated personIn school if under 20Disabled
None No work requirements No work requirements
WorkRequirements
ExemptRecipientsNone
Additional SupportServices
None
Time Limit None
Non-Exempt RecipientsEngage in work-relatedactivity for at least 30hours per week Employment services
Training and education
Child care
Transportation 6 months if not working
None if working
ExemptRecipientsNone
Non-Exempt RecipientsEngage in work-relatedactivity for at least 30hours per week
No minimum None Care provided only during hours worked
None
None Employment services
Training and education
Child care
Transportation
None None
None 2 continuous years
5 years in a lifetime
None None
None
None
Cases Subjectto WorkRequirements
9,100 through Food Stamps (5%) (2005)
14,386* through TANF (8%)
14,386 (40%) 33,214 (100%) No work requirements No work requirements
* Note: Food Stamp recipients who also receive TANF benefits are subject to TANF work requirements, unless exempt. 17
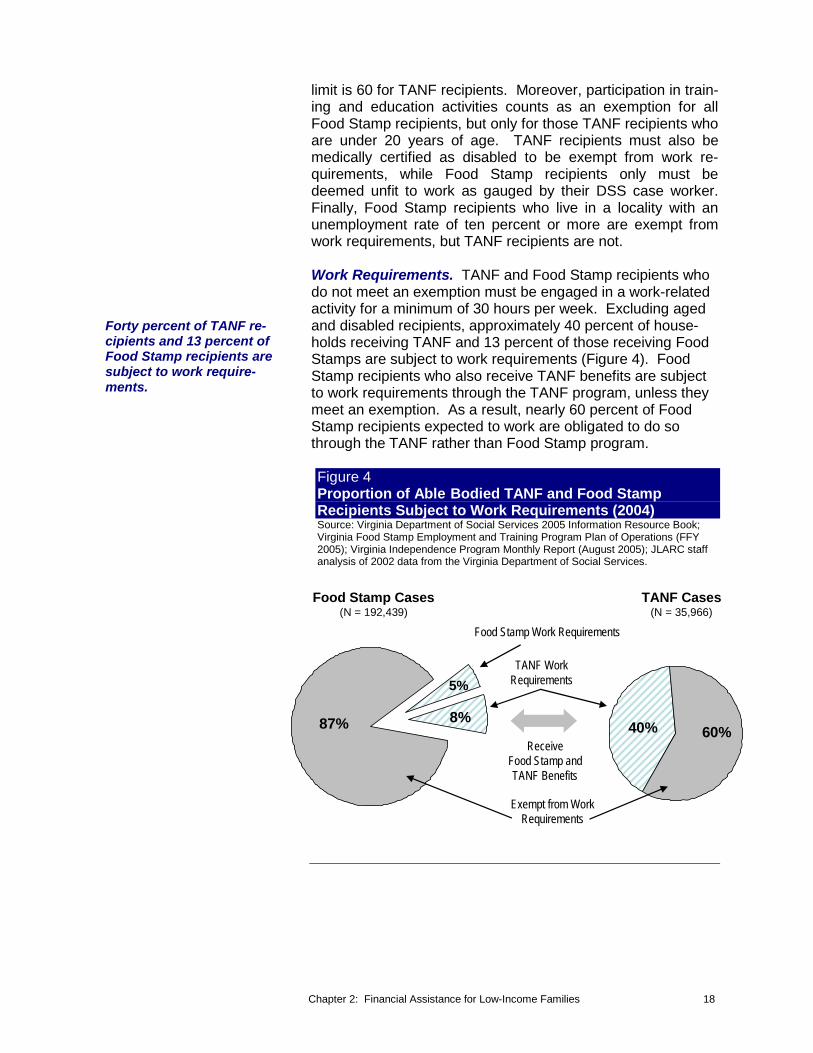
-
8%
5%
limit is 60 for TANF recipients. Moreover, participation in train-ing and education activities counts as an exemption for all Food Stamp recipients, but only for those TANF recipients who are under 20 years of age. TANF recipients must also be medically certified as disabled to be exempt from work re-quirements, while Food Stamp recipients only must be deemed unfit to work as gauged by their DSS case worker. Finally, Food Stamp recipients who live in a locality with an unemployment rate of ten percent or more are exempt from work requirements, but TANF recipients are not.
Work Requirements. TANF and Food Stamp recipients who do not meet an exemption must be engaged in a work-related activity for a minimum of 30 hours per week. Excluding aged and disabled recipients, approximately 40 percent of house-holds receiving TANF and 13 percent of those receiving Food Stamps are subject to work requirements (Figure 4). Food Stamp recipients who also receive TANF benefits are subject to work requirements through the TANF program, unless they meet an exemption. As a result, nearly 60 percent of Food Stamp recipients expected to work are obligated to do so through the TANF rather than Food Stamp program.
Figure 4 Proportion of Able Bodied TANF and Food Stamp Recipients Subject to Work Requirements (2004)
Forty percent of TANF re-cipients and 13 percent of Food Stamp recipients are subject to work require-ments.
Source: Virginia Department of Social Services 2005 Information Resource Book;Virginia Food Stamp Employment and Training Program Plan of Operations (FFY2005); Virginia Independence Program Monthly Report (August 2005); JLARC staffanalysis of 2002 data from the Virginia Department of Social Services.
Food Stamp Cases TANF Cases (N = 192,439) (N = 35,966)
Food Stamp Work Requirements
87% 8%
5% TANF Work
Requirements
ReceiveFood Stamp and TANF Benefits
Exempt from Work Requirements
40% 60%
Chapter 2: Financial Assistance for Low-Income Families 18

Program recipients who are subject to work re-quirements must also par-ticipate in an employment program that provides support services to facili-tate transitions into the workforce.
Support Services. Program recipients who are subject to work requirements must also participate in an employment program that provides support services to facilitate transitions into the workforce. TANF recipients must participate in the Virginia Initiative for Employment not Welfare (VIEW) program, which offers employment services, intensive case manage-ment, child care, transportation assistance, and funding for education and training.
VIEW participants can also receive transitional support ser-vices for up to one year after they leave the program and stop receiving TANF benefits. These transitional benefits include child care subsidies, transportation assistance, Medicaid cov-erage, and funding for training and education. Transitional as-sistance can alleviate some of the financial pressures that former TANF recipients may experience as they move from cash assistance into typically low-wage jobs.
Able-bodied, childless Food Stamp recipients and those who have a child older than six years must participate in the Food Stamp Employment and Training (FSET) program. FSET con-tains many of the same components and services as VIEW, but at a much lower intensity. The average expenditure for each FSET participant is approximately five percent of the amount spent on each VIEW participant. In addition, FSET programs are available in only 24 of the 120 local departments of social services.
TANF recipients who are exempt from VIEW, Food Stamp re-cipients who do not participate in FSET, and individuals who participate in the Medicaid, FAMIS, Energy Assistance, and Child Care Subsidy programs do not have access to support services. These recipients do not receive intensive case man-agement, employment services, child care (except for Child Care Subsidy recipients), transportation assistance, or funding for training and education.
Time Limits. Only TANF and Food Stamp recipients who are required to work and some Child Care Subsidy recipients face time limits on the receipt of benefits. TANF recipients subject to work requirements cannot receive cash assistance for more than two consecutive years or five years in their lifetime. Able-bodied, childless Food Stamp recipients who are not working for 20 or more hours per week face a much shorter time limit of six months in a three-year period. Some localities also im-pose a five-year lifetime limit on the receipt of child care subsi-dies. No other program recipients face time limits.
Program Funding Funding streams for each benefit program come from federal, State, and local sources. However, the level of State and local
Chapter 2: Financial Assistance for Low-Income Families 19

Virginia's contribution to-ward program funding is much larger for the provi-sion of services than for the payment of benefits to clients.
contribution varies greatly from one program to the next, as well as across program activities such as benefit payments, services, and administration. As a result, policy changes af-fecting the operation of a benefit program would have a signifi-cantly different budgetary impact on Virginia depending upon which program or activity is targeted.
Virginia assumes the lowest share of expenditures for the Food Stamp and Energy Assistance programs, whose budgets encompass primarily benefit payments that are 100 percent federally funded (Table 6). Child care subsidies are 75 per-cent federally funded, while the State and localities pay the remaining 25 percent.
Virginia’s contribution toward program funding is much larger for the provision of services than for the payment of benefits to clients. State and local governments are responsible for more than 40 percent of the VIEW program costs and for 47 percent of the Medicaid and FAMIS programs costs. Finally, adminis-trative expenditures are shared almost equally between Vir-ginia and the federal government, with the exception of the Child Care Subsidy program for which 75 percent of adminis-trative expenditures are funded by the federal government.
Table 6 Costs and Funding Streams of Benefit Programs Source: JLARC staff analysis of Virginia Department of Social Services LASER data; Child Care and Development Fund Plan for FFY 2004-2005; Department of Medical Assistance Services 2004 Statistical Record.
Medicaid and Energy Child Care Benefits Food Stamp TANF FAMIS Assistance Subsidy 2004 Costs to DSS (Millions) $421 $116 Not Applicable $24 Not Applicable Funding
% Federal % State % Local
100 0 0
64 36
0
Not Applicable 100
0 0
Not Applicable
Services 2004 Program Costs to DSS (Millions) $2 $96 $4,104 Not Applicable $122 Funding
% Federal % State % Local
99 1 0
57 38 5
53 47 0
75 25
(State & Local)
Not Applicable
Administrative (DSS only) 2004 Program Costs to DSS (Millions) $176 $18 Funding Streams
% Federal % State % Local
49 24 26
75 25
(State & Local)
Chapter 2: Financial Assistance for Low-Income Families 20
Other Sources of Assistance Available from Community Action Agencies Because State agencies provide limited access to emergency cash assistance, community action agencies (CAAs) can play an important role in helping families to meet their basic needs and alleviate financial difficulties that arise as they improve their financial independence. Community action agencies are nonprofit private or public organizations established under the Economic Opportunity Act of 1964 to fight America’s War on Poverty. In Virginia, 26 local and three statewide CAAs offer assistance to more than 110,000 low-income Virginians every year across most, although not all, localities.
Local Community Action Agencies. Local CAAs assess the needs of their community in order to complement and supple-ment programs and services available at local departments of social services and in the community. Local departments may refer clients to local CAAs if they need services or financial as-sistance that are not available from DSS, such as rent assis-tance or clothing. In order to meet a wide range of client needs, CAAs offer a variety of anti-poverty programs and work collaboratively with businesses and other agencies to build a support network for low-income Virginians. Some of the pro-grams offered include education, child care (including Head Start), employment, housing services, health and nutrition, and community and economic development. Funding for these programs and services may be received through the federal community service block grant (CSBG), other federal, State, and local government contributions, as well as private dona-tions.
Statewide Community Action Agencies. In addition to the 26 local CAAs in Virginia, there are also three statewide CAAs headquartered in Roanoke. These organizations address spe-cific problems across the State through various programs and services. These statewide CAAs are currently focusing on high school drop-out prevention and college preparation, help-ing ex-offenders find employment, and assisting small rural towns and communities in upgrading their water and wastewa-ter systems.
Chapter 2: Financial Assistance for Low-Income Families 21

Chapter 2: Financial Assistance for Low-Income Families 22
Cha
pter 33 CChhaannggeess iinn CClliieenntt
SSeellff--SSuuffffiicciieennccyyIn
Sum
mar
y... Although the majority of families who receive financial assistance
through the social services system improve their financial independence over time, few of them achieve complete self-sufficiency. Over the course of more than two years, 60 percent of the families examined for this study improved their financial independence and decreased their reliance on government assistance. Most frequently, this trend was linked to increased wages and child support collections. While most families who improved their financial independence also advanced closer to self-sufficiency, a quarter of them had less total economic re-sources at the end of the period studied. In addition, families who im-proved their financial independence earned, on average, too little to move beyond poverty and to provide for their basic needs. As a result, most families continued to receive government benefits to supplement their income.
The changes in self-sufficiency experienced by clients of the social services system have not traditionally been tracked. In particular, the economic outcomes of low-income families who do not participate in the Virginia Initiative for Employment not Welfare (VIEW) program are largely unknown. As a result, it has not been possible to evaluate the extent to which the pro-grams administered by the social services system are enabling families to advance toward and achieve self-sufficiency. This chapter examines the prevalence and magnitude of changes in financial independence and self-sufficiency among families who receive benefits through Virginia’s social services system. In addition, notable differences in the experiences of families who participate in individual benefit programs are also high-lighted.
MAJORITY OF FAMILIES STUDIED IMPROVED THEIR FINANCIAL INDEPENDENCE Nearly 60 percent of the 14,500 families studied in this review increased their financial independence and decreased their re-liance on government assistance between 2002 and 2004 (Figure 5). The benefit recipients most likely to increase their financial independence were those participating in the VIEW program, closely followed by Food Stamp recipients who did not receive cash assistance through Temporary Assistance for Needy Families (TANF) during the period studied. Families
Chapter 3: Changes in Client Self-Sufficiency 23
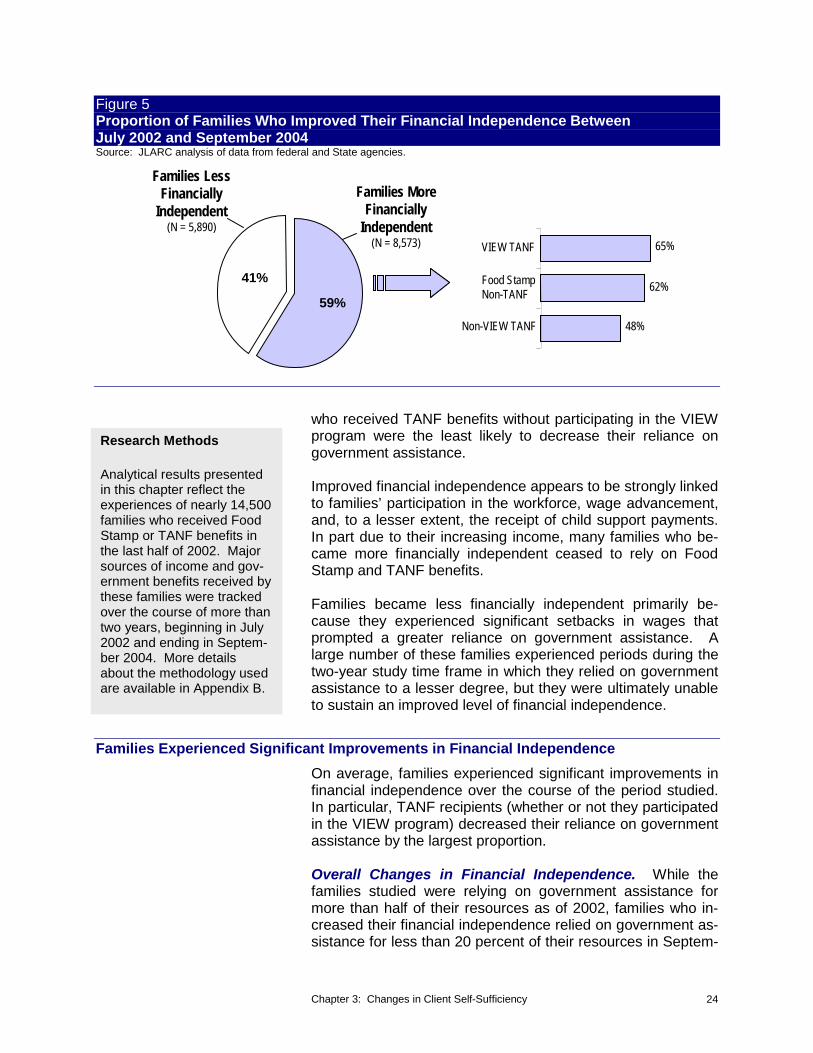
Figure 5 Proportion of Families Who Improved Their Financial Independence Between July 2002 and September 2004 Source: JLARC analysis of data from federal and State agencies.
Families LessFinancially Families More
Independent
41%
59%
Financially (N = 5,890) Independent
(N = 8,573) VIEW TANF 65%
Food Stamp 62%Non-TANF
Non-VIEW TANF 48%
Research Methods
Analytical results presented in this chapter reflect the experiences of nearly 14,500 families who received Food Stamp or TANF benefits in the last half of 2002. Major sources of income and gov-ernment benefits received by these families were tracked over the course of more than two years, beginning in July 2002 and ending in Septem-ber 2004. More details about the methodology used are available in Appendix B.
who received TANF benefits without participating in the VIEW program were the least likely to decrease their reliance on government assistance.
Improved financial independence appears to be strongly linked to families’ participation in the workforce, wage advancement, and, to a lesser extent, the receipt of child support payments. In part due to their increasing income, many families who be-came more financially independent ceased to rely on Food Stamp and TANF benefits.
Families became less financially independent primarily be-cause they experienced significant setbacks in wages that prompted a greater reliance on government assistance. A large number of these families experienced periods during the two-year study time frame in which they relied on government assistance to a lesser degree, but they were ultimately unable to sustain an improved level of financial independence.
Families Experienced Significant Improvements in Financial Independence On average, families experienced significant improvements in financial independence over the course of the period studied. In particular, TANF recipients (whether or not they participated in the VIEW program) decreased their reliance on government assistance by the largest proportion.
Overall Changes in Financial Independence. While the families studied were relying on government assistance for more than half of their resources as of 2002, families who in-creased their financial independence relied on government as-sistance for less than 20 percent of their resources in Septem-
Chapter 3: Changes in Client Self-Sufficiency 24

ber 2004 (Figure 6). In contrast, families who became less fi-nancially independent relied on government assistance for nearly three-quarters of their resources at the end of the study period.
Figure 6 Changes in Financial Independence During Period Studied Source: JLARC analysis of data from federal and State agencies.
Source of Family Resources
47% 53%
81% 19%
49% 51%
26% 74%
Jul-Dec 2002 More Financially Independent (N = 8,573)
Income Government Assistance
Sept 2004
Jul-Dec 2002
Sept 2004
Less Financially Independent (N = 5,890)
Trends in Financial Independence Across Programs. TANF recipients experienced the most significant changes in financial independence over the course of the two-year period studied. As of September 2004, VIEW and non-VIEW TANF families who increased their financial independence relied on government assistance for approximately one-third of their re-sources, down from two-thirds in 2002 (Figure 7). While non-TANF Food Stamp recipients did not experience as dramatic a decline over the course of the study period, these families were far less reliant on government assistance than TANF re-cipients at the end of the study period. Among clients who be-came less financially independent over time, TANF recipients relied on government assistance to a greater degree than Food Stamp recipients at the end of the two-year period stud-ied.
Greater Financial Independence Is Primarily Driven by Higher Wages Most families became more financially independent by in-creasing their income rather than solely because the amount of government assistance they received decreased. Wages were the largest source of increased income for 72 percent of more financially independent families. VIEW participants and Food Stamp recipients not enrolled in TANF experienced the largest gains in wages over the course of the period studied, compared to non-VIEW TANF recipients.
Chapter 3: Changes in Client Self-Sufficiency 25

+ 39%+ 42%
-42%
+ 7%
Figure 7 Changes in Financial Independence During Period Studied, by Benefit Program Source: JLARC staff analysis of data from federal and State agencies.
Families More Families Less Financially Independent Financially Independent
(N = 8,573) (N = 5,890)
Resources Derived Resources Derived from Resources Derived Resources Derived from from Income Government Assistance from Income Government Assistance
VIEW TANF
88% 12%
24% 76%
30% 70%
35% 65% Jul-Dec 2002 (N=1,938)
64% 36% 16% 84% Sept 2004
Non-VIEW 27% 73% 50% 50% Jul-Dec 2002 TANF 67% 33% 21% 79% Sept 2004(N=2,884)
Food Stamp 57% 43% 52% 48% Jul-Dec 2002 Non-TANF
Sept 2004(N=9,641)
Ninety percent of families whose wages increased became more financially independent, while only 30 percent of families whose wages did not increase were able to improve their financial independence.
Overall Trends in Wages. Ninety percent of families whose wages increased became more financially independent, while only 30 percent of families whose wages did not increase were able to improve their financial independence. Wage increases were linked with the ability to obtain employment and to ad-vance in the workplace. As illustrated in Figure 8, the propor-tion of more financially independent families who are em-ployed increased dramatically between 2002 and 2004.
Figure 8 Changes in Employment and Wages During Period Studied Source: JLARC staff analysis of data from the Virginia Employment Commission.
Percent Employed Average Annual WagesPercent Employed Average Annual Wages (for Employed Clients)(for Employed Clients)
$17,36$17, 8368Families More 82%Families More 82%
$12,19$12, 1191+ 42%
Financially 59%Financially 59%IndependentIndependent
(N = 8,573)(N = 8,573)
+ 39%
FamiliFam esilies LessLess $12,167
-42% $12,167 $12,999+ 7% $12,999
Financially 59%Financially 59%
IndependentIndependent 34%34%(N( = 5,890)N = 5,890)
Jul-Dec 2002 Sept 2004 Jul-Dec 2002 Sept 2004Jul-Dec 2002 Sept 2004 Jul-Dec 2002 Sept 2004
Chapter 3: Changes in Client Self-Sufficiency 26

In addition, wages increased by more than 40 percent, on av-erage, for more financially independent families whose head of household was already employed. Families who were already employed experienced an increase in wages because they:
• Obtained new jobs that paid higher wages or offered more hours of work (76 percent);
• Remained in the same job but received a raise or worked more hours (12 percent); or
• Took on one or more additional jobs to supplement their income (12 percent).
In contrast, families who became less financially independent experienced a significant decline in wages primarily due to job loss. As shown in Figure 8, these families were less likely to be employed in 2004 than at the beginning of the study period in 2002. In addition, less financially independent families who were employed during the two-year study period experienced only a small increase in wages.
Trends in Wages Across Benefit Programs. Increased workforce participation and higher wages were linked to im-proved financial independence for all clients of the social ser-vices system, regardless of the benefit program in which they participated. As illustrated in Figure 9, families who became more financially independent experienced a significant in-crease in both their employment rate and average wages across benefit programs.
Figure 9 Changes in Employment and Wages for More Financially Independent Families Source: JLARC analysis of data from federal and State agencies.
Food Stamp Non-TANF VIEW TANF Non-VIEW TANF (N = 5,940) (N = 1,263) (N = 1,370)
73% 83% 80% 76%
Proportion Employed
53% 42%
Average $18,713 $12,977
$10,204 $14,153 Wages
(Employed Clients)
$9,480 $14,086
Jul-Dec 2002 Sept 2004 Jul-Dec 2002 Sept 2004 Jul-Dec 2002 Sept 2004
Chapter 3: Changes in Client Self-Sufficiency 27

Despite the large increase in wages that TANF recipi-ents experienced, they continued to earn signifi-cantly less than Food Stamp recipients.
The increase in employment rate was most dramatic for VIEW and non-VIEW TANF recipients. Although TANF recipients were much less likely than other recipients to be employed at the start of the study period, this gap practically disappeared for families who became more financially independent during the period studied. However, TANF recipients continued to earn significantly less than non-TANF Food Stamp recipients despite the large increase in wages they experienced.
Among all the families studied, VIEW participants and non-TANF Food Stamp recipients were significantly more likely to enter the workforce and increase their wages than TANF re-cipients not participating in VIEW (Figure 10). This distinction partially explains the differences in the proportion of recipients who became more financially independent in each program. The proportion of non-VIEW TANF recipients who were em-ployed increased only slightly over the course of the study pe-riod and their wages increased by a lesser amount than for other program participants. These trends may be associated with the work requirements that are imposed upon VIEW par-ticipants but that are lacking for non-VIEW TANF recipients.
Figure 10 Changes in Proportion Employed and Average Wages Between 2002 and 2004, by Program Source: JLARC staff analysis of data from the Virginia Employment Commission.
Increase in Proportion Employed Increase in Average Annual Wages Between Jul-Dec 2002 and Sept 2004 (Employed Clients)
Between Jul-Dec 2002 and Sept 2004
VIEW TANF 11% 40%(N = 1,938)
Food Stamp 6% 37%Non-TANF
(N = 9,641)
Non-VIEW TANF 20%0%(N = 2,884)
Increased Child Support Collections Enhanced Families’ Incomes Collection of child support payments is another significant driver of increased income for families who improved their fi-nancial independence. Increased child support collections had a particularly significant effect upon the financial independence of TANF recipients.
Overall Trends in Child Support Collections. Although child support payments may not be as large as wages or as
Chapter 3: Changes in Client Self-Sufficiency 28
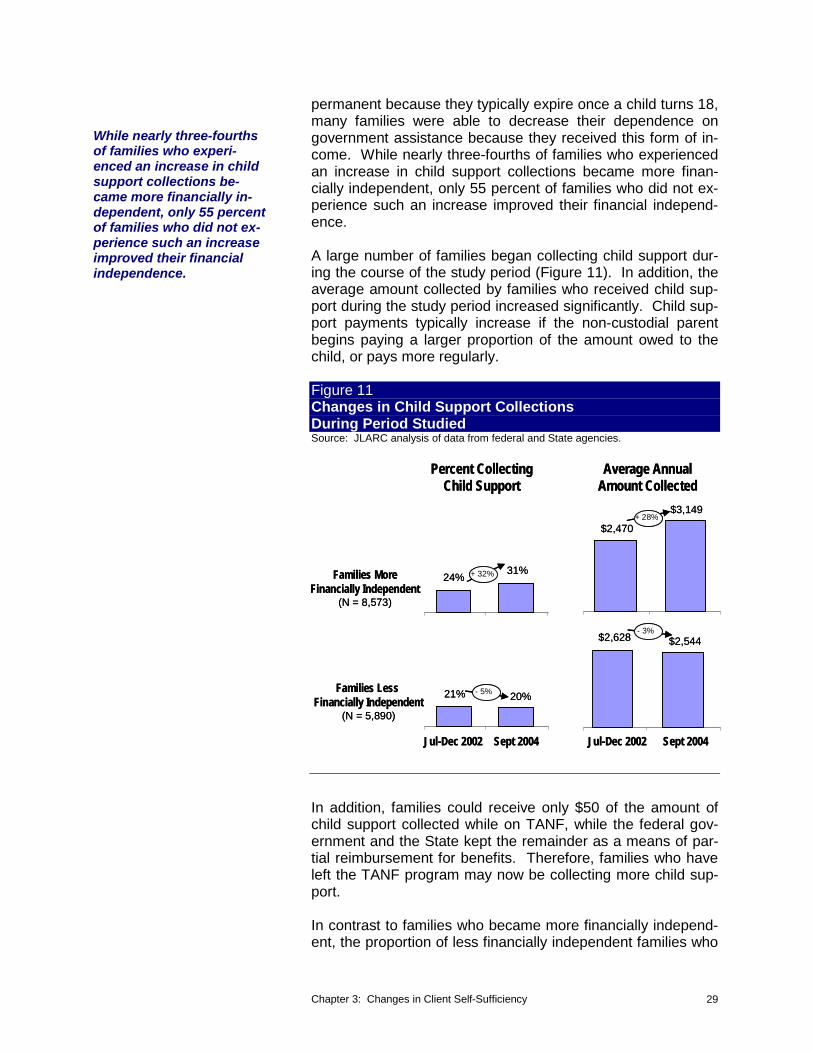
- 3%
+ 32%
+ 28%
- 5%
permanent because they typically expire once a child turns 18, many families were able to decrease their dependence on government assistance because they received this form of in-come. While nearly three-fourths of families who experienced an increase in child support collections became more finan-cially independent, only 55 percent of families who did not ex-perience such an increase improved their financial independ-ence.
A large number of families began collecting child support dur-ing the course of the study period (Figure 11). In addition, the average amount collected by families who received child sup-port during the study period increased significantly. Child sup-port payments typically increase if the non-custodial parent begins paying a larger proportion of the amount owed to the child, or pays more regularly.
Figure 11 Changes in Child Support Collections During Period Studied Source: JLARC analysis of data from federal and State agencies.
Percent Collecting Average AnnualPercent Collecting Average AnnualChild Support Amount CollectedChild Support Amount Collected
While nearly three-fourths of families who experi-enced an increase in child support collections be-came more financially in-dependent, only 55 percent of families who did not ex-perience such an increase improved their financial independence.
$3,149
$2,470
$3,+ 28%
149
$2,470
Families MoreFamilies More + 32% 24% 31%24% 31%
Financially IndependentFinancially Independent(N = 8,573)(N = 8,573)
$2,$2 628,628 $2,544 - 3%
$2,544
Families LessFamilies Less 21%21% 20%- 5% 20%Financially IndependentFinancially Independent(N = 5,890)(N = 5,890)
Jul-Dec 2002 Sept 2004 Jul-Dec 2002 Sept 2004Jul-Dec 2002 Sept 2004 Jul-Dec 2002 Sept 2004
In addition, families could receive only $50 of the amount of child support collected while on TANF, while the federal gov-ernment and the State kept the remainder as a means of par-tial reimbursement for benefits. Therefore, families who have left the TANF program may now be collecting more child sup-port.
In contrast to families who became more financially independ-ent, the proportion of less financially independent families who
Chapter 3: Changes in Client Self-Sufficiency 29
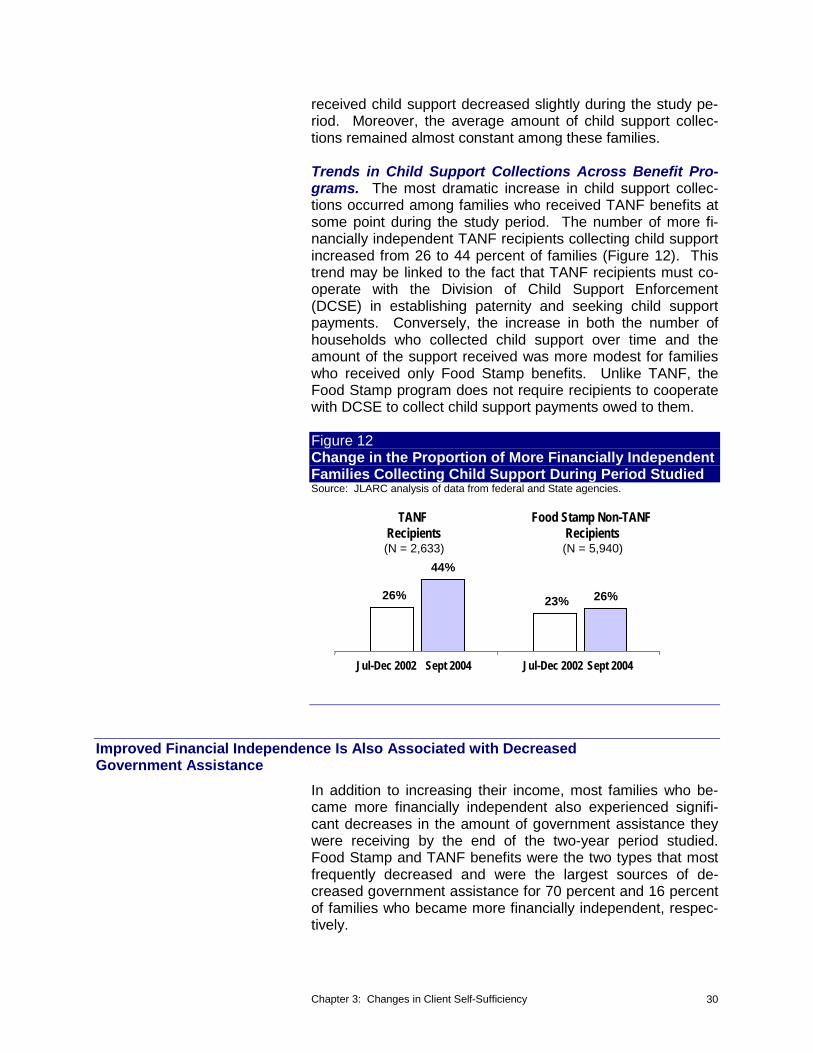
received child support decreased slightly during the study pe-riod. Moreover, the average amount of child support collec-tions remained almost constant among these families.
Trends in Child Support Collections Across Benefit Pro-grams. The most dramatic increase in child support collec-tions occurred among families who received TANF benefits at some point during the study period. The number of more fi-nancially independent TANF recipients collecting child support increased from 26 to 44 percent of families (Figure 12). This trend may be linked to the fact that TANF recipients must co-operate with the Division of Child Support Enforcement (DCSE) in establishing paternity and seeking child support payments. Conversely, the increase in both the number of households who collected child support over time and the amount of the support received was more modest for families who received only Food Stamp benefits. Unlike TANF, the Food Stamp program does not require recipients to cooperate with DCSE to collect child support payments owed to them.
Figure 12 Change in the Proportion of More Financially Independent Families Collecting Child Support During Period Studied Source: JLARC analysis of data from federal and State agencies.
TANF Food Stamp Non-TANF Recipients Recipients (N = 2,633) (N = 5,940)
44%
26% 23% 26%
Jul-Dec 2002 Sept 2004 Jul-Dec 2002 Sept 2004
Improved Financial Independence Is Also Associated with Decreased Government Assistance
In addition to increasing their income, most families who be-came more financially independent also experienced signifi-cant decreases in the amount of government assistance they were receiving by the end of the two-year period studied. Food Stamp and TANF benefits were the two types that most frequently decreased and were the largest sources of de-creased government assistance for 70 percent and 16 percent of families who became more financially independent, respec-tively.
Chapter 3: Changes in Client Self-Sufficiency 30

Whereas every family in the JLARC sample received Food Stamp benefits in 2002, only half of them participated in the program as of September 2004 (Figure 13). In addition, the number of more financially independent families receiving TANF benefits declined by more than 60 percent by the end of the study period.
Nearly half of more financially independent families who stopped receiving Food Stamp benefits did so because they chose not to apply for benefits again, and another quarter of these families applied but were ineligible because their income exceeded eligibility thresholds. Less than ten percent of more financially independent families who ceased to receive Food Stamp benefits had failed to meet program requirements or had reached a time limit.
Figure 13 Changes in Proportion of Families Receiving Food Stamp and TANF Benefits During Period StudiedSource: JLARC analysis of data from federal and State agencies.
Percent Receiving Percent Receiving Food Stamp Benefits TANF Benefits
+ 31%
18% 23%
24% 9%
100%
49%
- 11%
- 51%
- 61%
100% 89%
Families More Financially Independent
(N = 8,573)
Families Less Financially Independent
(N = 5,890)
Jul-Dec 2002 Sept 2004 Jul-Dec 2002 Sept 2004
The most frequent reasons for which families stopped partici-pating in TANF were different than those for Food Stamp benefits. Nearly one-third of more financially independent families who ceased to receive cash assistance had income in excess of the eligibility thresholds, and another quarter of fami-lies reached a time limit. Approximately ten percent of more financially independent families who stopped receiving TANF benefits had failed to meet certain requirements, such as es-tablishing paternity or signing the personal responsibility agreement.
Chapter 3: Changes in Client Self-Sufficiency 31

Less financially independent families relied more heavily on government assistance in 2004 than in 2002. This trend is to be expected because government assistance acts as a safety net for families whose financial situation deteriorates. As a re-sult of the decline in their financial resources, a significant pro-portion of these families began receiving cash assistance through the TANF program during the study period (Figure 13). In addition, only a small percentage of less financially in-dependent families stopped receiving Food Stamp benefits by the end of the two-year period.
One-Quarter of Families Who Improved Their Financial Independence Did Not Advance Closer to Self-Sufficiency
Improved financial independence does not always result in progress toward self-sufficiency. While the majority of families who improved their financial independence also advanced closer to self-sufficiency, one-quarter of them experienced a decline in their total resources and generally were less capa-ble of meeting their basic needs at the end of the two-year pe-riod studied. There may, however, be instances in which fami-lies who had lower economic resources at the end of the two-year period may be just as able to meet their basic needs, par-ticularly if family circumstances changed or some family mem-bers moved away.
The financial resources of these families decreased for one of two primary reasons:
• Families’ incomes did not increase sufficiently to fully offset the amount of government assistance they lost; or
• Families decreased their reliance on government assis-tance but also experienced a decrease in income.
VIEW participants who became more financially independent were the most likely to lose more in government assistance than they gained in income. This trend can be partially ex-plained by the fact that VIEW participants received, on aver-age, a substantially larger amount of government assistance than other benefit recipients primarily due to the additional ser-vices they access such as child care or transportation assis-tance. The loss of such a significant amount of government assistance was difficult to replace even for the VIEW clients whose incomes increased substantially.
Food Stamp recipients were the most likely group of more fi-nancially independent families to experience simultaneous re-ductions in both benefits and income. While Food Stamp benefits generally increase if a family’s income declines, a re-
Chapter 3: Changes in Client Self-Sufficiency 32
duction in the number of family members could result in lower benefits even if the family’s income declines.
Some Families Improved Their Financial Independence Temporarily Four out of five families were able to improve their financial in-dependence at some point during the study period even though they ultimately did not become more financially inde-pendent. Moreover, most of these families experienced greater financial independence for nine months or more, indi-cating a consistent trend.
It appears that many fami- It appears that many families were unable to sustain improved lies were unable to sustain financial independence because certain events or barriers to improved financial inde- self-sufficiency negatively affected their earnings potential or pendence because certain increased their basic needs. For nearly half of families, their events or barriers to self- improved financial independence ceased because their wages sufficiency negatively af-fected their earnings po- decreased. The reasons behind this decrease in wages were tential or increased their split almost evenly between job loss and lower pay or fewer basic needs. hours worked. One-fourth of families lost some financial inde-
pendence because the amount of their Food Stamp benefits increased while their income did not increase commensu-rately. This increase in benefits would typically occur if other household members were added to a family’s case.
DESPITE IMPROVEMENTS IN FINANCIAL INDEPENDENCE, RESOURCES OF MOST SOCIAL SERVICES FAMILIES FALL BELOW MEASURES OF SELF-SUFFICIENCY
Improved financial independence can be an indicator that families are taking positive steps that may, ultimately, enable them to be fully self-sufficient. However, while the majority of social services clients are enjoying greater financial independ-ence, they remain far from being able to provide for their fami-lies’ needs without the aid of public assistance. Although fami-lies who became more financially independent relied on government assistance for only 19 percent of their total re-sources at the end of the two-year period studied, this amount remains an important component of their ability to meet basic needs.
Average Income and Resources of Most Families Fall Below Measures of Self-Sufficiency
At the end of the period studied, the average annual family in-come fell well below the federal poverty line (FPL), and even further below the Self-Sufficiency Standard (Figure 14). The receipt of government assistance helped families to slightly exceed the poverty line, on average, and to close part of the gap between their income and the Self-Sufficiency Standard. Still, these results suggest that a large number of social ser-
Chapter 3: Changes in Client Self-Sufficiency 33
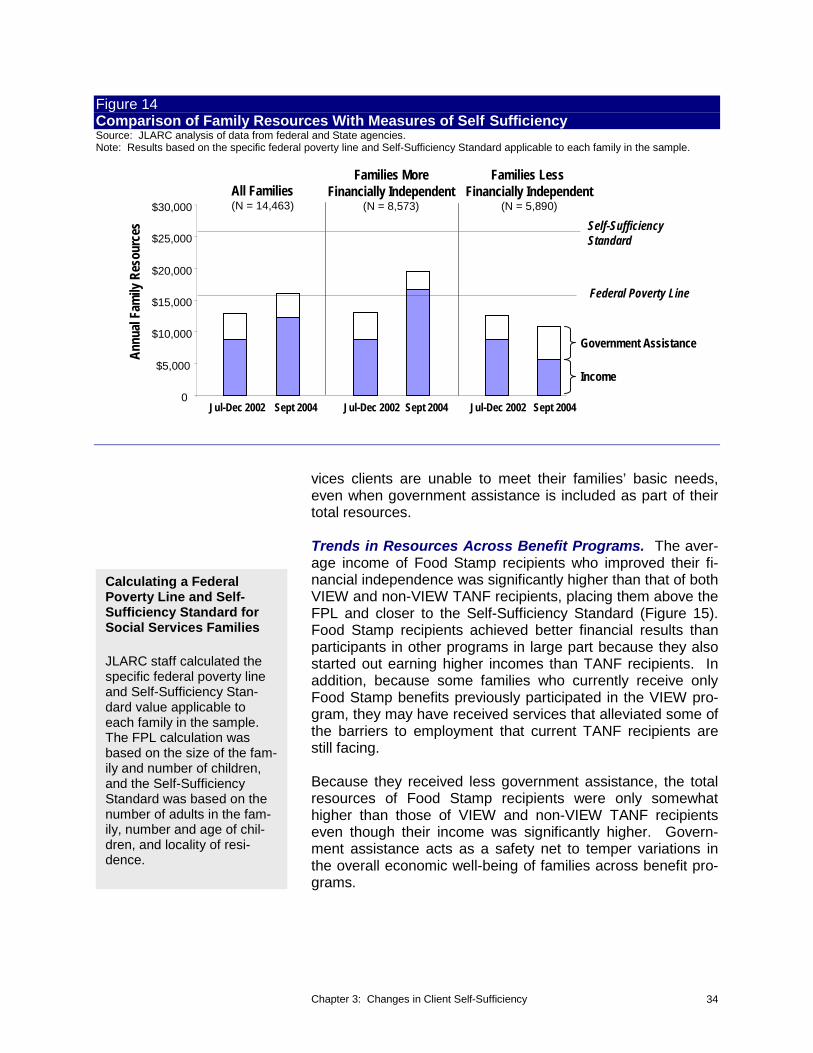
-Figure 14 Comparison of Family Resources With Measures of Self SufficiencySource: JLARC analysis of data from federal and State agencies.Note: Results based on the specific federal poverty line and Self-Sufficiency Standard applicable to each family in the sample.
All Families $30,000 (N = 14,463)
$25,000
$20,000
$15,000
$10,000
$5,000
0 Jul-Dec 2002 Sept 2004
Families MoreFinancially Independent
(N = 8,573)
Jul-Dec 2002 Sept 2004
Families Less Financially Independent
(N = 5,890)
Self-Sufficiency Standard
Federal Poverty Line
Government Assistance
Income
Jul-Dec 2002 Sept 2004
Annu
al F
amily
Res
ourc
es
vices clients are unable to meet their families’ basic needs, even when government assistance is included as part of their total resources.
Trends in Resources Across Benefit Programs. The aver-age income of Food Stamp recipients who improved their fi-nancial independence was significantly higher than that of both VIEW and non-VIEW TANF recipients, placing them above the FPL and closer to the Self-Sufficiency Standard (Figure 15). Food Stamp recipients achieved better financial results than participants in other programs in large part because they also started out earning higher incomes than TANF recipients. In addition, because some families who currently receive only Food Stamp benefits previously participated in the VIEW pro-gram, they may have received services that alleviated some of the barriers to employment that current TANF recipients are still facing.
Because they received less government assistance, the total resources of Food Stamp recipients were only somewhat higher than those of VIEW and non-VIEW TANF recipients even though their income was significantly higher. Govern-ment assistance acts as a safety net to temper variations in the overall economic well-being of families across benefit pro-grams.
Calculating a Federal Poverty Line and Self-Sufficiency Standard for Social Services Families
JLARC staff calculated the specific federal poverty line and Self-Sufficiency Stan-dard value applicable to each family in the sample. The FPL calculation was based on the size of the fam-ily and number of children, and the Self-Sufficiency Standard was based on the number of adults in the fam-ily, number and age of chil-dren, and locality of resi-dence.
Chapter 3: Changes in Client Self-Sufficiency 34

-Figure 15 Comparison of Family Resources and Measures of Self Sufficiency for More Financially Independent Families as of September 2004 Source: JLARC analysis of data from federal and State agencies.Note: The federal poverty line and Self-Sufficiency Standard levels in this figure are an average of the individual FPL and standard value for each family in the sample.
Food Stamp VIEW TANF Non-VIEW TANF Non-TANF (N = 1,263) (N = 1,370) (N = 5,940)
0
$5,000
$10,000
$15,000
$20,000
$25,000
$30,000
Government Assistance
Income
Annu
al F
amily
Res
ourc
es
Self-Sufficiency Standard
Federal Poverty Line
Most Families Do Not Advance Beyond Poverty or Achieve Self-Sufficiency Most families’ resources remained below the FPL and the Self-Sufficiency Standard at the end of the two-year period studied, even when government assistance is included (Figure 16). While nearly half of more financially independent families had incomes in excess of the FPL, less than 20 percent of them exceeded the Self-Sufficiency Standard. Moreover, only a small proportion of families who became less financially inde-pendent during the study period had income in excess of the FPL, and even fewer exceeded the Self-Sufficiency Standard. Hourly Wage Needed to Even when government assistance is included, more than four Exceed Measures of
Self-Sufficiency out of five families who became less financially independent (Based on average for had resources below the FPL.study sample)
Trends Across Benefit Programs. Food Stamp recipients Full-time workers must earn: who became more financially independent were nearly twice
as likely as VIEW and non-VIEW TANF recipients to exceed • $7.82 per hour to exceed the poverty line and more than twice as likely to exceed the
the average federal pov- Self-Sufficiency Standard, excluding government assistance erty line of $15,600 (Figure 17). However, the gap between the proportion of Food
• $12.90 per hour to ex- Stamp and TANF recipients exceeding either measure of self-ceed the average Self- sufficiency decreases when government assistance is included Sufficiency Standard of $25,800 in their resources. Government assistance lifted a substantial
• For reference, the mini- number of families above the FPL. There was little difference mum wage in Virginia is in the proportion exceeding either of the two measures of self-$5.15 per hour sufficiency between VIEW and non-VIEW TANF recipients
who improved their financial independence.
Chapter 3: Changes in Client Self-Sufficiency 35
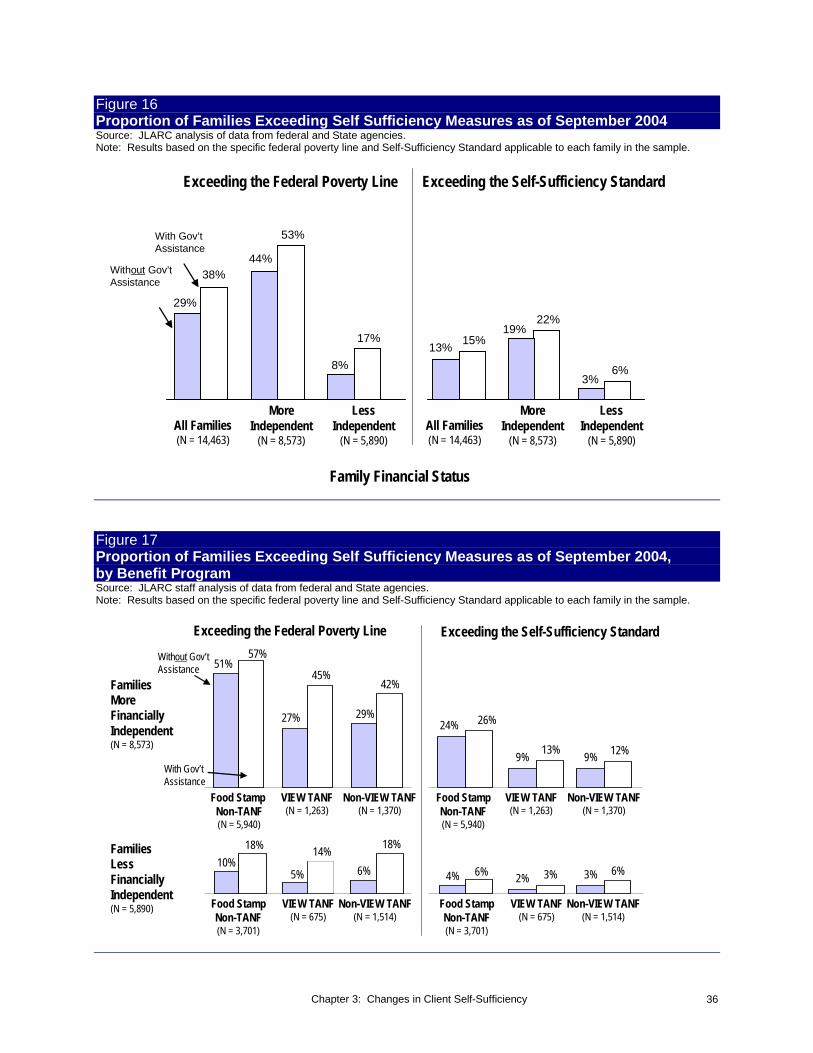
Figure 16 Proportion of Families Exceeding Self Sufficiency Measures as of September 2004 Source: JLARC analysis of data from federal and State agencies.Note: Results based on the specific federal poverty line and Self-Sufficiency Standard applicable to each family in the sample.
Exceeding the Federal Poverty Line
With Gov’t 53%Assistance
44% Without Gov’t 38% Assistance
29%
17%
8%
More Less All Families Independent Independent (N = 14,463) (N = 8,573) (N = 5,890)
Exceeding the Self-Sufficiency Standard
22%19%
15%13%
6%3%
More Less All Families Independent Independent(N = 14,463) (N = 8,573) (N = 5,890)
Family Financial Status
Figure 17 Proportion of Families Exceeding Self Sufficiency Measures as of September 2004, by Benefit Program Source: JLARC staff analysis of data from federal and State agencies.Note: Results based on the specific federal poverty line and Self-Sufficiency Standard applicable to each family in the sample.
Exceeding the Federal Poverty Line
Without Gov’t 57% 51%Assistance 45%
42%Families More Financially 29%27% Independent (N = 8,573)
With Gov’tAssistance
Food Stamp VIEW TANF Non-VIEW TANF Non-TANF (N = 1,263) (N = 1,370) (N = 5,940)
Families 18% 14%
18%
Less 10% 6%5%Financially
Independent (N = 5,890) Food Stamp VIEW TANF Non-VIEW TANF
Non-TANF (N = 675) (N = 1,514) (N = 3,701)
Exceeding the Self-Sufficiency Standard
24% 26%
13% 12%9% 9%
Food Stamp Non-TANF (N = 5,940)
VIEW TANF (N = 1,263)
Non-VIEW TANF (N = 1,370)
4% 6% 2% 3% 3% 6%
Food Stamp VIEW TANF Non-VIEW TANF Non-TANF (N = 675) (N = 1,514) (N = 3,701)
Chapter 3: Changes in Client Self-Sufficiency 36

Families Receiving Benefit as of Sept 2004
More Financially Independent Families Receiv
ilies Receiving Benefit in July Dec 2002
MOST FAMILIES WHO IMPROVED THEIR FINANCIAL INDEPENDENCE CONTINUED TO RELY ON GOVERNMENT ASSISTANCE
Because the income of social services clients tended to be low even when they became more financially independent, most families remained eligible for and continued to receive gov-ernment assistance in order to meet their basic needs. While they were reliant on government assistance to a lesser de-gree, most families who have moved to a position of greater fi-nancial independence were still receiving some form of gov-ernment assistance at the end of the two-year period studied (Figure 18).
Figure 18 Proportion of More Financially Independent Families Receiving Government Assistance in September 2004 Source: JLARC staff analysis of data from federal and State agencies. Note: N = 8,573 families.
Fam –Families Receiving Benefit in July Dec 2002–
Families Receiving Benefit as of Sept 2004 Families NOT ReceivingFamilies NOT ReceivingBenefit as of Sept 2004Benefit as of Sept 2004
Child Medicaid/FAMIS
Adult Medicaid
SSI
Energy
Child Care
Food Stamp
TANF
Any Benefit
Child Medicaid/FAMIS
Adult Medicaid
SSI
Energy
Child Care
Food Stamp
TANF
Any Benefit
0% 20% 40% 60% 80% 100%0% 20% 40% 60% 80% 100%
Proportion ofProportion of More Financially Independent Families Receiv ing a Benefiting a Benefit
Among more financially independent families, the two pro-grams in which participation declined the most were TANF and Food Stamps. In contrast, there was only a small decrease in participation in the Child Care Subsidy and Energy Assistance programs. There was a slight increase in the number of households collecting Supplemental Security Income (SSI) benefits for a spouse or child.
Many families continued to rely on the Medicaid and Family Access to Medical Insurance Security (FAMIS) programs to
Chapter 3: Changes in Client Self-Sufficiency 37

access medical care. In particular, the number of more finan-cially independent families who receive government health benefits for their children decreased by only a small proportion over the course of the period studied. This trend can be at-tributed, in part, to the high income eligibility thresholds for FAMIS relative to the average income of families studied. In addition, only 12 percent of respondents to a JLARC survey (Appendix B) reported having access to private health insur-ance for their children, while another ten percent of children were uninsured.
Unlike FAMIS, the income eligibility level for adults who seek Medicaid coverage is relatively low. This may partially explain why a relatively large proportion of individuals who became more financially independent were no longer covered by Medi-caid in September 2004. While survey results indicate that 26 percent of adults secured health insurance coverage in the private market, another 44 percent of adults reported being un-insured.
Chapter 3: Changes in Client Self-Sufficiency 38
Cha
pter 44 BBaarrrriieerrss ttoo SSeellff--SSuuffffiicciieennccyy
In S
umm
ary.
.. Clients of the social services system tend to face many obstacles that interfere with their ability to obtain a job, retain a job, and set goals for career advancement – three critical stages to achieving self-sufficiency. Clients who face barriers are less likely to work and tend to earn lower wages when they become employed, making them less likely to become more financially independent and achieve self-sufficiency. Although one specific barrier can block the path to self-sufficiency, some barriers can also occur in tandem. The presence of multiple barriers appears to compound clients’ difficulties in becoming employed, improving their wages, and advancing toward financial independence.
Research Methods
The data used in this chapter were collected through a survey administered by the Virginia Commonwealth Uni-versity's Survey and Evalua-tion Research Laboratory. Telephone interviews were conducted with 500 current and former DSS clients ran-domly chosen from a pool of 37,250 individuals who re-ceived benefits in 2002, and resided in the 15 localities visited by JLARC staff for this study. Clients answered questions concerning their barriers to employment, ex-perience with local case managers, and work history. A more detailed description of the survey is provided in Appendix B.
Clients of the social services system frequently face barriers that appear to undermine their ability to work and increase their wages, two necessary steps toward self-sufficiency. The notion of barriers to employment was recognized during wel-fare reform, as evidenced by the mandatory provision of child care, transportation assistance, and barrier assessment for cash assistance recipients.
The most common barriers to self-sufficiency among social services clients fall into seven distinct categories:
• Logistical (such as child care, transportation); • Lack of or limited work experience; • Lack of or limited education and training; • Physical and mental health; • Lack of or limited support network; • Lack of or limited life skills; and • Criminal record.
Clients frequently face multiple barriers to self-sufficiency that seem to compound their inability to obtain and retain employ-ment. Nearly half of respondents in a recent survey faced multiple barriers, making their advancement toward self-sufficiency an even greater challenge. For example, surveyed clients who reported having three barriers were 13 percent less likely to work and 26 percent less likely to increase their
Chapter 4: Barriers to Self-Sufficiency 39

-
Planning
earnings compared to clients with only one barrier. In addition, clients with two major barriers earned, on average, $5,700 less per year than those with one major barrier. Therefore, the greater the number of barriers a client faced, the less likely they were to obtain a job, advance in a career, and ultimately become more financially independent.
Clients with multiple barriers to self-sufficiency must identify, address, and overcome each barrier in order to achieve self-sufficiency. As illustrated in Figure 19, each barrier is only one piece of the puzzle created by the numerous challenges that often face social services clients. Even after some pieces are in place, a single unaddressed barrier can preclude clients from obtaining steady employment, moving off government assistance, and achieving self-sufficiency.
Finally, barriers can affect families at every stage of their ad-vancement toward financial independence. For example, a lack of job skills may affect the ability to obtain a job, but will also limit opportunities for career advancement. Similarly, sin-gle parents must have access to child care to both find and keep a job. Because job placement, job retention, and career advancement are all necessary steps toward self-sufficiency, it follows that barriers must be addressed throughout clients’ ad-vancement toward self-sufficiency in order to facilitate suc-cess.
Figure 19 Common Barriers to Self SufficiencSource: JLARC staff graphic.
Transportation
Learning
Disability
Substance Abuse
Education Medical
Condition
Budgeting
Dental Care Mental Health
Child Care Housing
Training
Domestic Violence
Work Experience
Support
Network
Criminal Record
Planning
A S S E S S M E N T
LogisticalLogistical
Work Experience
Education andEducation and TrainingTraining
Physical andPhysical and Mental HealthMental Health
Support Network
Life Skills
Criminal Record
Chapter 4: Barriers to Self-Sufficiency 40
Logistical Barriers May Decrease Clients’ Ability to Attain Self-Sufficiency Child care and transportation are logistical considerations that can affect clients’ ability to work and retain their jobs. Because work appears to be strongly linked to increased financial inde-pendence, logistical barriers can have a substantial impact on families’ ability to become self-sufficient.
Child Care Barriers May Limit Ability to Obtain Employ-ment and Achieve Self-Sufficiency. The lack of affordable, reliable, and quality child care can create a significant barrier to self-sufficiency for social services clients. Access to child care may increase a parent’s ability to obtain and maintain employment and ultimately achieve self-sufficiency. Yet, the cost of quality child care can be prohibitive for low-wage earn-
The average social ser- ers. In Virginia, the average cost of formal child care per vices client’s income for month ranged from $240 a month for one school age child to full-time employment is $380 for an infant in 2002, according to a Virginia Department $1,000 a month, or $5.77 of Social Services (DSS) survey of child care providers across an hour, and formal child the State. In comparison, the average income of social ser-care costs $240 to $380 a vices families in the JLARC study is $1,000 per month. As a month per child. result, over one-third of clients who participated in a JLARC
survey reported that child care was a barrier that threatened their ability to work.
Many parents overcome the child care barrier by leaving their child in the care of a friend or relative who typically charges less than formal providers. However, according to local de-partment staff, these informal arrangements tend to be less re-liable and may compromise parents’ ability to go to work con-sistently, which can threaten a worker’s employment.
In addition, research has shown that quality, formal child care has positive long-term effects on children’s success in school. Children from low-income families may not have as many edu-cational opportunities outside of the classroom or formal child care environment, which makes the quality of the child care provided especially important for this population. Participation in quality child care provides children with better tools needed to succeed in school, and may play a role in breaking the cycle of poverty for families who receive government assistance.
Transportation Barriers Can Hinder Access to Jobs. The lack of affordable, accessible, and reliable transportation can prevent clients from accessing all of the available job opportu-
One-third of social ser- nities. One-third of social services clients report that transpor-vices clients report that tation is a barrier to employment, half of whom consider it a transportation is a barrier “major barrier.” Those clients who reported transportation as a to employment. major barrier were significantly less likely to increase their
wages compared to other clients (Figure 20).
Chapter 4: Barriers to Self-Sufficiency 41

52%
38%
Proportion with Higher Wages in Sept 2004 than in 2002
a Major
Figure 20 Association Between Transportation Barriers and WagesSource: JLARC analysis of Virginia Commonwealth University survey results and Virginia Employment Commission wage data.
Proportion with Higher Wages in Sept 2004 than in 2002
52%
38%
Clients WITHOUT a Major Clients WITHClients WITHOUT a Major Clients WITH a Major Transportation Barrier Transportation BarrierTransportation Barrier Transportation Barrier
(N = 424) (N = 77)(N = 424) (N = 77)
In general, clients with transportation barriers have trouble ac-cessing and affording reliable personal or public transporta-tion. Social services clients cannot always afford their own car. For those who can, the expense to maintain the vehicle can be prohibitive. The sudden loss of use of a vehicle may prevent individuals from accessing grocery stores, child care facilities, or their current job or other employment opportunities if no other forms of transportation are available.
Clients who do not own a vehicle must rely on public transpor-tation, private providers, or friends and family to get to work. While some form of public transportation is typically available in urban areas, this service seldom extends to suburbs where many employers are located, and buses may stop running in the evening. As a result, clients may be confined to finding jobs only within their immediate area and within a limited time frame, and may therefore miss employment opportunities that would otherwise be available. In addition, clients in rural areas typically have no access to public transportation.
Lack of Work Experience May Create Barriers to Employment Client’s work experience can determine whether they possess marketable skills and are able to adapt successfully to a new workplace. Many social services clients tend to have limited work experience or an unsatisfactory work history, which can make employers reluctant to hire them. In addition to building a skill set, work experience also allows individuals to develop “soft skills,” such as how to operate within the work environ-ment, deal with conflict, and develop a working relationship
Chapter 4: Barriers to Self-Sufficiency 42
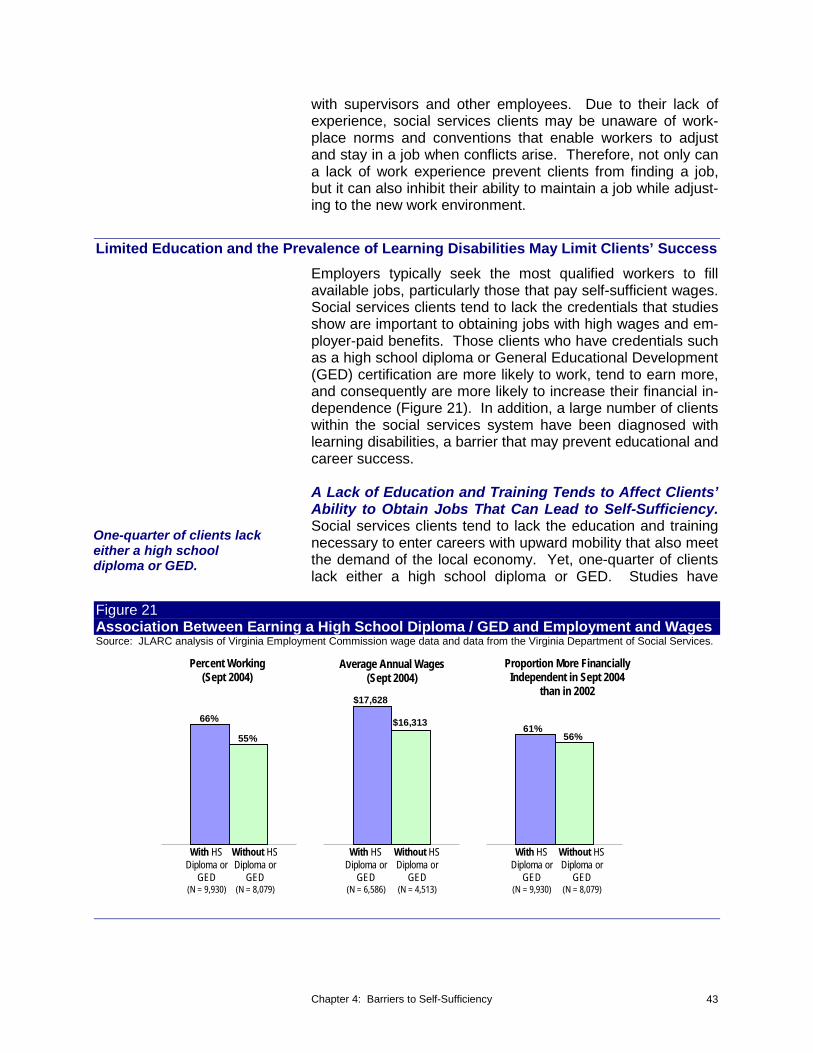
with supervisors and other employees. Due to their lack of experience, social services clients may be unaware of work-place norms and conventions that enable workers to adjust and stay in a job when conflicts arise. Therefore, not only can a lack of work experience prevent clients from finding a job, but it can also inhibit their ability to maintain a job while adjust-ing to the new work environment.
Limited Education and the Prevalence of Learning Disabilities May Limit Clients’ Success Employers typically seek the most qualified workers to fill available jobs, particularly those that pay self-sufficient wages. Social services clients tend to lack the credentials that studies show are important to obtaining jobs with high wages and em-ployer-paid benefits. Those clients who have credentials such as a high school diploma or General Educational Development (GED) certification are more likely to work, tend to earn more, and consequently are more likely to increase their financial in-dependence (Figure 21). In addition, a large number of clients within the social services system have been diagnosed with learning disabilities, a barrier that may prevent educational and career success.
A Lack of Education and Training Tends to Affect Clients’ Ability to Obtain Jobs That Can Lead to Self-Sufficiency. Social services clients tend to lack the education and training One-quarter of clients lack
either a high school necessary to enter careers with upward mobility that also meet diploma or GED. the demand of the local economy. Yet, one-quarter of clients
lack either a high school diploma or GED. Studies have
Figure 21 Association Between Earning a High School Diploma / GED and Employment and Wages Source: JLARC analysis of Virginia Employment Commission wage data and data from the Virginia Department of Social Services.
Percent Working Average Annual Wages Proportion More Financially (Sept 2004) (Sept 2004) Independent in Sept 2004
than in 2002
66%
55%
$17,628
$16,313 61% 56%
With HS Without HS With HS Without HS With HS Without HS Diploma or Diploma or Diploma or Diploma or Diploma or Diploma or
GED GED GED GED GED GED (N = 9,930) (N = 8,079) (N = 6,586) (N = 4,513) (N = 9,930) (N = 8,079)
Chapter 4: Barriers to Self-Sufficiency 43
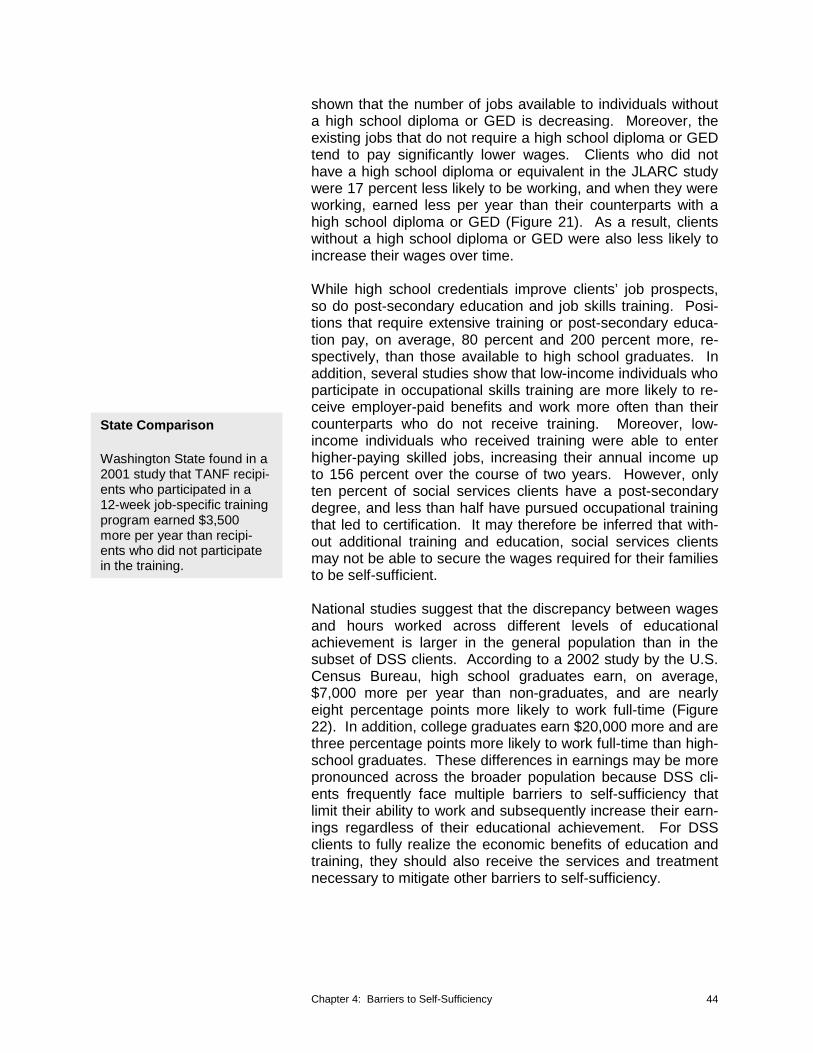
State Comparison
Washington State found in a 2001 study that TANF recipi-ents who participated in a 12-week job-specific training program earned $3,500 more per year than recipi-ents who did not participate in the training.
shown that the number of jobs available to individuals without a high school diploma or GED is decreasing. Moreover, the existing jobs that do not require a high school diploma or GED tend to pay significantly lower wages. Clients who did not have a high school diploma or equivalent in the JLARC study were 17 percent less likely to be working, and when they were working, earned less per year than their counterparts with a high school diploma or GED (Figure 21). As a result, clients without a high school diploma or GED were also less likely to increase their wages over time.
While high school credentials improve clients’ job prospects, so do post-secondary education and job skills training. Posi-tions that require extensive training or post-secondary educa-tion pay, on average, 80 percent and 200 percent more, re-spectively, than those available to high school graduates. In addition, several studies show that low-income individuals who participate in occupational skills training are more likely to re-ceive employer-paid benefits and work more often than their counterparts who do not receive training. Moreover, low-income individuals who received training were able to enter higher-paying skilled jobs, increasing their annual income up to 156 percent over the course of two years. However, only ten percent of social services clients have a post-secondary degree, and less than half have pursued occupational training that led to certification. It may therefore be inferred that with-out additional training and education, social services clients may not be able to secure the wages required for their families to be self-sufficient.
National studies suggest that the discrepancy between wages and hours worked across different levels of educational achievement is larger in the general population than in the subset of DSS clients. According to a 2002 study by the U.S. Census Bureau, high school graduates earn, on average, $7,000 more per year than non-graduates, and are nearly eight percentage points more likely to work full-time (Figure 22). In addition, college graduates earn $20,000 more and are three percentage points more likely to work full-time than high-school graduates. These differences in earnings may be more pronounced across the broader population because DSS cli-ents frequently face multiple barriers to self-sufficiency that limit their ability to work and subsequently increase their earn-ings regardless of their educational achievement. For DSS clients to fully realize the economic benefits of education and training, they should also receive the services and treatment necessary to mitigate other barriers to self-sufficiency.
Chapter 4: Barriers to Self-Sufficiency 44

Figure 22 Work Experience and Average Annual Earnings of Workers 25 to 64 Years Old by Educational Attainment, 1997-1999 Source: U.S. Census Bureau, 2002.
Average Annual Earnings Percent Working Full-TimeAverage Annual Earnings Percent Working Full-Time
NotNot $23,400$23,400 65.3%65.3%HS Grad.HS Grad.
$30,40$30, 0400 73.1%73.1%HS Grad.HS Grad.
SomeSome 73.9%73.9%$36,800$36,800CollegeCollege
Associate'sAssociate's 74.9%74.9%$38,200$38,200DegrDeg eeree
Bachelor'sBachelor's 76.7%76.7%$52,200$52,200DegrDeg eeree
Forty percent of social ser-vices clients who received screening were diagnosed with learning disabilities.
Learning Disabilities Can Hinder Educational Attainment and Create Barriers to Employment. Learning disabilities that are not identified or addressed can affect a client’s ability to become more financially independent. Ten percent of re-spondents to the JLARC survey indicated facing a barrier to employment because of their learning disability, four percent of whom felt that the barrier was a major impediment. Clients who reported having a major learning disability were signifi-cantly less likely to be working than other clients (Figure 23). As a result, only 21 percent of this group had experienced an increase in wages over a two-year period. The incidence of learning disabilities in social services clients is notable: a re-cent national survey shows that 40 percent of social services clients who received screening were diagnosed with learning disabilities. Without proper treatment, this large population may not be able to become more financially independent as readily as their non-learning-disabled counterparts.
Some individuals’ learning disabilities may not have been pre-viously diagnosed, which may have limited their educational progress. Therefore, there may be a higher proportion of so-cial services clients diagnosed with learning disabilities com-pared to the rest of the population because an unaddressed learning disability may have prevented social services clients from obtaining the educational credentials necessary to secure a quality job and become more financially independent.
Chapter 4: Barriers to Self-Sufficiency 45
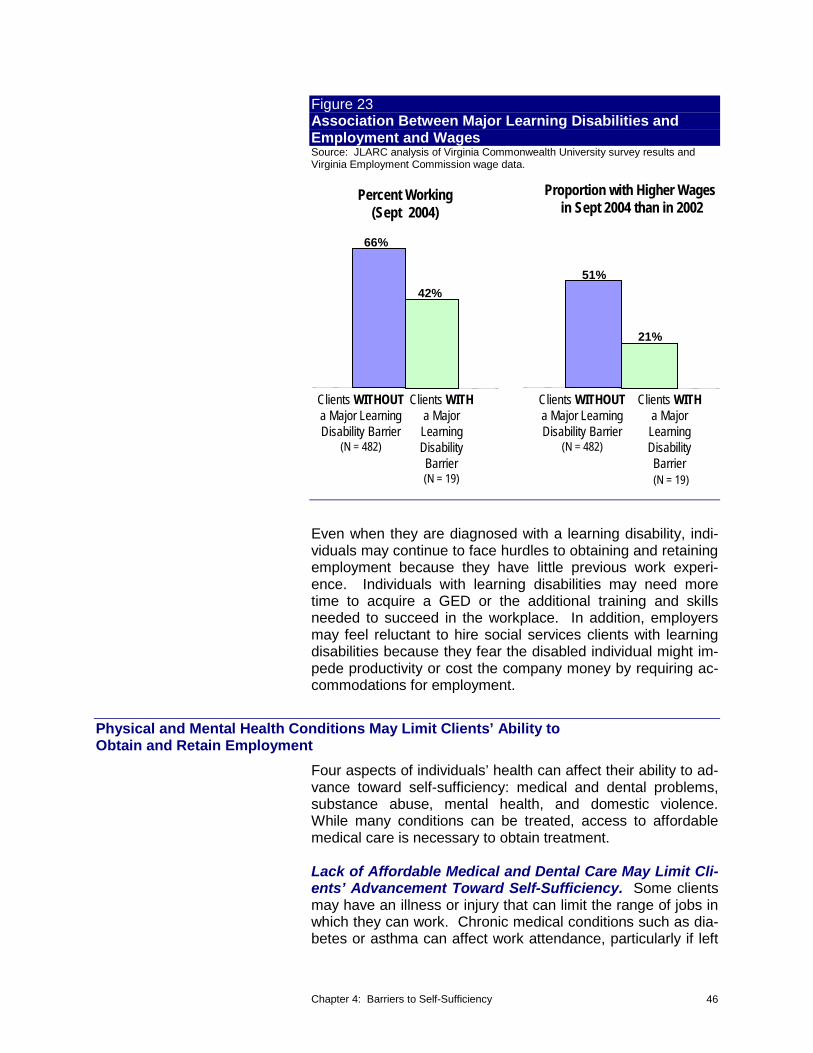
Figure 23 Association Between Major Learning Disabilities and Employment and Wages Source: JLARC analysis of Virginia Commonwealth University survey results and Virginia Employment Commission wage data.
Percent Working (Sept 2004)
Proportion with Higher Wages in Sept 2004 than in 2002
66%
42% 51%
21%
Clients WITHOUT Clients WITH Clients WITHOUT Clients WITH a Major Learning a Major a Major Learning a Major Disability Barrier Learning Disability Barrier Learning
(N = 482) Disability (N = 482) Disability Barrier Barrier (N = 19) (N = 19)
Even when they are diagnosed with a learning disability, indi-viduals may continue to face hurdles to obtaining and retaining employment because they have little previous work experi-ence. Individuals with learning disabilities may need more time to acquire a GED or the additional training and skills needed to succeed in the workplace. In addition, employers may feel reluctant to hire social services clients with learning disabilities because they fear the disabled individual might im-pede productivity or cost the company money by requiring ac-commodations for employment.
Physical and Mental Health Conditions May Limit Clients’ Ability to Obtain and Retain Employment
Four aspects of individuals’ health can affect their ability to ad-vance toward self-sufficiency: medical and dental problems, substance abuse, mental health, and domestic violence. While many conditions can be treated, access to affordable medical care is necessary to obtain treatment.
Lack of Affordable Medical and Dental Care May Limit Cli-ents’ Advancement Toward Self-Sufficiency. Some clients may have an illness or injury that can limit the range of jobs in which they can work. Chronic medical conditions such as dia-betes or asthma can affect work attendance, particularly if left
Chapter 4: Barriers to Self-Sufficiency 46

untreated. Almost one-third of clients surveyed by the Survey and Evaluation Research Laboratory at Virginia Common-wealth University (VCU) reported that medical problems were a barrier to employment. As a result, only 52 percent of those clients with a medical condition were working, compared to 69 percent of people who did not indicate a medical barrier (Fig-ure 24).
In addition, social services clients frequently suffer from poor dental health due to a lack of access to affordable dental ser-vices. Dental appearance can impact an individuals’ ability to obtain employment. For example, many social services case managers reported that it is less likely for clients missing some or all of their teeth to obtain employment because the majority of attainable jobs are customer-service oriented. Four out of the five most frequently held jobs reported by clients in the JLARC survey involve direct interaction with the public, such as a food service worker and receptionist. Therefore, lack of access to medical and dental services, particularly insurance coverage for treatment, directly impacts an individuals’ ability to obtain and retain jobs and become more financially inde-pendent.
Substance Abuse Can Be Difficult to Identify and Over-come. Substance abuse problems can also create barriers to self-sufficiency. Clients with this barrier are less likely to ob-tain and retain employment because they may not be able to
Figure 24 Association Between Medical Barriers and Employment and Wages Source: JLARC analysis of Virginia Commonwealth University survey results and Vir-ginia Employment Commission wage data.
Percent Working (Sept 2004)
Proportion with Higher Wages in Sept 2004 than in 2002
69%
52% 57%
34%
Clients WITHOUT Clients WITH Clients WITH Clients WITHOUT a Medical Barrier a Medical a Mental Health a Medical
(N = 359) Barrier Barrier Barrier (N = 142) (N = 373) (N = 142)
Chapter 4: Barriers to Self-Sufficiency 47
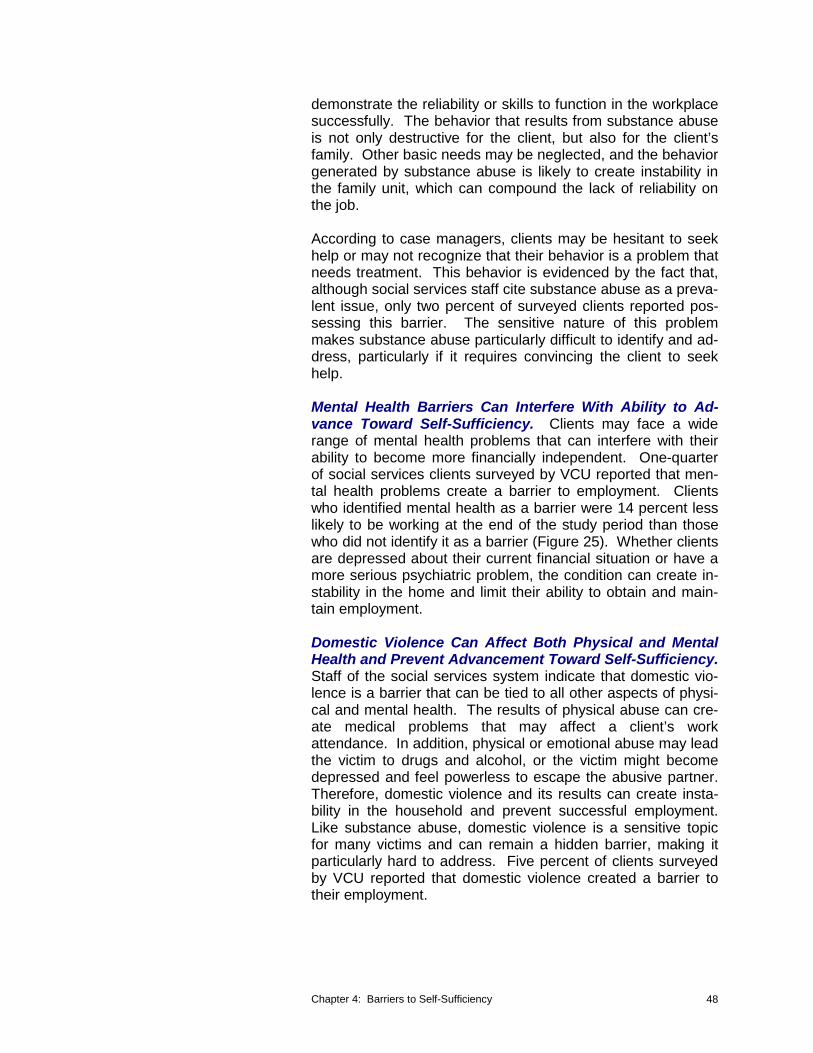
demonstrate the reliability or skills to function in the workplace successfully. The behavior that results from substance abuse is not only destructive for the client, but also for the client’s family. Other basic needs may be neglected, and the behavior generated by substance abuse is likely to create instability in the family unit, which can compound the lack of reliability on the job.
According to case managers, clients may be hesitant to seek help or may not recognize that their behavior is a problem that needs treatment. This behavior is evidenced by the fact that, although social services staff cite substance abuse as a preva-lent issue, only two percent of surveyed clients reported pos-sessing this barrier. The sensitive nature of this problem makes substance abuse particularly difficult to identify and ad-dress, particularly if it requires convincing the client to seek help.
Mental Health Barriers Can Interfere With Ability to Ad-vance Toward Self-Sufficiency. Clients may face a wide range of mental health problems that can interfere with their ability to become more financially independent. One-quarter of social services clients surveyed by VCU reported that men-tal health problems create a barrier to employment. Clients who identified mental health as a barrier were 14 percent less likely to be working at the end of the study period than those who did not identify it as a barrier (Figure 25). Whether clients are depressed about their current financial situation or have a more serious psychiatric problem, the condition can create in-stability in the home and limit their ability to obtain and main-tain employment.
Domestic Violence Can Affect Both Physical and Mental Health and Prevent Advancement Toward Self-Sufficiency. Staff of the social services system indicate that domestic vio-lence is a barrier that can be tied to all other aspects of physi-cal and mental health. The results of physical abuse can cre-ate medical problems that may affect a client’s work attendance. In addition, physical or emotional abuse may lead the victim to drugs and alcohol, or the victim might become depressed and feel powerless to escape the abusive partner. Therefore, domestic violence and its results can create insta-bility in the household and prevent successful employment. Like substance abuse, domestic violence is a sensitive topic for many victims and can remain a hidden barrier, making it particularly hard to address. Five percent of clients surveyed by VCU reported that domestic violence created a barrier to their employment.
Chapter 4: Barriers to Self-Sufficiency 48

Figure 25 Association Between Mental Health Barriers and Employment and Wages Source: JLARC analysis of Virginia Commonwealth University survey results and Virginia Employment Commission wage data.
Percent Working (Sept 2004)
Proportion with Higher Wages in Sept 2004 than in 2002
58% 59%
42% 41%
Clients WITHOUT Clients WITH Clients WITHOUT Clients WITH a Mental Health a Mental a Mental Health a Mental
Barrier Health Barrier Barrier Health Barrier (N = 373) (N = 128) (N = 373) (N = 128)
Lack of a Support Network That Provides Encouragement May Limit Economic Success Social services clients may be unable to advance toward self-sufficiency if they do not have a support network that facilitates personal and professional success, helps eliminate low self-esteem, and builds motivation. According to staff of the social services system, the lack of an encouraging and supportive force in clients’ lives may contribute to limited advancement toward self-sufficiency.
The presence of positive role models can help illustrate the value of work and self-sufficiency. Yet, clients often do not have someone in their lives willing or able to encourage them to achieve self-sufficiency or help them focus on their strengths, set long-term goals, examine other options available to them, and pursue their interests.
Case managers often reported that clients who have suffered failures that prompted their reliance on government assistance may lack the self-esteem and motivation needed to enter the workforce or improve their job prospects, as those steps may result in additional failures. Moreover, low-income families tend to live among and interact with other families who face the same struggles and difficulties in becoming self-sufficient.
Chapter 4: Barriers to Self-Sufficiency 49
In this environment, few clients observe families succeeding, and may not believe that self-sufficiency is within their reach.
Lack of Life Skills May Prevent Long-Term Advancement Toward Self-Sufficiency Budgeting and the ability to plan for the long term are two im-portant life skills that can help clients attain and maintain self-sufficiency. These skills are typically not taught in school, but rather are learned by observing and imitating the actions of others. However, case managers have indicated that many of their clients do not have role models who exhibit these skills. Consequently, many adopt spending and planning behaviors that can perpetuate poverty.
Lack of Budgeting Skills Tends to Prevent Financial Sta-bility. Case managers indicated that budgeting is particularly important for families with limited income and resources, which offer little room for financial errors. Proper budgeting may en-able clients to avoid eviction or late payments, thereby en-hancing their families’ stability. Furthermore, it can prevent or alleviate financial crises, which may otherwise precipitate the need for government assistance.
Tendency to Plan for the Short Term May Hinder Long-Term Stability and Success. Social services clients may not be able to plan for the long term because they are focusing on current crises. This lack of planning can cause clients to make choices that will affect their families negatively in the long term, or at best prevent them from improving their situation. For instance, several case managers described clients’ ten-dencies to change jobs to receive a small raise rather than stay with their former employers who offered better opportuni-ties for advancement. Similarly, focusing on the short term can make it difficult for individuals to see the value of educa-tion and training, which can be an integral part of achieving self-sufficiency. Therefore, some clients may never reach sta-bility or financial independence if they are not provided guid-ance on how to set personal, professional, and financial goals for both the short and long term.
Criminal Records Can Present Significant Barriers to Employment and Self-Sufficiency Options for employment can be limited for ex-offenders, thereby also possibly curtailing their opportunity to achieve self-sufficiency. Although not as prevalent as other barriers described in this chapter, a criminal record can be one of the most difficult barriers to overcome. Five percent of surveyed clients indicated that their criminal records created a barrier to employment. Some employers have adopted policies that prevent them from hiring individuals with a criminal history, while others may simply avoid them. Moreover, many different kinds of criminal convictions disqualify individuals from em-
Chapter 4: Barriers to Self-Sufficiency 50

ployment no matter how long ago the crime may have been committed. The list of disqualifying convictions is even longer in the medical and health care fields, a very popular area of employment for social services clients who are otherwise qualified. These restrictions can limit the number of job oppor-tunities for social services clients and, in some cases, their earnings potential.
Chapter 4: Barriers to Self-Sufficiency 51

Chapter 4: Barriers to Self-Sufficiency 52

Cha
pter 55 IImmpprroovviinngg tthhee OOuuttccoommeess
ooff TTAANNFF RReecciippiieennttssIn
Sum
mar
y...
The VIEW program was implemented to better align the operations of the social services system to support families’ transition into the workforce and off cash assistance, two important steps toward achieving self-sufficiency. However, most former VIEW participants continue to rely on various forms of government assistance. Only a limited number of families have been able to attain self-sufficiency, in part because the program focuses primarily on facilitating imme-diate job placement rather than emphasizing the importance of job quality or preparing clients for longer-term job retention and career advancement. In addition, able-bodied TANF recipients who are ex-empt from VIEW work requirements receive neither support nor positive incentives to help them advance toward self-sufficiency. To improve the economic outcomes of all TANF recipients would re-quire a shift in focus and program priorities.
Across the nation, policy-makers and nonprofit or-ganizations are exploring ways to build upon initial successes and have en-tered the next phase in welfare reform.
The goal of the Temporary Assistance for Needy Families (TANF) program, as stated in the Code of Virginia, is to “pro-vide families with the tools and opportunities to achieve self-sufficiency,” and the Virginia Initiative for Employment not Wel-fare (VIEW) program echoes this goal with its objective to “en-hance opportunities for personal initiative and self-sufficiency by promoting the value of work.” In Virginia, as in many other states, the first step in welfare reform has been to implement a program that could facilitate TANF recipients’ transition into the workforce and off government assistance. As a result of welfare reform, the number of TANF cases in Virginia has de-clined sharply, from 73,000 cases in 1995 to slightly under 36,000 cases in 2004.
While the State has been successful in helping TANF recipi-ents to obtain jobs, results presented in Chapter 3 suggest that employment alone represents only the first step toward the goal of self-sufficiency for many Virginia families. Across the nation, policymakers and nonprofit organizations are exploring ways to build upon initial successes and have entered the next phase in welfare reform. In particular, a number of states are beginning to focus on improving the quality of jobs secured by their clients in the short term, as well as preparing them for longer-term career advancement through education and train-ing.
Chapter 5: Improving the Outcomes of TANF Recipients 53

Currently, the VIEW program successfully addresses many of the barriers to employment that TANF recipients face. The program provides a useful framework upon which to build the next phase of welfare reform in Virginia through a more sus-tained focus on barriers to self-sufficiency, better job quality, and preparedness for career advancement. This chapter ex-amines options that could help families to control and remove barriers in order to improve their success in the workplace and, in turn, their ability to become self-sufficient.
PROGRAM VALUES STRESS PERSONAL ACCOUNTABILITY AND RESPONSIBILITY, BUT SOME CLIENTS COULD ENGAGE IN VIEW SOONER
The guiding principles of welfare reform emphasized the im-portance of work combined with personal responsibility as the primary means to foster self-sufficiency for individuals receiv-ing cash assistance through TANF. Through the VIEW pro-gram, the social services system has succeeded in helping cli-ents find employment and in holding them responsible for failing to meet certain obligations linked to achieving self-sufficiency. However, many TANF recipients are exempt from participating in the VIEW program and, consequently, are not held accountable for advancing toward self-sufficiency. More-over, TANF recipients who are not participating in the VIEW program appear to be less likely to advance toward and achieve self-sufficiency. While temporary exemptions are necessary for clients who experience conditions that prevent them from working, some families could benefit from receiving services and engaging in the VIEW program earlier than cur-rently required.
Able-Bodied TANF Recipients Are Expected to Work In response to concerns that prior programs operated primarily to hand out benefits that had little effect on improving families’ economic independence, welfare reform promoted the idea that clients must actively participate in and be held account-able for making the changes that can lead them toward self-sufficiency. As a result, the VIEW program now operates on the basis of shared accountability, whereby the social services system provides the tools and opportunities for clients to ad-vance toward self-sufficiency, while clients must take advan-tage of these opportunities and adhere to the requirements of the program.
Such opportunities include a variety of support services that can facilitate the transition into the workforce, combined with enhanced income eligibility thresholds that enable families to continue receiving benefits even as their wages increase. In return, VIEW participants must meet certain employment goals
Chapter 5: Improving the Outcomes of TANF Recipients 54
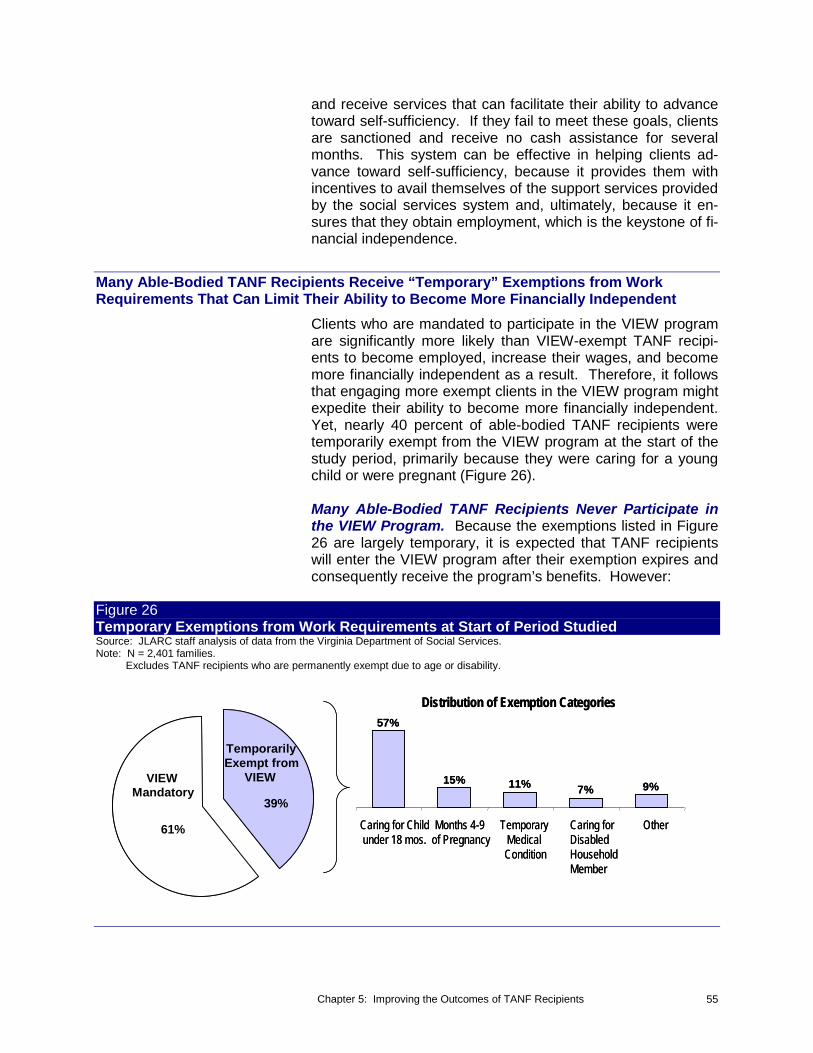
39%
61%
VIEW Mandatory
TemporarilyExempt from
VIEW
and receive services that can facilitate their ability to advance toward self-sufficiency. If they fail to meet these goals, clients are sanctioned and receive no cash assistance for several months. This system can be effective in helping clients ad-vance toward self-sufficiency, because it provides them with incentives to avail themselves of the support services provided by the social services system and, ultimately, because it en-sures that they obtain employment, which is the keystone of fi-nancial independence.
Many Able-Bodied TANF Recipients Receive “Temporary” Exemptions from Work Requirements That Can Limit Their Ability to Become More Financially Independent
Clients who are mandated to participate in the VIEW program are significantly more likely than VIEW-exempt TANF recipi-ents to become employed, increase their wages, and become more financially independent as a result. Therefore, it follows that engaging more exempt clients in the VIEW program might expedite their ability to become more financially independent. Yet, nearly 40 percent of able-bodied TANF recipients were temporarily exempt from the VIEW program at the start of the study period, primarily because they were caring for a young child or were pregnant (Figure 26).
Many Able-Bodied TANF Recipients Never Participate in the VIEW Program. Because the exemptions listed in Figure 26 are largely temporary, it is expected that TANF recipients will enter the VIEW program after their exemption expires and consequently receive the program’s benefits. However:
Figure 26 Temporary Exemptions from Work Requirements at Start of Period Studied Source: JLARC staff analysis of data from the Virginia Department of Social Services. Note: N = 2,401 families.
Excludes TANF recipients who are permanently exempt due to age or disability.
39%
61%
VIEW Mandatory
Temporarily Exempt from
VIEW
Distribution of Exemption CategoriesDistribution of Exemption Categories57%57%
15% 11%15% 9%11% 9%7%7%
Caring for Child Months 4-9 Temporary Caring for OtherCaring for Child Months 4-9 Temporary Caring for Otherunder 18 mos. of Pregnancy Medical Disabledunder 18 mos. of Pregnancy Medical Disabled
Condition HouseholdCondition Household MemberMember
Chapter 5: Improving the Outcomes of TANF Recipients 55
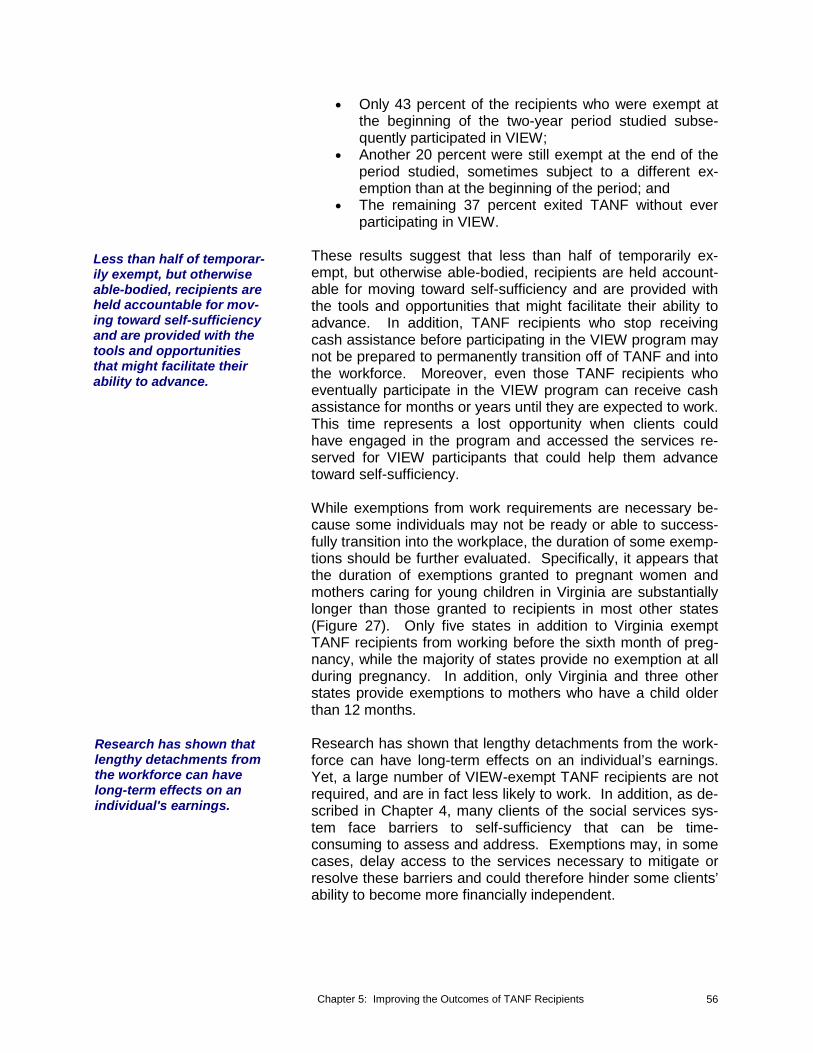
Less than half of temporar-ily exempt, but otherwise able-bodied, recipients are held accountable for mov-ing toward self-sufficiency and are provided with the tools and opportunities that might facilitate their ability to advance.
Research has shown that lengthy detachments from the workforce can have long-term effects on an individual's earnings.
• Only 43 percent of the recipients who were exempt at the beginning of the two-year period studied subse-quently participated in VIEW;
• Another 20 percent were still exempt at the end of the period studied, sometimes subject to a different ex-emption than at the beginning of the period; and
• The remaining 37 percent exited TANF without ever participating in VIEW.
These results suggest that less than half of temporarily ex-empt, but otherwise able-bodied, recipients are held account-able for moving toward self-sufficiency and are provided with the tools and opportunities that might facilitate their ability to advance. In addition, TANF recipients who stop receiving cash assistance before participating in the VIEW program may not be prepared to permanently transition off of TANF and into the workforce. Moreover, even those TANF recipients who eventually participate in the VIEW program can receive cash assistance for months or years until they are expected to work. This time represents a lost opportunity when clients could have engaged in the program and accessed the services re-served for VIEW participants that could help them advance toward self-sufficiency.
While exemptions from work requirements are necessary be-cause some individuals may not be ready or able to success-fully transition into the workplace, the duration of some exemp-tions should be further evaluated. Specifically, it appears that the duration of exemptions granted to pregnant women and mothers caring for young children in Virginia are substantially longer than those granted to recipients in most other states (Figure 27). Only five states in addition to Virginia exempt TANF recipients from working before the sixth month of preg-nancy, while the majority of states provide no exemption at all during pregnancy. In addition, only Virginia and three other states provide exemptions to mothers who have a child older than 12 months.
Research has shown that lengthy detachments from the work-force can have long-term effects on an individual’s earnings. Yet, a large number of VIEW-exempt TANF recipients are not required, and are in fact less likely to work. In addition, as de-scribed in Chapter 4, many clients of the social services sys-tem face barriers to self-sufficiency that can be time-consuming to assess and address. Exemptions may, in some cases, delay access to the services necessary to mitigate or resolve these barriers and could therefore hinder some clients’ ability to become more financially independent.
Chapter 5: Improving the Outcomes of TANF Recipients 56
Figure 27 State Comparison of Work Exemptions for Pregnancy and Child Care Source: 2003 Welfare Rules Databook.
Becomes Exempt in Which Month of Pregnancy:Becomes Exempt in Which Month of Pregnancy:
All Other StatesAll Other StatesNo ExemptionNo Exemption
9th Month9th Month
7th Month7th Month
6th Month6th Month
4th Month4th Month
3rd Month3rd Month
Exempt While Caring for Child Under Age:Exempt While Caring for Child Under Age:
No ExemptionNo Exemption
3 Months3 Months
4 Months4 Months
6 Months6 Months
12 Mont12 M hsonths
18 Mont18 M hsonths
24 Mont24 M hsonths
36 Mont36 M hsonths
AR, DE, FL, IN, MI, NE, NJ, OK, OR, SD, WI, WYAR, DE, FL, IN, MI, NE, NJ, OK, OR, SD, WI, WY
ND, TN, WAND, TN, WAHIHI
All Other StatesAll Other States
VirginiaVirginia
NH, VTNH, VT
ALAL
OR, NYOR, NY
AR, MS, MO, NJ, NM, RI, SC, WVAR, MS, MO, NJ, NM, RI, SC, WV
DC, NEDC, NE
AL, IN, NH, ND, VirginiaAL, IN, NH, ND, Virginia
OHOH
AZ, ID, IA, MA, MT, UTAZ, ID, IA, MA, MT, UT
0 100 10 2020 3030
Number of StatesNumber of States
Few Exempt Recipients Volunteer for the VIEW Program. TANF recipients who are exempt from work can volunteer to participate in the VIEW program, but few clients choose to do so despite the significant financial and service incentives that VIEW participants enjoy. Even though VIEW participants benefit from higher income eligibility thresholds and free child care, only five percent of TANF recipients who met the criteria for an exemption at the start of the JLARC period studied had chosen to volunteer for the VIEW program. Although these data precede recent policy changes designed to make volun-teering more attractive to clients, case managers report that the new policy has not translated into a significant increase in the number of VIEW volunteers they serve.
While volunteers cannot be sanctioned and may leave VIEW within 12 months of volunteering, case managers report that clients do not want to become subject to the time limits that apply to VIEW but not to exempt recipients. In addition, par-ents may hesitate to place their child in the care of someone else while they work. Finally, exempt recipients may not be
Policy Change Affecting VIEW Volunteers
In 2004, TANF policy was modified to grant VIEW-exempt recipients who wish to volunteer for the VIEW program the flexibility to re-vert back to their previously exempt status within 12 months of volunteering.
Chapter 5: Improving the Outcomes of TANF Recipients 57
40 40

fully aware of the benefits they could gain from joining VIEW. Although eligibility workers must explain the VIEW program to all TANF applicants even if they are exempt, it is not clear that the advantages of volunteering are consistently presented to clients. Moreover, eligibility workers do not administer the VIEW program and, as a result, may not be best suited to ex-plain its benefits.
Potential Options to Improve Accountability and Responsibility of TANF Recipients While it is not possible to compel temporarily exempt TANF recipients to enter the VIEW program, steps could be taken to accelerate their entry. Specifically, the duration of exemptions provided to mothers of young children could be shortened, and the benefits of volunteering for the program could be pro-moted. While these changes in policy would lead to better short-term financial outcomes for these families, allowing mothers to stay home with a young child may have positive, al-though not easily quantifiable, effects on family well-being, and both factors should therefore be considered.
Reducing the Duration of Exemptions for Caring for In-fants. Addressing the duration of exemptions granted to women who are pregnant or caring for young children would result in engaging the largest portion of temporarily exempt TANF recipients in the VIEW program. This step would also target the population that is most ready to transition into the workforce because the conditions that trigger these two ex-emptions do not physically prevent clients from working. In comparison, most expectant mothers in the workforce do not receive time off from their employer, and are given only six weeks of paid maternity leave. Recipients whose pregnancy renders them medically unable to work or who must tend to special circumstances surrounding their infant can remain ex-empt from work requirements through existing program provi-sions. However, even if they are expected to work and partici-pate in the VIEW program beyond the first trimester of their pregnancy, their participation will again be interrupted once their child is born, under current policy. This may minimize the benefits of increasing participation by pregnant women in the VIEW program. Therefore, the following recommendation only addresses reducing the duration of exemptions for mothers of young children.
Recommendation 1. The General Assembly may wish to consider amending §63.2-609 of the Code of Virginia to ex-empt from TANF work requirements parents or caretakers who personally care for a child under 12 months of age in-stead of 18 months.
Chapter 5: Improving the Outcomes of TANF Recipients 58

Promoting Benefits of Volunteering for VIEW. Additional steps could be taken to promote volunteering to participate in the VIEW program as an alternative or in combination with shorter exemptions. Individuals in all of the exempt catego-ries, not just those pregnant or caring for an infant, could be encouraged to volunteer. The following measures could be taken to encourage more volunteers:
• Exploring additional policy changes that could address clients’ reticence to enter the program;
• Providing eligibility workers with targeted training on the positive aspects of volunteering for VIEW, and on identifying clients for whom volunteering is a good choice;
• Creating and consistently distributing materials that clearly explain the benefits of the VIEW program; and
• Referring all temporarily exempt TANF applicants to a brief program overview conducted by VIEW case man-agers.
Fiscal Impact of Expediting Participation in VIEW. Expedit-ing the transition of more recipients into the VIEW program would most likely not result in additional costs to the State. While the cost of providing child care to younger children may be higher in some localities, these incremental costs should be offset because recipients who engage in VIEW sooner will also receive cash assistance for a shorter period as a result of VIEW time limits. For example, a mother who becomes sub-ject to VIEW requirements when her child turns 12 months rather than 18 months would face time limits, and as a result stop receiving benefit payments six months earlier than if she had remained exempt. For reference, the average monthly benefit payment in 2005 ranges from $292 to $389 for a family of three (depending upon the locality’s cost of living classifica-tion), of which the State assumes roughly 36 percent.
With respect to administrative costs, expediting some recipi-ents’ entry into VIEW might increase these expenditures in the short term, but should be cost-neutral over the long term since the provision of services and case management is simply be-ing accelerated. However, changing the duration of exemp-tions or increasing the number of VIEW volunteers could cre-ate a surge in the number of VIEW cases handled by local department staff. To mitigate the impact of an influx of new cli-ents, it may be prudent to phase-in the implementation of any policy changes over time so that only a portion of the exempt caseload becomes subject to new policies at one time.
Chapter 5: Improving the Outcomes of TANF Recipients 59
THE IMPORTANCE OF ASSESSING AND ADDRESSING BARRIERS TO EMPLOYMENT IS RECOGNIZED, BUT EMPHASIS MAY BE TOO SHORT-TERM
While the VIEW program is designed to assess and address barriers that are prevalent in TANF recipients, the structure of the program does not currently facilitate the complete identifi-cation or resolution of such barriers. Barriers that are not ade-quately identified or addressed will continue to affect clients’ ability to advance closer to self-sufficiency. Specifically, the rigor applied to the assessment process appears to vary across local departments and could result in unidentified barri-ers. Moreover, the upfront emphasis placed on treating and removing major barriers appears to waver once clients be-come employed, even though these barriers can compromise longer-term job retention.
Comprehensive Barrier Assessment Helps With Identifying Barriers to Employment Case managers play an integral role in helping to identify the barriers that may impede their clients’ entry into the workforce. Because some barriers can be difficult to identify in interviews, however, formal screening tools can enhance workers’ ability to recognize “red flags” and make proper referrals. However, local departments do not appear to be consistently using for-mal tools despite the urging of the Virginia State Department of Social Services (DSS).
Assessment Tools Are Available to Identify Most Barriers. Recognizing the impact that the presence of barriers can have on the ability of clients to find and keep a job, the VIEW pro-gram is structured to assess the presence of major barriers to employment and provide services that can mitigate their effect. Upon first entering the VIEW program, all clients are assessed using standardized tools that evaluate their occupational skills and functional literacy. In addition, the Virginia DSS recently revised VIEW policy to require a formal screening for learning disabilities, mental health disorders, and substance abuse, which some localities are currently conducting.
By performing a universal assessment in the initial stages of a client’s case, there is an opportunity for case managers to identify and help arrange services to address barriers that can impede the job search process. After identifying barriers, VIEW case managers may refer clients to community provid-ers for formal evaluations and treatment. For example, an evaluation for mental health disorders could be conducted by clinicians at the local community services board (CSB). This process ensures that specialists confirm the presence of barri-ers and establish the proper course of treatment.
Chapter 5: Improving the Outcomes of TANF Recipients 60

In November 2004, the State DSS provided local departments with a screen-ing toolkit that could be used to formally evaluate the presence of barriers, yet this tool is widely un-known or unused in local departments.
Assessment Process Is Not Consistently Effective. Al-though an initial assessment is performed for each VIEW cli-ent, the depth of this evaluation may not be sufficient to iden-tify the full array, or the intensity, of barriers faced by clients. Social services staff indicated that many clients are reluctant to disclose issues such as substance abuse, mental health, or domestic violence. Thus, these barriers may remain hidden until the client feels comfortable discussing them with the case manager, a process that may take time. Even though these pervasive barriers may not be apparent through initial surface-level interviews and assessment techniques, they may ad-versely impact clients’ ability to retain stable employment.
In November 2004, the Virginia DSS provided local depart-ments with a screening toolkit that could be used to formally evaluate the presence of barriers that traditionally remain “hid-den” during informal interviews. Yet, site visits to 15 local de-partments of social services suggest that not all departments are using these (or other) formal tools, and instead continue to rely on interviews to identify the presence of learning disabili-ties, mental health, and substance abuse issues. While skilled and experienced case managers may successfully identify the presence of these sensitive barriers, an informal process may not effectively and consistently identify them.
Potential Option to Enhance the Effectiveness of the Bar-rier Assessment Process. Because Virginia’s social services system is locally administered, the State DSS is limited in its ability to compel local departments to adopt formal screening tools even though they could lead to better client outcomes. The State is already monitoring the adoption of the new toolkit by asking each local department to specify the screening tools they use in their annual VIEW plan. In addition, the Virginia DSS could consider reporting these results in its monthly VIEW performance report.
Access to Services Helps to Address Barriers, but a Short-Term Focus May Limit Clients’ Success
For barrier assessments to be useful, they must result in the identification and receipt of services that can control or remove each barrier. While service plans are created, they can only be enforced in the early stages of clients’ participation in VIEW and become optional upon job placement, whether or not the barrier has been fully overcome. In addition, it appears that policy provisions intended to provide clients who struggle with severe barriers with additional time to receive needed services are not consistently applied and may fail to fully benefit the in-tended population.
Chapter 5: Improving the Outcomes of TANF Recipients 61

The Activity and Service Plan helps clients identify what may be impeding their success and articu-lates actions they should take to overcome their bar-riers to self-sufficiency.
Clients are not required to finish the Activity and Ser-vice Plan once full-time employment is obtained, yet any remaining barrier may reduce clients' ability to succeed in the work-place.
Service Plans Create a Path for the Removal of Barriers. Upon completion of VIEW participants’ barrier assessment, case managers and clients create an Activity and Service Plan that outlines the services and treatments that participants must receive to address their barriers. Based on interviews with case managers, the Activity and Service Plan appears to be a useful tool that can help clients identify what may be impeding their success and articulates actions they should take to over-come their barriers and begin advancing toward self-sufficiency. The plan can be updated periodically to reflect changes in participants’ situations, and participants can be sanctioned if they do not engage in the services listed in their plan.
Clients Often Secure Jobs But Do Not Complete Service Plans. Unless they are fully addressed, barriers to self-sufficiency will continue to affect clients’ ability to keep a job and advance in their career after they have secured initial em-ployment. Although clients may agree to complete the terms of their service plan, case managers lack the ability to enforce compliance with the plans once clients obtain a full-time job. Therefore, clients may not always receive the full range of ser-vices available to help them overcome their barriers after they secure a job, even though the barriers are often still present.
Case managers indicate that most clients can get a job even when they face severe barriers to self-sufficiency. However, these barriers tend to later manifest themselves in the work-place, limiting clients’ ability to retain employment and ulti-mately advance beyond low-paying entry-level positions. For example, individuals who suffer from mental health conditions such as depression may successfully complete a job interview and secure employment, but may be unreliable due to their condition and, as a result, be unable to retain their job. This trend can be related to many barriers and is evidenced by most clients’ poor work history and inability to advance beyond the poverty threshold. Also, because case managers meet with their clients less frequently once they become employed, they often lack the ability to identify problems that arise in the workplace and arrange for services before clients lose their job.
While some barriers can be remedied before clients exhaust the 90-day period before which they must be employed, many barriers such as learning disabilities or substance abuse re-quire long-term treatment before they can be controlled or overcome. The long-term nature of many barriers, coupled with their negative effects on job retention and wage ad-vancement, suggest that the focus on alleviating or removing barriers should remain throughout clients’ involvement with the VIEW program, even after they have obtained a job.
Chapter 5: Improving the Outcomes of TANF Recipients 62

A great deal of variation exists in how local de-partments interpret the use of the inactive status.
Inactive Status Can Be an Effective Tool, but the Variation in Local Interpretation Mitigates Its Effectiveness. While most clients can enter the workforce even if they need ongoing services, some VIEW participants face barriers so severe that job placement is not a suitable or realistic short-term goal. For example, case managers cited instances in which clients have failed to read above a sixth-grade level or struggled with debili-tating mental health disorders. For these participants, a 90-day time frame in which to find employment may not be suffi-cient to promote a successful transition into the workplace. In response, the VIEW program contains a provision whereby clients can be placed in an “inactive” status that temporarily shields them from VIEW requirements and sanctions so that they have more time to address severe barriers.
Although all local departments are aware of this provision and use it periodically, there appears to be a great deal of variation in how it is applied in each locality. Some local departments use the inactive status as a tool to help their clients complete necessary assessments and treatment before they start work-ing. While the inactive status is intended to be a short-term assignment, case managers have the flexibility to re-assign a client in 30-day increments, which could extend the 90-day time frame otherwise available to find employment. In con-trast, other local departments use the inactive status as a last resort, or use the provision primarily when services or as-sessments are temporarily unavailable.
Potential Options to More Effectively Remove Barriers to Self-Sufficiency. Although current policy helps clients set goals for removing barriers and provides case managers with flexibility to customize participants’ approach when they face severe issues, both policy and the approach of local depart-ments generally reflects a short-term focus. In order to fully provide clients with the opportunity to achieve self-sufficiency, access to services should be enhanced through greater ac-countability and more consistent policy interpretation of the in-active status.
To foster better long-term outcomes, it may be necessary for the VIEW program to elevate the importance of completing cli-ents’ Activity and Service Plans to the level of participating in work activities. One method might be to allow case managers to impose sanctions for failure to comply with the activities listed in clients’ service plans. This change in practice would need to be accompanied by a shift in message that job reten-tion, along with job placement, should be a goal for all clients.
In addition, the Virginia DSS should better educate and inform local departments on the proper uses of the inactive status policy and the flexibility it allows. Many case managers inter-
Chapter 5: Improving the Outcomes of TANF Recipients 63

viewed by JLARC staff indicated that they lacked a mecha-nism through which they could provide some clients with extra time to address serious issues. They did not appear to know that the inactive status exception would provide such a mecha-nism.
Logistical Barriers Are Addressed in the VIEW Program, but Sustained Access to Supportive Services May Be Needed to Facilitate Long-Term Client Success
Although logistical barriers appear to be effectively eliminated while families are in the VIEW program, former participants can struggle with the cost of child care. However, this re-source is critical to parents’ ability to maintain employment. To make the transition off cash assistance more sustainable, steps could be taken to facilitate access to child care until families can afford this service independently.
Provision of Transitional Support Services Addresses Lo-gistical Barriers. In addition to receiving child care and transportation services while participating in the VIEW pro-gram, clients receive an extension of these and Medicaid benefits for the first 12 months after they leave VIEW. Former participants may be unable to purchase these expensive ser-vices immediately after leaving the program, because they typically enter the workforce in low-wage jobs that seldom pro-vide benefits. The social services system has recognized the challenges associated with entering the workforce and pro-vides these additional resources to ease the transition.
Former VIEW Recipients Who Lose Child Care Subsidies Are Less Likely to Improve Their Financial Independence. Because the income of most former VIEW participants does not rise above the poverty line after 12 months, many families continue to struggle to afford child care well after they no longer have access to transitional benefits. While these fami-lies can apply for subsidized child care after the transition pe-riod, many localities have waiting lists. In addition, subsidized child care requires that families pay for a substantial portion of the cost of care, whereas families participating in VIEW re-ceive this service free of charge. Families who receive the child care subsidy must contribute ten percent of their gross income toward the cost of care, and they must also pay the dif-ference between the maximum rate reimbursed by DSS and the actual fee charged by the provider. This difference can be
Only 23 percent of former substantial, particularly in localities with a high cost of living. VIEW participants who re-ceived child care assis- As a result, only 23 percent of former VIEW participants who tance at the start of the received child care assistance at the start of the period studied period studied received received a child care subsidy at the end of the period. While child care subsidy at the some of these families may have been able to use child care end of the period. arrangements with less expensive informal providers, such as
Chapter 5: Improving the Outcomes of TANF Recipients 64

a family member, and some older children may no longer re-quire child care, it appears that no longer receiving a subsidy is negatively associated with families’ financial outcomes. As illustrated in Figure 28, families that retained the child care subsidy at the end of the period studied were more likely to work and, as a result, to have become more financially inde-pendent than families who no longer received the subsidy.
Figure 28 Comparison of Outcomes Between Families Who Continued to Receive and Those Who Ceased to Receive a Child Care Subsidy as of September 2004 Source: JLARC analysis of data from federal and State agencies.
Proportion Employed Proportion More Financially IndependentProportion Employed Proportion More Financially Independent
89%89%8989 82%%% 82%72%72%
63%636363%%%
ReRececeiviivinngg ChChiilldd NNoo LLongongerer RReecceeiivviningg ReRececeiivviningg ChChilildd NNoo LLongeonger Rr Reecceeiviviningg CareCare SuSubbssididiesies ChChiilldd CaCarree SSuubbssiiddieiess CaCarere SSuubbssiiddieiess ChChildild CCaarere SubsSubsiiddiesies
(N = 90(N = 90)) (N(N = 23= 235)5) (N = 90(N = 90)) ((NN = 235= 235))
Potential Options to Further Alleviate Logistical Barriers. While eliminating child care subsidy waiting lists for Virginia low-income families would require a large infusion of State funds, some targeted steps could be taken to ease the transi-tion of former VIEW participants off of cash assistance. Spe-cifically, the transition period could be extended beyond the current 12 months.
To achieve this outcome, the State could increase its contribu-tion toward child care funding and earmark the increase for former VIEW participants. Based on the experience of former VIEW participants studied by JLARC staff for this report, ex-tending transitional child care to families who leave VIEW in 2005 would cost the State approximately $600,000 per month.
VIEW Program Helps Clients Obtain Employment, but Assistance with Securing Quality Jobs and Career Advancement Is Limited
Although the social services system has effectively assisted VIEW participants with securing employment, many clients remain underemployed and earn less than they need to care for their families. Moreover, job quality appears to receive only limited attention. Because program participants tend to lack marketable skills, knowledge of the job market is particularly important for case managers. While Virginia’s system of work-force centers (hereafter referred to as the “Virginia Workforce
Chapter 5: Improving the Outcomes of TANF Recipients 65
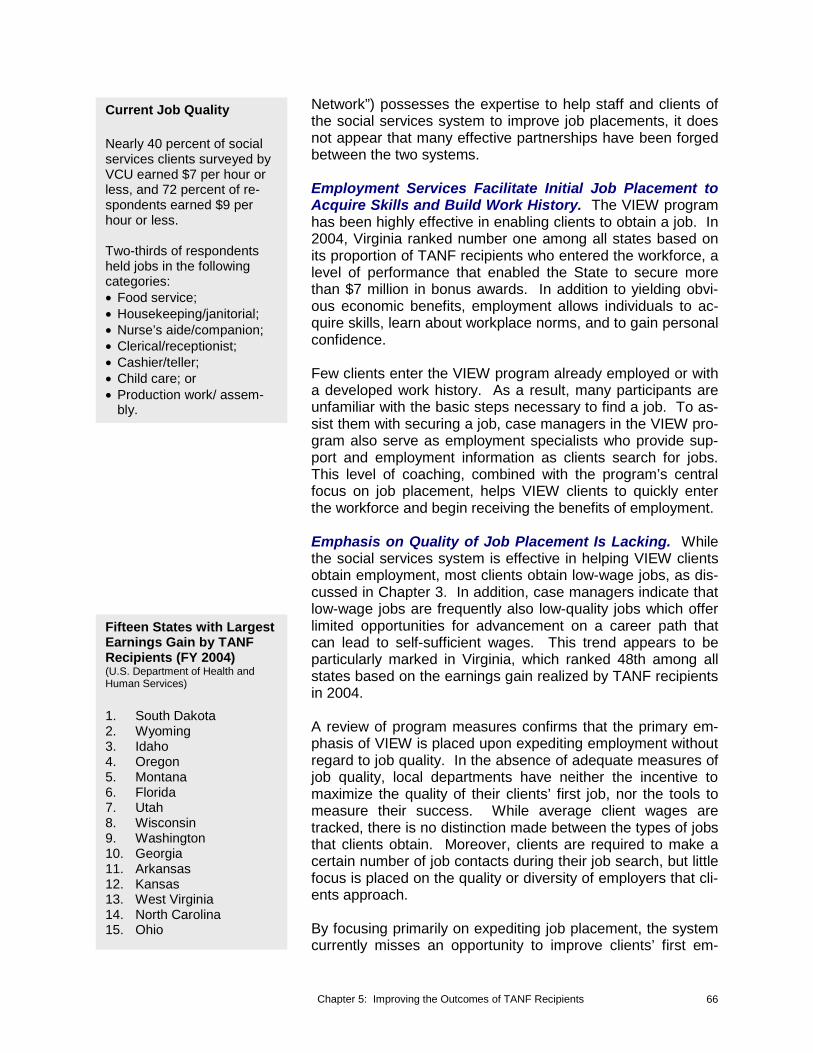
Current Job Quality
Nearly 40 percent of social services clients surveyed by VCU earned $7 per hour or less, and 72 percent of re-spondents earned $9 per hour or less.
Two-thirds of respondents held jobs in the following categories: • Food service; • Housekeeping/janitorial; • Nurse’s aide/companion; • Clerical/receptionist; • Cashier/teller; • Child care; or • Production work/ assem-
bly.
Fifteen States with Largest Earnings Gain by TANF Recipients (FY 2004)(U.S. Department of Health and Human Services)
1. South Dakota 2. Wyoming 3. Idaho 4. Oregon 5. Montana 6. Florida 7. Utah 8. Wisconsin 9. Washington 10. Georgia 11. Arkansas 12. Kansas 13. West Virginia 14. North Carolina 15. Ohio
Network”) possesses the expertise to help staff and clients of the social services system to improve job placements, it does not appear that many effective partnerships have been forged between the two systems.
Employment Services Facilitate Initial Job Placement to Acquire Skills and Build Work History. The VIEW program has been highly effective in enabling clients to obtain a job. In 2004, Virginia ranked number one among all states based on its proportion of TANF recipients who entered the workforce, a level of performance that enabled the State to secure more than $7 million in bonus awards. In addition to yielding obvi-ous economic benefits, employment allows individuals to ac-quire skills, learn about workplace norms, and to gain personal confidence.
Few clients enter the VIEW program already employed or with a developed work history. As a result, many participants are unfamiliar with the basic steps necessary to find a job. To as-sist them with securing a job, case managers in the VIEW pro-gram also serve as employment specialists who provide sup-port and employment information as clients search for jobs. This level of coaching, combined with the program’s central focus on job placement, helps VIEW clients to quickly enter the workforce and begin receiving the benefits of employment.
Emphasis on Quality of Job Placement Is Lacking. While the social services system is effective in helping VIEW clients obtain employment, most clients obtain low-wage jobs, as dis-cussed in Chapter 3. In addition, case managers indicate that low-wage jobs are frequently also low-quality jobs which offer limited opportunities for advancement on a career path that can lead to self-sufficient wages. This trend appears to be particularly marked in Virginia, which ranked 48th among all states based on the earnings gain realized by TANF recipients in 2004.
A review of program measures confirms that the primary em-phasis of VIEW is placed upon expediting employment without regard to job quality. In the absence of adequate measures of job quality, local departments have neither the incentive to maximize the quality of their clients’ first job, nor the tools to measure their success. While average client wages are tracked, there is no distinction made between the types of jobs that clients obtain. Moreover, clients are required to make a certain number of job contacts during their job search, but little focus is placed on the quality or diversity of employers that cli-ents approach.
By focusing primarily on expediting job placement, the system currently misses an opportunity to improve clients’ first em-
Chapter 5: Improving the Outcomes of TANF Recipients 66
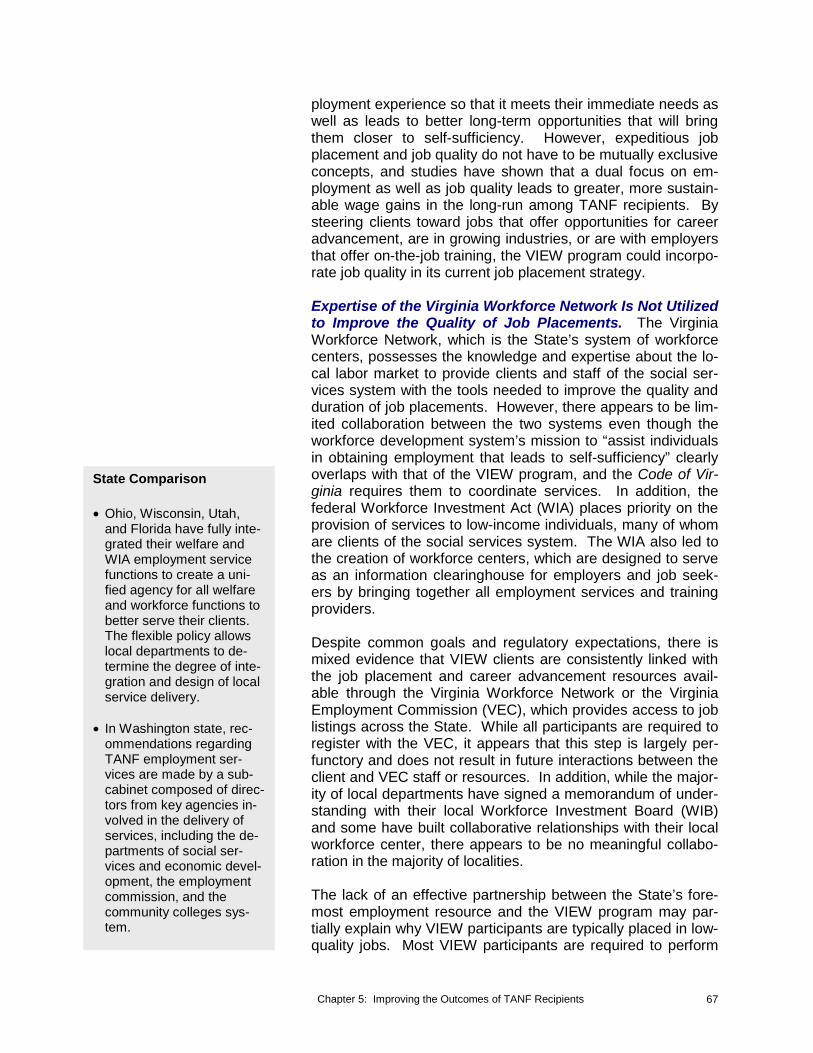
State Comparison
• Ohio, Wisconsin, Utah, and Florida have fully inte-grated their welfare and WIA employment service functions to create a uni-fied agency for all welfare and workforce functions to better serve their clients. The flexible policy allows local departments to de-termine the degree of inte-gration and design of local service delivery.
• In Washington state, rec-ommendations regarding TANF employment ser-vices are made by a sub-cabinet composed of direc-tors from key agencies in-volved in the delivery of services, including the de-partments of social ser-vices and economic devel-opment, the employment commission, and the community colleges sys-tem.
ployment experience so that it meets their immediate needs as well as leads to better long-term opportunities that will bring them closer to self-sufficiency. However, expeditious job placement and job quality do not have to be mutually exclusive concepts, and studies have shown that a dual focus on em-ployment as well as job quality leads to greater, more sustain-able wage gains in the long-run among TANF recipients. By steering clients toward jobs that offer opportunities for career advancement, are in growing industries, or are with employers that offer on-the-job training, the VIEW program could incorpo-rate job quality in its current job placement strategy.
Expertise of the Virginia Workforce Network Is Not Utilized to Improve the Quality of Job Placements. The Virginia Workforce Network, which is the State’s system of workforce centers, possesses the knowledge and expertise about the lo-cal labor market to provide clients and staff of the social ser-vices system with the tools needed to improve the quality and duration of job placements. However, there appears to be lim-ited collaboration between the two systems even though the workforce development system’s mission to “assist individuals in obtaining employment that leads to self-sufficiency” clearly overlaps with that of the VIEW program, and the Code of Vir-ginia requires them to coordinate services. In addition, the federal Workforce Investment Act (WIA) places priority on the provision of services to low-income individuals, many of whom are clients of the social services system. The WIA also led to the creation of workforce centers, which are designed to serve as an information clearinghouse for employers and job seek-ers by bringing together all employment services and training providers.
Despite common goals and regulatory expectations, there is mixed evidence that VIEW clients are consistently linked with the job placement and career advancement resources avail-able through the Virginia Workforce Network or the Virginia Employment Commission (VEC), which provides access to job listings across the State. While all participants are required to register with the VEC, it appears that this step is largely per-functory and does not result in future interactions between the client and VEC staff or resources. In addition, while the major-ity of local departments have signed a memorandum of under-standing with their local Workforce Investment Board (WIB) and some have built collaborative relationships with their local workforce center, there appears to be no meaningful collabo-ration in the majority of localities.
The lack of an effective partnership between the State’s fore-most employment resource and the VIEW program may par-tially explain why VIEW participants are typically placed in low-quality jobs. Most VIEW participants are required to perform
Chapter 5: Improving the Outcomes of TANF Recipients 67

an independent job search with up to 40 employers, but the ef-fectiveness of this process may be limited by clients’ lack of awareness about good job opportunities. In contrast, work-force centers are staffed with trained professionals who pos-sess extensive knowledge of the local labor market and could advise VIEW participants about the best career opportunities.
Clients who are engaged in the Virginia Workforce Network while they participate in the VIEW program may also be more likely to return to workforce centers after they have transi-tioned off public assistance. Unlike their VIEW case manag-ers, workforce centers will continue to be available as a source of employment information for former TANF recipients as they continue to advance toward self-sufficiency.
The lack of adequate collaboration between these two sys-tems appears to stem from several causes. Foremost is the lack of communication and understanding about the roles and responsibilities that each agency currently assumes and, more importantly, has the potential to assume in order to better serve clients. Staff from both agencies appear unaware or un-convinced of how their responsibilities currently overlap and, consequently, how to best coordinate efforts in order to streamline services to clients and ensure that the agency best equipped to meet clients’ needs is carrying out this responsibil-ity.
There also appear to be disagreements between local social service departments and workforce centers about the cause of the lack of collaboration. Local departments of social services consistently assert that workforce development centers do not want to help their social services clients because they are typi-cally unskilled and more difficult to serve. The workforce cen-ters, according to social services staff, are concerned that the challenge in helping this population could negatively affect achievement of their performance measures. In contrast, staff at workforce centers adamantly deny this claim and counter that departments of social services fail to refer their clients to the centers.
Potential Options to Improve Work Experience. Improving the quality of VIEW participants’ work experience could lead to an increase in the number of families who achieve self-sufficiency. To increase the quality of VIEW participants’ em-ployment opportunities, two primary steps could be taken:
• Broaden the focus of the VIEW program to emphasize both expeditious job placement and job quality; and
• Leverage workforce centers and the VEC to access complete labor market information.
Chapter 5: Improving the Outcomes of TANF Recipients 68

State Comparison
A Portland, Oregon, program focusing on job quality was identified as the most suc-cessful welfare-to-work initia-tive based on a national evaluation of 11 different strategies. After two years, program participants earned higher hourly wages, and were more likely to work in full-time jobs offering health benefits. These results are attributed to the program's emphasis on encouraging clients to be selective about jobs, and to target full-time employment paying above the minimum wage and offer-ing opportunities for career advancement.
The current employment focus of the VIEW program must first be shifted to encompass job quality. In addition, this shift should be reflected in program policies and practices that sup-port and promote job quality, and effectively communicated to local staff responsible for its implementation.
Recommendation 2. The Secretary of Health and Human Resources and the Virginia Department of Social Services should adopt a dual employment focus for the VIEW pro-gram, emphasizing both expeditious job placement and job quality in order to ensure that more participants secure jobs that offer higher wages, opportunities for advancement with an employer, or access to viable career paths. The Secre-tary and Department should consider how the VIEW program could be restructured to increase the proportion of partici-pants who are able to obtain such higher quality jobs.
In addition, the concerns that appear to have prevented pro-ductive partnerships between the social services system and the Virginia Workforce Network should be addressed. While the nature and complexity of VIEW case managers’ role sug-gest that primary responsibility for the program’s administra-tion should remain within the social services system, the effec-tiveness of the program could be enhanced by collaborating with labor market experts. Specifically, VIEW participants could access existing employment and career advancement information available in workforce centers, and use this knowl-edge to make better job decisions. VIEW participants would generally not require intensive staff time or training from work-force centers, because these services are already provided through the VIEW program. In addition, staff of the Virginia Workforce Network could share their knowledge of the labor market with VIEW case managers on a more consistent basis. Increased collaboration would utilize an infrastructure that al-ready exists, and should therefore have limited impact on workforce centers’ resources and not create additional de-mands on the Virginia Workforce Network that would exceed its capacity.
Because every local department operates differently, no single approach, such as co-location of staff or contracting of certain employment activities, will result in enhanced collaboration across the entire State. However, a logical starting point might be to measure the number of clients served by both systems to pinpoint the areas where collaboration does not appear to occur.
Chapter 5: Improving the Outcomes of TANF Recipients 69
Recommendation 3. The Secretaries of Health and Human Resources and Commerce and Trade should consider what factors have limited effective collaboration between the social services system and the Virginia Workforce Network, and what measures can be taken to develop an effective partner-ship in order to provide more VIEW participants with existing information about job opportunities and career development.
Education and Training Are Available, but Access Appears to Be Limited According to numerous studies of the labor market, training and education are integrally linked to wages. However, most clients of the social services system lack either credentials or certifications, and as described in Chapter 3, employment alone has not enabled them to move beyond poverty or reach self-sufficiency. Without acquiring marketable skills, VIEW participants are unlikely to advance into the types of positions that pay a self-sufficient wage.
VIEW Policy Offers Access to Education and Training Op-portunities to Some Participants. VIEW participants can be offered the opportunity to combine work with training and edu-cation if these options enhance their ability to become self-sufficient and they have been unable to secure full-time em-ployment. VIEW policy allows participants to work as little as eight hours per week and supplement their part-time jobs with training or education activities. These activities can include basic adult education, occupational training, and even post-secondary degrees as long as they lead to employment and can be completed within two years.
Virginia Statute Prioritizes Full-Time Employment. Virginia law requires that VIEW participants take part in a work activity and that the highest priority should be on placing them in a full-time job. Part-time employment, which would allow partici-pants to spend some portion of their 30 hour participation re-quirement in training or education, is considered to be an op-tion for most VIEW participants only if full-time employment, either subsidized or unsubsidized, is not available.
Participation in Education and Training Activities Is Mini-mal. As a result of this emphasis on full-time employment, only three percent of VIEW participants were engaged in any education or training activity in 2004. Many other states pro-vide more flexibility for TANF recipients to engage in education and training. This difference in approach is evidenced by the disparity in the proportion of TANF recipients who participate in training and education nationally compared to Virginia. As Figure 29 demonstrates, participation in most training or edu-
Chapter 5: Improving the Outcomes of TANF Recipients 70
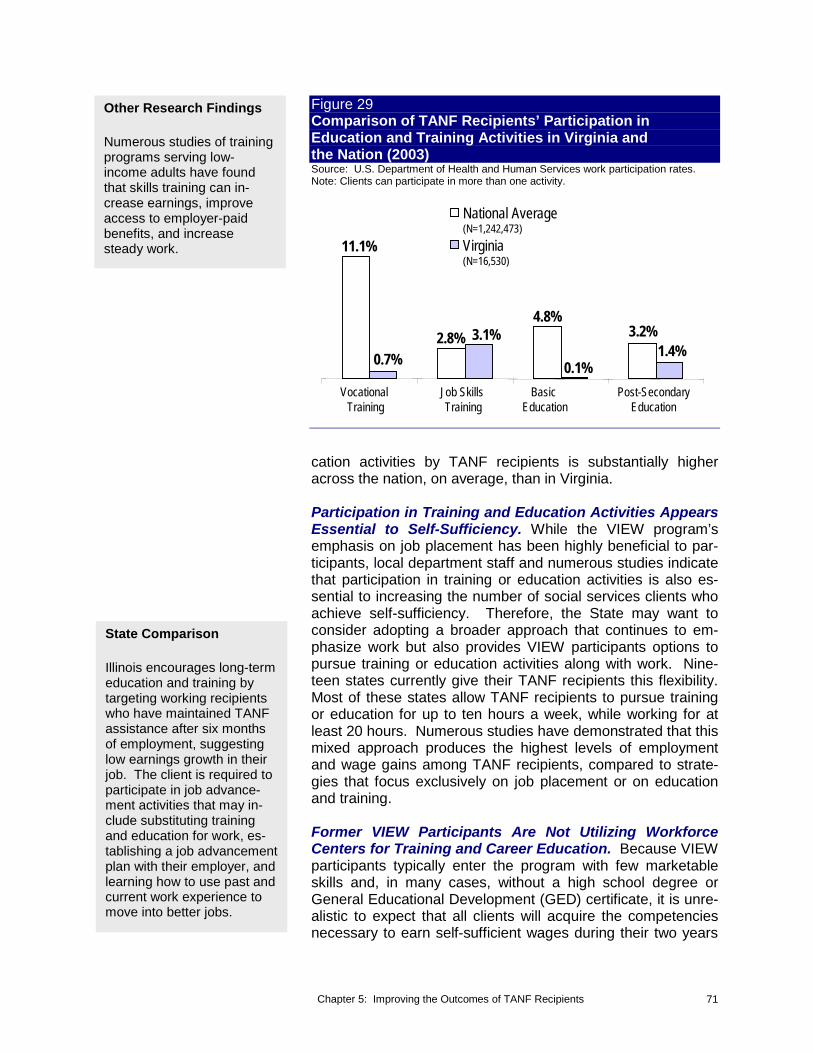
Other Research Findings
Numerous studies of training programs serving low-income adults have found that skills training can in-crease earnings, improve access to employer-paid benefits, and increase steady work.
Figure 29 Comparison of TANF Recipients’ Participation in Education and Training Activities in Virginia and the Nation (2003)Source: U.S. Department of Health and Human Services work participation rates. Note: Clients can participate in more than one activity.
National Average (N=1,242,473)
Virginia11.1% (N=16,530)
4.8% 3.2% 2.8% 3.1%
1.4% 0.7% 0.1%
Vocational Job Skills Basic Post-SecondaryTraining Training Education Education
cation activities by TANF recipients is substantially higher across the nation, on average, than in Virginia.
Participation in Training and Education Activities Appears Essential to Self-Sufficiency. While the VIEW program’s emphasis on job placement has been highly beneficial to par-ticipants, local department staff and numerous studies indicate that participation in training or education activities is also es-sential to increasing the number of social services clients who achieve self-sufficiency. Therefore, the State may want to consider adopting a broader approach that continues to em-phasize work but also provides VIEW participants options to pursue training or education activities along with work. Nine-teen states currently give their TANF recipients this flexibility. Most of these states allow TANF recipients to pursue training or education for up to ten hours a week, while working for at least 20 hours. Numerous studies have demonstrated that this mixed approach produces the highest levels of employment and wage gains among TANF recipients, compared to strate-gies that focus exclusively on job placement or on education and training.
Former VIEW Participants Are Not Utilizing Workforce Centers for Training and Career Education. Because VIEW participants typically enter the program with few marketable skills and, in many cases, without a high school degree or General Educational Development (GED) certificate, it is unre-alistic to expect that all clients will acquire the competencies necessary to earn self-sufficient wages during their two years
State Comparison
Illinois encourages long-term education and training by targeting working recipients who have maintained TANF assistance after six months of employment, suggesting low earnings growth in their job. The client is required to participate in job advance-ment activities that may in-clude substituting training and education for work, es-tablishing a job advancement plan with their employer, and learning how to use past and current work experience to move into better jobs.
Chapter 5: Improving the Outcomes of TANF Recipients 71

Only six percent of the VIEW participants studied by JLARC staff received intensive services, and four percent participated in skills training funded by the WIA.
in the program, especially given the program’s current empha-sis on full-time employment. However, clients who leave the program do not have a long-term education and training plan that positions them to move toward self-sufficiency, and are of-ten not aware of how to access the training and education re-sources available to achieve this goal.
In addition to providing labor market information and employ-ment services, workforce centers also serve as a clearing-house for training and education. Despite the resources and expertise that workforce centers can provide for education and training pursuits, few individuals appear to be taking advan-tage of this resource after they leave the VIEW program. Only six percent of the former VIEW participants studied by JLARC staff received intensive services, and only four percent partici-pated in skills training funded by the WIA. Because it is clear that many current and former VIEW participants could benefit from both intensive case management and training offered by workforce centers, these results suggest a substantial un-tapped opportunity for clients to upgrade their skills and con-tinue to advance toward self-sufficiency.
There is no systematically collected data that explain why cli-ents of the social services system seldom take advantage of WIA programs. However, staff of the social services system and workforce centers advance several hypotheses. First, cli-ents may not be fully aware of the array of services they can receive at workforce centers. This could occur because VIEW participants tend to receive a lot of their information related to work and training from their case manager, who as mentioned in the previous section, often reported not fully understanding the role of workforce centers themselves. In addition, not all areas have access to short-term training programs that could make it easier for clients to balance work, family, and course-work. Moreover, certain localities reported having limited ac-cess to training in certain popular occupations. Distance may also preclude clients from using workforce centers. A substan-tial number of clients have difficulty finding transportation, and it may take more than an hour to access a workforce center from some of the more remote Virginia localities.
Potential Options to Realize Benefits of Training and Edu-cation. Because of the critical role that training or education can play in helping families to advance closer to self-sufficiency, a pilot project providing VIEW participants and case managers with the flexibility to combine work with training and education should be established so that the State can as-sess:
Chapter 5: Improving the Outcomes of TANF Recipients 72

• The extent to which combining training and educa-tion enables families to better meet their needs without the aid of government assistance;
• The proportion of VIEW participants who would par-ticipate in training and education activities, and the accompanying costs; and
• Which specific practices yield the most successful results.
Recommendation 4. The General Assembly may wish to consider establishing a pilot project in which the statutory re-quirement placing priority on obtaining full-time employment would be waived, and VIEW participants would be allowed the flexibility to divide their 30-hour participation requirement between work and up to ten hours of training or education.
In addition, case managers in local departments could better inform VIEW clients about services available through work-force centers. Increased communication and collaboration be-tween local departments and workforce centers could provide case managers with the knowledge required to educate their clients about service availability. Moreover, VIEW participants may benefit from creating a long-term education and training plan with their case manager. Several local departments al-ready offer this tool to their clients, often provided during their job readiness course. This plan could serve to educate clients about the steps they must take to achieve self-sufficiency, and also act as a guide after they have left the program.
Recommendation 5. The Virginia Department of Social Services should (1) encourage local departments to raise awareness of workforce center services among VIEW par-ticipants; and (2) require the development of a long-term education and training plan for all VIEW participants.
To help clients, and in particular single parents, access skills training needed to improve their opportunities for career ad-vancement, short-term training courses that meet local labor demand could be created. Several local departments, often with the help of their local community college, have already undertaken this effort. North Carolina’s training program, “Quick Jobs with a Future,” which offers training in high-demand professions within 90 days, may serve as a useful model for Virginia.
Chapter 5: Improving the Outcomes of TANF Recipients 73
Recommendation 6. The Secretaries of Health and Human Resources, Commerce and Trade, and Education should consider measures the State can take to increase short-term training programs through workforce centers or other entities that would be available to current and former clients of the social services system to enhance their skills and provide them with a greater opportunity to obtain quality jobs.
Chapter 5: Improving the Outcomes of TANF Recipients 74

Cha
pter 66 SSeellff--SSuuffffiicciieennccyy EEffffoorrttss
BBeeyyoonndd TTAANNFFIn
Sum
mar
y...
The principles behind welfare reform have not been applied to other, larger benefit programs such as Food Stamps for which the social services system’s focus remains largely administrative. Conse-quently, the system’s operations are not geared toward providing the majority of their clients with the services and incentives that could facilitate their progress toward self-sufficiency. Yet, it appears that many low-income families are unable to achieve financial independ-ence on their own and may, therefore, turn to cash assistance when they experience setbacks. For Virginia’s low-income families to real-ize the promise of self-sufficiency through work and to avoid needing cash assistance, a substantial investment in services that facilitate job retention and career advancement would be necessary.
The notion of shared accountability that transformed the provi-sion of cash assistance has not been applied to welfare pro-grams that provide other benefits such as Food Stamps or Medicaid. As a result, most of the participants in these pro-grams are not subject to the requirements or expectations ap-plied to Temporary Assistance for Needy Families (TANF) re-cipients. However, they also do not receive any of the services or incentives that could improve their financial inde-pendence. The results presented in Chapter 3 indicate that clients who do not receive cash assistance are also experienc-ing long-term difficulties that preclude them from advancing into jobs that pay self-sufficient wages, suggesting a need for services to address their barriers to self-sufficiency. While this group is composed of some low-income families who have never received cash assistance, it also includes many former Virginia Initiative for Employment not Welfare (VIEW) partici-pants who have not attained self-sufficiency and continue to rely on various forms of government assistance.
PRIORITIES AND RESOURCES WOULD NEED TO BE SHIFTED TO ESTABLISH SELF-SUFFICIENCY AS A GOAL FOR MORE CLIENTS OF THE SOCIAL SERVICES SYSTEM
Because the goal of benefit programs other than TANF is not to help families achieve self-sufficiency but rather to act as a
Chapter 6: Self-Sufficiency Efforts Beyond TANF 75
safety net that supplements low-income families’ resources, a fundamental question is whether the State should avail low-income families of the services they need to become more fi-nancially independent. One argument in favor of providing such services is that, as described in Chapter 3, most families receiving government assistance appear unable to attain fi-nancial independence on their own.
However, unlike for TANF recipients, there is limited infrastruc-ture within the social services system that can be built upon to assist other benefit recipients, and a considerable shift in pri-orities and resources would need to occur for the social ser-vices system to foster the goal of self-sufficiency for more of its clients. Following the principles that guided welfare reform, this shift would entail promoting personal accountability com-bined with the provision of services aimed to alleviate barriers to employment and promote job retention and career ad-vancement.
PERSONAL ACCOUNTABILITY IS NOT EMPHASIZED AND COULD CONFLICT WITH THE GOALS OF BENEFIT PROGRAMS OTHER THAN TANF
While promoting accountability is a key component of welfare reform and appears to be associated with gains in financial in-dependence, imposing requirements upon recipients of other benefit programs may not be a viable option because it would conflict with these programs’ fundamental priorities. The benefits provided through programs such as Food Stamps, Medicaid, or Family Access to Medical Insurance Security (FAMIS) can have a substantial impact upon families’ well-being and quality of life. As a result, efforts have centered around expanding participation in these programs rather than limiting access by imposing any requirements. However, some requirements could enhance these families’ economic outcomes, as evidenced by the fact that benefit recipients who do not receive cash assistance are less likely than their TANF counterparts to work and to collect child support, two important components for achieving self-sufficiency.
Many Benefit Recipients Are Not Expected to Work, and the State Has Limited Ability to Impose Requirements
While some able-bodied recipients of government assistance are subject to work requirements, most are not. Due to con-cerns that previous welfare programs fostered government dependency by failing to impose requirements upon partici-pants, the TANF program requires its recipients to work in ex-change for benefits. In addition, parents who receive a child care subsidy must also work to be eligible for assistance, and Food Stamp recipients who do not have children must work in order to receive benefits for more than six months. However,
Chapter 6: Self-Sufficiency Efforts Beyond TANF 76
Thirty-seven percent of Food Stamp recipients ex-empt from work require-ments were unemployed at any point during the two-year period studied.
most Food Stamp recipients and none of the participants in the Energy Assistance, Medicaid, and FAMIS programs are re-quired to work.
A widespread perception among Virginia State Department of Social Services (DSS) staff is that work requirements are un-necessary for Food Stamp recipients because most of them are already employed. According to local department staff, those who are not working are either temporarily between jobs or are childless and, consequently, face a six-month time limit in the program. However, based on the sample of families studied by JLARC staff, 37 percent of non-disabled, non-elderly Food Stamp recipients exempt from work requirements were unemployed at any point during the two-year period stud-ied. Moreover, unemployed Food Stamp recipients remained jobless for more than a year, on average, indicating chronic rather than temporary unemployment. These results suggest that a combination of work requirements and employment ser-vices could help a number of families return to the workplace faster.
Although Virginia could choose to provide Food Stamp recipi-ents with broader access to employment services (discussed later in this chapter), two factors limit the State’s ability to im-pose accompanying work requirements. First, the federal government has not provided states with the flexibility required to deviate from national requirements, and only action by Con-gress could address this issue. Second, even if states were awarded this level of flexibility, imposing additional work re-quirements could conflict with the goal of maximizing participa-tion in the program. If work requirements deter needy families from applying for Food Stamp benefits, the program’s current intent of promoting access to proper nutrition could be com-promised.
Imposing work requirements upon participants in the Energy Assistance, Medicaid, or FAMIS programs would be neither sensible nor aligned with widely accepted State priorities. Ac-cording to local department staff, Energy Assistance recipients tend to be elderly or disabled, and consequently not generally expected to work. Moreover, Energy Assistance benefits tend to be small compared to other programs, and the cost of ad-ministering additional requirements could outweigh any bene-fits. Because able-bodied adults who receive Medicaid typi-cally also receive TANF and are subject to VIEW requirements, additional work standards would be redundant. Finally, the State has made a commitment to providing low-income children with access to health care through Medicaid and FAMIS, which could be undermined if work requirements were imposed upon parents. Consequently, policy decisions seem to have placed more emphasis on providing a safety net
Chapter 6: Self-Sufficiency Efforts Beyond TANF 77
than on enhancing accountability, at least with respect to medical care for children.
Cooperation with the Virginia Division of Child Support Enforcement Could Be Extended to Food Stamp, Child Care, FAMIS, and Most Medicaid Recipients
The increase in the num-ber of families collecting child support payments was significantly greater for TANF recipients than for Food Stamp recipients.
State Comparison
• As of 2004, 12 states required Child Care Subsidy recipients to co-operate with their child support enforcement di-visions.
• Six of the 21 states con-tacted by JLARC staff currently require coop-eration with child support enforcement as a condi-tion of eligibility for Food Stamp benefits.
From a financial standpoint, the receipt of child support pay-ments can play an important role in advancing families closer to self-sufficiency, as described in Chapter 3. Moreover, the increase in the number of families collecting child support payments was significantly greater for TANF recipients than for Food Stamp recipients, suggesting that requiring clients to cooperate with the Division of Child Support Enforcement (DCSE) effectively increases accountability among non-custodial parents. Consequently, extending such require-ments to participants in other benefit programs could further increase the number of families who collect child support pay-ments owed to them, and as a result, help them to become more financially independent.
Cooperation with DCSE could be imposed as a requirement for participation in the Food Stamp and Child Care Subsidy programs, which currently have no links to DCSE. Unlike with work requirements, the State has the ability to make Food Stamp and Child Care Subsidy benefits contingent upon co-operation with DCSE. If mandatory cooperation with DCSE is extended to other benefit recipients, so should the safeguards that have been built into the TANF program to protect the vic-tims of domestic violence. Parents who fear that contacting the absent parent could endanger their family should not have to establish paternity. Establishing mandatory cooperation re-quirements for children enrolled in Medicaid or FAMIS is not a viable option because children cannot be denied health care coverage if their parents do not cooperate with DCSE.
Implementing mandatory cooperation with DCSE would in-crease some families’ economic well-being and could result in some savings for the State and local governments. Families who collect child support payments receive an average of $3,000 per year. Moreover, the State could realize savings in instances when the collection of child support payments raises a family’s income above some benefit programs’ eligibility thresholds. Along with realizing benefits, additional adminis-trative and staffing costs would be incurred by DCSE to admin-ister a higher caseload. Currently, DCSE spends approxi-mately $213 per case each year to establish paternity and subsequently collect payments. Because the federal govern-ment funds two-thirds of child support enforcement activities, the State’s share is only $72 per case annually.
Chapter 6: Self-Sufficiency Efforts Beyond TANF 78
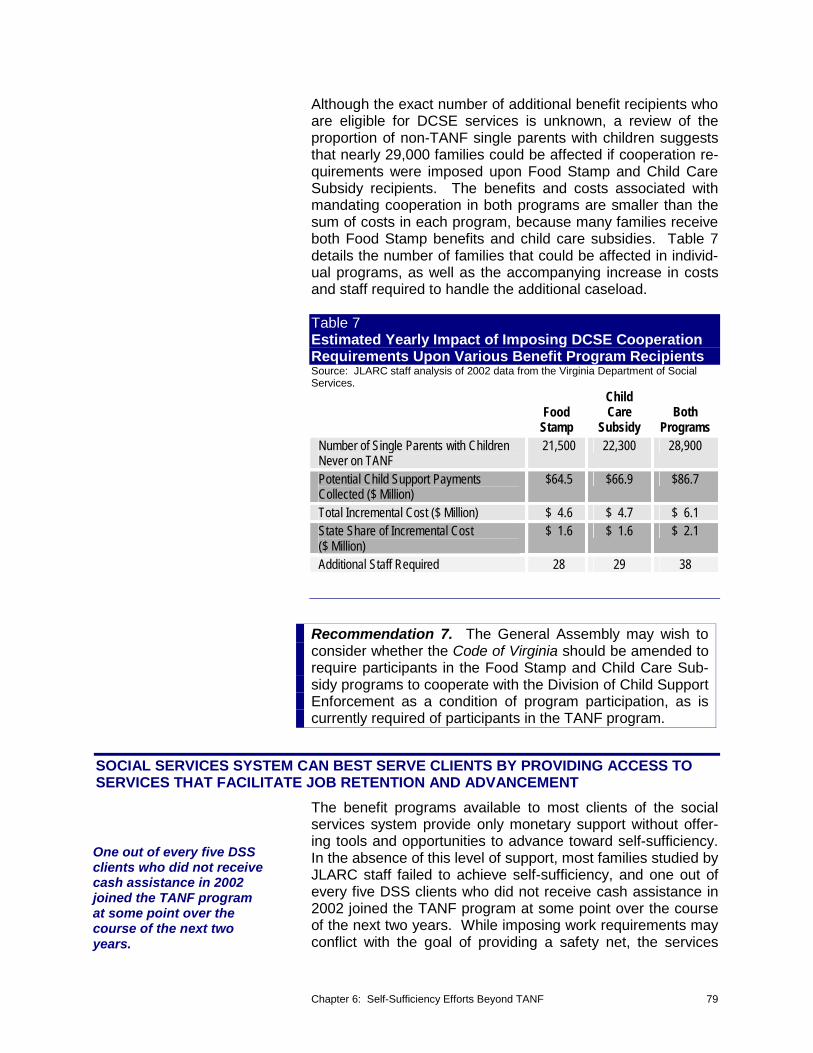
Although the exact number of additional benefit recipients who are eligible for DCSE services is unknown, a review of the proportion of non-TANF single parents with children suggests that nearly 29,000 families could be affected if cooperation re-quirements were imposed upon Food Stamp and Child Care Subsidy recipients. The benefits and costs associated with mandating cooperation in both programs are smaller than the sum of costs in each program, because many families receive both Food Stamp benefits and child care subsidies. Table 7 details the number of families that could be affected in individ-ual programs, as well as the accompanying increase in costs and staff required to handle the additional caseload.
Table 7 Estimated Yearly Impact of Imposing DCSE Cooperation Requirements Upon Various Benefit Program RecipientsSource: JLARC staff analysis of 2002 data from the Virginia Department of Social Services.
Child Food Care Both
Stamp Subsidy Programs Number of Single Parents with Children Never on TANF
21,500 22,300 28,900
Potential Child Support Payments Collected ($ Million)
$64.5 $66.9 $86.7
Total Incremental Cost ($ Million) $ 4.6 $ 4.7 $ 6.1 State Share of Incremental Cost ($ Million)
$ 1.6 $ 1.6 $ 2.1
Additional Staff Required 28 29 38
Recommendation 7. The General Assembly may wish to consider whether the Code of Virginia should be amended to require participants in the Food Stamp and Child Care Sub-sidy programs to cooperate with the Division of Child Support Enforcement as a condition of program participation, as is currently required of participants in the TANF program.
SOCIAL SERVICES SYSTEM CAN BEST SERVE CLIENTS BY PROVIDING ACCESS TO SERVICES THAT FACILITATE JOB RETENTION AND ADVANCEMENT
The benefit programs available to most clients of the social services system provide only monetary support without offer-ing tools and opportunities to advance toward self-sufficiency.
One out of every five DSS In the absence of this level of support, most families studied by clients who did not receive JLARC staff failed to achieve self-sufficiency, and one out of cash assistance in 2002 joined the TANF program every five DSS clients who did not receive cash assistance in at some point over the 2002 joined the TANF program at some point over the course course of the next two of the next two years. While imposing work requirements may years. conflict with the goal of providing a safety net, the services
Chapter 6: Self-Sufficiency Efforts Beyond TANF 79

provided could almost certainly be of use. As described in Chapter 3, a modest number of low-income families have been able to attain self-sufficiency on their own while most remain in low-wage jobs that do not offer the upward mobility necessary to earn self-sufficient wages. Frequently, these recipients are unable to obtain better jobs because they face barriers that have not been addressed, ranging from mental health issues to a lack of occupational skills or education.
Although low-income clients may not require the extent of re-sources VIEW clients need in order to obtain initial employ-ment, the social services system may be able to help them rise above low-wage jobs by addressing those barriers that threaten job stability and advancement. However, there is a substantial drop in the availability of services to identify and address barriers for clients who do not participate in the VIEW program (Table 8). Moreover, there appear to be limited at-tempts to link clients with other agencies that provide services currently unavailable within the social services system.
In the absence of reform efforts that focus on low-income fami-lies, the social services system remains unable to provide the scope and intensity of services required to make self-sufficiency a tenable goal for all their clients. Moreover, broadening access to critical services could remove the incen-tives that currently exist for clients to apply for TANF in order to receive assistance with child care or medical insurance. Al-though this effort would require a large investment from the State and localities which would be only partially tempered by savings resulting from lower enrollment in benefit programs, linking clients of the social services system with needed ser-vices could substantially improve low-income families’ eco-nomic outcomes.
Table 8 Availability of Services Across Benefit Programs Source: JLARC staff analysis.
Services Provided to Energy Child Care Medicaid / Address Barriers: VIEW Food Stamp Assistance Subsidy FAMIS Barrier Assessment Service Referrals Employment Services Training and Education Child Care Physical and Mental Health
Guaranteed Availability Limited Availability Not Available
Chapter 6: Self-Sufficiency Efforts Beyond TANF 80

Non TANF TANF)
Assessing and Addressing Barriers Could Help Clients to Overcome the Cause of Their Reliance on Government Assistance
Although clients throughout the social services system tend to face similar barriers, only the VIEW program formally as-sesses the presence of barriers and makes referrals based on the assessment. As a result, many low-income families may be unaware of the issues that preclude them from advancing toward self-sufficiency or may lack the guidance necessary to remove these hurdles, thereby perpetuating their reliance on government assistance.
Social Services Clients Face Similar Barriers Across Benefit Programs. According to case managers, the preva-lence of barriers to self-sufficiency is largely consistent across the recipients of different types of government assistance. This belief is supported by results from the Virginia Common-wealth University (VCU) survey of 500 DSS clients which found that the proportion of clients who face at least one bar-rier is comparable between those who receive cash assistance through TANF and those who do not (Figure 30). Seventy per-cent of clients surveyed reported being faced by at least one barrier, and half of these respondents indicated that the barrier was a major problem which impacted their ability to work or keep their job.
These similarities can be explained in part by the fact that many of the former TANF recipients who have transitioned off of cash assistance are still receiving other types of benefits. Consequently, each program may serve the same people, but at different stages in their lives.
Figure 30 Differences in Prevalence of Barriers Between TANF and Non-TANF RecipientsSource: JLARC staff analysis of Virginia Commonwealth University survey results.
--Non TANF TANF / VIEW/ VIEW(N=219) (N=282(N=219) (N=282)
31% 30%31% 30%
21% 18%
27% 28% 26%
20%21%18%
27% 28% 26%
20%
No Barriers 1 Barrier 2-3 Barriers 4 or More BarriersNo Barriers 1 Barrier 2-3 Barriers 4 or More Barriers(N=143) (N=123) (N=139) (N=96)(N=143) (N=123) (N=139) (N=96)
Chapter 6: Self-Sufficiency Efforts Beyond TANF 81

Families who do not re-ceive cash assistance have limited access to case workers who can help them to identify and re-solve the issues that may have led to their reliance on government assistance.
The services referred to clients not receiving cash assistance by eligibility workers or screeners may alleviate immediate hard-ships, but they do not ad-dress deeper issues that affect families’ ability to improve their financial in-dependence.
The Social Services System Is Not Designed To Assess and Address Barriers for Most of Its Clients. Although so-cial services staff emphasized that intensive case manage-ment is integral to helping clients achieve self-sufficiency, families who do not receive cash assistance have limited ac-cess to case workers who can help them to identify and re-solve the issues that may have led to their reliance on gov-ernment assistance. No nationwide movement similar to welfare reform has identified a need to remove barriers to self-sufficiency for low-income families who receive non-cash as-sistance such as Food Stamp benefits. As a result, the role of social services staff with respect to non-cash recipients is fo-cused on determining their eligibility for participation in the various programs. Eligibility workers act primarily in an admin-istrative role and are neither required, nor expected, to as-sume more responsibility in their interactions with clients.
While some local departments may attempt to link clients to services when they see a need, this function is purely volun-tary and, consequently, largely up to the case manager’s dis-cretion and workload. To help clients access services while al-lowing eligibility workers to focus on their primary role, some local departments make use of screeners. Screeners are typi-cally social workers who are responsible for identifying preva-lent client barriers or needs, and for making appropriate refer-rals. Whether made by eligibility workers or screeners, it appears that most service referrals are made for emergency assistance such as for heating and cooling. While these ser-vices alleviate immediate hardships, they do not address deeper issues that affect families’ ability to improve their finan-cial independence.
In addition, clients are not required to meet with their eligibility worker regularly. For example, barring any major life changes such as marriage, Food Stamp clients are only required to contact their eligibility workers on an annual basis to confirm their continued eligibility, and Medicaid recipients can simply mail in their information. As a result, non-TANF benefit recipi-ents are typically not able to build an ongoing relationship with their eligibility worker.
Without the ongoing support of a case manager, low-income clients may not have access to a professional who can identify undiagnosed barriers or promptly intervene when barriers sur-face and threaten their ability to keep a job. Moreover, State-provided services are not centralized within a single system, and may be difficult to access by individuals who are unfamil-iar with all Virginia agencies. The majority of non-TANF clients are employed, indicating that those who face hurdles to self-
Chapter 6: Self-Sufficiency Efforts Beyond TANF 82

While the social services system may lack the re-sources to undertake these efforts alone, the implementation of any of these options could be greatly enhanced through collaboration with other agencies and community providers.
sufficiency are capable of suppressing or managing the effect of these barriers enough to obtain employment. Yet, as indi-cated by the fact that a quarter of clients begin relying on cash assistance over the course of a two-year period, these barriers may limit the ability of clients to retain their jobs and advance their careers.
Potential Options to Address and Remove Barriers to Self-Sufficiency for Low-Income Families. A variety of steps could be taken to enhance the role that the social services system currently plays with respect to removing barriers to self-sufficiency for its non-TANF clients. The spectrum of op-tions, in order from lowest to highest amount of resources needed for implementation, includes:
• Consistently providing clients with contact information for local service providers. The Virginia Information and Referral (I&R) system could be used to obtain up-to-date information at no cost;
• Creating targeted information toolkits containing de-scriptive information and brochures about the services provided by community partners;
• Using screeners to identify major barriers and make service referrals;
• Conducting initial assessments during eligibility deter-mination and using results to make specific referrals to community partners;
• Helping clients schedule and access services; and • Following up on effectiveness of services.
While the social services system may lack the resources to undertake these efforts alone, the implementation of any of these options could be greatly enhanced through collaboration with other agencies and community providers. In particular, collaboration could be helpful for raising clients’ awareness of the availability and location of services. Some local depart-ments have successfully forged partnerships that have allowed them to link more clients with the services they need. For ex-ample, some local departments have established designated points of contact in other local agencies with whom case man-agers can discuss next steps or make referrals. Finally, many local departments appear to have staff of different agencies co-located at the local departments of social services. These shared resources could also be leveraged to work with non-TANF clients who could benefit from their services. Collabora-tion strategies that have been employed by local departments are discussed in greater detail in Chapter 8.
Even with the help of partners, conducting assessments and following up with clients would be very time-intensive and likely could not be performed with existing resources and would ne-
Chapter 6: Self-Sufficiency Efforts Beyond TANF 83

cessitate additional staff. Whether performed by a screener or eligibility worker, conducting barrier assessments can take up to two hours, according to VIEW case managers, which is considerably more time than eligibility workers currently spend with each client. However, by using some creative practices implemented in the VIEW program, the following steps could be taken to stretch current resources and funding levels:
• Conduct group assessments; and • Partner with non-profit organizations to conduct barri-
ers assessments, design service plans, and follow up with clients.
To streamline its process and accommodate its large caseload, the city of Norfolk conducts the initial assessment of its VIEW clients in a group. Common information is shared with the group verbally and with pre-recorded video materials, and one-on-one screenings are reserved to identify more sen-sitive issues such as domestic violence or substance abuse. This approach minimizes the amount of time that workers spend with each client while conveying a large amount of in-formation.
Finally, as described further in Chapter 8, 13 local depart-ments in the southwestern region of Virginia work with a non-profit organization to provide intensive services for their VIEW clients. Not only does this structure allow the provision of more intensive services, but it is also funded through grants from private entities, and State and federal agencies. While fewer grant opportunities may be available to serve the broader low-income population, which receives less focus than TANF recipients, this is an effective approach that could mini-mize the need for government funding.
Non-TANF Clients Are Not Engaged in Job Placement and Career Advancement Initiatives That Could Help Them to Achieve Self-Sufficiency
The social services system does not systematically attempt to link the majority of its clients with services that could facilitate their transition into employment or better jobs. While limited funding and infrastructure exist to provide employment ser-vices within local departments of social services, the Virginia Workforce Network has the resources and is required by law to serve low-income clients. However, it does not appear that coordination between the two systems is taking place. More-over, workforce centers have generally failed to proactively engage social services clients who most need their services in order to achieve self-sufficiency.
Few Non-TANF Clients Receive Employment Services Through the Social Services System. The Food Stamp pro-
Chapter 6: Self-Sufficiency Efforts Beyond TANF 84

Only five percent of all Food Stamp recipients re-ceive employment services from their local department through the FSET pro-gram.
State Comparison
Washington utilizes TANF funds to help employed cur-rent and former recipients and other low-wage workers access career advancement opportunities. Programs in-clude tuition assistance for job-related vocational train-ing at State community and technical colleges; campus-based child care assistance; funding for skills-based, short-term pre-employment training for colleges that partner with employers; and grants to community colleges to design training programs with more flexible schedules and shorter course offerings.
gram is the only one outside of TANF to include an employ-ment services component. However, State and local depart-ment staff indicate that the program’s intensity, and as a result, its effectiveness is very limited due to low funding levels. On average, the amount of funds allocated per Food Stamp Em-ployment and Training (FSET) participant is $162 per year, compared to $3,200 per VIEW participant (including child care). In addition, while VIEW case managers are typically re-sponsible for managing 50 cases, FSET workers report han-dling 400 cases and, consequently, are unable to provide their clients with the help and resources available to VIEW partici-pants. Finally, FSET currently provides less access to suppor-tive services such as child care, transportation, and education and training than is available in VIEW. In 2004, FSET used only $47,000 in child care funding to serve nearly 15,000 par-ticipants.
In addition, the FSET program serves only a small proportion of Food Stamp recipients. Although nearly 40 percent of Food Stamp recipients who do not receive TANF benefits are un-employed at any given time, only five percent of all Food Stamp recipients receive employment services from their local department through the FSET program. Any Food Stamp re-cipient can volunteer to participate in FSET, but few choose to do so. In addition, because the program receives limited fund-ing, services are prioritized for Food Stamp recipients who face time limits, namely childless adults who are unemployed. Moreover, the program is currently operated by only 24 local departments across the State. Even for these recipients, the program’s scope is limited and does not provide the intensity of services available to VIEW participants.
Social Services System Does Not Provide Access to Funding for Education and Training Opportunities. Al-though social services staff stressed that education and train-ing are integral to achieving job advancement, these activities currently are not emphasized for low-income clients in the so-cial services system. Funding for education or training is not made readily available because these services are not linked to the goals of programs other than TANF. Furthermore, de-spite the fact that these clients are employed in low-wage jobs that prompt their need for government assistance, it appears that they are provided little guidance regarding how to better their employment situation during their interactions with social services. Therefore, if low-income clients are to obtain further education or training, they typically must take the initiative to seek and pursue such opportunities on their own; however, these clients may be unaware of the funding resources avail-able to them.
Chapter 6: Self-Sufficiency Efforts Beyond TANF 85
Only four percent of the 14,500 families studied in this report received inten-sive case management or training services at a work-force center.
Half of any additional FSET state expenditures would be matched by federal funds.
Workforce Centers Have Played a Limited Role in Helping Low-Income Families to Improve Their Job Opportunities. The lack of emphasis by the social services system on job ad-vancement for low-income clients is further exacerbated be-cause the system currently does not fully leverage the com-prehensive employment services provided by the Virginia Workforce Network. Although they are mandated partners un-der the Workforce Investment Act (WIA) with respect to the FSET program, there appears to be little substantive collabo-ration between social services and workforce centers. More-over, the social services system does not appear to consis-tently attempt to link non-FSET clients with employment resources available at workforce centers. Ultimately, this gap represents a missed opportunity by both agencies to facilitate the provision of services, such as career planning, job coach-ing, education, and training, that are needed by low-income clients to achieve career advancement.
In addition, few clients appear to seek or receive workforce center services on their own, suggesting a need for more ac-tive outreach efforts on the part of the workforce development system, which is obligated under federal and State law to serve low-income families. Of the 14,500 families whose in-come was low enough to qualify for government assistance and whose advancement toward financial independence over the course of two years was studied by JLARC staff, only four percent received intensive case management or training ser-vices at a workforce center. Although the social services sys-tem currently may not be organized or have the capability to directly provide career advancement services to unemployed and low-income clients, the Virginia Workforce Network not only has this capability, but also has expertise in the provision of employment support services as well as education and training to clients. Moreover, workforce centers offer the only significant source of case management and funding available to low-income families who wish to pursue training and educa-tion.
Potential Options for Leveraging the Food Stamp Em-ployment and Training Program. The social services sys-tem could build upon the existing FSET program to provide the level of employment, training, and education services that is currently available only to VIEW participants. To improve the effectiveness of the FSET program, an investment in staff and access to child care and purchased services would need to be made. However, the State’s portion of that investment would be matched by the federal government at a rate of 50 percent. There are currently no limits on the amount of matching funds that can be received from the federal government, and these funds can be used to serve any Food Stamp recipient. More-over, FSET can provide match funding for every non-federal
Chapter 6: Self-Sufficiency Efforts Beyond TANF 86

dollar spent on employment and training, regardless of the State agency that provides services. Finally, coordinating key activities across VIEW and FSET could create some synergies and cost savings.
Expansion of the FSET program could be considered in three parts. First, the intensity of services could be increased for the 15,400 current FSET participants who are primarily able-bodied, childless adults who reside in 27 Virginia localities. Second, access to an expanded FSET program could also be provided to the other 10,000 able-bodied, childless adults who receive Food Stamp benefits and reside in the 107 Virginia lo-calities that do not currently offer an FSET program. Because some of these participants are currently federally exempted from participating in FSET due to living in high-unemployment localities, the State would need to obtain a waiver from the federal government in order to require their participation in FSET.
Finally, FSET services could be offered to the 36,000 able-bodied Food Stamp recipients who are not required to receive employment services because they have at least one child. Although the third category of Food Stamp recipients is the largest, only individuals who choose to volunteer would enter the program, because federal law prevents states from making participation a condition for benefit eligibility. While only five percent of TANF recipients volunteer to participate in the VIEW program, case managers report that this low percentage is largely attributable to client’s resistance to becoming subject to time limits once they enter the program. Because FSET volunteers would not be subject to time limits in the receipt of Food Stamp benefits, it is likely that the proportion of Food Stamp parents who volunteer for FSET would be higher than five percent.
VIEW staffing, child care, and services expenditures appear to be a suitable proxy for estimating the investment that would be necessary to transform FSET into a more comprehensive and effective program. To contain costs, participation in the en-hanced FSET program could be limited to one year. Using VIEW annual costs as a guide suggests that an incremental investment of $1,600 would be needed to provide more inten-sive employment services for every current participant, $1,700 for each childless adult who currently receives no employment services, and $3,200 per new participant who has a child. The cost of expanding services to parents would be higher than for childless adults because they may require child care assis-tance.
The incremental cost of this program expansion, summarized in Table 9, would be driven by two primary factors:
Chapter 6: Self-Sufficiency Efforts Beyond TANF 87

Table 9 Estimated Annual Incremental Cost of Expanding the FSET Program Source: JLARC staff analysis of data from the Virginia Department of Social Services.
Total State Share of Number of Incremental Incremental
Participants Cost ($ Million) Cost ($ Million) Able-Bodied Childless Adults in Localities Currently Served 15,400 $24 $12 Able-Bodied Childless Adults in Localities Not Served 10,000 $18 $ 9 Able-Bodied Parents
• 10% Volunteer • 50% Volunteer
36,000 3,600
18,000 $12 $58
$ 6 $29
• Which of the three populations of Food Stamp recipi-ents is targeted; and
• The proportion of Food Stamp parents who would vol-unteer for FSET (if they are included).
By enabling Food Stamp recipients to increase their income, expanding the scope and intensity of services provided through FSET could result in some savings to the State and local governments. However, because Food Stamp benefits are primarily federally-funded, these savings could be limited. Each FSET participant whose income rises beyond the Food Stamp program’s income eligibility threshold (roughly $21,000 for a family of three) would lead to a reduction in the program caseload, and consequently lower administrative costs. Vir-ginia currently spends approximately $215 per year to admin-ister one Food Stamp case. These savings would recur annu-ally for each case closed, while the $1,600 to $3,200 in incremental costs for providing FSET services would be a one-time expense. Because of the sizeable investment that may be required to expand the FSET program, a pilot project could be pursued to gather information on the costs and potential benefits associated with such expansion.
Recommendation 8. The Secretary of Health and Human Resources and the Virginia Department of Social Services should develop a pilot project in which the intensity of ser-vices provided through the Food Stamp Employment and Training program would be increased to the level provided through the VIEW program, and participation would be ex-panded to all Food Stamp recipients who choose to volunteer for the program. The pilot project should include an evalua-tion component to assess program costs and effectiveness, and to provide a basis upon which to evaluate whether statewide expansion should be pursued.
Forging Stronger Partnerships with Local Workforce Cen-ters. Rather than building in-house capacity, the social ser-
Chapter 6: Self-Sufficiency Efforts Beyond TANF 88
vices system could act as a facilitator in linking its clients with local workforce centers. A proactive effort on the part of local departments seems necessary, given the low number of cli-ents who use workforce centers on their own. The social ser-vices system and the Virginia Workforce Network should col-laborate at the State and local levels to establish a process by which they can most effectively and efficiently work together to assist their clients. Some local initiatives that appear to be successful in this respect include having a local department representative on the local Workforce Investment Board (WIB), and co-locating staff in each other’s facility. However, be-cause local collaboration initiatives have been only moderately successful, it appears that additional direction from the State could be helpful.
While access to workforce centers could help a number of cli-ents advance toward self-sufficiency, this option alone is unlikely to provide access to services for all the families who need them, due to capacity constraints. Like VIEW partici-pants, other social services clients could, at a minimum, bene-fit from accessing existing information about better jobs and career options. However, a portion of the non-VIEW popula-tion would also require intensive case management and fund-ing for training or education, because those are not provided by the social services system except for VIEW participants. Workforce centers may not currently have the staffing and fi-nancial resources necessary to provide these more intensive services to a large number of new clients. The primary fund-ing source for workforce centers is provided through the WIA, and some workforce centers reported limitations in the number of additional clients they could serve without additional funds. In addition, workforce centers may not be easily accessible to all clients, particularly those in rural areas. As illustrated in Figure 31, some local departments do not have a comprehen-sive workforce center, and clients with transportation barriers may struggle to access the nearest facility. While there are approximately 30 additional satellite workforce centers, those tend to have limited funding and staff to assist clients with the scope of services they need.
Recommendation 9. The Secretaries of Health and Human Resources and Commerce and Trade should consider what factors have limited effective collaboration between the social services system and the Virginia Workforce Network, and what measures can be taken to develop an effective partner-ship in order to provide more non-VIEW clients with (1) exist-ing information about job opportunities and career develop-ment; and (2) career guidance, and access to training or education that are not available through the social services system.
Chapter 6: Self-Sufficiency Efforts Beyond TANF 89
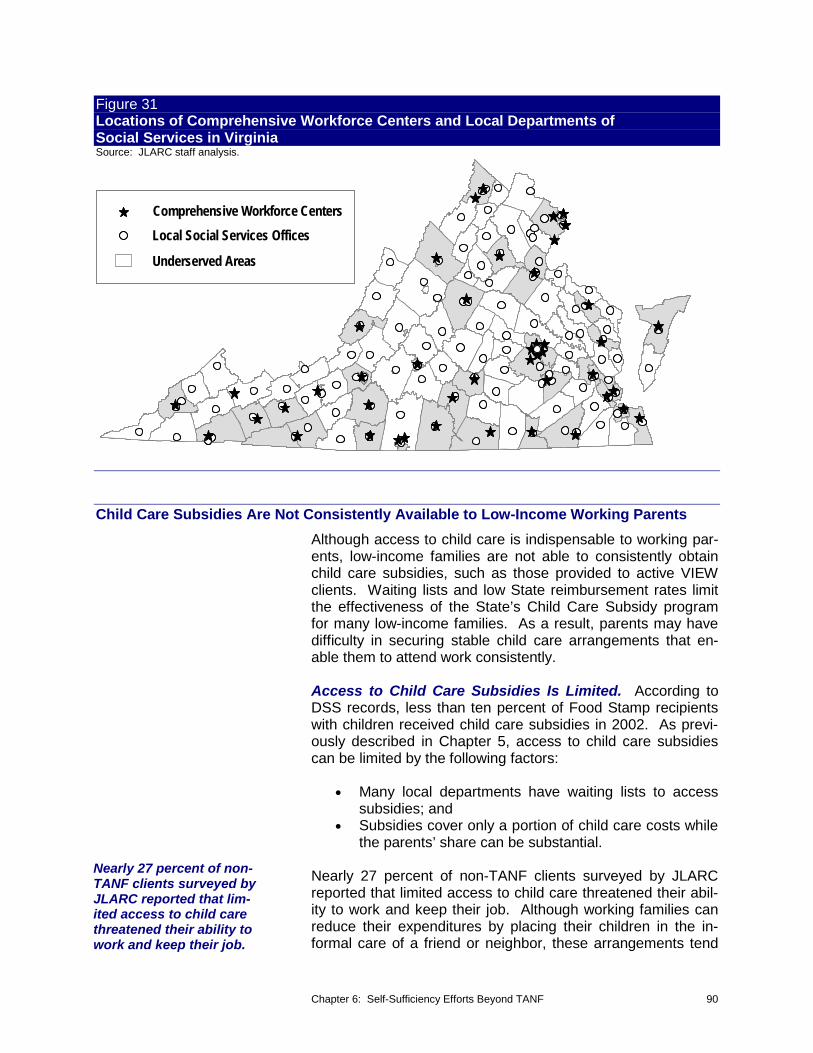
Figure 31 Locations of Comprehensive Workforce Centers and Local Departments of Social Services in Virginia Source: JLARC staff analysis. Comprehensive Workforce Centers Local Social Services Offices Underserved Areas
Child Care Subsidies Are Not Consistently Available to Low-Income Working Parents Although access to child care is indispensable to working par-ents, low-income families are not able to consistently obtain child care subsidies, such as those provided to active VIEW clients. Waiting lists and low State reimbursement rates limit the effectiveness of the State’s Child Care Subsidy program for many low-income families. As a result, parents may have difficulty in securing stable child care arrangements that en-able them to attend work consistently. Access to Child Care Subsidies Is Limited. According to DSS records, less than ten percent of Food Stamp recipients with children received child care subsidies in 2002. As previ-ously described in Chapter 5, access to child care subsidies can be limited by the following factors:
• Many local departments have waiting lists to access subsidies; and
• Subsidies cover only a portion of child care costs while the parents’ share can be substantial.
Nearly 27 percent of non- Nearly 27 percent of non-TANF clients surveyed by JLARC TANF clients surveyed by reported that limited access to child care threatened their abil-JLARC reported that lim-ited access to child care ity to work and keep their job. Although working families can threatened their ability to reduce their expenditures by placing their children in the in-work and keep their job. formal care of a friend or neighbor, these arrangements tend
Chapter 6: Self-Sufficiency Efforts Beyond TANF 90

to be unstable or unreliable and can cause parents to miss work.
Options to Expand Access to Subsidized Child Care for Non-TANF Clients. To improve access to subsidized child care, the overall funding for the program would need to be in-creased, or the benefit available to each recipient would need to be decreased. Either of the following two options could be pursued:
• Contribute more State and local funds; or • Impose a time limit on the receipt of subsidies.
The State DSS expects to collect all federal funds available for providing child care subsidies to Virginia’s low-income families in 2005. Consequently, the State and local governments would bear the entire cost of the amount of additional subsi-dies offered. For every one million dollars of additional fund-ing, Virginia could provide subsidies to approximately 170 more low-income families for a year, based on the average subsidy amount currently provided to working families. The State would assume 90 percent of the cost, while local gov-ernments would be required to contribute the remaining ten percent. However, if participation in the FSET program was extended to able-bodied parents who receive Food Stamp benefits, as discussed in the previous section, half of the cost of providing child care to these families could be funded by federal dollars.
An alternative to increasing overall funding would be to limit the duration of each family’s receipt of child care subsidies. Local departments currently have the flexibility to impose a lifetime limit of five years on the receipt of child care subsidies, but not all have chosen to exercise this option. Time limits could allow more families to access subsidies over the long run because the funding freed up by families who reach time limits would be used to subsidize new families. The difficulty in structuring this option lies in identifying a suitable time limit that allows working parents enough time to be in stable, higher paying jobs. For parents who do not experience a substantial increase in income, losing access to child care subsidies due to time limits could jeopardize their ability to keep working.
Access to Medical Care Low-income adults frequently have limited access to health in-surance and, consequently, medical care. Low-wage jobs sel-dom provide employer-sponsored benefits, and government insurance programs such as Medicaid are offered primarily to the elderly, the disabled, or the very poor. As a result, 48 per-cent of the non-TANF clients surveyed by JLARC reported be-
Chapter 6: Self-Sufficiency Efforts Beyond TANF 91

Forty-eight percent of the non-TANF clients surveyed by JLARC reported being uninsured, compared to 41 percent of TANF recipi-ents.
ing uninsured, compared to 41 percent of TANF recipients. Yet, non-TANF recipients were more likely to suffer from a physical or mental health condition, and 30 percent of respon-dents indicated that these conditions affected their ability to find and maintain employment.
While broad-based Medicaid expansions fall outside the scope of this study, some targeted efforts could be made to increase the number of eligible adults who are not currently enrolled in Medicaid. Staff at local departments of social services and community services boards (CSB) indicate that co-locating a benefit program eligibility worker at the CSB could facilitate the process of applying for Medicaid and increase enrollment, be-cause having to travel to multiple locations could be a deter-rent for individuals who struggle with mental health issues or face transportation barriers. This option would benefit only in-dividuals who are already eligible for Medicaid, which is a small group relative to the entire population of uninsured low-income adults.
STATE COULD FACILITATE LOCAL OPERATIONS THAT SUPPORT SELF-SUFFICIENCY Most of the work required to help clients achieve self-sufficiency is conducted at the local level, but the State DSS could do more to support local efforts. To date, the State DSS has made only limited attempts to partner with local depart-ments to support the implementation of new initiatives.
State Department of Social Services Could Assist Local Departments The State DSS could help local departments to secure addi-tional funding, forge partnerships, and learn about effective practices. This additional support could facilitate the local im-plementation of initiatives that foster self-sufficiency for all cli-ents.
Site visits to local departments across the State revealed that Several practices have en- several practices have enabled some local departments to of-abled some local depart- fer their clients a wider array of services. Several local de-ments to offer their clients a wider array of services. partments reported using grant funding, community partners,
and best practices shared by other local departments to ex-pand their capacity. However, some smaller departments in-dicated that these initiatives required a staffing level that was not available in their locality. Moreover, the efficiency of these initiatives could be improved if a regional or statewide ap-proach orchestrated by DSS were taken. To achieve this out-come, additional presence of State DSS staff in regional of-fices would be necessary.
Chapter 6: Self-Sufficiency Efforts Beyond TANF 92

For example, a level of expertise is required to apply for and administer grants because each funding agency imposes dif-ferent requirements and expectations. A regional approach to grant writing could be more effective, less duplicative, and also provide smaller local departments with the opportunity to com-pete for grant funding.
A similar concept may apply to facilitating partnerships across agencies. Unlike local departments of social services, many agencies, such as workforce centers and CSBs, serve multiple localities. Consequently, these agencies can be approached by multiple local departments to establish relationships that vary in scope and expectations. Facilitating the formation of collaborative relationships at the regional level could be more efficient and yield more consistent results.
Finally, most local departments appear to rely on various pro-fessional organizations to learn about best practices used in other departments, although best practices sharing is not a consistent focus. Consequently, the State DSS could play a greater, more focused role in disseminating best practices across departments.
State Department of Social Services Could Facilitate the Development and Tracking of Additional Metrics Related to Participant Outcomes
Except for VIEW, the performance of benefit programs is evaluated based on process effectiveness such as timeliness of benefit payment or accuracy of application processing. While such measures are important standards by which to pro-mote service practices, they do not reflect, nor necessarily ad-vance, the goal of self-sufficiency. Because VIEW participants represent only a small portion of the clients who receive gov-ernment assistance, the social services system has little knowledge about its impact on most clients’ well-being. If the
State Comparison State chooses to advance self-sufficiency as a goal for all cli-ents of the social services system, some outcome measures
Oregon developed a broad should be tracked across benefit programs. Efforts to monitor three-tiered assessment clients’ wages and job retention, among other indicators of method that utilizes 14 pro-gram performance measures self-sufficiency, could create incentives, standards, or conse-for partner agencies and quences within the social services system to promote and fa-workforce center programs. cilitate the implementation of practices that more directly foster
clients’ ability to become more financially independent.
Chapter 6: Self-Sufficiency Efforts Beyond TANF 93

Chapter 6: Self-Sufficiency Efforts Beyond TANF 94

Cha
pter 77 TTaaxx CCrreeddiitt OOppppoorrttuunniittiieess
In S
umm
ary.
.. Tax credits administered by the federal and State government provide a substantial additional benefit for low-income families and can reduce their reliance on government assistance. However, while the majority of families who receive financial assistance from programs administered by the social services system appear to be eligible for several types of federal and State tax credits, many do not claim them. To increase the proportion of eligible families who receive credits, the State should focus its efforts to increase awareness and participation in these tax credit programs. Access to these credits could enhance many families’ eco-nomic well-being, increase their financial independence, and help them advance toward self-sufficiency. Finally, increasing the number of Vir-ginians who receive federal tax credits would infuse a substantial amount of additional federal dollars into the State’s economy.
Tax credits can substantially increase the resources of eligible, low-income families without increasing their reliance on benefit programs. In particular, the Earned Income Tax Credit (EITC), because of its magnitude and refundable nature, may play an important role in supplementing the income of many low-income families and lifting more families over the federal pov-erty line (FPL). Because tax credits could have a large impact on families’ ability to achieve self-sufficiency, this chapter ex-amines the credits available to eligible low-income families in Virginia, the limited participation in these programs despite their potential benefit to clients of the social services system, and the actions the State could take to foster greater participa-tion in these programs.
OVERVIEW OF AVAILABLE TAX CREDITS Tax credits range widely in magnitude, from $300 per individ-ual through the Virginia Credit for Low-Income Individuals to $4,300 per family with the federal EITC. Only the EITC is a re-
Families eligible for the fundable tax credit, which means that even those families who EITC can receive the entire had little or no tax liability can receive the entire amount of the credit, even if they have credit. This feature is particularly important for low-income little or no tax liability. families who may have a small tax liability and, as a result,
may not be able to take full advantage of non-refundable tax credits.
Chapter 7: Tax Credit Opportunities 95

Non-refundable tax credits, such as the federal Child Tax Credit, reduce the amount of taxes that a family owes, and the size of the credit is limited by the family's tax liability.
Federal Earned Income Tax Credit. The EITC is a federal program designed to reward low-income families for working. The program, based on the notion that families who work should not be poor, has often been cited as one of the most significant anti-poverty measures in recent decades. Families who worked and earned less than $35,000 in the most recent tax year (2004) could receive between $2,600 and $4,300 based on their income, marital status, and number of children. Families can receive the EITC even if they earn too little to owe any taxes. However, they must file a federal tax return in order to claim the credit.
Federal Child Tax Credit. Families are eligible to receive a tax credit of $1,000 for each dependent child under 17. While all families with children can receive the credit, it phases out as income approaches $55,000 for single parents and $110,000 for married couples. Unlike the EITC, the child tax credit is not refundable. Non-refundable tax credits reduce the amount of taxes that a family owes, and the size of the credit is limited by the family’s tax liability. Consequently, it can be claimed only by those families with a federal tax liability.
Federal Child and Dependent Care Credit. Families who pay someone for child care in order to work may receive the federal Child and Dependent Care Tax Credit (CDCTC). To be eligible, care must be provided to a child less than 13 years of age. Depending upon their income, eligible households can receive a credit for 20 to 35 percent of qualifying expenses or up to $3,000 per claimed dependent. Only families with a tax liability can claim the CDCTC, which is not refundable.
Virginia Credit for Low-Income Individuals. Virginians whose income falls below the federal poverty line can be eligi-ble for a State program called the Credit for Low-Income Indi-viduals (CLI). Eligible filers can claim up to $300 for each adult and child reported as exemptions on their tax returns. However, the amount of the CLI cannot exceed the family’s Virginia tax liability because it is a non-refundable credit.
MANY ELIGIBLE FAMILIES DO NOT TAKE ADVANTAGE OF TAX CREDITS Unclaimed tax credits could be a large source of additional in-come for clients of the social services system. The availability of several tax credits has the potential to lift more low-income families out of poverty by providing them with additional in-come as a reward for working or as recognition for the cost of raising children. Yet, while the majority of families who receive financial assistance from programs administered by the State Department of Social Services (DSS) appear to be eligible for several types of federal and State tax credits, many of them do not claim these credits (Figure 32).
Chapter 7: Tax Credit Opportunities 96

Figure 32 Potential Tax Credit Opportunity for Families Receiving DSS Benefits (2005 EstimateSource: JLARC staff analysis of 2003 tax returns and July 2005 Virginia Department of Social Services caseload. Note: Estimates are designed to illustrate the magnitude of the opportunity that low-income families may be foregoing in Virginia.
More information would be necessary to categorically establish eligibility.
Percent ClPerc aimedent Claimed Potential OpportunityPotential Opportunity
Earned IncomeEarned Income Tax CreditTax Credit
Child CreditChild Credit
Child and DependentChild and DependentCare Tax CreditCare Tax Credit
Credit for Low-Credit for Low-Income IndividualsIncome Individuals
$170 million for 66,000 families
$41 million for 59,000 families
$21 million for 44,000 families
$3 million for 25,000 families
$170 million for 66,000 families
$41 million for 59,000 families
$21 million for 44,000 families
$3 million for 25,000 families
0% 20% 40% 60% 80% 100%0% 20% 40% 60% 80% 100%
Only 13 percent of eligible families in the JLARC sample claimed the EITC based on an analysis of their 2003 tax returns.
While tax credits could increase the resources of low-income families on a recurring annual basis, the immediate potential of unclaimed tax credits is even greater because credits can be claimed for the three years prior to the current tax year. Con-sequently, families who were eligible for the credits between 2002 and 2004 could receive a one-time retroactive payment.
Federal Earned Income Tax Credit. Although more than half of families in the JLARC sample appear to meet the primary eligibility criteria for the federal EITC, only 13 percent of them claimed this tax credit based on an analysis of their 2003 tax returns. Families in the JLARC sample who claimed the EITC received an average of $2,575 in 2003, which equals about 20 percent of their average annual income (before tax credits).
Up to 66,000 families who receive benefits from DSS may have missed the opportunity to claim the EITC, based on the proportion of eligible claimants extrapolated from the JLARC sample to the entire 2005 caseload of able-bodied DSS cli-ents. At an average of $2,575 per family, this represents a lost opportunity of up to $170 million for low-income Virginians and for the State’s economy.
Federal Child Tax Credit. While most families in the JLARC sample have at least one child, only 57 percent of families are estimated to have had a tax liability in 2003. Because tax credits, with the exception of the EITC, are not refundable, families must have a tax liability in order to claim the credit. Of
Chapter 7: Tax Credit Opportunities 97

Research Methods
The Virginia Department of Taxation matched the JLARC sample of DSS cli-ents against its tax records to determine how many fami-lies had claimed the EITC, the Child Tax Credit, the Child and Dependent Care Tax Credit, or the Virginia Credit for Low-Income Indi-viduals in 2002 and 2003. The Department of Taxation also provided the average amount claimed for each credit. Results presented in this section reflect only 2003 tax records due to their simi-larity to 2002 trends. Pri-mary indicators including income and family composi-tion were used to estimate eligibility, but more informa-tion would be required to categorically establish eligi-bility.
Nearly 60 percent of eligi-ble families claimed the Virginia Credit for Low-Income Individuals.
these eligible families, only six percent claimed the Child Tax Credit in 2003, receiving an average of $691.
Based on the number of able-bodied families in the 2005 DSS caseload, it is estimated that up to 59,000 eligible families are not claiming the child tax credit. At an average of $691 per claim, these families could be foregoing up to $41 million, and this influx of funds could also benefit the State’s economy.
Federal Child and Dependent Care Tax Credit. Approxi-mately 25 percent of the families in the JLARC sample met the eligibility criteria for the CDCTC by having a child under 13 years old as well as a tax liability in 2003. Along with meeting these eligibility criteria, families must also pay someone for child care in order to receive the credit. Of the 25 percent of families eligible to receive the credit, only one percent claimed the CDCTC, which averaged $482. While the exact proportion of families in the JLARC sample who pay for child care is not known, a 2002 DSS survey of low-income families indicates that practically all families use paid child care arrangements. This fact suggests that most of these families could, in fact, claim this credit. However, there may be cases in which par-ents who pay for child care services are unable to claim the credit. For example, parents would be unable to claim amounts paid to providers who fail to report their income.
Based on the number of able-bodied families in the 2005 DSS caseload, it is estimated that up to 44,000 families are not claiming the Child and Dependent Care Tax Credit. Assuming that all otherwise eligible families also pay for child care, this lost opportunity amounts to approximately $21 million at an average of $482 per claim.
Virginia Credit for Low-Income Individuals. Nearly 45 per-cent of families in the JLARC sample appear to have met the income eligibility thresholds for the Virginia CLI and also to have had a tax liability in 2003. In 2003, nearly 60 percent of these eligible families with a tax liability claimed the Virginia CLI, a much higher proportion than for any of the other credits discussed in this section. The CLI averaged $128 per claim-ant in 2003.
Although the majority of eligible families claimed the Virginia CLI, 40 percent of able-bodied families who receive benefits from DSS did not take advantage of this tax credit. Based on the total caseload of able-bodied families who will receive benefits from DSS in 2005, up to 25,000 families may be fore-going the opportunity to receive the CLI, amounting to a total of $3 million if the average claim remains at $128. Beginning in tax year 2006, low-income Virginians will have the option to claim the greater of the current CLI amount, or 20 percent of
Chapter 7: Tax Credit Opportunities 98
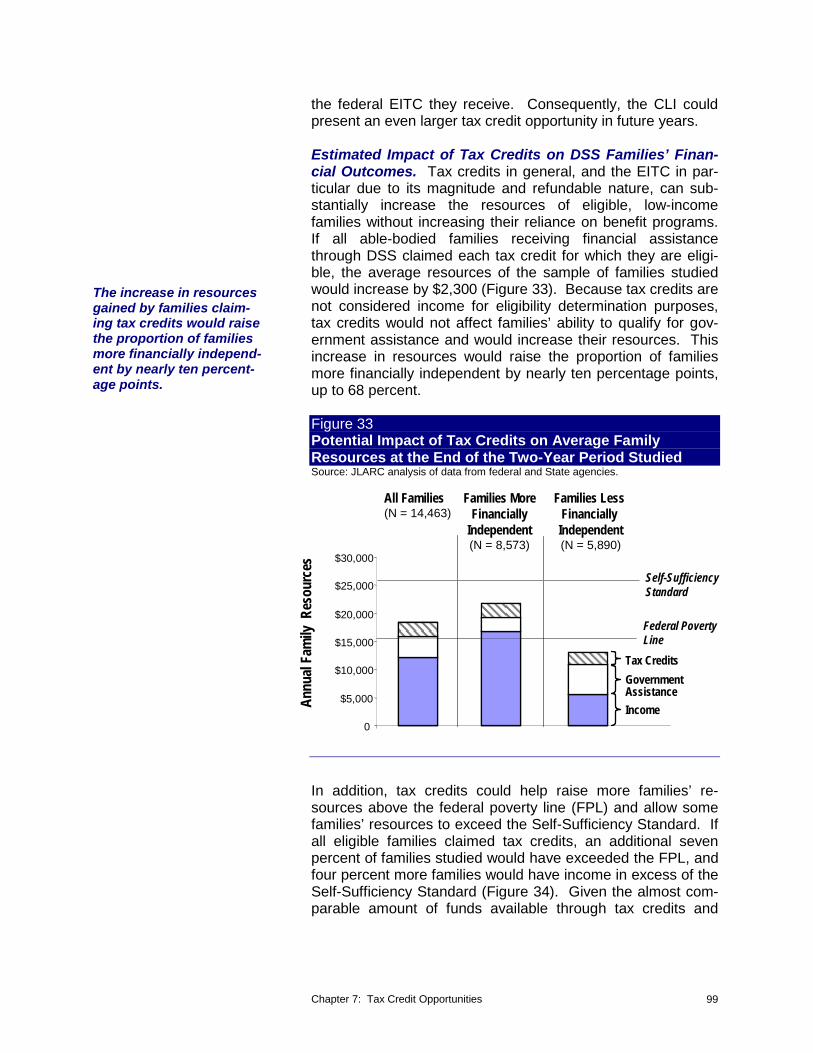
the federal EITC they receive. Consequently, the CLI could present an even larger tax credit opportunity in future years.
Estimated Impact of Tax Credits on DSS Families’ Finan-cial Outcomes. Tax credits in general, and the EITC in par-ticular due to its magnitude and refundable nature, can sub-stantially increase the resources of eligible, low-income families without increasing their reliance on benefit programs. If all able-bodied families receiving financial assistance through DSS claimed each tax credit for which they are eligi-ble, the average resources of the sample of families studied would increase by $2,300 (Figure 33). Because tax credits are not considered income for eligibility determination purposes, tax credits would not affect families’ ability to qualify for gov-ernment assistance and would increase their resources. This increase in resources would raise the proportion of families more financially independent by nearly ten percentage points, up to 68 percent.
The increase in resources gained by families claim-ing tax credits would raise the proportion of families more financially independ-ent by nearly ten percent-age points.
Figure 33 Potential Impact of Tax Credits on Average Family Resources at the End of the Two-Year Period Studied Source: JLARC analysis of data from federal and State agencies.
All Families Families More Families Less (N = 14,463) Financially Financially
Independent Independent (N = 8,573) (N = 5,890)
Annu
al F
amily
Res
ourc
es $30,000
$25,000
$20,000
$15,000
$10,000
$5,000
0
Self-Sufficiency Standard
Federal Poverty Line
Tax Credits
Government Assistance
Income
In addition, tax credits could help raise more families’ re-sources above the federal poverty line (FPL) and allow some families’ resources to exceed the Self-Sufficiency Standard. If all eligible families claimed tax credits, an additional seven percent of families studied would have exceeded the FPL, and four percent more families would have income in excess of the Self-Sufficiency Standard (Figure 34). Given the almost com-parable amount of funds available through tax credits and
Chapter 7: Tax Credit Opportunities 99

Figure 34 Potential Impact of Tax Credits on the Proportion of All Families Exceeding Measures of Self SufficiencSource: JLARC analysis of data from federal and State agencies. Note: N = 14,463 families.
Exceeding the Federal Poverty
Line
45% with Tax Credits
38% without Tax Credits
Exceeding theFederal Poverty
Line
45% with Tax Credits
38% without Tax Credits
Exceeding the Self-Exceeding the Self-SufficiencySufficiency
StandardStandard
19% with Tax Credits19% with Tax Credits
15% without Tax Credits15% without Tax Credits
benefit programs, tax credits could offer as much or more di-rect financial assistance as benefit programs in helping fami-lies to exceed measures of self-sufficiency.
THE STATE COULD HELP MORE FAMILIES ACCESS TAX CREDITS The availability of tax credits could greatly supplement fami-lies’ resources, yet many eligible families appear not to be claiming them. To increase the proportion of eligible families who receive credits, two steps appear to have been effective in other states:
• Raising awareness among clients of the social ser-vices system about the existence and benefits of tax credits; and
• Linking potentially eligible clients with tax preparation services.
Used together, these steps provide families with the informa-tion they need to decide whether to pursue tax credits and the resources to claim the credit on their tax return.
Raising Awareness of Tax Credits Among Social Services Clients The first step in raising awareness of tax credits should be in-creased outreach efforts targeted at clients who appear to be eligible for but have not claimed tax credits. Particular focus should be placed on the EITC because it is larger and more widely available than other credits, due to its refundable na-ture. This action would be consistent with the Code of Vir-ginia, which currently requires the Secretary of Health and Human Resources to “increase public awareness of the fed-eral earned income credit and encourage families who may be eligible to apply for this tax credit.”
Chapter 7: Tax Credit Opportunities 100

Virginia EITC Outreach Initiatives in 2004
• Direct marketing to clients • Promotional contacts with
other agencies • Business contacts • Media campaigns • DSS staff support for free
tax preparation sites • Full-time education and
outreach position at the Virginia Community Action Partnership
While a statewide outreach campaign was launched by the social services system in 2004, its scope was not targeted to clients who had not claimed tax credits, partly because DSS lacked the information necessary to make this determination. For example, generic flyers were sent to all recipients of gov-ernment assistance, whether or not they had already claimed the credit. Although the effectiveness of these efforts will not be known until the 2004 Internal Revenue Service (IRS) tax in-formation becomes available, other states’ experience sug-gests that targeting a smaller population of families who are most likely to be unaware of their eligibility could be a more ef-ficient use of resources.
Based on a review of effective outreach practices in other states, one of the most extensive efforts to target potential claimants has been implemented in Wisconsin, where social services staff systematically identify and contact the clients who have not claimed the EITC. If Virginia were to follow this model, DSS staff would generate a list of its clients who have not claimed the EITC, based on records from the Virginia De-partment of Taxation. Staff could then screen clients’ income level, filing status, and family composition to determine whether they might be eligible for the EITC. A letter would be sent to each potentially eligible client, informing them about possible eligibility and benefits, directing them to the nearest and most suitable tax preparation site, and providing them with a follow-up contact at DSS. During the tax preparation proc-ess, families could claim not only the EITC but also other cred-its for which they are eligible.
The Virginia Department of Taxation is currently unable to share with DSS whether benefit recipients have claimed the EITC because of disclosure limitations pursuant to federal law. To address this limitation, the Virginia Department of Taxation could add an item to the State tax form requiring filers to indi-cate whether they claimed the EITC. By requiring Virginia tax-payers to report on their tax form whether they have filed for the EITC, the State Department of Taxation would then be able to share this information with DSS without being subject to federal regulations.
In addition, the Code of Virginia would also have to be modi-fied to authorize the Department of Taxation to share with DSS not only income information, as currently provided by law, but also whether DSS clients have filed for the EITC so that DSS can conduct a targeted outreach campaign. Because DSS al-ready has access to the appropriate information systems, the cost to the Department of Taxation for providing DSS with this additional information would be unlikely to exceed a few hun-
Chapter 7: Tax Credit Opportunities 101

dred thousand dollars. In contrast, more than one million fed-eral dollars could flow into the Virginia economy each year for every 400 residents who claim the EITC.
Recommendation 10. The General Assembly may wish to consider amending the Code of Virginia to require the Vir-ginia Department of Taxation to obtain from taxpayers who file a Virginia individual income tax return the following infor-mation: (1) whether they claimed the federal Earned Income Tax Credit, and (2) the amount claimed.
Recommendation 11. The General Assembly may wish to consider amending §58.1-3 of the Code of Virginia to expand the authority of the Tax Commissioner to share with the Vir-ginia Department of Social Services information about its cli-ents’ filing status, number and type of dependents, and whether they have claimed the federal Earned Income Tax Credit.
Linking Clients with Tax Preparation Tools
State Comparison
• Michigan created a toolkit for local coalitions that de-scribes how to raise awareness of EITC filing and implement volunteer tax preparation sites. Be-cause of their coordinated effort, local coalitions in-creased EITC returns by $32 million in 2003.
• Delaware has conducted its EITC campaign through a coalition that coordinates with public, private, and nonprofit organizations to promote the EITC, offer free tax preparation and fi-nancial literacy courses, and provide free savings accounts to participants.
While a lack of awareness may be a significant factor prevent-ing Virginia’s low-income families from claiming tax credits, another barrier to claiming the credit may be the lack of access to tax preparation assistance. The prospect of filing taxes can be daunting for low-income families who have limited experi-ence with preparing a tax return, and the rules for EITC eligibil-ity are particularly complex. Consequently, access to profes-sional guidance is essential for these families to claim the credit.
Low-income taxpayers can generally receive filing assistance through one of three sources:
• Free tax preparation services certified by the IRS; • Accountants or tax preparation companies; or • Tax preparation software.
Information on how to access all three options should be pro-vided to DSS clients. However, free tax preparation sites that are administered by volunteers are the best option for low-income families who need guidance but may be unable to af-ford the services of professional tax preparers, who frequently charge more than $300. While tax preparation software offers a more affordable alternative, it requires access to a computer and may not be suitable for families who have limited experi-ence with computers or with filing taxes.
Existing free tax preparation sites would not be able to meet the demand that would likely result from a strong outreach ef-
Chapter 7: Tax Credit Opportunities 102
While DSS made EITC out-reach a priority and de-voted significant effort to this campaign in 2004, the effectiveness of the cam-paign was limited because full-time resources were not dedicated to this effort.
fort to DSS clients. In 2004, only 19 organizations offered free tax preparation services in Virginia, and those were primarily concentrated in urban areas. While several organizations ac-tively reach out to employers and community groups to identify more volunteers, their efforts are localized and largely uncoor-dinated.
To increase the availability of free tax preparation services, a coordinated, focused effort to recruit additional volunteers would have to be undertaken in areas that are currently under-served. Moreover, efforts would need to be made to forge partnerships with professional tax preparers in those areas where free sites cannot readily be established. Organizations in Virginia and other states have successfully negotiated dis-counts with certified public accountants and tax preparation companies in some localities, and a more coordinated, state-wide approach could be even more effective. While broad-based partnerships appear to be the most effective way to reach clients, a single entity responsible and accountable for coordinating efforts may be needed.
While DSS made EITC outreach a priority and devoted signifi-cant effort to this campaign in 2004, the effectiveness of the campaign was limited because full-time resources were not dedicated to this effort. Because the department has no au-thority over local personnel, State personnel based in local of-fices, such as child support enforcement and child care licens-ing staff, were asked to coordinate outreach efforts in addition to their regular job duties. While some of these staff success-fully recruited volunteers, their efforts were frequently con-strained by time availability and a lack of experience in effec-tive community organizing and outreach.
Because of the potential benefits that their clients could derive from obtaining tax credits and its lack of authority over local department personnel, DSS should use State staff to identify and contact potentially eligible clients, and lead a statewide recruitment campaign that would target volunteers from all po-tential private and public sources. DSS already funds one po-sition which is responsible for EITC outreach and education across the entire State, but funding for this position is sched-uled to expire in March 2006. Although the existence of this position is helpful in coordinating EITC outreach, a single indi-vidual is unlikely to have sufficient presence across Virginia to effectively reach potential volunteers.
Chapter 7: Tax Credit Opportunities 103
Recommendation 12. The Secretary of Health and Human Resources and the Virginia Department of Social Services should continue to make Earned Income Tax Credit outreach an agency priority. The Department of Social Services should allocate existing State staff as needed to make the necessary contacts with families who may be eligible for the federal tax credit and to recruit volunteers who can provide tax preparation support to those filers seeking to claim the credit. The Department of Social Services should develop and present a plan for conducting this outreach to the House Appropriations Committee and the Senate Finance Commit-tee by September 1, 2006, and begin outreach efforts for the 2006 tax year.
Chapter 7: Tax Credit Opportunities 104

Cha
pter 88 IInnnnoovvaattiivvee LLooccaall PPrraaccttiicceess
In S
umm
ary.
.. While the social services system has not consistently enabled clients to fully achieve self-sufficiency, some local departments have adopted supplemental, innovative practices in an attempt to realize this goal. Often facilitated and implemented by strong leaders, the practices adopted by local departments use the flexibility granted by a locally-administered system to provide an array of services built through col-laboration. These initiatives appear to enhance the ability of agency staff to identify the needs of families and improve service availability so that clients are better equipped to advance toward self-sufficiency. Moreover, these practices can be adopted at the discretion of local de-partments and do not require legislative or administrative action.
Practices implemented by local departments of social services highlighted in this section may serve as a framework for other local departments seeking creative ways to improve their agency’s effectiveness in helping more clients improve their fi-nancial independence. While all local departments have tai-lored program implementation to address their needs and limi-tations to a degree, the initiatives described below appear to best supplement minimum system requirements and are rep-licable across the State.
CLEAR VISION AND MEASURABLE GOALS ARE THE FOUNDATION FOR THE CREATION AND ADOPTION OF INNOVATIVE PRACTICES
Local departments that have adopted innovative, supplemental Research Methods practices aimed to help more clients achieve self-sufficiency
share three fundamental characteristics:The practices highlighted inthis section were observedduring site visits to 15 local • Directors create and communicate a clear agency vi-departments of social ser- sion that supports the goal of self-sufficiency; vices. The local director, • Staff engage in the development and implementation of VIEW supervisor and case effective practices that can advance clients toward self-managers, and eligibility su- sufficiency; and pervisor and workers in each • Metrics capture the agency’s performance in achievinglocality were interviewed. its goals.
Chapter 8: Innovative Local Practices 105
Communication of a Vision and Goals Helps Agencies Exceed Minimum Requirements
One local department strives for “family eco-nomic success” for its cli-ents, defined as finding employment that pays at least $11 an hour and ena-bling clients to better manage their personal finances.
Directors in several local departments have created a vision for their agency that reflects their commitment to helping cli-ents achieve self-sufficiency. For example, the Prince William Department of Social Services aims to help its clients achieve “family economic success,” defined as finding employment for clients that pays at least $11 an hour, and enabling clients to better manage their personal finances. In contrast, staff in most local departments visited by JLARC could not articulate an overarching vision for their agency, nor did they have a clear definition for self-sufficiency. In the absence of specific goals, these agencies typically defaulted to meeting minimum program requirements.
To implement their vision, several local directors have also ef-fectively articulated their goals and provided tools to case managers that ensure all levels of the organization are striving for a common objective. This cohesiveness has apparently been achieved in a few of the local departments visited, be-cause directors, Virginia Initiative for Employment not Welfare (VIEW) case managers, and eligibility workers in these local departments consistently articulated the same goals and phi-losophy in separate interviews.
Engaging Staff in Shaping and Realizing an Agency Vision Can Generate Buy-In and Yield Better Practices
To realize their vision, several local departments actively en-gage their staff in the development and implementation of new practices. This approach allows the agency to incorporate the knowledge of experts in the design of new processes while building ownership and buy-in of agency goals at the staff level.
In a few local departments, staff are assigned to teams re-sponsible for addressing specific goals set forth in the agency’s annual strategic plan. For example, a team of case managers and supervisors in the Fairfax Department of Social Services collaborated over the course of eight months to re-design the case management processes so that clients could be served better and faster. In addition, case managers in other local departments are given the opportunity to participate in State committees to design new policies and act as a con-
Active engagement in real-izing agency goals related duit between local departments and the State to ensure ade-to self-sufficiency can act quate interpretation of policy at the local level. as a catalyst for staff to find creative and appropri- Finally, active engagement in realizing agency goals related to ate practices to help ad- self-sufficiency can act as a catalyst for staff to find creative vance their clients toward and appropriate practices to help advance their clients toward self-sufficiency. self-sufficiency. For example, two local departments visited by
Chapter 8: Innovative Local Practices 106

JLARC staff were particularly effective in conveying the impor-tance of staff involvement by holding regular meetings to talk about department policies and practices. In addition, the di-rectors at these local departments appeared open to staff sug-gestions and willing to incorporate these suggestions into case management practices to better help clients advance toward self-sufficiency. In contrast, most local departments did not engage staff as fully, resulting in case managers only meeting minimum expectations rather than examining current policy and appropriately building on department practices in an effort to better serve their clients.
Agency Goals Are Measured and Used to Foster Accountability
Accurate and timely per-formance measures tai-lored to a locality's indi-vidual vision allow a more consistent gauge of how effectively it is achieving its goals and helping cli-ents improve their finan-cial independence.
Without accurate and timely performance measures tailored to a locality’s individual vision, local departments will not be able to consistently gauge how effectively they are achieving their goals, including the degree to which their clients are advancing toward self-sufficiency. A few local departments have devel-oped metrics that capture agency, team, and individual per-formance against specific program and agency goals. The re-sults of these metrics are then posted around the department, either in report format or in public areas such as conference rooms. This approach allows staff to understand the out-comes of their actions and helps the agency to identify where programs could be improved. The case study on the following page describes some specific aspects of the metrics tracked by the Fairfax County Department of Family Services.
Measurable goals provide staff with a clear message of what is expected of them and what to expect from each other and their leaders. In addition, a few local departments have incorpo-rated performance outcomes that are measured against agency goals resulting in staff compensation. This approach is widely believed to promote accountability at all levels of the organization, improve agency-wide performance, and, as a re-sult, help more clients achieve self-sufficiency. For example, the Prince William Department of Social Services has devel-oped goals that challenge the staff to provide above-average services that can help clients advance toward self-sufficiency. The department recently established an above-average target to place their clients in jobs that pay a minimum of $11 per hour, which is substantially more than the $9.45 an hour that clients currently make, on average.
INNOVATIVE PRACTICES TO ADDRESS BARRIERS AND PROVIDE EDUCATION AND TRAINING
Effective case management practices are a critical component of the social services system because case managers may be
Chapter 8: Innovative Local Practices 107
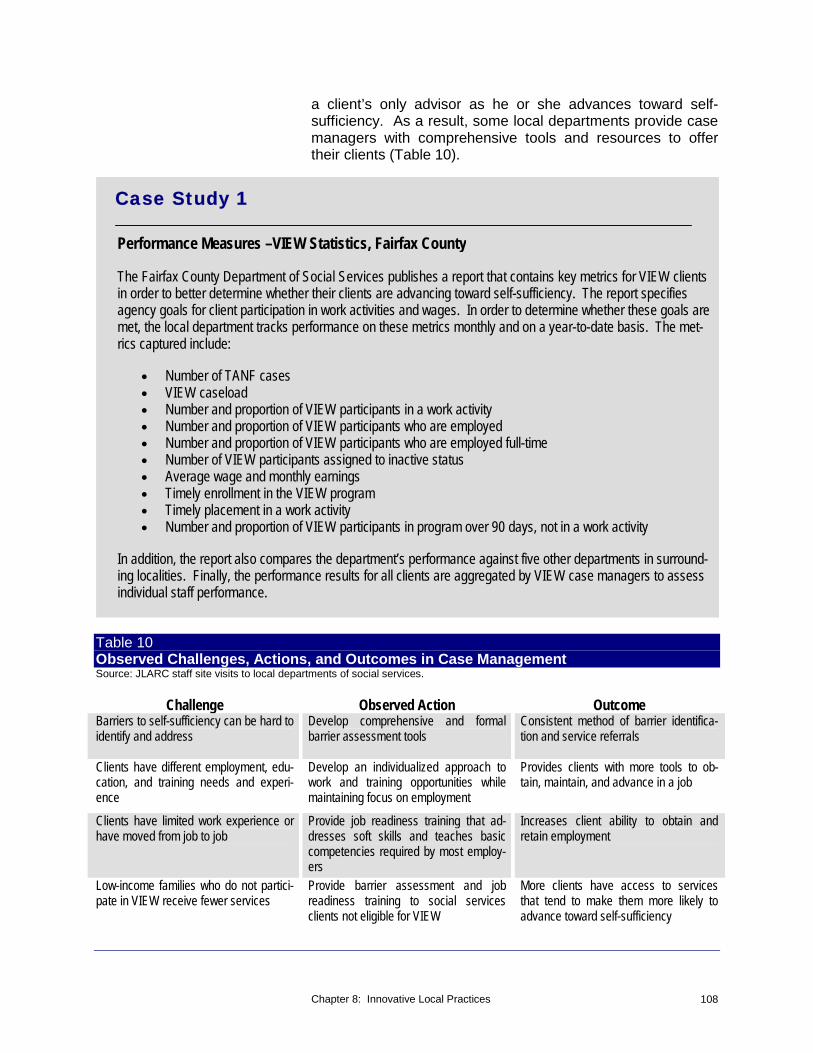
a client’s only advisor as he or she advances toward self-sufficiency. As a result, some local departments provide case managers with comprehensive tools and resources to offer their clients (Table 10).
Case Study 1
Performance Measures –VIEW Statistics, Fairfax County
The Fairfax County Department of Social Services publishes a report that contains key metrics for VIEW clients in order to better determine whether their clients are advancing toward self-sufficiency. The report specifies agency goals for client participation in work activities and wages. In order to determine whether these goals are met, the local department tracks performance on these metrics monthly and on a year-to-date basis. The metrics captured include:
• Number of TANF cases • VIEW caseload • Number and proportion of VIEW participants in a work activity • Number and proportion of VIEW participants who are employed • Number and proportion of VIEW participants who are employed full-time • Number of VIEW participants assigned to inactive status • Average wage and monthly earnings • Timely enrollment in the VIEW program • Timely placement in a work activity • Number and proportion of VIEW participants in program over 90 days, not in a work activity
In addition, the report also compares the department’s performance against five other departments in surrounding localities. Finally, the performance results for all clients are aggregated by VIEW case managers to assess individual staff performance.
Table 10 Observed Challenges, Actions, and Outcomes in Case ManagementSource: JLARC staff site visits to local departments of social services.
Challenge Observed Action Outcome Barriers to self-sufficiency can be hard to identify and address
Develop comprehensive and formal barrier assessment tools
Consistent method of barrier identification and service referrals
Clients have different employment, edu- Develop an individualized approach to Provides clients with more tools to ob-cation, and training needs and experi- work and training opportunities while tain, maintain, and advance in a job ence maintaining focus on employment
Clients have limited work experience or have moved from job to job
Provide job readiness training that addresses soft skills and teaches basic competencies required by most employers
Increases client ability to obtain and retain employment
Low-income families who do not partici- Provide barrier assessment and job More clients have access to services pate in VIEW receive fewer services readiness training to social services that tend to make them more likely to
clients not eligible for VIEW advance toward self-sufficiency
Chapter 8: Innovative Local Practices 108

These local departments have implemented innovative case management practices that provide clients with comprehen-sive barrier assessment, individualized plans for balancing employment with education and training, and practical job readiness courses that result in better access to resources, services, and skills that can advance clients toward self-sufficiency.
Formal Assessment Tools Consistently Identify Barriers to Self-Sufficiency
Innovative Local Practices: Barrier Assessment
• Alleghany/Lee/Wythe Counties: Licensed clinical social workers perform assessments through a regional con-tractor, Occupational En-terprises, Inc. (OEI).
• Charlottesville: Profes-sional assessors brought on-site to conduct client assessments
• Warren County: Devel-oped pre-screening tool-kit for more consistent referrals to services.
Social services clients may have barriers to self-sufficiency that are not easily or consistently identified. Therefore, a few local departments have developed formal assessment tools to identify barriers in a more effective and comprehensive man-ner. Common screening tools allow barriers to be more con-sistently identified by case managers within and across local departments. In addition, screening results can supply service providers with helpful information on the client’s situation and needs.
Certain local departments have developed in-house screening toolkits to identify barriers for both VIEW and VIEW-exempt clients. In a few local departments, the toolkits were designed in partnership with other human services agencies to better identify hidden barriers related to medical problems, mental health issues, learning disabilities, substance abuse, and do-mestic violence. Local department staff are able to use re-sponses to identify potential barriers and refer clients for for-mal assessments when needed.
In addition, a standardized assessment tool makes the screen-ing process less reliant upon individual case managers’ ex-perience and may decrease the variation in their ability to de-tect the presence of hidden barriers. This practice has become especially useful in smaller, less affluent local de-partments that have banded together to contract out barrier assessment for VIEW clients to a non-profit organization. These local departments recognize that a centrally-contracted service allows the region to share resources and provide cli-ents with more comprehensive assessments than each could offer on its own.
Emphasis on Career Development Helps Clients Achieve Long-Term Success While maintaining a focus on employment is critical to the suc-cess of all clients, providing individualized coaching, encourag-ing clients to strive for higher goals, and emphasizing educa-tion and training helps provide clients with tools to build a career and achieve long-term success. An individualized ap-proach to job placement, education, and training allows VIEW clients to identify and take advantage of opportunities that can
Chapter 8: Innovative Local Practices 109
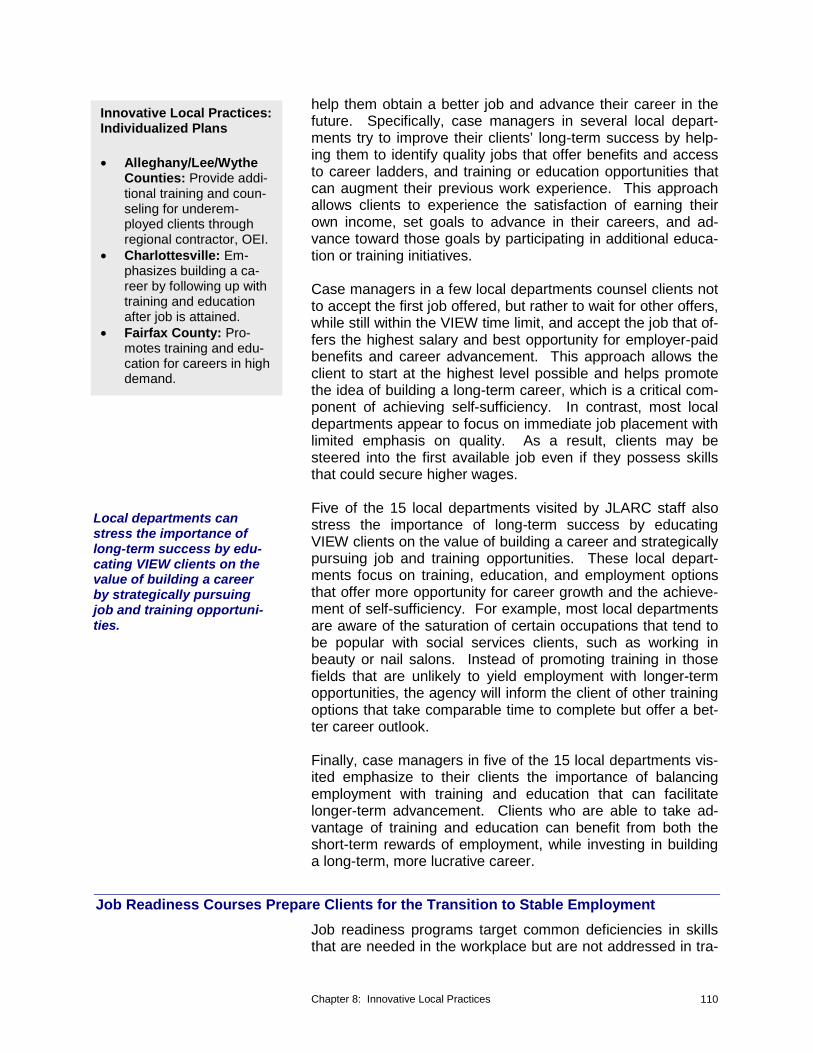
Innovative Local Practices: Individualized Plans
• Alleghany/Lee/Wythe Counties: Provide addi-tional training and coun-seling for underem-ployed clients through regional contractor, OEI.
• Charlottesville: Em-phasizes building a ca-reer by following up with training and education after job is attained.
• Fairfax County: Pro-motes training and edu-cation for careers in high demand.
Local departments can stress the importance of long-term success by edu-cating VIEW clients on the value of building a career by strategically pursuing job and training opportuni-ties.
help them obtain a better job and advance their career in the future. Specifically, case managers in several local depart-ments try to improve their clients’ long-term success by help-ing them to identify quality jobs that offer benefits and access to career ladders, and training or education opportunities that can augment their previous work experience. This approach allows clients to experience the satisfaction of earning their own income, set goals to advance in their careers, and ad-vance toward those goals by participating in additional educa-tion or training initiatives.
Case managers in a few local departments counsel clients not to accept the first job offered, but rather to wait for other offers, while still within the VIEW time limit, and accept the job that of-fers the highest salary and best opportunity for employer-paid benefits and career advancement. This approach allows the client to start at the highest level possible and helps promote the idea of building a long-term career, which is a critical com-ponent of achieving self-sufficiency. In contrast, most local departments appear to focus on immediate job placement with limited emphasis on quality. As a result, clients may be steered into the first available job even if they possess skills that could secure higher wages.
Five of the 15 local departments visited by JLARC staff also stress the importance of long-term success by educating VIEW clients on the value of building a career and strategically pursuing job and training opportunities. These local depart-ments focus on training, education, and employment options that offer more opportunity for career growth and the achieve-ment of self-sufficiency. For example, most local departments are aware of the saturation of certain occupations that tend to be popular with social services clients, such as working in beauty or nail salons. Instead of promoting training in those fields that are unlikely to yield employment with longer-term opportunities, the agency will inform the client of other training options that take comparable time to complete but offer a bet-ter career outlook.
Finally, case managers in five of the 15 local departments vis-ited emphasize to their clients the importance of balancing employment with training and education that can facilitate longer-term advancement. Clients who are able to take ad-vantage of training and education can benefit from both the short-term rewards of employment, while investing in building a long-term, more lucrative career.
Job Readiness Courses Prepare Clients for the Transition to Stable Employment Job readiness programs target common deficiencies in skills that are needed in the workplace but are not addressed in tra-
Chapter 8: Innovative Local Practices 110
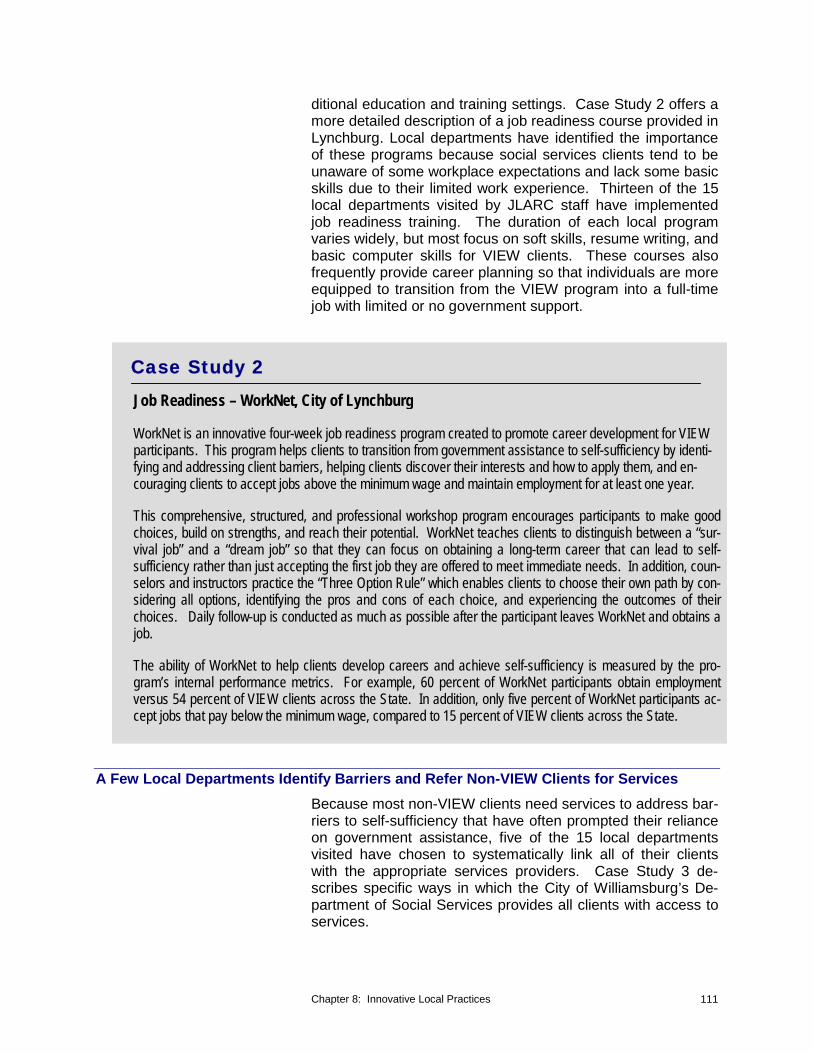
ditional education and training settings. Case Study 2 offers a more detailed description of a job readiness course provided in Lynchburg. Local departments have identified the importance of these programs because social services clients tend to be unaware of some workplace expectations and lack some basic skills due to their limited work experience. Thirteen of the 15 local departments visited by JLARC staff have implemented job readiness training. The duration of each local program varies widely, but most focus on soft skills, resume writing, and basic computer skills for VIEW clients. These courses also frequently provide career planning so that individuals are more equipped to transition from the VIEW program into a full-time job with limited or no government support.
Case Study 2
Job Readiness – WorkNet, City of Lynchburg
WorkNet is an innovative four-week job readiness program created to promote career development for VIEW participants. This program helps clients to transition from government assistance to self-sufficiency by identifying and addressing client barriers, helping clients discover their interests and how to apply them, and encouraging clients to accept jobs above the minimum wage and maintain employment for at least one year.
This comprehensive, structured, and professional workshop program encourages participants to make good choices, build on strengths, and reach their potential. WorkNet teaches clients to distinguish between a “survival job” and a “dream job” so that they can focus on obtaining a long-term career that can lead to self-sufficiency rather than just accepting the first job they are offered to meet immediate needs. In addition, counselors and instructors practice the “Three Option Rule” which enables clients to choose their own path by considering all options, identifying the pros and cons of each choice, and experiencing the outcomes of their choices. Daily follow-up is conducted as much as possible after the participant leaves WorkNet and obtains a job.
The ability of WorkNet to help clients develop careers and achieve self-sufficiency is measured by the program’s internal performance metrics. For example, 60 percent of WorkNet participants obtain employment versus 54 percent of VIEW clients across the State. In addition, only five percent of WorkNet participants accept jobs that pay below the minimum wage, compared to 15 percent of VIEW clients across the State.
A Few Local Departments Identify Barriers and Refer Non-VIEW Clients for Services Because most non-VIEW clients need services to address bar-riers to self-sufficiency that have often prompted their reliance on government assistance, five of the 15 local departments visited have chosen to systematically link all of their clients with the appropriate services providers. Case Study 3 de-scribes specific ways in which the City of Williamsburg’s De-partment of Social Services provides all clients with access to services.
Chapter 8: Innovative Local Practices 111

Although the majority of local departments focus primarily on verifying eligibility and processing applications for financial benefits, a few local departments conduct more complete as-sessments in an attempt to alleviate or remove barriers to self-sufficiency. For example, at four of the 15 local departments visited, barrier assessments are conducted at intake for all cli-ents; vocational counselors are available to anyone struggling financially; social workers are available for referrals; and case managers make service referrals for all clients instead of limit-ing referrals to VIEW clients only. These procedures allow all social services clients to access services that may alleviate their barriers to self-sufficiency and help them to transition from government assistance to financial independence.
In addition, the City of Richmond’s Department of Social Ser-vices has chosen to provide all TANF recipients (even those who do not participate in the VIEW program) with case man-agement and referral services. This locality has pursued grant opportunities to implement programs that allow its VIEW-exempt population to engage in VIEW activities, particularly education and training. Participation in useful introductory workplace training activities allows temporarily exempt clients to begin to address their needs and continue to build on their skills and knowledge once they become eligible for the VIEW program.
Case Study 3
Access to Services – Family Support Services, City of Williamsburg
In order to provide clients with better access to services, Williamsburg’s Department of Social Services focuses on addressing all of its clients’ needs rather than solely providing them with financial assistance. This approach more comprehensively engages the department’s social work unit to provide direct services to clients. Social workers have the background necessary to help clients overcome many prevalent barriers, such as mental health and substance abuse issues, and are therefore able to enhance mandated services provided such as Child and Adult Protective services or Foster Care. In addition, eligibility workers are trained to recognize indicators of barriers to self-sufficiency so that they can more consistently refer clients to social workers.
Once a client is referred by an eligibility worker to the department’s social work unit, the social worker conducts an initial assessment that focuses on family preservation and child welfare. An agency agreement detailing the responsibilities of the family and the local department of social services is developed. Once the agency agreement is consented to, the family receives services that can include home studies, mediation, and counseling.
COLLABORATIVE EFFORTS AND PARTNERSHIPS Forging collaborative partnerships across organizations that serve the same clients tends to create a more client-centered
Chapter 8: Innovative Local Practices 112
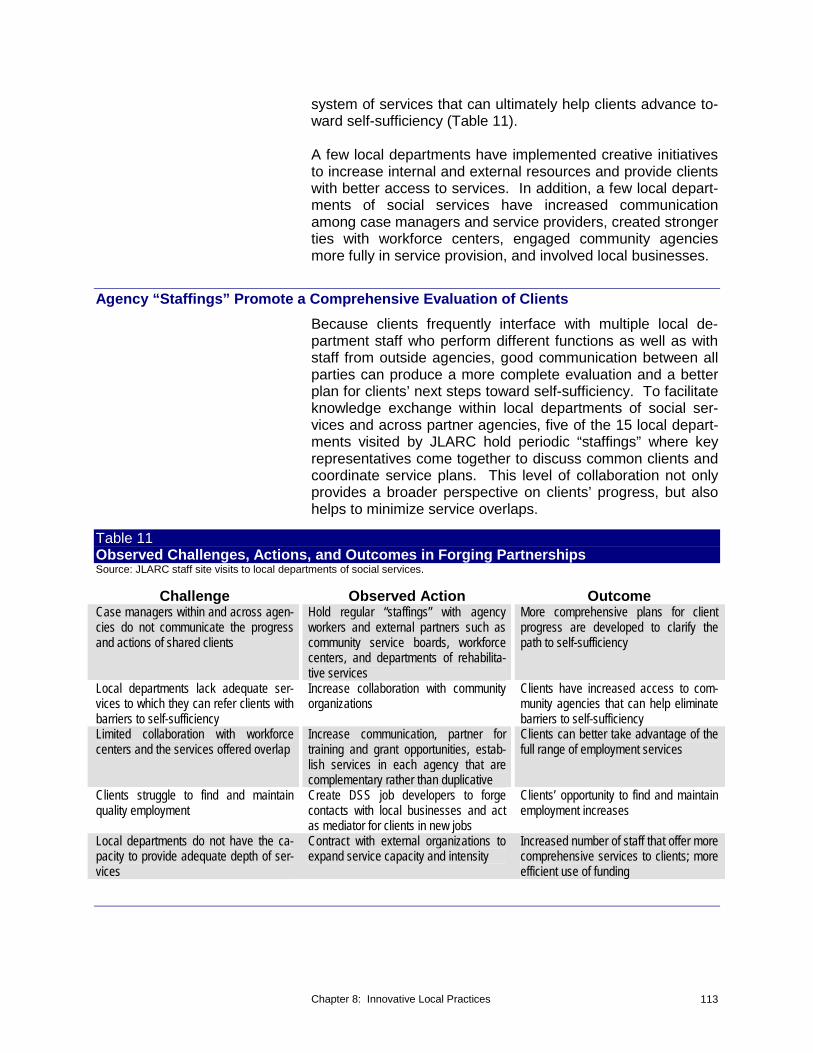
system of services that can ultimately help clients advance to-ward self-sufficiency (Table 11).
A few local departments have implemented creative initiatives to increase internal and external resources and provide clients with better access to services. In addition, a few local depart-ments of social services have increased communication among case managers and service providers, created stronger ties with workforce centers, engaged community agencies more fully in service provision, and involved local businesses.
Agency “Staffings” Promote a Comprehensive Evaluation of Clients Because clients frequently interface with multiple local de-partment staff who perform different functions as well as with staff from outside agencies, good communication between all parties can produce a more complete evaluation and a better plan for clients’ next steps toward self-sufficiency. To facilitate knowledge exchange within local departments of social ser-vices and across partner agencies, five of the 15 local depart-ments visited by JLARC hold periodic “staffings” where key representatives come together to discuss common clients and coordinate service plans. This level of collaboration not only provides a broader perspective on clients’ progress, but also helps to minimize service overlaps.
Table 11 Observed Challenges, Actions, and Outcomes in Forging Partnerships Source: JLARC staff site visits to local departments of social services.
Challenge Observed Action Outcome Case managers within and across agencies do not communicate the progress and actions of shared clients
Hold regular “staffings” with agency workers and external partners such as community service boards, workforce centers, and departments of rehabilitative services
More comprehensive plans for client progress are developed to clarify the path to self-sufficiency
Local departments lack adequate ser- Increase collaboration with community Clients have increased access to comvices to which they can refer clients with organizations munity agencies that can help eliminate barriers to self-sufficiency barriers to self-sufficiency Limited collaboration with workforce centers and the services offered overlap
Increase communication, partner for training and grant opportunities, establish services in each agency that are complementary rather than duplicative
Clients can better take advantage of the full range of employment services
Clients struggle to find and maintain Create DSS job developers to forge Clients’ opportunity to find and maintain quality employment contacts with local businesses and act employment increases
as mediator for clients in new jobs Local departments do not have the capacity to provide adequate depth of services
Contract with external organizations to expand service capacity and intensity
Increased number of staff that offer more comprehensive services to clients; more efficient use of funding
Chapter 8: Innovative Local Practices 113
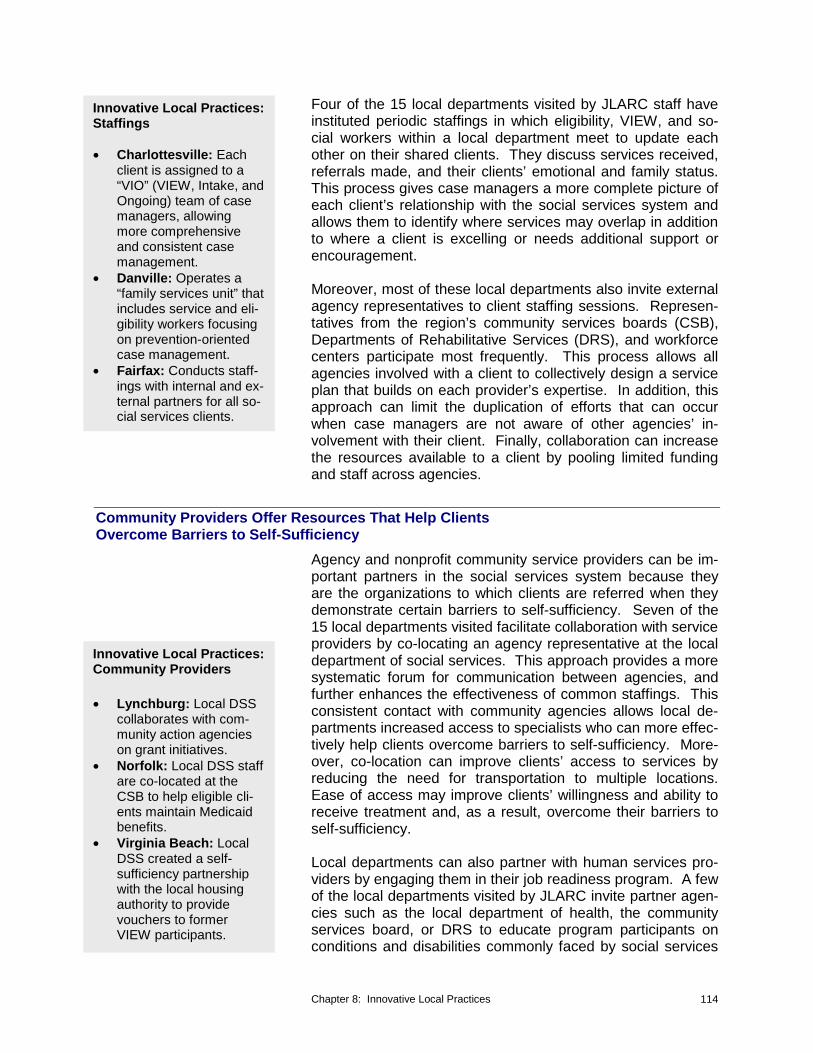
Innovative Local Practices: Staffings
• Charlottesville: Each client is assigned to a “VIO” (VIEW, Intake, and Ongoing) team of case managers, allowing more comprehensive and consistent case management.
• Danville: Operates a “family services unit” that includes service and eli-gibility workers focusing on prevention-oriented case management.
• Fairfax: Conducts staff-ings with internal and ex-ternal partners for all so-cial services clients.
Four of the 15 local departments visited by JLARC staff have instituted periodic staffings in which eligibility, VIEW, and so-cial workers within a local department meet to update each other on their shared clients. They discuss services received, referrals made, and their clients’ emotional and family status. This process gives case managers a more complete picture of each client’s relationship with the social services system and allows them to identify where services may overlap in addition to where a client is excelling or needs additional support or encouragement.
Moreover, most of these local departments also invite external agency representatives to client staffing sessions. Represen-tatives from the region’s community services boards (CSB), Departments of Rehabilitative Services (DRS), and workforce centers participate most frequently. This process allows all agencies involved with a client to collectively design a service plan that builds on each provider’s expertise. In addition, this approach can limit the duplication of efforts that can occur when case managers are not aware of other agencies’ in-volvement with their client. Finally, collaboration can increase the resources available to a client by pooling limited funding and staff across agencies.
Community Providers Offer Resources That Help Clients Overcome Barriers to Self-Sufficiency
Innovative Local Practices: Community Providers
• Lynchburg: Local DSS collaborates with com-munity action agencies on grant initiatives.
• Norfolk: Local DSS staff are co-located at the CSB to help eligible cli-ents maintain Medicaid benefits.
• Virginia Beach: Local DSS created a self-sufficiency partnership with the local housing authority to provide vouchers to former VIEW participants.
Agency and nonprofit community service providers can be im-portant partners in the social services system because they are the organizations to which clients are referred when they demonstrate certain barriers to self-sufficiency. Seven of the 15 local departments visited facilitate collaboration with service providers by co-locating an agency representative at the local department of social services. This approach provides a more systematic forum for communication between agencies, and further enhances the effectiveness of common staffings. This consistent contact with community agencies allows local de-partments increased access to specialists who can more effec-tively help clients overcome barriers to self-sufficiency. More-over, co-location can improve clients’ access to services by reducing the need for transportation to multiple locations. Ease of access may improve clients’ willingness and ability to receive treatment and, as a result, overcome their barriers to self-sufficiency.
Local departments can also partner with human services pro-viders by engaging them in their job readiness program. A few of the local departments visited by JLARC invite partner agen-cies such as the local department of health, the community services board, or DRS to educate program participants on conditions and disabilities commonly faced by social services
Chapter 8: Innovative Local Practices 114

clients and inform them of available treatment programs, or to conduct assessments. In addition to the value they provide during the program, partner agencies may also use the pro-gram to build relationships with clients. Because of the sensi-tive nature of many barriers, developing a trusting relationship may help clients to share the existence of barriers and seek treatment.
Most local departments have also engaged nonprofit organiza-tions to increase clients’ self-sufficiency, especially those VIEW clients who face program deadlines. For example, so-cial services clients tend to lack strong support systems, and most local departments are able to connect clients with com-munity organizations that can provide them with a sense of identity, especially in areas with large minority populations. These non-profit organizations, such as YMCAs, crisis support groups, or cultural organizations, can be an effective tool for providing clients with a sense of stability, a critical aspect to achieving self-sufficiency.
Workforce Centers Provide Key Employment Services Not Offered by Local Departments
Innovative Local Practices: Workforce Development
• Fairfax County: The comprehensive work-force center is co-located at the local DSS and case managers are trained in available ser-vices for better client re-ferral.
• Prince William County: The workforce center, co-located at the local DSS, provides job readi-ness training to VIEW participants.
• Williamsburg: A VIEW case manager is co-located at the workforce center and reports to the center’s director.
Workforce development agencies can be important partners for the social services system because they provide a wider array of employment and training services than is available from local departments of social services. To leverage the ex-pertise and resources of local workforce centers, seven of the 15 local departments visited by JLARC staff have adopted a range of practices aimed at improving collaboration. These actions provide each agency with a clear understanding of the services available, and allow clients to take advantage of as many opportunities for employment services and training as possible. However, as described in Chapters 5 and 6, this level of collaboration has not been widely achieved across Vir-ginia local departments.
A few local departments have chosen to operate a workforce center and provide seamless access to employment and train-ing services to their clients. Other local departments have co-located a worker at the workforce center. Local department staff members are knowledgeable about the services offered in workforce centers and can more consistently direct clients to the appropriate services. In addition, these workers can act as a guide for clients wanting to take advantage of workforce cen-ter services. Co-located workers attend staff meetings at both the local department of social services and the workforce cen-ter, and can keep each agency abreast of the other’s activities. In a few local departments, workforce centers conduct job readiness training for VIEW participants and may use this fo-rum to educate them about the availability of longer-term ser-
Chapter 8: Innovative Local Practices 115
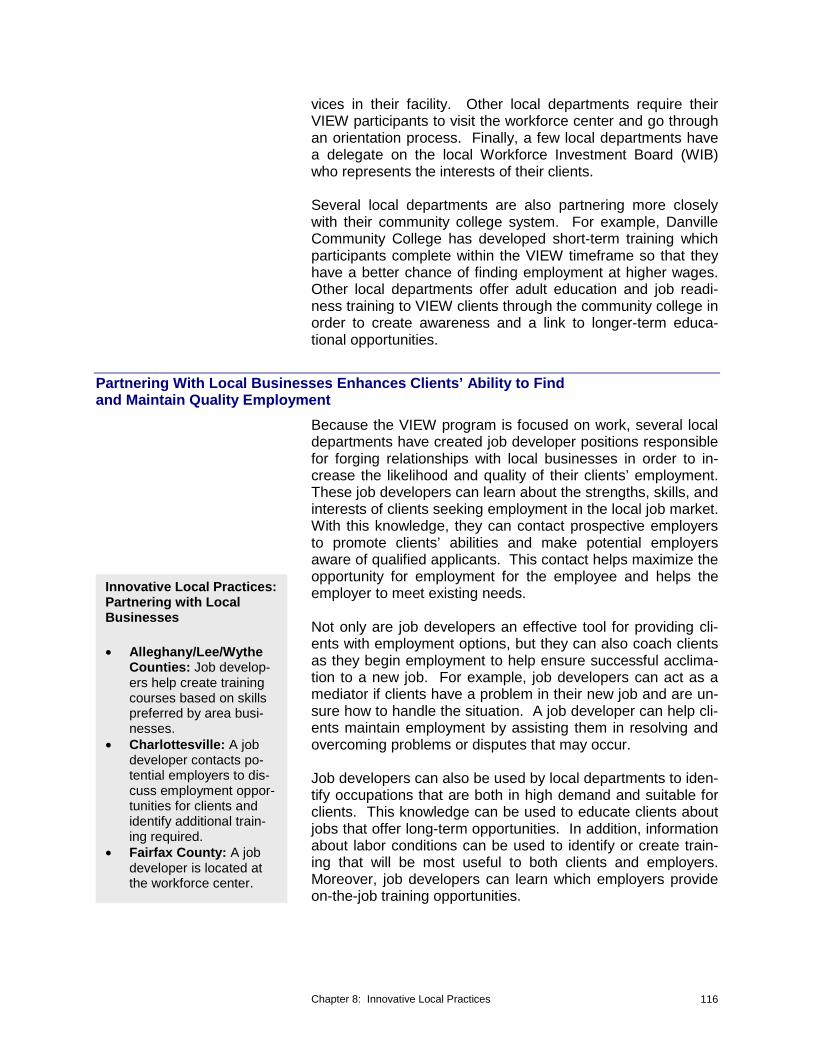
vices in their facility. Other local departments require their VIEW participants to visit the workforce center and go through an orientation process. Finally, a few local departments have a delegate on the local Workforce Investment Board (WIB) who represents the interests of their clients.
Several local departments are also partnering more closely with their community college system. For example, Danville Community College has developed short-term training which participants complete within the VIEW timeframe so that they have a better chance of finding employment at higher wages. Other local departments offer adult education and job readi-ness training to VIEW clients through the community college in order to create awareness and a link to longer-term educa-tional opportunities.
Partnering With Local Businesses Enhances Clients’ Ability to Find and Maintain Quality Employment
Because the VIEW program is focused on work, several local departments have created job developer positions responsible for forging relationships with local businesses in order to in-crease the likelihood and quality of their clients’ employment. These job developers can learn about the strengths, skills, and interests of clients seeking employment in the local job market. With this knowledge, they can contact prospective employers to promote clients’ abilities and make potential employers aware of qualified applicants. This contact helps maximize the opportunity for employment for the employee and helps the
Innovative Local Practices: Partnering with Local employer to meet existing needs. Businesses
Not only are job developers an effective tool for providing cli-
• Alleghany/Lee/Wythe ents with employment options, but they can also coach clients Counties: Job develop- as they begin employment to help ensure successful acclima-ers help create training tion to a new job. For example, job developers can act as a courses based on skills mediator if clients have a problem in their new job and are un-preferred by area busi- sure how to handle the situation. A job developer can help cli-nesses. ents maintain employment by assisting them in resolving and
• Charlottesville: A job overcoming problems or disputes that may occur. developer contacts po-tential employers to dis- Job developers can also be used by local departments to iden-cuss employment oppor- tify occupations that are both in high demand and suitable for tunities for clients and clients. This knowledge can be used to educate clients about identify additional train- jobs that offer long-term opportunities. In addition, information ing required. about labor conditions can be used to identify or create train-• Fairfax County: A job
ing that will be most useful to both clients and employers. developer is located at the workforce center. Moreover, job developers can learn which employers provide
on-the-job training opportunities.
Chapter 8: Innovative Local Practices 116
Regional Partnerships Can Supplement Local Departments’ Resource Capacity and Capabilities
Regional partnerships al-low local departments to maximize resources and alleviate regional chal-lenges.
OEI has expanded the re-gion's ability to identify client barriers by develop-ing a comprehensive as-sessment tool which screens for the barriers to employment that social services clients tend to face.
Most regions in Virginia experience funding and staffing con-straints that prevent them from providing comprehensive ser-vices to their social services clients. In response to this con-cern, combined with the challenging local economy, 13 local departments in the southwest region of the State are working with a nonprofit organization, Occupational Enterprises, Inc. (OEI), to provide employment services to VIEW participants. This partnership allows local departments to maximize re-sources and alleviate regional challenges by supplementing local departments’ funding capacity and providing a wider range of services to clients than each locality could provide on its own. For example, as an independently funded nonprofit organization, OEI is able to access funding from federal, State, and private sources without the restrictions faced by State agencies. This approach allows OEI to serve a larger number of VIEW clients without drawing from the local department’s designated TANF and VIEW funds.
In addition, OEI has expanded the region’s ability to identify client barriers by developing a comprehensive assessment tool which screens for the barriers to employment that social services clients tend to face. This assessment is performed by licensed clinical social workers whose expertise can be espe-cially beneficial in identifying hidden barriers such as domestic violence or substance abuse. Case managers then refer cli-ents to job readiness classes, job skills training, education, or treatment services where applicable. This assessment allows OEI case managers to develop a comprehensive service plan for each client, access a wider range of services across the region, and consequently provide more opportunities for cli-ents to prepare for employment and improve their financial in-dependence.
Not only does OEI provide comprehensive assessment and job skills training to overcome the limited employment oppor-tunities in the region, it has also created programs to help ad-vance clients who are employed in jobs with low wages. So-cial services clients in Southwest Virginia find it difficult to find full-time employment, and the jobs typically available pay low wages and require less skills or training than clients typically possess, a trend referred to as underemployment. OEI devel-oped JOB CLUBS, a program in which case managers identify clients working at low wages, re-evaluate their skills, abilities, and interests, and provide intensive case management to help them find better employment. For example, OEI collaborates with vocational school instructors to develop short-term train-ing courses for high-demand jobs in the region. This program allows clients to be more competitive for the skilled jobs in
Chapter 8: Innovative Local Practices 117
The innovative and col-laborative actions taken by local departments in southwestern Virginia and OEI have resulted in no-ticeable improvements in assessments, employment rates, job attainment, and job retention for VIEW par-ticipants.
higher demand that pay more competitive wages and im-proves their financial independence. In addition, clients can work with an OEI employment developer who coordinates with employers to place clients in more advanced positions that more appropriately match their abilities.
These innovative and collaborative actions taken by local de-partments in southwestern Virginia and OEI have resulted in noticeable improvements in assessments, employment rates, job attainment, and job retention for VIEW participants. A grant designated to assist hard-to-serve clients with multiple barriers serviced by OEI resulted in an 85-percent increase in the number of hard-to-serve clients employed after assess-ment between July 2002 and May 2004. In addition, OEI pro-duced a ten-percent increase in the number of employed cli-ents who participated in job readiness courses, and a 56-percent increase in the number of clients who became em-ployed after receiving counseling. In December 2004, OEI se-cured a new source of funding that enabled the organization to expand its focus to encompass job retention and wage ad-vancement measures. Since that time, clients’ average hourly wages increased from $6.65 an hour to $7.10 an hour. In ad-dition, the proportion of clients who kept their jobs for 90 days or more increased by 47 percent, and the overall number of participants employed increased by 41 percent. The overall State ranking for most of the local departments within the OEI service area has improved since the development of this col-laborative effort in 1998.
Chapter 8: Innovative Local Practices 118
AAppppeennddiixxeess
Page
A Study Mandate 121
B Research Methods 123
C Acronyms 130
D The Self-Sufficiency Standard 133
E Agency Response 139
Appendixes 119

Appendixes 120
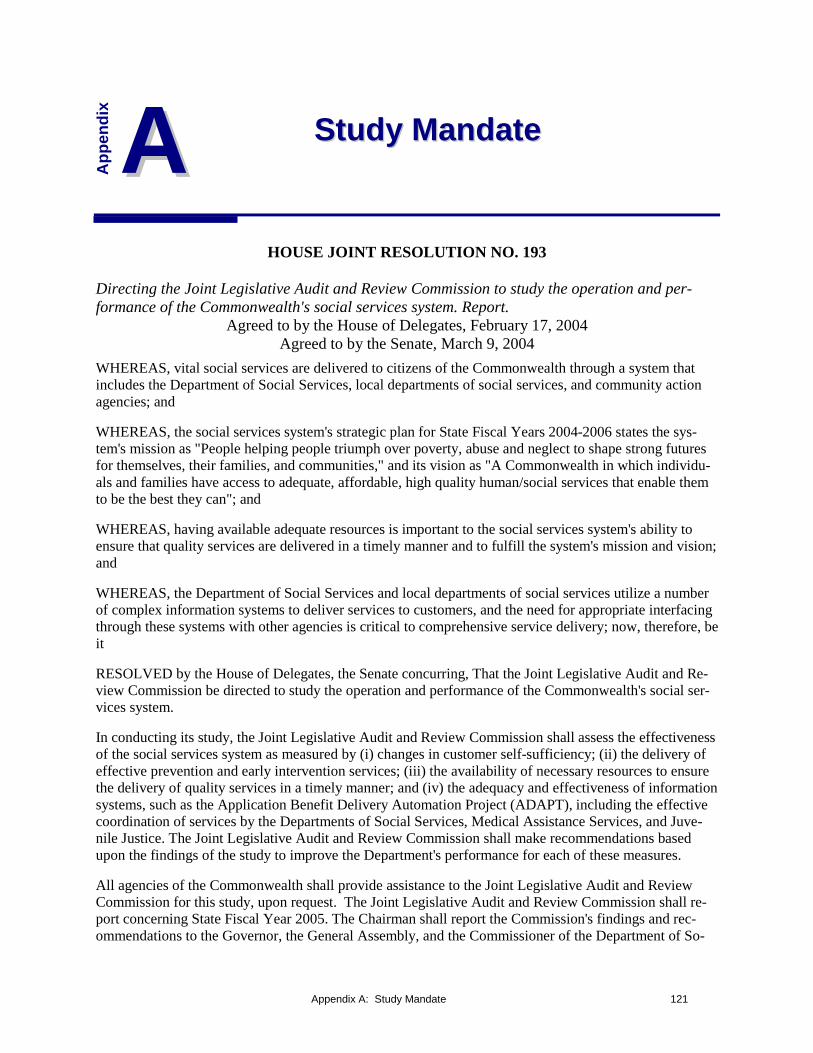
App
endi
x AA SSttuuddyy MMaannddaattee
HOUSE JOINT RESOLUTION NO. 193
Directing the Joint Legislative Audit and Review Commission to study the operation and per-formance of the Commonwealth's social services system. Report.
Agreed to by the House of Delegates, February 17, 2004 Agreed to by the Senate, March 9, 2004
WHEREAS, vital social services are delivered to citizens of the Commonwealth through a system that includes the Department of Social Services, local departments of social services, and community action agencies; and
WHEREAS, the social services system's strategic plan for State Fiscal Years 2004-2006 states the sys-tem's mission as "People helping people triumph over poverty, abuse and neglect to shape strong futures for themselves, their families, and communities," and its vision as "A Commonwealth in which individu-als and families have access to adequate, affordable, high quality human/social services that enable them to be the best they can"; and
WHEREAS, having available adequate resources is important to the social services system's ability to ensure that quality services are delivered in a timely manner and to fulfill the system's mission and vision; and
WHEREAS, the Department of Social Services and local departments of social services utilize a number of complex information systems to deliver services to customers, and the need for appropriate interfacing through these systems with other agencies is critical to comprehensive service delivery; now, therefore, be it
RESOLVED by the House of Delegates, the Senate concurring, That the Joint Legislative Audit and Re-view Commission be directed to study the operation and performance of the Commonwealth's social ser-vices system.
In conducting its study, the Joint Legislative Audit and Review Commission shall assess the effectiveness of the social services system as measured by (i) changes in customer self-sufficiency; (ii) the delivery of effective prevention and early intervention services; (iii) the availability of necessary resources to ensure the delivery of quality services in a timely manner; and (iv) the adequacy and effectiveness of information systems, such as the Application Benefit Delivery Automation Project (ADAPT), including the effective coordination of services by the Departments of Social Services, Medical Assistance Services, and Juve-nile Justice. The Joint Legislative Audit and Review Commission shall make recommendations based upon the findings of the study to improve the Department's performance for each of these measures.
All agencies of the Commonwealth shall provide assistance to the Joint Legislative Audit and Review Commission for this study, upon request. The Joint Legislative Audit and Review Commission shall re-port concerning State Fiscal Year 2005. The Chairman shall report the Commission's findings and rec-ommendations to the Governor, the General Assembly, and the Commissioner of the Department of So-
Appendix A: Study Mandate 121

cial Services by December 31, 2005, and shall submit to the Division of Legislative Automated Systems an executive summary of its findings and recommendations no later than the first day of the 2006 Regular Session of the General Assembly. The executive summaries and the documents shall be submitted as pro-vided in the procedures of the Division of Legislative Automated Systems for the processing of legislative documents and reports and shall be posted on the General Assembly's website.
Appendix A: Study Mandate 122

BBApp
endi
x RReesseeaarrcchh MMeetthhooddss
This appendix describes the research methods used to de-velop this report. Key research activities included:
• Site visits to local departments of social services, work-force centers, community action agencies, and com-munity services boards;
• Quantitative analysis of changes in the financial situa-tion of families receiving government assistance from the social services system;
• Analysis of tax credit opportunities; • Survey of clients of the social services system; • Case studies of innovative local practices; • Structured interviews; and • Literature reviews.
Site Visits JLARC staff visited local human services and workforce de-velopment agencies in 15 localities across Virginia. Interviews conducted during these site visits allowed JLARC staff to ob-tain the perspectives of the individuals who work most closely and frequently with government assistance recipients, and to draw conclusions about their role and challenges in shaping client outcomes.
In each locality, JLARC staff met with key participants in the provision of services to social services clients who may con-tribute to improving clients’ financial independence. These in-dividuals included staff from the local department of social ser-vices, local workforce development partners, the local community action agency (CAA), and local community ser-vices boards (CSB). The site visits were conducted between May and August and each site visit was completed in one to two days.
The interviews conducted at each agency focused on the fol-lowing topics:
• Local philosophy, including the groups’ definition of self-sufficiency;
• Case management methods; • Barriers commonly faced by clients; • Services provided to clients not eligible for VIEW;
Appendix B: Research Methods 123

• Use of performance metrics; • Effectiveness of federal and State program policy; • Extent of community and local government support; • Degree of collaboration with other agencies; • Training and education programs developed within the
agency in addition to customary programs provided; and
• Ability of the agency to expand the role of programs provided and the number of clients served.
Because each agency interacts with social services clients in different ways, the emphasis placed on individual topics was adjusted accordingly. In addition, a larger number of inter-views were held in local departments than in other agencies, because local department staff have the greatest amount of contact with benefit recipients. Separate meetings were held with the director of each local department, VIEW program su-pervisors and staff, and eligibility supervisors and staff.
The 15 localities visited by JLARC staff were selected based on the following criteria:
• Population density (urban, suburban, rural); • Economic development region; • Local unemployment rates; • Size of local department caseload; and • Perception of local department effectiveness provided
by staff of the Virginia Department of Social Services (DSS).
JLARC staff determined the proportion of clients residing in high, medium, and low population density settings within each economic development region, and used this distribution to de-termine how many localities from each population density type and region should be visited. Finally, because JLARC staff were interested in observing best practices, local departments that were favorably perceived by DSS staff were dispropor-tionately visited (10) compared to those with a less positive reputation (5).
The following localities were visited:
• Alleghany County • Charlottesville • Danville • Fairfax County • Lee County • Lynchburg • Norfolk • Northumberland County
Appendix B: Research Methods 124

• Petersburg • Prince William County • Richmond City • Virginia Beach • Warren County • Williamsburg • Wythe County
Quantitative Analysis of Changes in Self-Sufficiency Among Clients of the Social Services System
In order to examine changes in self-sufficiency among social services families, JLARC staff constructed a longitudinal finan-cial profile for nearly 15,000 social services families and tracked their economic resources over the course of more than two years. These families were receiving Food Stamp or Tem-porary Assistance for Needy Families (TANF) benefits in the last half of 2002 according to records from the Virginia De-partment of Social Services (DSS). Because the population studied includes families who received benefits at any point during the last six months of 2002, some families were receiv-ing government assistance before July 1, 2002, while others may have started receiving benefits between July 1 and De-cember 31, 2002.
The families studied were composed of at least one adult be-tween 18 and 65 years of age who was not disabled or blind. Of the 132,000 families who met these criteria and were con-sidered “able-bodied,” a random sample of 14,463 families was analyzed. In the context of this study, families include only immediate members: adult caretaker, their spouse when applicable, and all of the children for whom they are legally re-sponsible. Changes in the financial situation of these families were tracked starting in July to December 2002 (in the month when they started receiving government assistance) through September 2004. This period was designed to be long enough to observe changes in outcomes and evaluate the sustainability of progress, and to capture a recent period of time that would be reflective of today’s social services system. In addition, DSS retains data in their information systems for only three years.
The data necessary to create a comprehensive financial profile for families in the sample and to examine changes in their fi-nancial independence and self-sufficiency were obtained from the following State and federal agencies:
• Virginia Department of Social Services: Divisions of Benefit Programs and Child Support Enforcement;
• Virginia Employment Commission;
Appendix B: Research Methods 125
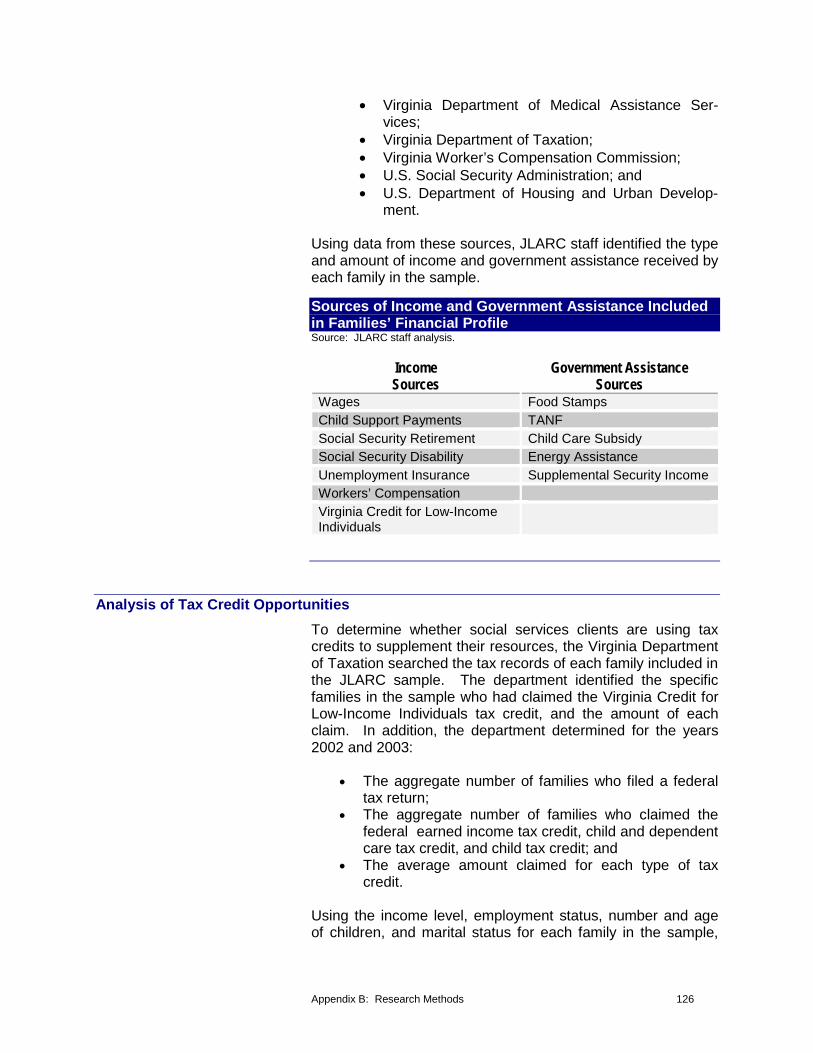
• Virginia Department of Medical Assistance Ser-vices;
• Virginia Department of Taxation; • Virginia Worker’s Compensation Commission; • U.S. Social Security Administration; and • U.S. Department of Housing and Urban Develop-
ment.
Using data from these sources, JLARC staff identified the type and amount of income and government assistance received by each family in the sample.
Sources of Income and Government Assistance Included in Families’ Financial Profile Source: JLARC staff analysis.
Income Government Assistance Sources Sources
Wages Food Stamps Child Support Payments TANF Social Security Retirement Child Care Subsidy Social Security Disability Energy Assistance Unemployment Insurance Supplemental Security Income Workers’ Compensation Virginia Credit for Low-Income Individuals
Analysis of Tax Credit Opportunities To determine whether social services clients are using tax credits to supplement their resources, the Virginia Department of Taxation searched the tax records of each family included in the JLARC sample. The department identified the specific families in the sample who had claimed the Virginia Credit for Low-Income Individuals tax credit, and the amount of each claim. In addition, the department determined for the years 2002 and 2003:
• The aggregate number of families who filed a federal tax return;
• The aggregate number of families who claimed the federal earned income tax credit, child and dependent care tax credit, and child tax credit; and
• The average amount claimed for each type of tax credit.
Using the income level, employment status, number and age of children, and marital status for each family in the sample,
Appendix B: Research Methods 126

JLARC staff determined which families appeared to meet the primary eligibility criteria for each type of tax credit. It should be noted that some of the information necessary to establish eligibility with certainty does not reside in the datasets ob-tained by JLARC staff, and that only a tax preparer or the tax-payer could establish a family’s eligibility categorically. In ad-dition, the decision was made to use the proportion of families who filed a federal tax return as a proxy for the percentage of families who had a tax liability, because families who do not owe any taxes would be unlikely to file a tax return. This as-sumption was used to estimate the proportion of families who would be able to claim non-refundable tax credits.
Based on the proportion of families in the sample who ap-peared to be eligible for each type of tax credit and did not claim them, results were extrapolated to the entire population of families who received Food Stamp or TANF benefits through the Virginia Department of Social Services in 2005. Due to the large sample size, the sampling errors resulting from the extrapolation are very small. However, multiple as-sumptions were made that could affect the total amount that could be claimed and the number of families who might be eli-gible. An assumption was made that the average amount claimed would be the same for families who claimed and for those who had not. In addition, because the JLARC sample includes only able-bodied families and those represented ap-proximately two-thirds of the DSS caseload in 2002, the total population of Food Stamp and TANF recipients in 2005 was reduced by one-third for purposes of extrapolating the number of benefit recipients who may be eligible for tax credits across the State.
Survey of Clients of the Social Services System JLARC contracted with the Survey and Evaluation Research Laboratory at Virginia Commonwealth University (VCU) to conduct a telephone survey of 500 social services clients. Survey respondents were part of a sample randomly drawn by VCU from a list of all families who received Food Stamp or TANF benefits in 2002 and resided in the 15 localities visited by JLARC staff. The list of clients as well as their contact in-formation was supplied by the Virginia Department of Social Services.
The primary purpose of the survey was to obtain information that would provide additional insight into clients’ economic situation that was not available from information systems. During the 15 minute telephone interview, which was devel-oped collaboratively by JLARC and VCU staff, clients were asked questions about their experiences with the social ser-vices system, the barriers they faced in obtaining and keeping
Appendix B: Research Methods 127

jobs, and their current financial situation. The survey was ad-ministered in June and July 2005.
Case Studies of Innovative Practices Based on information gathered during site visit interviews, JLARC staff identified a few local departments that have im-plemented innovative practices to help their clients advance toward self-sufficiency. Case studies were developed to con-vey the practices that appeared to effectively supplement minimum program requirements in order to better serve clients and improve their ability to achieve self-sufficiency.
Local department staff were asked to describe any practices or programs that supplemented current policy to better serve their clients. In cases when innovative practices existed, the department also provided JLARC with literature providing de-tails about the program and performance measures, whenever possible.
Structured Interviews JLARC staff conducted structured interviews with several staff of the Virginia Department of Social Services, members of the workforce development system, and representatives from the Virginia Department of Taxation. Discussions were held with the Commissioner of Social Services and numerous DSS staff involved in the administration of benefit programs, child care subsidies, child support enforcement, and tax credit outreach initiatives. These meetings were used to gain insight into the role that the social services system currently plays with re-spect to helping clients advance toward self-sufficiency, the challenges that may prevent the system from providing clients with the level of support necessary to achieve self-sufficiency, and opportunities to enhance current practices in order to im-prove client outcomes.
Interviews were also conducted with members of the work-force development system, including the Governor’s Special Advisor on Workforce Development, and staff from the Virginia Employment Commission. These discussions were used to understand how to improve collaboration with the social ser-vices system. Finally, meetings were held with staff of the Vir-ginia Department of Taxation to discuss options for increasing the number of families who claim tax credits, and explore the feasibility of these options.
Review of Literature, Laws, and Policies JLARC staff reviewed numerous documents and literature in order to develop this report. This review served to supplement
Appendix B: Research Methods 128

and validate findings, as well as to identify other states’ best practices that could be transferred to Virginia. First, previous studies of social services clients in Virginia were reviewed to establish what was already known about client outcomes. In addition, results from studies conducted in other states and nationally were consulted. Moreover, JLARC staff reviewed literature and studies on the programs and policies of other states and communicated with staff of the National Conference of State Legislatures who focus on social services policies in order to identify best practices that could be used to better serve clients in Virginia. Finally, JLARC staff reviewed federal and State statutes, regulations, and policies related to the ma-jor benefit programs examined in this report.
Appendix B: Research Methods 129

App
endi
x CC AAccrroonnyymmss
AFDC Aid to Families with Dependent Children – Replaced by the Temporary Assistance for Needy Families (TANF) program in 1997, AFDC was a state administered financial as-sistance program for needy families established in 1935 under the Social Security Act. Funding for the program was provided at both the federal and state levels, and bene-fits for individuals seeking aid were based on the state’s standard of need as well as the recipient’s income and resources.
CAAs Community Action Agencies – Non-profit private or public organizations established under the 1964 Economic Opportunity Act to fight America’s War on Poverty. CAAs work collaboratively with businesses and other agencies and supplement the services provided by the social services system to help families meet their basic needs, allevi-ate financial difficulties, and increase their self-sufficiency. In Virginia, 26 local and three statewide CAAs assist more than 110,000 low-income Virginians every year across most localities.
CLI Credit for Low-Income Individuals – A non-refundable Virginia tax credit available for families whose total adjusted gross income is below the federal poverty line. Eligible filers can claim up to $300 for each adult and child reported as exemptions on their tax returns, but the amount of the CLI cannot exceed the family’s Virginia tax liability.
CSBs Community Services Boards – Non-profit organizations that offer low-income individu-als across Virginia comprehensive mental health, mental retardation, and substance abuse services. Social services clients are often referred to CSBs for in-depth as-sessment or treatment when barriers have been identified by their case managers.
CSBG Community Services Block Grant – One of several federal funding sources for com-munity action agencies, overseen by the Virginia Department of Social Services' Office of Community Services.
DCSE Division of Child Support Enforcement – A division of the Virginia Department of Social Services that helps custodial parents locate absent parents, establish paternity, estab-lish support orders, enforce support orders, and collect and distribute support pay-ments. In 2004, DCSE delivered child support services to 484,000 children or a quar-ter of children in Virginia.
DMAS Department of Medical Assistance Services – One of eleven agencies within Virginia‘s Health and Human Resources Secretariat, DMAS is responsible for administering the Medicaid and Family Access to Medical Insurance Security (FAMIS) programs. DMAS integrates and coordinates these programs with other State and federal programs that provide health care financial assistance and ensures that health care services are available when medically necessary.
Appendix C: Acronyms 130

DRS Department of Rehabilitative Services – A State agency that collaborates with the pub-lic and private sectors to provide services designed to help Virginians with disabilities become more independent and self-sufficient. DRS provides vocational rehabilitation to assist clients in finding and keeping jobs, helps determine disability services, and works with employers who hire disabled individuals.
DSS Virginia Department of Social Services – The State agency that provides supervision and management support to 120 local departments of social services that administer the vast majority of the 50 social service programs available in Virginia.
EITC Earned Income Tax Credit – A federal tax credit designed to reward low-income fami-lies for working, cited as the one of the largest anti-poverty measures in recent dec-ades. The EITC, established in 1975, is a refundable tax credit, meaning that families can receive the EITC even if they earn too little to owe any taxes.
FAMIS Family Access to Medical Insurance Security – Virginia’s health program implemented by the Department of Medical Assistance Services in 2000 to provide comprehensive health benefits to children under the age of 19 in families with incomes at or below 200 percent of the federal poverty line who do not have health insurance coverage and are not eligible for Medicaid.
FPL Federal Poverty Line – The level of income below which families are considered to be living in poverty. The federal measure used for statistical purposes and research, such as calculating the number of American in poverty each year. The FPL is also used to determine eligibility for several government assistance programs.
FSET Food Stamp Employment and Training – A multi-component federal employment and training program that provides job search, job search training, education, training and work experience to Food Stamp recipients who do not receive cash assistance.
GED General Education Development – A certificate that can be obtained in place of a high school diploma by passing a test that measures educational experience and achieve-ment.
I&R Virginia Information and Referral System – A statewide system that provides informa-tion and referrals for human services organizations across Virginia. In addition, a free and confidential telephone hotline is available to Virginians who are looking for ser-vices.
OEI Occupational Enterprises, Inc. – A non-profit organization that partners with 13 local departments in southwest Virginia to provide intensive case management, education, training, retraining, and counseling to participants in the Virginia Initiative for Employ-ment not Welfare (VIEW) program who are unemployed or underemployed.
SSI Supplemental Security Income – A federal income supplement program funded by general tax revenues designed to help low-income aged, blind, and disabled individu-als by providing cash assistance to meet their basic food, clothing, and shelter needs.
TANF Temporary Assistance for Needy Families – The federal program created by the Wel-fare Reform Law of 1996. TANF provides eligible families with cash assistance and work opportunities.
Appendix C: Acronyms 131
VEC Virginia Employment Commission – The State entity responsible for promoting eco-nomic growth and stability by delivering and coordinating workforce services. The VEC provides employment assistance, access to job listings, labor market information, and training through workforce centers. In addition, the VEC provides employer services such as online job listings and recruitment assistance.
VIEW Virginia Initiative for Employment not Welfare – Virginia’s employment services pro-gram for TANF recipients who are required to participate. VIEW was implemented in 1995 as part of welfare reform to assist participants in attaining self-sufficiency.
WDS Workforce Development System – A network of training and career activities for Vir-ginians. The State agencies required to collaborate within this system include the Vir-ginia Employment Commission, Virginia Community College System, Department of Education, Department for the Blind and Vision Impaired, Department for the Aging, Department of Rehabilitative Services, and Department of Social Services.
WIA Workforce Investment Act – Federal legislation created in 1998 to coordinate federal employment and training programs through a system of workforce centers. The Act empowered each state to coordinate employment and training efforts to increase the employment, retention, and earnings of low-income individuals to improve the quality of each state’s workforce and reduce welfare dependency. The Virginia Employment Commission is the fiscal agent for WIA funding.
Appendix C: Acronyms 132

App
endi
x DD TThhee SSeellff--SSuuffffiicciieennccyySSttaannddaarrdd
milomanIn S
umm
ary.
.. The Self-Sufficiency Standard is a measure of how much income is needed for a family of a given composition to meet its basic needs with-out public or private assistance. The amount of income needed is ad-justed to reflect locally-related cost-of-living differences. Use of this standard addresses concerns with the federal poverty line; it is currently being used in several states to better understand issues of income ade-quacy. This appendix provides more detailed information on the back-ground and methodology behind the Self-Sufficiency Standard.
The Self-Sufficiency Standard (the standard) quantifies in de-tail the cost of providing for a family in every Virginia locality. By providing a measure that is customized to each family’s cir-cumstances, the standard makes it possible to determine if a family’s income is sufficient to meet its basic needs without public or private assistance.
HOW THE SELF-SUFFICIENCY STANDARD DIFFERS FROM THE OFFICIAL FEDERAL POVERTY LINE
The federal poverty line (FPL) is frequently used to reflect the income level that families must exceed in order to not be living in poverty. This threshold is a multiple of the amount required to purchase food and is not based on an itemized budget for necessities that families must obtain. While the FPL varies by family size, it does not reflect cost-of-living differences across states or localities and is the same across the nation.
While both the Self-Sufficiency Standard and FPL provide a benchmark for income adequacy, the standard differs from the FPL in several ways. First, it assumes that all adults (married or single) work full-time, and consequently includes costs as-sociated with employment, such as transportation, taxes, and, for families with young children, child care.
Moreover, the standard takes into account that many costs dif-fer by family size, family composition, and children’s ages. For
Appendix D: The Self-Sufficiency Standard 133

example, while food and health care cost slightly less for younger children, child care costs are much higher.
In addition, the standard incorporates regional and local varia-tions in costs. This is particularly important for housing costs, although regional variation also occurs in child care, health care, and transportation expenditures.
Finally, the standard includes the net effect of taxes and tax credits. It provides for state sales taxes, Social Security and Medicare taxes, and federal and state income taxes. In addi-tion, three federal tax credits available to workers and their families are credited against the income needed to meet basic needs: the Earned Income Tax Credit, the Child and Depend-ent Care Tax Credit, and the Child Tax Credit.
DEVELOPERS OF THE SELF-SUFFICIENCY STANDARD The Self-Sufficiency Standard for Virginia was created through a partnership of Wider Opportunities for Women (WOW), Dr. Diana Pearce of the University of Washington, and the Action Alliance for Virginia’s Children and Youth (now VOICES for Virginia’s Children). The development of the standard is part of the national Family Economic Self-Sufficiency project, which provides state-level advocates and governments with the tools to help them strengthen government investments in low-income families. WOW and the University of Washington have worked with state-level groups in 27 states to develop Self-Sufficiency Standards.
METHODOLOGY OF THE SELF-SUFFICIENCY STANDARD The Self-Sufficiency Standard utilizes data from several sources that are collected or calculated at least annually to de-termine the amount of income working adults must have to meet their basic needs without receiving public or private sub-sidies of any kind. Basic living costs, taxes, and tax credits are estimated for each family type and combined for an overall income standard. The standard is calculated for 70 different family compositions and adjusted for cost of living in each lo-cality in the state. Costs that do not vary much by region (such as food) are standardized, while costs such as housing and child care, which vary substantially across regions, are calculated at the most geographically specific level available.
The standard is calculated in three steps: (1) the basic costs for each family type are added for each county or metropolitan statistical area, (2) ten percent of the total of basic counts is added to account for miscellaneous costs, and (3) taxes and tax credits are calculated using formulas that are specific to
Appendix D: The Self-Sufficiency Standard 134

each state’s income and sales tax policy, and these credits or deductions are applied to the standard.
Family Types Included in the Self-Sufficiency Standard
Age Categories for Family The Self-Sufficiency Standard is calculated for 70 different Member Types family types that reflect the presence and number of family
members from five categories: infants, preschoolers, school-Infant 0 - 23 months age children, teenagers, and adults. These family types in-Preschool 2 - 4 years old School-age 5 - 12 years old clude combinations of up to two adults and up to three chil-Teenager 13 - 17 years old dren, ranging from single adults with no children to two-adult Adult > 18 years old families with three teenagers.
Components of the Self-Sufficiency Standard The calculation of the standard includes eight main compo-nents:
�� Housing; Child care; � Food; �� Transportation; Health care; � Tax credits; � Taxes; and � Miscellaneous (clothing, household items, etc.).
The assumptions made to calculate each of these components are discussed in more detail below.
Housing. The standard uses Fiscal Year 2002 Fair Market Rents, which are calculated annually by the U.S. Department of Housing and Urban Development for every metropolitan sta-tistical area and non-metropolitan county in the nation. The standard assumes that parents and children do not share the same bedroom and that there are not more than two children per bedroom. Therefore, it assumes that single persons and couples without children live in one-bedroom units, families with one or two children require two bedrooms, and families with three children require three bedrooms.
Child Care. The standard uses the most recent information provided by child care providers; in Virginia, these providers are surveyed annually by the Virginia Department of Social Services (DSS). Survey results are aggregated by locality, fa-cility type (family day care, day care center, etc.), and age of child. The standard uses costs at the 75th percentile, meaning that about three-quarters of child care providers charge less than the rate used and thus can be afforded at this cost, and about one-quarter of providers charge more than this rate.
Appendix D: The Self-Sufficiency Standard 135

This methodology is consistent with that used by DSS to es-tablish child care provider reimbursement rates for the Child Care Subsidies program.
The standard assumes that:
• Infants receive full-time care in family day homes, be-cause it is more common for very young children to be in family day care homes rather than centers;
• Preschoolers go to child care centers full-time; • School-age children receive part-time care in before
and after school programs; and • Teenagers require no child care expenditures.
Food. Although the Thrifty Food Plan is used as the basis for Food Stamp allotments, the standard instead uses the Low-Cost Food Plan to estimate food costs. While both these U.S. Department of Agriculture (USDA) food plans meet minimal nutritional needs, the Low-Cost Food Plan is 25 percent higher, but still reflects a conservative estimate of food costs that does not include take-out, fast-food, or restaurant meals. Food costs are adjusted according to the number and age of the children, and the number and gender of adults in a house-hold. Since there is little regional variation in the cost of food, the standard uses the national average throughout Virginia.
Transportation. If a substantial percentage of the population in a locality uses public transportation to get to work, the stan-dard assumes that this is true of most individuals in that area. However, there are no areas in Virginia where a substantial proportion of workers use public transportation to get to and from work. Therefore, the standard assumes that adults in Virginia require their own vehicle.
Transportation costs consist of both the fixed costs of owning a car and the variable costs of operating that car on the way to and from work. The fixed costs of owning a car include insur-ance, license, registration, taxes, repairs, monthly payments, and finance charges. All fixed costs except insurance are es-timated using the Consumer Expenditure Survey amounts for families in the second lowest of five income groups. Insurance costs are estimated using survey data from the National Asso-ciation of Insurance Commissioners and the Virginia Bureau of Insurance.
Variable costs are estimated using the AAA Your Driving Costs 2000 survey, which calculates the cost of operating a vehicle per mile driven. The standard assumes that the cars are used to commute to and from work five days per week, plus one shopping and errands trip per week. The commuting
Appendix D: The Self-Sufficiency Standard 136
distance is computed using the statewide average of travel time reported in the National Personal Transportation Survey.
Health Care. To estimate health care costs, the standard as-sumes that an individual’s employer provides health insurance coverage. Health care costs used in the standard include both the employee’s share of insurance premiums plus additional out-of-pocket expenses, such as co-payments, uncovered ex-penses, and insurance deductibles.
Federal Tax Credits. The net effect of three federal tax cred-its (the Earned Income Tax Credit (EITC), Child and Depend-ent Care Tax Credit (CDCTC), and the Child Tax Credit) is also included in the Self-Sufficiency Standard. The EITC is a refundable tax credit intended to offset the loss of income from payroll taxes owed by low-income working families. Qualified working adults may receive the tax credit whether or not they owe any federal taxes. In addition, the CDCTC allows working parents to deduct a percentage of their child care costs from the federal income taxes. The CDCTC is non-refundable, meaning a family may only receive the credit if they owe fed-eral income taxes. Finally, the non-refundable Child Tax Credit provides parents a deduction of up to $600 (in 2002) per child less than 17 years old.
Miscellaneous. The standard includes a miscellaneous ex-pense category that captures all other essentials such as clothing, shoes, paper products, diapers, nonprescription medicines, cleaning products, household items, personal hy-giene items, and telephone service. However, it does not al-low for recreation, entertainment, or savings. These expenses are estimated as ten percent of all other costs.
Taxes. The standard also includes a provision for state sales tax, state and federal income taxes, and payroll taxes. The standard assumes that personal property taxes are paid by a landlord and are reflected in the cost of housing. Finally, taxes on gasoline and automobiles are included in the cost of own-ing and operating a vehicle.
Appendix D: The Self-Sufficiency Standard 137

-The Self Sufficiency Standard for Selected Localities Source: The Self-Sufficiency Standard for Virginia, July 2002.
One Adult, Two Adults, One Adult, One Preschooler, One Preschooler,
Adult One Preschooler One School-Age One School-Age
Housing $ 595 $ 693 $ 693 $ 693 City of Richmond, VA
Child Care $ - $ 347 $ 608 $ 608 Food $ 176 $ 266 $ 396 $ 544 Transportation $ 234 $ 239 $ 239 $ 457 Health Care $ 86 $ 163 $ 182 $ 222 Miscellaneous $ 109 $ 171 $ 212 $ 252 Taxes $ 309 $ 430 $ 522 $ 601 Earned Income Tax Credit (-) $ -Child Care Tax Credit (-) $ - $ (42) $ (80) $ (80)
$ (27) $ (1) $ -
Child Tax Credit (-) $ - $ (50) $ (100) $ (100) TOTAL MONTHLY NEEDS $ 1,509 $ 2,191 $ 2,670 $ 3,197 SELF-SUFFICIENCY WAGE Hourly $ 8.57 $ 12.45 $ 15.17 $ 9.08 Annual $ 18,105 $ 26,293 $ 32,045 $ 38,364
Fairfax County, VA Housing $ 804 $ 943 $ 943 $ 943 Child Care $ - $ 651 $ 1,063 $ 1,063 Food $ 176 $ 266 $ 396 $ 544 Transportation $ 240 $ 245 $ 245 $ 467 Health Care $ 107 $ 215 $ 233 $ 273 Miscellaneous $ 133 $ 232 $ 288 $ 329 Taxes $ 411 $ 712 $ 860 $ 933 Earned Income Tax Credit (-) $ - $ - $ - $ -Child Care Tax Credit (-) $ - $ (40) $ (80) $ (80) Child Tax Credit (-) $ - $ (50) $ (100) $ (100) TOTAL MONTHLY NEEDS $ 1,870 $ 3,173 $ 3,849 $ 4,372 SELF-SUFFICIENCY WAGE Hourly $ 10.63 $ 18.03 $ 21.87 $ 12.42 Annual $ 22,441 $ 38,080 $ 46,185 $ 52,468
Washington County, VA Housing $ 381 $ 471 $ 471 $ 471 Child Care $ - $ 260 $ 434 $ 434 Food $ 176 $ 266 $ 396 $ 544 Transportation $ 226 $ 232 $ 232 $ 441 Health Care $ 78 $ 145 $ 164 $ 203 Miscellaneous $ 86 $ 137 $ 170 $ 209 Taxes $ 212 $ 241 $ 215 $ 402 Earned Income Tax Credit (-) $ - $ (134) $ (200) $ (40) Child Care Tax Credit (-) $ - $ (50) $ (67) $ (80) Child Tax Credit (-) $ - $ (50) $ (89) $ (100) TOTAL MONTHLY NEEDS $ 1,159 $ 1,518 $ 1,724 $ 2,485 SELF-SUFFICIENCY WAGE Hourly $ 6.58 $ 8.62 $ 9.80 $ 7.06 Annual $ 13,905 $ 18,214 $ 20,692 $ 29,818
Appendix D: The Self-Sufficiency Standard 138

App
endi
x
EE AAggeennccyy RReessppoonnssee
As a part of the extensive validation process, State agencies and other entities involved in a JLARC assessment effort are given the opportunity to comment on an exposure draft of the report. Appropriate technical corrections resulting from com-ments provided by these entities have been made in this ver-sion of the report. This appendix includes the written response of the Virginia Department of Social Services.
Appendix E: Agency Response 139

Appendix E: Agency Response 140

7 North 8th Street • Richmond, VA, 23219-3301 http://www.dss.state.va.us
December 5, 2005
Mr. Philip A. Leone, Director Joint Legislative Audit and Review Commission General Assembly Building Richmond, VA 23219
Dear Mr. Leone:
The following is the response of the Virginia Department of Social Services (VDSS) to the staff report of the Joint Legislative Audit and Review Commission (JLARC) on “Self-Sufficiency Among Social Services Clients in Virginia.” Those of us who work in human services appreciate the complexity of this subject and, because we do understand its complexity, we appreciate the work done by the JLARC staff in preparing such a comprehensive and cogent report. We also appreciate the opportunity to comment on the report.
JLARC staff did an excellent job assessing the Virginia Social Services System’s efforts as they relate to a helping Virginians attain self-sufficiency. The findings and recommendations of this report align with the vision and mission of the Virginia Social Services System (VSSS). VDSS and the broader social services system is committed to helping low-income Virginians move toward and achieve self-sufficiency, and there are a number of initiatives underway to support this important goal.
As mentioned in the report, the combination of programs that constitute Virginia’s safety net have not been structured by the various levels of government to help individuals attain self-sufficiency. Instead, each program may embrace more specific goals and strategies and there are laws, regulations, and funding vehicles to ensure that the specific intent of the program is met. The analysis in the report demonstrates that the safety net programs help low-income Virginians maintain a minimum standard of living that may be inadequate and may not be constructed in such a fashion to lead to an outcome of self-sufficiency. Ideally, public policies that serve low-income individuals would be structured to embrace a measure of self-sufficiency instead of measures of minimum adequacy.
Given the current legal environment, the recommendations outlined in this study offer concrete and achievable steps toward helping more Virginians become self-sufficient. In particular, statutory changes and budget increases for child care and workforce development
• (804) 726-7000 • TDD 1-800-828-1120

Mr. Philip A. Leone December 5, 2005 Page 2
activities would go a long way in helping Virginians attain self-sufficiency. Other significant factors that should be considered are wages and job availability. Individuals working full time at minimum wage still expose families to being below the poverty line and well below a standard of self-sufficiency. Jobs paying at or slightly above the minimum wage will continue to exist, evenin the knowledge economy into which Virginia and all states are entering. As long as full-timeemployment does not pay a self-sufficient wage, there will be significant numbers of households in Virginia where self-sufficiency may not be attainable and for which the safety net will help them meet their basic human needs. Similarly, the creative destruction of jobs always leaves certain communities with high unemployment rates, and any measure of success in moving individuals toward self-sufficiency needs to account for geographic differences based on employment.
The recommendations to continue improving coordination and collaboration with One Stop Career Centers and other workforce system partners are also in line with our current efforts. In conjunction with the Virginia Employment Commission (VEC), the Department is forming technical assistance teams to work with local Workforce Investment Boards (WIBs) and departments of social services that do not have a signed memorandum of understanding. Additionally, the best practices in coordination found in select communities throughout the state will be used to help improve the quality of the existing agreements. In particular, we support the recommendation of using the labor market information analysis and tools developed by the VEC as well as Workforce Investment Act (WIA) training dollars for social services participants to upgrade their skills for demand occupations.
As recognized in the study, VDSS has purchased an update of the self-sufficiency standard and plans to conduct ongoing analysis similar to the good work done for this report. The report’s longitudinal analysis exploring the employment and public benefit participation dynamics of social services participants provides an important starting point for the Department’s own ongoing analysis planned for when the update of the self-sufficiency standard is complete this winter. The Department plans on measuring our participants’ progress toward self-sufficiency and is committed to continuing existing and implementing new strategies to improve this important success outcome. If granted the resources again in this upcoming budget, the Department will continue its job retention and wage advancement contracts that have been successful in helping Virginia’s current and former TANF participants progress in the labor market and have been a significant asset in helping Virginia earn the number one national ranking for job placement and number two national ranking for job retention for its TANF participants.
On a cautionary note, it should be recognized that a shift away from quick labor market attachment currently mandated by state Code may reduce the strong job placement outcomes. Hopefully, the trade-off is better long-term wages for participants as any delay in their employment is a delay in helping them attain a better quality of life for their families. It is important to recognize that Virginia pays less in cash assistance benefits than almost every other state and has one of the highest earned income disregards, meaning that the extremely poor families participating in the TANF program are significantly better off the day they get a job.
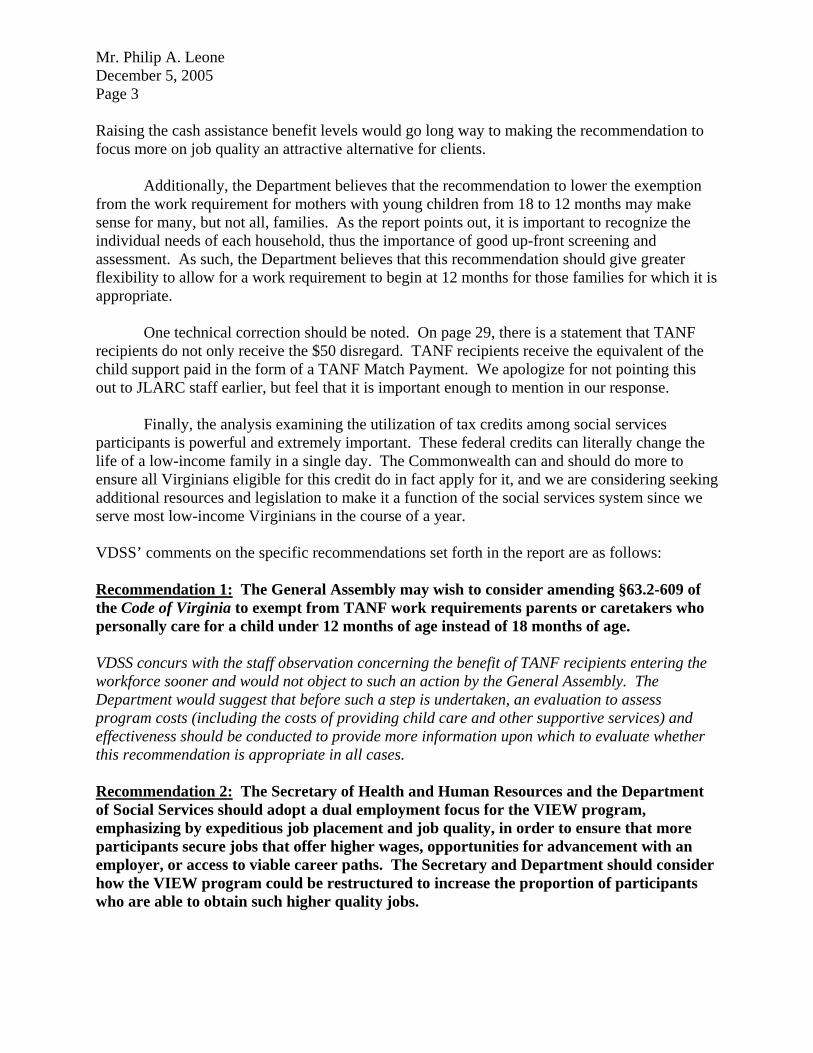
Mr. Philip A. Leone December 5, 2005 Page 3
Raising the cash assistance benefit levels would go long way to making the recommendation to focus more on job quality an attractive alternative for clients.
Additionally, the Department believes that the recommendation to lower the exemption from the work requirement for mothers with young children from 18 to 12 months may make sense for many, but not all, families. As the report points out, it is important to recognize the individual needs of each household, thus the importance of good up-front screening and assessment. As such, the Department believes that this recommendation should give greater flexibility to allow for a work requirement to begin at 12 months for those families for which it is appropriate.
One technical correction should be noted. On page 29, there is a statement that TANF recipients do not only receive the $50 disregard. TANF recipients receive the equivalent of the child support paid in the form of a TANF Match Payment. We apologize for not pointing this out to JLARC staff earlier, but feel that it is important enough to mention in our response.
Finally, the analysis examining the utilization of tax credits among social services participants is powerful and extremely important. These federal credits can literally change the life of a low-income family in a single day. The Commonwealth can and should do more to ensure all Virginians eligible for this credit do in fact apply for it, and we are considering seeking additional resources and legislation to make it a function of the social services system since we serve most low-income Virginians in the course of a year.
VDSS’ comments on the specific recommendations set forth in the report are as follows:
Recommendation 1: The General Assembly may wish to consider amending §63.2-609 of the Code of Virginia to exempt from TANF work requirements parents or caretakers who personally care for a child under 12 months of age instead of 18 months of age.
VDSS concurs with the staff observation concerning the benefit of TANF recipients entering the workforce sooner and would not object to such an action by the General Assembly. The Department would suggest that before such a step is undertaken, an evaluation to assess program costs (including the costs of providing child care and other supportive services) and effectiveness should be conducted to provide more information upon which to evaluate whether this recommendation is appropriate in all cases.
Recommendation 2: The Secretary of Health and Human Resources and the Department of Social Services should adopt a dual employment focus for the VIEW program, emphasizing by expeditious job placement and job quality, in order to ensure that more participants secure jobs that offer higher wages, opportunities for advancement with an employer, or access to viable career paths. The Secretary and Department should consider how the VIEW program could be restructured to increase the proportion of participants who are able to obtain such higher quality jobs.

Mr. Philip A. Leone December 5, 2005 Page 4
VDSS certainly agrees with the intent and spirit of the staff recommendation and, to the degree necessary, will work with the Secretary of Health and Human Resources and other interested parties to accomplish the desirable end result as articulated in the recommendation. VDSS does observe, however, that job placement, irrespective of the nature of the job, should be a first step. Once the participant is in a job that provides a steady income stream, then movement to jobs that provide a higher quality of work life should be a primary objective.
Recommendation 3: The Secretaries of Health and Human Resources and Commerce and Trade should consider what factors have limited effective collaboration between the social services and the Virginia Workforce Network and what measures can be taken to develop an effective partnership in order to provide more VIEW participants with existinginformation about job opportunities and career development.
VDSS concurs with the staff recommendation and is willing to work with agencies in both Secretariats to promote job opportunities and career development.
Recommendation 4: The General Assembly may wish to consider establishing a pilot program in which the statutory requirement placing priority on obtaining full-time employment would be waived and VIEW participants would be allowed the flexibility to divide their 30-hour participation requirement between work and up to ten hours of training or education.
VDSS concurs with the staff recommendation and would not object to such an action by the General Assembly. VDSS would further recommend that the training or education be of a nature that would realistically enhance the participant’s ability to obtain a higher quality job as envisioned by the staff in Recommendation 2.
Recommendation 5: The Virginia Department of Social Services should (1) encourage local departments to raise awareness of workforce center services among VIEW participants; and (2) require the development of a long-term education and training plan for all VIEW participants.
VDSS concurs with the recommendation and will work toward encouraging all of its partners in the Virginia Social Services System (VSSS) to work toward raising the awareness of VIEW participants. VDSS will also work with its partners to attempt to arrive at a methodology for developing realistic educational and training plans for VIEW participants.
Recommendation 6: The Secretaries of Health and Human Resources, Commerce and Trade, and Education should consider measures the State can take to increase short-term training programs through workforce centers or other entities that would be available to current and former clients of the social services system to enhance their skills and provide them with a greater opportunity to obtain quality jobs.
VDSS concurs with the staff recommendation and is willing to work with agencies in the three Secretariats to promote job opportunities and career development.

Mr. Philip A. Leone December 5, 2005 Page 5
Recommendation 7: The Virginia General Assembly may wish to consider whether the Code of Virginia should be amended to require participants in the Food Stamp and Child Care Subsidy programs to cooperate with the Division of Child Support Enforcement as a condition of program participation, as is currently required of participants of the TANF program.
VDSS would not object to such an action by the General Assembly, but would caution the General Assembly to grant the Department authority commensurate with any additional responsibilities.
Recommendation 8: The Secretary of Health and Human Resources and the Department of Social Services should develop a pilot project in which the intensity of services provided through the Food Stamp Employment and Training program would be increased to the level provided through the VIEW program, and participation would be expanded to all Food Stamp recipients who choose to volunteer for the program. The pilot projects should include an evaluation component to assess program costs and effectiveness, and to provide a basis upon which to evaluate whether statewide expansion should be pursued.
VDSS does not object to a pilot and would be eager to participate.
Recommendation 9: The Secretaries of Health and Human Services and Commerce and Trade should consider what factors have limited effective collaboration between the social services and the Virginia Workforce Network, and what measures can be taken to develop an effective partnership in order to provide more non-VIEW clients with (1) existing information about job opportunities and career development; and (2) career guidance, and access to training and education that are not available through the social services system.
VDSS concurs with the staff recommendation and is willing to work with agencies in both Secretariats to promote job opportunities and career development.
Recommendation 10: The Virginia General Assembly may wish to consider amending the Code of Virginia to require the Virginia Department of Taxation to obtain from taxpayers who file a Virginia individual income tax return the following information: (1) whether they claimed the federal Earned Income Tax Credit, and (2) the amount claimed.
VDSS recognizes and concurs that the Earned Income Tax Credit is a powerful tool in helping to make low income Virginians self sufficient. We are very pleased that JLARC is championing the use of its tool through its recommendations and are willing to work with other agencies of the Commonwealth as well as our partners in the VSSS to enable more Virginians to have access to the Credit.
Recommendation 11: The Virginia General Assembly may wish to consider amending §58.1-3 of the Code of Virginia to authorize the Tax Commissioner to share with the

Mr. Philip A. Leone December 5, 2005 Page 6
Department of Social Services information about its clients’ income, filing status, and number and type of dependents, and whether they have claimed the federal Earned Income Tax Credit.
As stated above, VDSS recognizes and concurs that the Earned Income Tax Credit is a powerful tool in helping to make low income Virginians self sufficient. We are very pleased that JLARC is championing the use of its tool through its recommendations and are willing to work with other agencies of the Commonwealth as well as our partners in the VSSS to enable more Virginians to have access to the Credit.
Recommendation 12: The Secretary of Health and Human Resources and the Virginia Department of Social Services should continue to make Earned Income Tax Credit outreach an agency priority. The State Department of Social Services should allocate existing State staff as needed to make the necessary contacts with families who may be eligible for the federal tax credit and to recruit volunteers who can provide tax preparation support to those filers seeking to claim the credit. The Department of Social Services should develop and present a plan for conducting this outreach to the House Appropriations Committee and Senate Finance Committee by September 1, 2006, and begin outreach efforts for the 2006 tax year.
As previously stated, VDSS recognizes and concurs that the Earned Income Tax Credit is a powerful tool in helping to make low income Virginians self sufficient. We are very pleased that JLARC is championing the use of its tool through its recommendations and are willing to work with other agencies of the Commonwealth as well as our partners in the VSSS to enable more Virginians to have access to the Credit.
The self sufficiency of Virginia’s families is a necessary goal to make the Commonwealth a leader in providing a desirable quality of life to its citizens. This report is a valuable tool in recognizing incremental steps that can be taken to bring more families to self sufficiency and the Department and its partners in the VSSS stand ready to make the recommendations in this report a reality. Again, I applaud your staff in their forthright analysis of this difficult issue, their thoughtful recommendations and the professional manner in which they conducted this study.
As always, I am available to discuss our comments with you.
Sincerely,
Anthony Conyers, Jr. Commissioner
c: The Honorable Jane H. Woods Secretary of Health and Human Resources

JJLLAARRCC SSttaaffff
Executive Staff
Philip A. Leone, Director Glen S. Tittermary, Deputy Director
Division Chiefs
Robert B. Rotz, Senior Division Chief Harold E. Greer III, Division Chief
Section Managers
Patricia S. Bishop, Fiscal & Administrative Services Gregory J. Rest, Research Methods Walter L. Smiley, Fiscal Analysis
Project Leaders
Aris W. Bearse Ashley S. Colvin Justin C. Brown Martha L. Erwin
Eric H. Messick Nathalie Molliet-Ribet Kimberly A. Sarte
Project Staff
Janice G. Baab Jamie S. Bitz Jennifer Breidenbaugh M. Angela Coleman Eileen T. Fleck Paula C. Lambert Brad B. Marsh
Ellen J. Miller Jason W. Powell Tracey R. Smith Elisabeth M. Thomson Christine D. Wolfe Kent S. Wyatt
Administrative and Research Support Staff
Joan M. Irby Betsy M. Jackson
RReecceenntt JJLLAARRCC RReeppoorrttss
Interim Report: Best Practices for the Support Service of School Divisions, December 2002 Special Report: Higher Education, November 2002 Special Report: Medical Supplies and Pharmaceuticals, December 2002 VRS Semi-Annual Investment Report No. 19, December 2002 The Future of the Chesapeake Bay Bridge-Tunnel, January 2003 Review of Information Technology Systems Development, January 2003 Review of the Virginia Birth-Related Neurological Injury Compensation Program, January 2003 Review of Workforce Training in Virginia, January 2003 Review of the Charitable Gaming Commission, January 2003 Implementation of the Chesapeake Bay Preservation Act, January 2003 Special Report: State Spending on Regional Health Planning Agencies, June 2003 2003 Report to the General Assembly, September 2003 Technical Report: State Funding Formula for Educational Technology, September 2003 Review of State Spending: December 2003 Update Implementation Review: Virginia Information Technologies Agency, December 2003 Status Report Review of Virginia’s Activity in Maximizing Federal Grant Funding, December 2003 Semi-Annual VRS Investment Report No. 21, December 2003 Best Practices for the Support Services of School Divisions, January 2004 Acclimation of Virginia’s Foreign-Born Population, January 2004 Review of the State’s Passenger Vehicle Fleet, January 2004 Review of Factors and Practices Associated with School Performance in Virginia, January 2004 Benchmarks: Virginia Compared to the Other States, July 2004 Tenure and Post-Tenure Review Policies at Virginia’s Public Colleges and Universities, August 2004 Special Report: Impact of Proposed Child Day Care Center Regulations in Virginia, September 2004 Replacing Income Tax Revenues with Sales and Use Tax Revenues, November 2004 Interim Status Report: Impact of Virginia’s Aging Population on State Agency Services, November 2004 Review of Emergency Medical Services in Virginia, November 2004 The Use and Financing of Trauma Centers in Virginia, December 2004 Review of State Spending: December 2004 Update VRS Biennial Status and Semi-Annual Investment Report, No. 23, December 2004 Special Report: State Spending on Standards of Quality Costs, December 2004 Review of Nutrient Management Planning in Virginia, January 2005 Review of Child Protective Services in Virginia, January 2005 Semi-Annual VRS Investment Report # 24, July 2005 Special Report: Certain Personnel Issues at VRS, July 2005 2005 Biennial Report to the General Assembly, September 2005 Review of Homeland Security Funding and Preparedness, September 2005 Operation and Performance of Virginia’s Social Services System, October 2005 Assessment of Reimbursement Rates for Medicaid Home and Community-Based Services, October 2005 Review of Land Application of Biosolids in Virginia, November 2005 Interim Report: Impact of Assisted Living Facility Regulations, November 2005 Virginia Compared to the Other States: A Compendium of State Statistics, December 2005 Impact of an Aging Population on State Agencies, January 2006 Impact of an Aging State Workforce, January 2006 Self-Sufficiency Among Social Services Clients in Virginia, January 2006
JLARC Home Page: http://jlarc.state.va.us

JLARCSuite 1100
General Assembly BuildingCapitol Square
Richmond, Virginia 23219(804) 786-1258 Fax: 371-0101
http://jlarc.state.va.us