self-orienting nanocubes for the assembly of plasmonic
TRANSCRIPT

SUPPLEMENTARY INFORMATIONDOI: 10.1038/NNANO.2012.83
NATURE NANOTECHNOLOGY | www.nature.com/naturenanotechnology 11
Self-Orienting Nanocubes for the Assembly of Plasmonic Nanojunctions Bo Gao, Gaurav Arya, and Andrea R. Tao*
1. Nanoparticle-Polymer Film Fabrication
Nanocube synthesis. Silver nanocubes were synthesized using a previously reported polyol reaction [1,
2]. The AgNO3 precursor solution was prepared by sonicating 0.20 g AgNO3 and 40 µL of 0.043 M CuCl2
solution in 5 mL of 1,5‐pentanediol until all the salt crystals were dissolved. 0.10 g PVP was dissolved in
5 mL pentanediol as precursor solution. The reaction solution was prepared by heating 20 mL pentanediol
in a 100 mL glass round bottom flask under continuous stirring in an oil bath heated to 193°C. The
AgNO3 and PVP precursor solutions were alternately injected into the hot pentanediol at a rate of 500
µL/min and 320 µL/30 s, respectively. The injections were continued until the solution turned an opaque
yellow color (after approximately 6 minutes). The nanocrystal solution was then characterized by UV-Vis
spectroscopy using an Agilent Chemstation 8453. The as-made nanocrystal dispersions were diluted to a
total volume of 50 mL using absolute ethanol and then centrifuged at 2500 rpm for 10 minutes (CL2,
Thermo Scientific). The supernatant was further diluted to a 1:2 mixture of deionized water and ethanol to
obtain a total dispersion volume of approximately 150 mL. This solution was then filtered through
membranes with decreasing pores sizes (0.65 and 0.22 µm PVDF hydrophilic Durapore filters, Millipore)
to remove silver nanowires and large nanocrystals. The final solution was then centrifuged and
redispersed at the desired concentration in ethanol.
Film fabrication and annealing conditions. Silicon and quartz substrates were further cleaned in a
freshly prepared piranha solution of 70% (v) concentrated H2SO4 and 30% (v) H2O2. The substrates were
then treated with hexamethyldisilazane vapor at room temperature for 2hrs to obtain hydrophobic
surfaces. Polystyrene was dissolved in a toluene solution at a concentration of 3 wt. % followed by
© 2012 Macmillan Publishers Limited. All rights reserved.

2
filtering through a membrane with a 0.02 um pore size. Polymer thin films were prepared by spin coating
the filtered polymer solutions at 2000 rpm for 40s using a spin processor (WS-400A-6NPP/LITE)
manufactured by Laurell Technologies Corp. Film thickness was measured by scratching the film and
measuring the height profile by AFM. To prepare the composite film, nanocrystals were precipitated in a
small amount of ethanol (~100 µl) before diluting with 1–2 ml CHCl3. A glass petri dish was thoroughly
rinsed with ethanol and DI water. The colloidal nanocrystal solution was then added dropwise to the air–
water interface of the petri dish, leaving an isotropically distributed monolayer of NCs floating at the air–
water interface. After the desired amount of colloidal solution was added, the film was allowed to
equilibrate for about 15 min. Nanocrystal monolayers were then transferred onto the polystyrene films by
dip-coating.
Nanoparticles are then embedded into the underlying polymer by thermal annealing (T>Tg) or
solvent vapor treatment at room temperature, which allows the polystyrene chains at the top of the film to
rearrange around the sinking nanoparticle. Solvent annealing was carried out by exposing the polymer
film to chloroform vapor in a closed vessel treatment at room temperature. Thermal annealing was carried
out by heating the polymer films in ambient conditions at a temperature above the glass transition
temperature of the matrix polymer, typically in the range of 95-120°C in an oven or on a hot plate. For the
two-step annealing process used to convert EE-oriented nanocubes to FF-oriented nanocubes, the polymer
film samples are first exposed to chloroform to form EE assemblies with a desired domain size before
carrying out thermal annealing for 4 hours at 120°C.
Sample characterization. Nanoparticle assembly was characterized by scanning electron microscopy
(SEM) using a FEI UHR Field Emission SEM equipped with a field emission cathode with a lateral
resolution of approximately 2 nm. The acceleration voltage was chosen between 5 and 30 kV. Cross-
sectional samples were prepared by sputtering a thin layer of Cr on top of the polymer surface followed
by diamond scribing of the film support. Surface topologies of films were characterized with an atomic
force microscope (Veeco, Multimode scope with a Nanoscope IV controller) operating in the tapping
© 2012 Macmillan Publishers Limited. All rights reserved.

3
mode. Roughness and line scan analyses were then used to characterize these surfaces. The raw data was
processed with the Nanoscope IV software by a third-order plane fit and second order flattening. Silicon
cantilevers were chosen (NSC, Mikromasch) with a resonance frequency around 300-400 kHz and a
typical spring constant near 40 N/m. The plasmonic response of the nanoparticle assembly was
characterized by measuring the optical transmission of the nanocomposite film deposited on a transparent
quartz substrate.
© 2012 Macmillan Publishers Limited. All rights reserved.

4
2. Nanoparticle Chain Formation
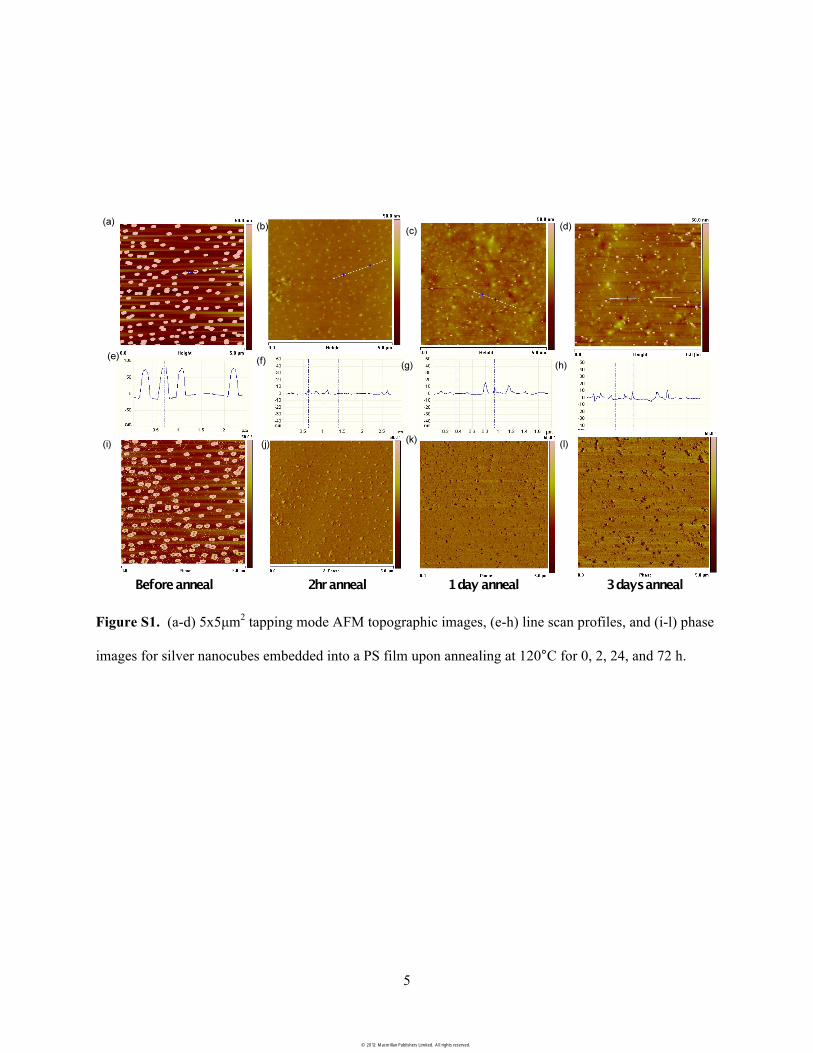
Atomic force microscopy (AFM) topology and phase imaging indicate that upon thermal annealing
(T≈100⁰C) for two hours, the nanoparticles are fully embedded in the PS film (Fig. S1). Particle
migration to the PS/support interface is prevented by rendering the underlying solid support hydrophobic.
For a film that has been thermal annealed for 120 minutes, AFM analysis indicates that the cubes are
completely embedded into the polymer matrix but do not undergo lateral diffusion to form strings. (Fig.
S1) After 24 hours of annealing, cross-sectional SEM images confirm that the nanoparticles assemble into
strings but remain completely embedded in the matrix polymer near the PS/air interface (Fig. S2). The
corresponding optical spectrum exhibits SP modes that correlate to isotropically distributed, isolated
nanocubes. Upon further annealing, demixing of the nanoparticle/polymer blend occurs and nanocubes
assemble into chains uniformly over extended areas (> 1 cm2) limited only by the initial area of particle
deposition.
Because spinodal decomposition is a non-equilibrium process, the rate and extent of nanoparticle
assembly is strongly dependent on the diffusion kinetics of particles through the polymer matrix. Higher
nanoparticle densities (>20 cubes/µm2) and lower polymer viscosities result in faster chain formation and
growth. Meta-stable nanoparticle configurations are trapped by freezing the matrix polymer and halting
particle mobility. The one-dimensional particle chains form in a convergent manner, first through the
formation of small nanocube dimers and trimers that coalesce to form longer chain-like structures. These
nanoparticle chains continue to merge, giving rise to branched and bifurcating chains. The resulting
pattern is reminiscent of classical polymer-polymer spinodal decomposition, where elongation, branching,
and bending of condensed periodic phases indicate competition between attractive and repulsive forces.
© 2012 Macmillan Publishers Limited. All rights reserved.
5
Figure S1. (a-d) 5x5µm2 tapping mode AFM topographic images, (e-h) line scan profiles, and (i-l) phase
images for silver nanocubes embedded into a PS film upon annealing at 120°C for 0, 2, 24, and 72 h.
© 2012 Macmillan Publishers Limited. All rights reserved.

6
Figure S2. Cross-sectional SEM image of nanocubes embedded in a PS film after 24 h of annealing at
120°C.
© 2012 Macmillan Publishers Limited. All rights reserved.

7
3. Computational Methods
Coarse-grained modeling of nanoparticles. We aim to model the interactions between two polymer-
grafted silver nanocubes of edge length 80 nm dispersed within a polymer matrix. However, since a fully
atomistic treatment of the above system is computationally prohibitive due to the large system size and
sluggish dynamics of the polymers, we choose to use a coarse-grained representation of the nanocubes.
Also, many details of the experimental system remain unknown: for example, the surface grafting density
of chains and their lengths and the molecular interactions between the grafted chains, the matrix polymer,
and the silver surface are not known. To further alleviate computational effort, we examine smaller
nanocubes of size l = 10 nm. Results from these smaller nanocubes can then be extrapolated to the case of
80-nm nanocubes without much loss in accuracy through appropriate use of boundary conditions and
scaling relations, as discussed later. This methodology allows us to capture the relevant qualitative trends
for guiding our experimental efforts.
In our model, the silver nanocubes are treated as cubic lattices, each containing ns = 15,625 silver
atoms. The cube thus represents a 10nm × 10nm × 10nm section of the experimental 80nm × 80nm ×
80nm nanocube (Fig. S3). Accordingly, the two nanocubes in face-to-face (FF) orientation are grafted
with polymer chains on the two sides facing each other while the nanocubes in the edge-to-edge (EE)
orientation are grafted with chains on the four sides facing each other. Each of these “facing” surfaces is
grafted with 4 polymer chains, yielding a grafting density of 0.04 chains/nm2 and a total of nc = 8 and 16
chains for the FF and EE configurations, respectively. The grafted chains are treated as coarse-grained
bead-chains [3,4] comprising of L = 4 to 16 beads, depending on the chain lengths being studied. Our
model does not explicitly include matrix polymer chains. Instead, it implicitly accounts for the
interactions between the matrix chains and the grafted chains through the use of “effective” interactions
between the grafted chains, in similar spirit as the Flory-Huggins χ parameter. We employ periodic
boundary conditions (PBCs) to mimic both the remaining portion of the nanocube and the polymer chains
© 2012 Macmillan Publishers Limited. All rights reserved.
8
attached to it, as illustrated in Fig. S3. Thus, for the FF orientation, we employ PBCs in the two directions
along the facing surface (along y and z axes in Fig. S3A), while for the EE orientation, we employ PBCs
only in the direction along the facing edges (along z axis in Fig. S3B).
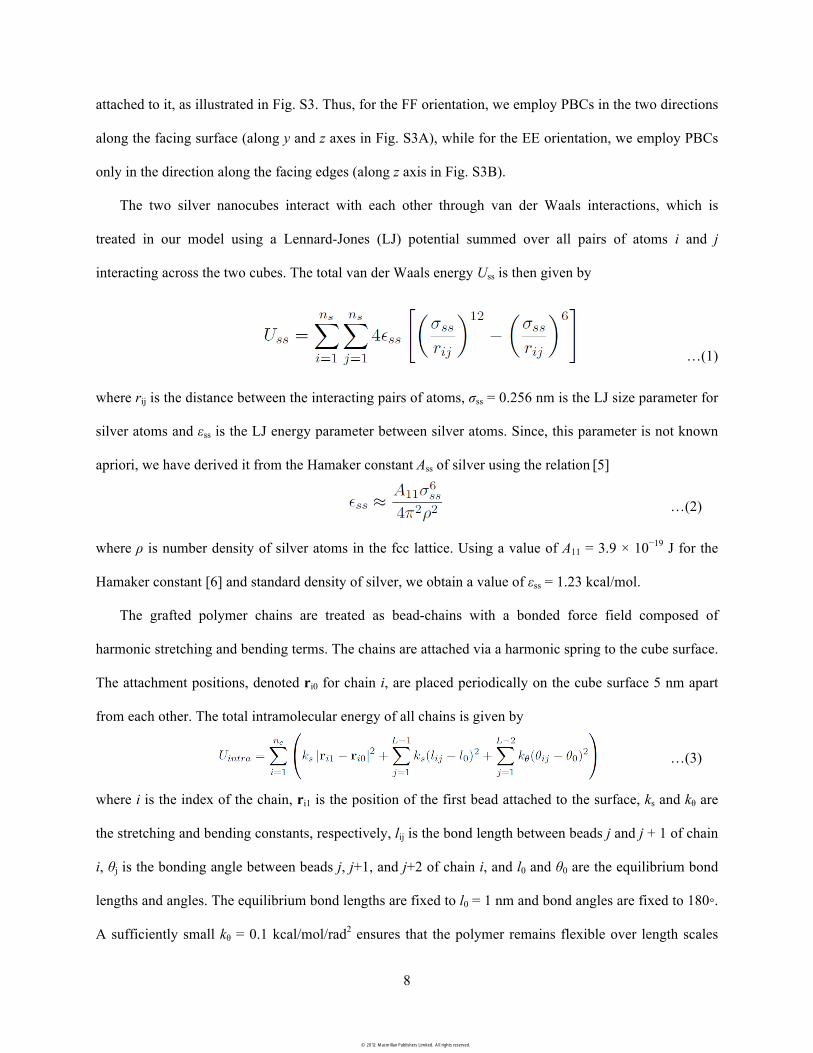
The two silver nanocubes interact with each other through van der Waals interactions, which is
treated in our model using a Lennard-Jones (LJ) potential summed over all pairs of atoms i and j
interacting across the two cubes. The total van der Waals energy Uss is then given by
…(1)
where rij is the distance between the interacting pairs of atoms, σss = 0.256 nm is the LJ size parameter for
silver atoms and εss is the LJ energy parameter between silver atoms. Since, this parameter is not known
apriori, we have derived it from the Hamaker constant Ass of silver using the relation [5]
…(2)
where ρ is number density of silver atoms in the fcc lattice. Using a value of A11 = 3.9 × 10⁻¹⁹ J for the
Hamaker constant [6] and standard density of silver, we obtain a value of εss = 1.23 kcal/mol.
The grafted polymer chains are treated as bead-chains with a bonded force field composed of
harmonic stretching and bending terms. The chains are attached via a harmonic spring to the cube surface.
The attachment positions, denoted ri0 for chain i, are placed periodically on the cube surface 5 nm apart
from each other. The total intramolecular energy of all chains is given by
…(3)
where i is the index of the chain, ri1 is the position of the first bead attached to the surface, ks and kθ are
the stretching and bending constants, respectively, lij is the bond length between beads j and j + 1 of chain
i, θj is the bonding angle between beads j, j+1, and j+2 of chain i, and l0 and θ0 are the equilibrium bond
lengths and angles. The equilibrium bond lengths are fixed to l0 = 1 nm and bond angles are fixed to 180◦.
A sufficiently small kθ = 0.1 kcal/mol/rad2 ensures that the polymer remains flexible over length scales
© 2012 Macmillan Publishers Limited. All rights reserved.
9
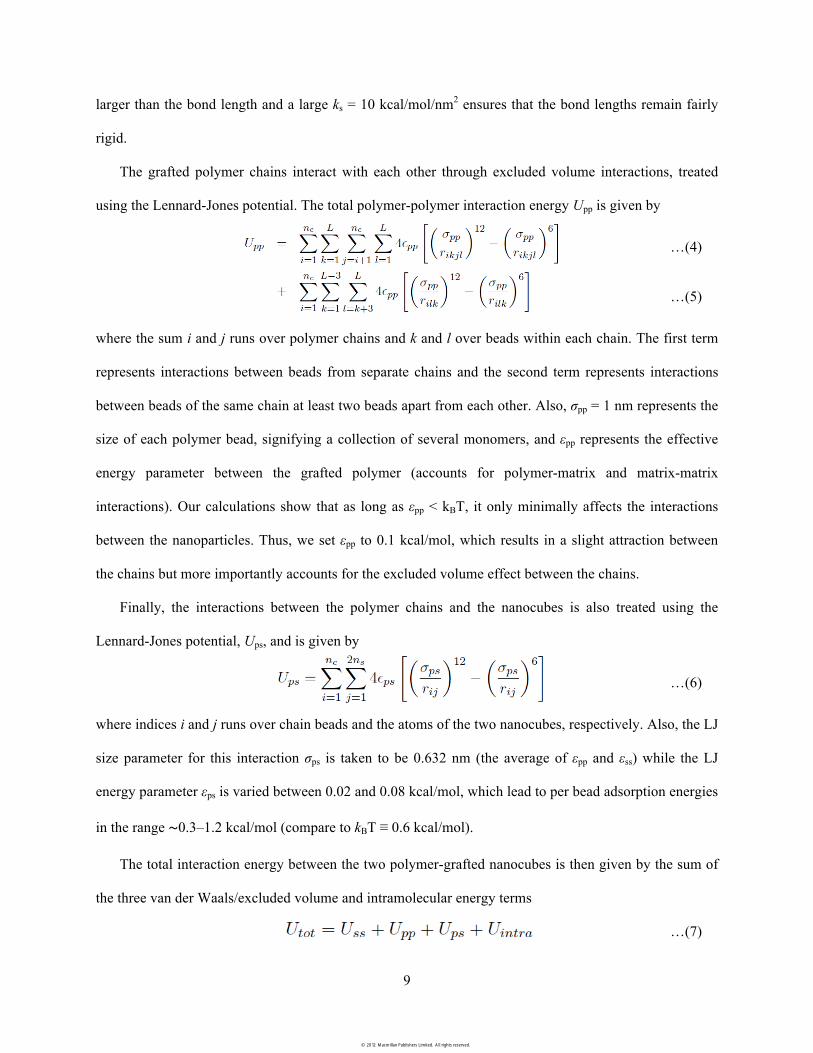
larger than the bond length and a large ks = 10 kcal/mol/nm2 ensures that the bond lengths remain fairly
rigid.
The grafted polymer chains interact with each other through excluded volume interactions, treated
using the Lennard-Jones potential. The total polymer-polymer interaction energy Upp is given by
…(4)
…(5)
where the sum i and j runs over polymer chains and k and l over beads within each chain. The first term
represents interactions between beads from separate chains and the second term represents interactions
between beads of the same chain at least two beads apart from each other. Also, σpp = 1 nm represents the
size of each polymer bead, signifying a collection of several monomers, and εpp represents the effective
energy parameter between the grafted polymer (accounts for polymer-matrix and matrix-matrix
interactions). Our calculations show that as long as εpp < kBT, it only minimally affects the interactions
between the nanoparticles. Thus, we set εpp to 0.1 kcal/mol, which results in a slight attraction between
the chains but more importantly accounts for the excluded volume effect between the chains.
Finally, the interactions between the polymer chains and the nanocubes is also treated using the
Lennard-Jones potential, Ups, and is given by
…(6)
where indices i and j runs over chain beads and the atoms of the two nanocubes, respectively. Also, the LJ
size parameter for this interaction σps is taken to be 0.632 nm (the average of εpp and εss) while the LJ
energy parameter εps is varied between 0.02 and 0.08 kcal/mol, which lead to per bead adsorption energies
in the range ∼0.3–1.2 kcal/mol (compare to kBT ≡ 0.6 kcal/mol).
The total interaction energy between the two polymer-grafted nanocubes is then given by the sum of
the three van der Waals/excluded volume and intramolecular energy terms
…(7)
© 2012 Macmillan Publishers Limited. All rights reserved.

10
The above force field is employed in our Monte Carlo simulation to compute the average potential energy
of our two-nanocube system at varying separation distances. This force field is also used to compute the
average force experienced by one of the particles, which is then used to compute the “effective” free
energy of interaction between the particles, i.e., the potential of mean force.
Potential of mean force calculations. To determine the most favorable relative orientation of polymer-
grafted nanocubes assembled as dimers, we compute the potential of mean force (PMF) between two
polymer-grafted Silver nanocubes. We compute the PMF W(d,θ) as a function of nanocube center-to-
center distance d and relative orientations θ (angle subtended by the interacting nanocube faces). We
consider two main orientations: FF with θ = 0 and EE with θ = π/2, as shown in Fig. S3. The PMF is
computed by integrating the average force 〈F(d,θ)〉 experienced by the nanocube along the center-to-
center line:[7]
…(8)
The average force is computed as the ensemble average over all configurational degrees of freedom of the
grafted chains Ω[3,4]
…(9)
where Utot is the total energy computed using Eqs. (1-7). To compute the right hand side of Eq. (9), we
generate Boltzmann distributed configurations of the two colloids at fixed relative orientation for each
separation distance d using Monte Carlo (MC) simulations at a fixed temperature of 300 K. The MC
simulations comprise of “chain regrowth” moves, where the polymer chain is randomly chosen and
regrown from scratch using the configurational bias MC approach.[8-10] The regrown chain is then
accepted with the Rosenbluth acceptance criterion:
…(10)
where Wold and Wnew are the Rosenbluth weights of the original and regrown chain, respectively.
© 2012 Macmillan Publishers Limited. All rights reserved.
11
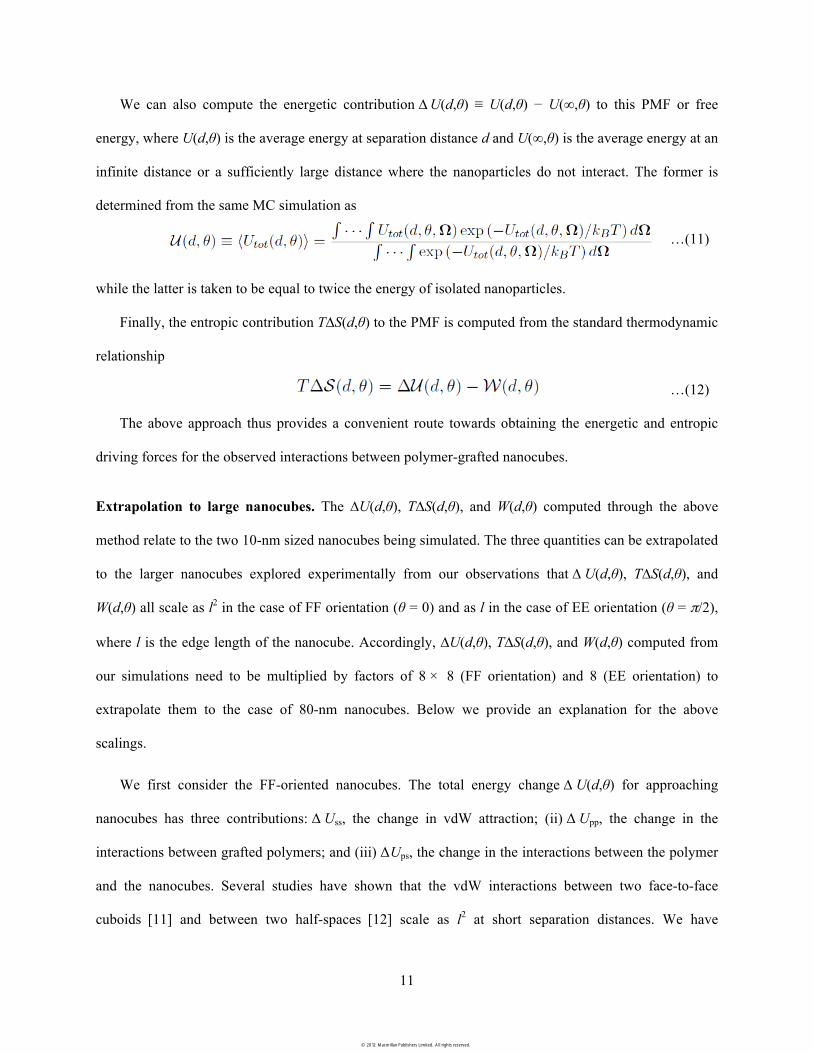
We can also compute the energetic contribution ∆U(d,θ) ≡ U(d,θ) − U(∞,θ) to this PMF or free
energy, where U(d,θ) is the average energy at separation distance d and U(∞,θ) is the average energy at an
infinite distance or a sufficiently large distance where the nanoparticles do not interact. The former is
determined from the same MC simulation as
…(11)
while the latter is taken to be equal to twice the energy of isolated nanoparticles.
Finally, the entropic contribution T∆S(d,θ) to the PMF is computed from the standard thermodynamic
relationship
…(12)
The above approach thus provides a convenient route towards obtaining the energetic and entropic
driving forces for the observed interactions between polymer-grafted nanocubes.
Extrapolation to large nanocubes. The ∆U(d,θ), T∆S(d,θ), and W(d,θ) computed through the above
method relate to the two 10-nm sized nanocubes being simulated. The three quantities can be extrapolated
to the larger nanocubes explored experimentally from our observations that ∆ U(d,θ), T∆S(d,θ), and
W(d,θ) all scale as l2 in the case of FF orientation (θ = 0) and as l in the case of EE orientation (θ = π/2),
where l is the edge length of the nanocube. Accordingly, ∆U(d,θ), T∆S(d,θ), and W(d,θ) computed from
our simulations need to be multiplied by factors of 8 × 8 (FF orientation) and 8 (EE orientation) to
extrapolate them to the case of 80-nm nanocubes. Below we provide an explanation for the above
scalings.
We first consider the FF-oriented nanocubes. The total energy change ∆ U(d,θ) for approaching
nanocubes has three contributions: Δ Uss, the change in vdW attraction; (ii) Δ Upp, the change in the
interactions between grafted polymers; and (iii) ΔUps, the change in the interactions between the polymer
and the nanocubes. Several studies have shown that the vdW interactions between two face-to-face
cuboids [11] and between two half-spaces [12] scale as l2 at short separation distances. We have
© 2012 Macmillan Publishers Limited. All rights reserved.

12
confirmed the l2 scaling by computing ΔUss [via Eq. (1)] for nanocubes of varying sizes l in the range 2–
12 nm separated by small gaps (d – l) = 0.1–10 nm relevant to self-assembly (Fig. S6a). The other two
energy terms, ΔUpp and ΔUpp, should scale with the number of grafted chains interacting between the two
proximal nanocubes, which is proportional to the surface area l2 (excluding boundary effects) of the
opposing nanocube faces. Similarly, the entropic loss −TΔS incurred by the compressed grafted chains in
between the two nanocubes is also expected to be proportional to the number of compressed chains,
which also scales as the surface area l2. Thus, the total change in the energy and entropy as well as the
PMF W(d,θ) are expected to scale as l2 for FF-orientated nanocubes.
We next examine the EE-oriented nanocubes. Previous calculations [11] suggest that ΔEvdW exhibits a
scaling of l1 for EE oriented cuboids separated by small distances. The above l1 scaling has been verified
for our nanocubes of sizes l = 2–12 nm for gaps (d – √2l) in the range 0.1–10 nm (Fig. S6b). The
remaining energy terms, ΔUps and ΔUpp, and the entropic loss (−TΔS) all scale with the number of grafted
chains involved in inter-particle interactions. However, we note here that only chains close to the two
facing edges of the nanocubes are involved in inter-particle interactions, while the remaining chains are
too short to reach the opposite nanocube surface and its grafted chains. If the mean height of the grafted
chains from the surface of the nanocubes is δ, then it can be shown that only chains within a distance δ
from the nanocube edge (assuming δ < l) can mediate interactions with the apposing nanocubes. Thus, the
number of interacting chains is proportional to the surface area δ × l in the EE orientation, rather than the
l2 observed in the FF orientation. Thus, the total change in the energy and entropy as well as W(d,θ) are
expected to scale as l1 for EE-orientated nanocubes.
Computational details. The PMFs and its energetic and entropic contributions are computed at distance
increments of 0.2 nm for separations less than 2 nm from the distance of closest approach and 1 nm for
larger separations. Since the nanocubes are composed of a rigid lattice of the silver atoms, tremendous
computational savings can be achieved by simply pre-computing the vdW component of the total energy
and forces. To further save computational costs, the interactions between the polymer beads and nanocube
© 2012 Macmillan Publishers Limited. All rights reserved.

13
lattice are pre-tabulated within a fine 3D Cartesian grid. The appropriate energy and force contributions
from polymer-surface interactions can then be easily obtained via interpolation from grid values. To
achieve ergodic sampling, we perform four independent simulation runs for each orientation and
separation. Small deviations between the results computed from the four simulations suggested that the
sampling was ergodic. The above quantities are computed for each of the FF and EE orientations and as
function of varying chain lengths L (within the range 4–16 beads) and varying polymer-surface attraction
strengths εps (within the range 0.02–0.08 kcal/mol). Note that the shortest chain length examined here
interacts minimally with its neighbors on the same nanocube. Each simulation demanded between ∼2–8
CPU hours on 2.2GHz AMD Istanbul processors. All other parameters, including the nanocube size,
grafting density, force field, and temperature are fixed throughout the study.
© 2012 Macmillan Publishers Limited. All rights reserved.

14
Table 1: Parameter values describing our model for polymer-grafted nanocubes.
Parameter Description Value
l Cube length 10 nm
np Number of chains attached to each surface 4
L Number of beads in each polymer chain 4–16
l0 Equilibrium segment length of polymer 1 nm
θ0 Equilibrium angle between three chain beads 180o
ks Stretching constant of chains 10 kcal/mol/nm2
kθ Bending constant of chains 0.1 kcal/mol/rad2
εpp LJ energy parameter for polymer-polymer interactions 0.1 kcal/mol
εcp LJ energy parameter for polymer-surface interactions 0.02–0.08 kcal/mol
εcc LJ energy parameter for surface-surface interactions 1.23 kcal/mol
σpp LJ size parameter for polymer-polymer interactions 1.0 nm
σcp LJ size parameter for polymer-surface interactions 0.632 nm
σcc LJ size parameter for surface-surface interactions 0.264 nm
T Temperature 300 K
© 2012 Macmillan Publishers Limited. All rights reserved.

15
Figure S3: Coarse-grained model of polymer-grafted nanocubes employed to compute the PMF be-
tween nanocubes in the (A,B) FF and (C,D) EE configurations. We employ periodic boundary con-
ditions (in the y and z directions for FF orientation and in the z direction for the EE orientation) to permit
extrapolation of simulation results obtained for smaller 10-nm nanocubes (shown in dark grey) to the
larger 80-nm nanocubes (shown only partially in light grey). Panels A and C show the top view and
Panels B and D show isometric views.
© 2012 Macmillan Publishers Limited. All rights reserved.

16
Figure S4: Contributions to PMF (solid black line) from steric repulsion between the grafted chains
arising from loss in chain entropy T∆S (green circles), vdW attraction between the silver nanocubes EvdW
(blue squares), and the vdW plus excluded-volume interactions between the grafted chains and the
nanocube surface Eps (red crosses). Results are plotted for FF-oriented (A,C) and EE-oriented (B,D)
nanocubes grafted with chains of lengths L = 4 (A,B) and L = 12 (C,D).
© 2012 Macmillan Publishers Limited. All rights reserved.
17
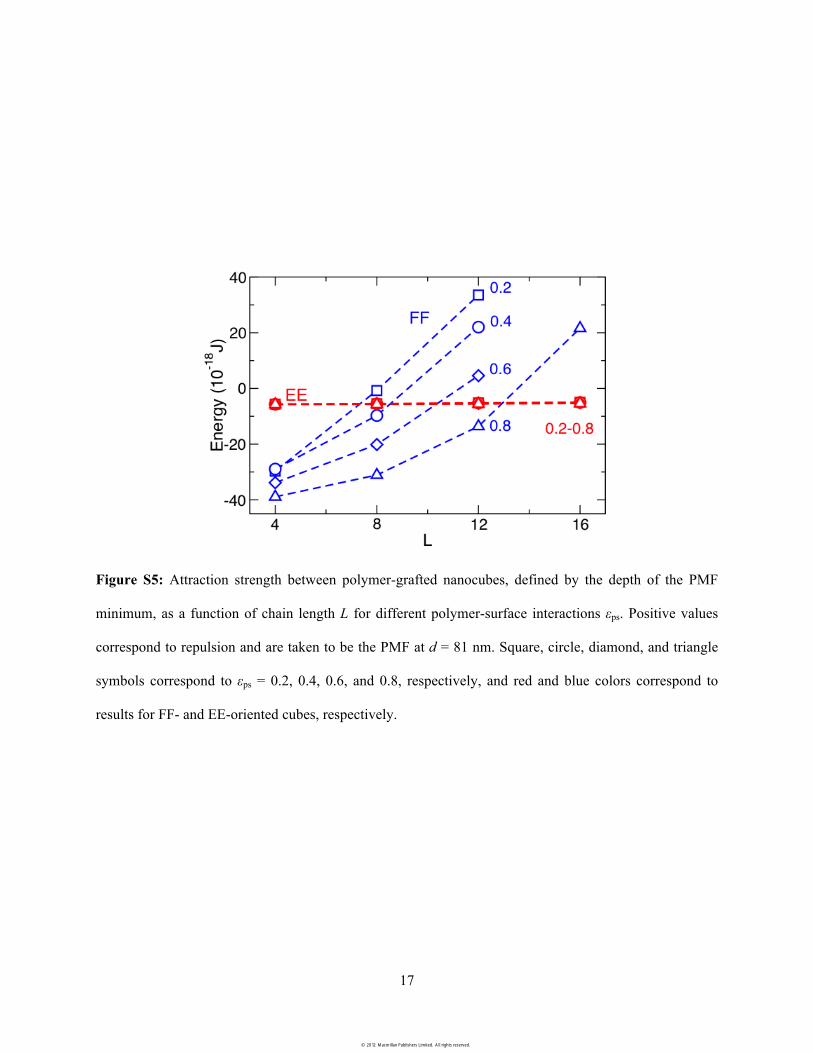
Figure S5: Attraction strength between polymer-grafted nanocubes, defined by the depth of the PMF
minimum, as a function of chain length L for different polymer-surface interactions εps. Positive values
correspond to repulsion and are taken to be the PMF at d = 81 nm. Square, circle, diamond, and triangle
symbols correspond to εps = 0.2, 0.4, 0.6, and 0.8, respectively, and red and blue colors correspond to
results for FF- and EE-oriented cubes, respectively.
© 2012 Macmillan Publishers Limited. All rights reserved.

18
Figure S6: Normalized van der Waals energy ΔUss computed for FF and EE-oriented nanocubes of sizes l
in the range 2–12 nm as a function of gap distances. ΔUss has been normalized by l2 for the FF orientation
and by l1 for the EE orientation. That the normalized energy profiles converge for all particles, especially
as the particles become larger and the gap distances smaller, confirms that the vdW energies scale as l2
and l for the FF and EE-oriented nanocubes, respectively.
© 2012 Macmillan Publishers Limited. All rights reserved.
19
4. Surface Modification of the Nanocubes
For surface modification with PEG alkanethiol, PVP coated nanocubes deposited on PS film on substrate
were incubated in a 2mM ethanol solution of (11-mercaptoundecyl)tetra(ethylene glycol) overnight at
room temperature. The substrate was removed, followed by rinsing with copious ethanol to remove
loosely bound PVP and thiol molecules and drying with N2 before carrying out the solvent vapor anneal.
Ideally, PVP on five out of the six faces of the nanocube (area fraction 0.83) is replaced by PEG
alkanthiol. Nanocubes were modified with thiol terminated poly(N-vinylpyrrolidone) (Polymer source,
70% terminated with thiol group, MW=1700) using the same procedure. The ligand exchange process in
each case was confirmed by infrared spectroscopy (Fig. S7). FTIR-ATR spectra taken of polymer-grafted
nanocubes were recorded using a Nicolet System 6700 spectrometer with Smart-iTR. Spectra were
recorded at 2 cm-1 resolution and 128 scans were collected. After ligand exchange with PEG alkanethiol,
the ATR-FTIR spectra of the resulted nanocubes were consistent with neat PEG alkanethiol: the
appearance of a strong peak at 1130 cm-1 corresponding to the C-O stretch; 1033 and 1056 cm-1 vibrations
(attributed to C-N stretching) and the carbonyl peak at 1662 cm-1 from the initial PVP layer decrease in
intensity, which suggest effective ligand exchange on nanocube surface. In the case of ligand exchange
with thiol-terminated PVP, the ATR-FTIR spectra showed peaks at 693 and 770 cm-1 attributed to the C-S
stretch, and a strong carbonyl peak at 1676 cm-1. This suggests binding of PVP chains on the nanocube
surface through a C-S moiety.
The FTIR spectrum associated with the as-made 55k PVP-coated nanoparticles is different than the
shorter chain, PVP-thiol grafted nanocubes for two reasons. First, the 55k PVP is chemisorbed at the
nanocube surface through interaction of Ag with the C=O groups of the pendant 2-pyrrolidone rings on
the polymer chain. This strong binding interaction results in a large shift in the expected carbonyl peak
position. Second, the nanocubes are synthesized at high solvent temperatures nearing 180-195°C. It is
possible that upon adsorption to the Ag surface, a large number of carbon by-products are formed, as
© 2012 Macmillan Publishers Limited. All rights reserved.

20
evidenced by broad “carbon cathedral” peaks near 1500 cm-1. Such peaks are often indicative of carbon
species that have “burned” at the metal surface, and are commonly observed during surface-enhanced
Raman measurements of PVP-capped Ag surfaces. Upon incubation with thiol-terminated ligands, these
by-products are likely displaced at the metal surface by formation of the metal-sulfur bond.
© 2012 Macmillan Publishers Limited. All rights reserved.

21
Figure S7. ATR-FTIR spectra of (a) as-made PVP coated nanocubes prior to ligand exchange, (b) neat
PEG alkanethiol, (c) nanocubes after ligand exchange with PEG alkanethiol, (d) neat thiol-terminated
PVP, (e) nanocubes after ligand exchange with thiol-terminated PVP. FTIR spectroscopy indicates that
while ligand exchange is not 100% (as determined by monitoring the intensities of peaks associated with
C-O and C=O bonds), incubation with PEG-thiol and PVP-thiol ligands does result in adequate ligand
exchange to be considered “full coverage” of the nanoparticle surface.
© 2012 Macmillan Publishers Limited. All rights reserved.

22
Figure S8. SEM of PEG-grafted nanocubes after 160 mins of solvent annealing, prior to thermal
annealing. The nanojunctions adopt dominantly edge orientations, but the appearance of face orientations
is significantly higher than for PVP-grafted nanocubes.
© 2012 Macmillan Publishers Limited. All rights reserved.

23
5. Nanocube String Length
Assembly statistics were obtained by considering the inter-NC orientation of the junction generated by
two adjacent cubes. Samples were images using scanning electron microscopyand the orientations of the
nanojunctions was considered over a 50 µm2 film area. This resulted in the counting of
approximately1000-1200 cubes and between 700-1000 cube connections per sample, depending on the
overall nanocrystal density within the polymer film.
Nanojunction orientation of FF, EE, and FE configurations was determined by evaluating: i) angular
orientation between adjacent cubes, ii) contact area between adjacent cubes, and iii) the distance from a
cube corner to the center of the nanojunction. To distinguish between an EE- versus an FF-oriented
structure, we consider the degree of electromagnetic coupling that occurs between adjacent nanocubes. In
general, the degree of electromagnetic coupling between two adjacent metal surfaces is dependent on
their separation distance. Based on our electrodynamic simulations, the separation distance between
nanocubes must be smaller than 5 nm for significant electromagnetic coupling to occur. At a distance of
20 nm, electromagnetic coupling is too weak to facilitate hot spot formation. This is the criterion that we
use to distinguish between EE and FF defects.
For an EE-oriented pair of nanocubes, the degree of coupling is dependent on the interparticle angle.
Electromagnetic coupling is only facilitated between nanocube edges until a critical inter-cube angle of
15°. At this inter-cube angle, only < 20% of the approaching cube faces are spaced less than 5 nm apart.
The separation distance between the approaching nanocube edges (that do not comprise the EE
nanojunction) is 20 nm. We use 15° as the inter-cube cut-off angle for an EE structure. For a FF-oriented
pair of nanocubes, the degree of coupling is dependent on interaction area. Strong electromagnetic
coupling is facilitated between FF-oriented nanocubes even when this interaction area is significantly
decreased. We use a 50% interaction area as the cut-off for an FF defect.
© 2012 Macmillan Publishers Limited. All rights reserved.

24
The orientation statistics below were determined by counting nanojunctions for a sample set with the
same approximate nanocube density. The images shown are representative of the overall assembly
morphology across the entire sample area. Scale bar = 500 nm in the SEM images below.
© 2012 Macmillan Publishers Limited. All rights reserved.

25
Table 2. Nanocube counts for various string lengths. See footnote below.*
Time EE-oriented FF-oriented 15 min
1.24 ± 0. 48 particles
1.01 ± 0.45 particles
30 min
1.78 ± 1.02 particles
2.40 ± 1.54 particles
45 min
5.70 ± 2.50 particles
6.57 ± 4.12 particles
© 2012 Macmillan Publishers Limited. All rights reserved.

26
60 min
14.72 ± 7.79 particles 37.50 ± 6.79 particles
17.83 ± 8.96 particles
*The EE oriented cubes are obtained using PVP-grafted particles. The FF oriented cubes are obtained
using PEG-grafted particles. The PEG-grafted samples are first exposed to chloroform vapor to form EE
assemblies with a desired string length before carrying out thermal annealing for 4 hours at 120°C.
© 2012 Macmillan Publishers Limited. All rights reserved.

27
6. FEM Simulations
The finite element method was used to calculate the scattering spectra and electric field distributions for
Ag nanocubes. We used a commercially available software package (COMSOL v 4.2a with the RF
module) to numerically solve for near- and far-field optical properties of the nanocubes in the frequency
domain using the scattered field formulation. The 3D simulation space was composed of two spherical
volumes - the embedding medium and a perfectly matched layer (PML) – and the nanocube structures
under investigation. Bulk dielectric constants were obtained from Johnson and Christy [13] with linear
interpolation. Nanocubes were modeled to match experimental conditions, with edge lengths = 80 nm and
separation gaps of 2 nm. An unpolarized plane wave, used for excitation, was inserted on the inside of the
PML surrounding the embedding medium. Discretization of the simulation space was conducted using the
built-in free meshing algorithm in COMSOL, which partitioned the simulation space into a collection of
tetrahedral finite elements. Scattering spectra were calculated on a spherical boundary using the
COMSOL implementation of the Stratton-Chu formula with incident electric field strength of Eo = 1 V/m.
Field intensities depicted in each field distribution plot are in units of V/m. The electromagnetic field
enhancement factor (EF) is calculated by taking EF = E / Eo.
© 2012 Macmillan Publishers Limited. All rights reserved.

28
Figure S9. Left: Optical scattering of isolated nanocubes distributed within a polystyrene film, prior to
assembly. Right: Theoretical far-field response of a single cube with edge length = 80 nm. Inset: Electric
field distribution (color, log (2) scale) for excitation of the dipolar localized surface plasmon resonance.
For a cube centered at the origin, the inset shows a two-dimensional slice that corresponds to field
strength in the x-y plane of the cube.
© 2012 Macmillan Publishers Limited. All rights reserved.

29
Figure S10. (a) The calculated far-field scattering spectrum for a string of four nanoparticles aligned in
EE (solid) and FF (dotted) configurations. (b,c) The calculated electric field strengths (color) at various
SP wavelengths for the nanoparticle strings modeled in part (a). For cube assemblies centered at the x-y
plane, the field distributions are depicted for a two-dimensional slice at (b) the x-y plane and (c) both the
© 2012 Macmillan Publishers Limited. All rights reserved.

30
x-y plane and the plane along the cube diagonal, as shown. For visual contrast, the electric potential is
plotted using a log (2) scale with min/max cutoffs as shown.
© 2012 Macmillan Publishers Limited. All rights reserved.

31
Figure S11. Plot of the calculated electric field strength for nanoparticle strings oriented in the EE
configuration. For visual contrast, the electric potential is plotted using a log (2) scale with min/max
cutoffs as shown.
© 2012 Macmillan Publishers Limited. All rights reserved.

32
Figure S12. Plot of the calculated electric field strength for nanoparticle strings oriented in the FF
configuration. For visual contrast, the electric potential is plotted using a log (2) scale with min/max
cutoffs as shown.
© 2012 Macmillan Publishers Limited. All rights reserved.

33
7. Additional Experiments with Long-Chain PEG Grafts
To confirm that the transition from EE-oriented nanocubes to FF-oriented nanocubes is dependent on
polymer graft chain length and not specific chemical interactions, we carried out additional experiments
follow the assembly of nanocubes modified with long PEG grafts with Mw = 5k (Laysan Bio, Inc.)
and Mw = 54k (Polymer Source).
Figure S13 shows the results of experiments carried out with long PEG grafts with Mw = 54k. These
films show a large number of EE orientations, but result in nanocube assemblies that also contain a large
number of assembly defects. This is due to artifacts associated with polystyrene dewetting from the
nanocube surface. We have observed that PEG-thiols with longer PEG chains do not carry out complete
displacement of the ligands present on the silver surface. This is confirmed by FTIR, which shows the
presence of both C-O bonds (from PEG) and C=O bonds (from PVP, which is present on the as-
synthesized nanocubes). Recently published work suggests that PEG grafts with Mw > 20k lose their
random coil configuration and adopt globule-like conformations when attached to a nanoparticle surface.
Poor surface modification with PEG is likely to explain the observed matrix dewetting.
In contrast, PEG grafts with Mw = 5k are expected to remain in a brush-like configuration when
attached to a nanoparticle surface. Figure S14 shows SEM images of the same nanocube film after (a)
surface modification with the 5k PEG graft, (b) followed by 160 minutes of solvent annealing under
chloroform vapor, and (c) followed by 4 hours of thermal treatment at 120° C. After solvent treatment,
the nanocubes assemble into predominantly EE-oriented strings. Out of a total of 345 nanojunctions, we
counted 13.4 ± 2.6% face orientations, 75.2 ± 1.9% edge orientations, and 11.4 ± 3.0% uncategorized
orientation defects. Defects resulting from dewetting of the matrix polymer are still present (some
examples circled in red), although significiantly minimized in comparison to longer PEG grafts. After
thermal annealing, we observe that the previously dewetted matrix polymer is redistributed around the
nanocubes and that the nanocubes remain assembled in the EE-orientation. Out of a total of 356
© 2012 Macmillan Publishers Limited. All rights reserved.

34
nanojunctions, we counted 15.8 ± 2.1% face orientations, 77.1 ± 2.1% edge orientations, and 7.1 ± 0.9%
uncategorized orientation defects. Thus, we do not observe significant conversion to the FF orientation.
© 2012 Macmillan Publishers Limited. All rights reserved.

35
Figure S13. A representative SEM image of nanocube assemblies generated with nanocubes grafted with
long PEG-thiol chains (Mw = 54k) and an FTIR spectrum of similarly modified nanocubes.
© 2012 Macmillan Publishers Limited. All rights reserved.

36
Figure S14. SEM images of the same nanocube film obtained by modifying nanocubes with PEG-thiol
grafts of Mw = 5k. Images show the nanocubes after (a) surface modification with the PEG graft, (b)
followed by 160 minutes of solvent annealing under chloroform vapor, and (c) followed by 4 hours of
© 2012 Macmillan Publishers Limited. All rights reserved.

37
thermal treatment at 120° C. Red dashed circles indicate areas of matrix polymer dewetting.
© 2012 Macmillan Publishers Limited. All rights reserved.

38
References
1. Y. Sun, Y. Xia, Science 298, 2176 (2002).
2. A. Tao, P. Sinsermsuksakul, P. Yang, Angewandte Chemie International Edition 45, 4597 (2006).
3. Arya, G. J. Phys. Chem. B 2009, 113, 15760–15770.
4. Arya, G. J. Phys. Chem. B 2010, 114, 15886–15896.
5. Israelachvili, J. Intermolecular & Surface Forces; Academic Press: London, 1991.
6. Eichenlaub, S.; Chan, C.; Beaudoin, S. P. J. Colloid Interface Sci. 2002, 248, 389-397
7. McQuarrie, D. A. Statistical Mechanics; University Science Books: Sausalito, California, 2000.
8. Siepmann, J. I.; Frenkel, D. Mol. Phys. 1992, 75, 59–70.
9. Frenkel, D.; Mooij, G. C. A. M.; Smit, B. J. Phys.: Cond. Matter. 1992, 4, 3053–3076.
10. de Pablo, J. J.; Laso, M.; Suter, U. W. J. Chem. Phys. 1992, 96, 2395–2403.
11. de Rocco, A. G.; Hoover, W. G. Proc. Natl. Acad. Sci. 1960, 46, 1058-1065.
12. Langbein, D. Theory of Van der Waals attraction, in Springer Tracts in Modern Physics; Springer:
Berlin, 1974.
13. Johnson, P. B.; Christy, R. W. Physical Review B. 1972, 6, (12), 4370.
14. X. Xia, M. Yang, Y. Wang, Y. Zheng, Q. Li, J. Chen and Y. Xia. ACS Nano 2012, 6 (1), 512–522.
© 2012 Macmillan Publishers Limited. All rights reserved.