self-noise and directivity of simple airfoils during stall...
TRANSCRIPT
Self-noise and directivity of simple airfoils during stall:An experimental comparison
Alex Laratroa, Maziar Arjomandia, Benjamin Cazzolatoa, Richard Kelsoa
aSchool of Mechanical Engineering, The University of Adelaide, South Australia 5005,Australia
Abstract
Noise measurements of NACA 0012, NACA 0021 and flat plate airfoils areobtained at a Reynolds number of 96,000, at angles of attack ranging from -30◦to30◦. As the airfoils enter a separated flow regime the strength of the dipolarnoise due to shed vorticity increases. This noise source grows in strength overa much smaller range of angles as the thickness of the airfoils is increased,causing the sound pressure level of the NACA 0021 airfoil in this frequencyrange to increase considerably more sharply than the other profiles. In additionthe NACA 0021 test model displays noise behaviour that is consistent withan unstable transition between prestall and stalled flow states, compared totransitions involving intermediate flow states observed for the NACA 0012 andflat plate airfoils.
Keywords:Stall noise, Aerodynamic noise, Airfoil noise
1. Introduction
Self-noise of airfoils immersed in a moving fluid is one of the foremost topicsof aeroacoustics and is of great interest to both the aeronautical and maritimeindustries. Much of the work in this area is still based on the pioneering workof Brooks et al. [1] who measured the noise generated by several airfoils atvarious Reynolds numbers and angles of attack and provided a semi-empiricalframework for modelling the noise. Their work was primarily focused on thenoise generated by the laminar and turbulent boundary layers at low angles ofattack as these are the components of airfoil noise most often encountered byand therefore of most interest to industry. The work of Brooks et al. followedfrom that of Paterson et al. [2] on airfoil-tip vortex interaction, where a largeincrease in far-field noise and surface pressure fluctuations was observed between250Hz and 1000Hz at stall. This phenonemon was subsequently noted by Fink& Bailey [3] when investigating airframe noise control methods, with increases
Email address: [email protected] (Alex Laratro)
of up to 10dB in the noise level at stall. These publications agreed that thesource of the noise near stall angles was eddies in the separated boundary layerradiating from the trailing-edge. However there has been little interest in thespectrum and directivity of noise generated by stalling airfoils since, as airfoilsusually operate outside of the stall regime.
However, recently the wind industry has shown some interest in this noise aswhen a turbine airfoil stalls its noise spectrum shifts to lower frequencies and itsdirectivity changes, meaning that the noise will travel further in the upstreamand downstream directions [4, 5]. Stall can occur on the blades of rotatingmachinery such as wind turbines, fans, and compressors due to a variety ofunpredictable factors such as unsteady inflow operation in the wake of upstreamdisturbances [6]. In the case of industrial fans, stall can also be caused by toolarge a pressure change across the fan and is generally avoided using passivestall control systems [7]. In the case of a pitch-regulated wind turbine, the pitchof the blades is constantly modified to maintain a target angle of attack andoptimise power generation. A lack of information about the noise generated byairfoils near their stall angle makes optimisation of these factors challenging. Asseen in recent noise predictions by Oerlemans & Schepers [8] and Gennaro etal. [? ], noise prediction for turbomachinery uses the model of Brooks et al. [1]in order to predict the noise after stall. This approach models the onset of stallas a sudden change in the governing equations when the airfoil stalls, which canfail to capture nuances of the transition.
In recent years Moreau et al. [10] have collected data on the noise generatednear stall that indicates that further investigation into the change in noise dur-ing the transition to a stalled state may be warranted. It was found that thenoise generated by a NACA 0012 airfoil at the onset of stall exhibits broad low-frequency peaks before decaying and giving way to the better-known tones fromlarge-scale separation. This regime, referred to as “light stall”, is of great inter-est because it is characterised by a non-trivial rise and decay. As unexpectedvariations in inflow can lead to small changes in angle of attack, properly mod-elling this transition is important for accurately modelling the sound generatedby airfoils experiencing these variations. However Moreau et al. [10] also notedthat the experimental conditions greatly affected the noise production. Whilethe results described above are from an experiment with an airfoil with a 130mmspan in a 300mm high jet, results from an airfoil of a 300mm span in a 130mmhigh jet were also present. When the self-noise of the airfoil in the narrowerjet was measured, the light stall regime was not observed and the peaks fromlarge scale vortex shedding were formed at a much lower angle of attack. Whilea computational analysis of the flow-field was performed, it was undertaken onthe narrow jet airfoil setup. Analysis of the computational results indicatedthat there was some coupling between the flow around the airfoil and the shearlayer of the jet which may have been responsible for the change in stall pat-tern. Investigation of the narrow jet stall noise at moderate angles of attackindicated that the main noise source was vorticies produced due to instabilitiesin the airfoil shear-layer near the leading edge. This is not representative of theusual “deep stall” regime which is characterised by large-scale vortex shedding
2

similar to that of a bluff body.Due to the limited information about the noise generated near the stall angle,
more experiments are required to characterise the noise produced in this regime.More data will both help to direct future noise control research, as well asproviding additional validation cases for computational aeroacoustics codes. Tothat end the present research aims to gain an understanding of the spectrum anddirectivity of the self-noise of some common airfoils at low Reynolds numbers,which when combined with previous results, will provide a stronger frameworkfor future research in this area. This is achieved by gathering data with a higherresolution in both frequency and angle of attack from multiple locations, andthen analysing the directivity of the noise generated under stall conditions.
2. Method
Aerodynamic research reported in the literature often approximates the com-plex, proprietary airfoil designs found on turbomachines as simpler designs, with4-digit NACA airfoils such as the NACA 0015 through NACA 0021 often usedfor aerodynamics research intended to be further developed [11, 12]. For thisstudy the NACA 0021 was chosen as a thick airfoil profile, and data from twoother profiles that have been more widely studied was also collected. One ofthese profiles was a NACA 0012, as a large amount of aerodynamic research hasbeen performed on it, as well as much of the existing research into self-noisenear stall. The final test model used was a flat plate, which like the NACA 0012has been the subject of a large amount of aerodynamic research. In additionto this research, common aeroacoustic models use a thin plate as their basis[1, 10, 13].
Data were collected in the open-jet Anechoic Wind Tunnel at the Universityof Adelaide. The wind tunnel consists of a 75mm high by 275mm wide rectan-gular nozzle in a 1.4m by 1.4 by 1.6m chamber which is acoustically treated withfoam wedges, making it anechoic down to 250Hz. Due to the low nozzle height,attempting high angle of attack airfoil experiments in this wind tunnel using ahorizontally mounted airfoil would result in a large amount of shear-layer-airfoilinteraction which will heavily affect the results [10]. Because of this the airfoilwas mounted vertically, which significantly increases the distance between theairfoil model and the jet’s shear layer but decreases the airfoil surface area andtherefore the noise produced. The data were collected at a free-stream velocityof 30ms–1 which corresponds to a Reynolds number of 96,000. This Reynoldsnumber was chosen as aerodynamic data for the NACA 0021 at Re = 100,000had been previously recorded at the University of Adelaide, and more Re =100,000 data is present in the literature for the other test models. Using Re =96,000 also enables comparison with the noise data of Moreau et al.[10] whichwere recorded at a Reynolds number of 150,000.
2.1. Test models
Due to the restrictions of the nozzle, the span of the test model was limitedto a maximum of 73mm, providing a 1mm clearance from the end-plates. A
3
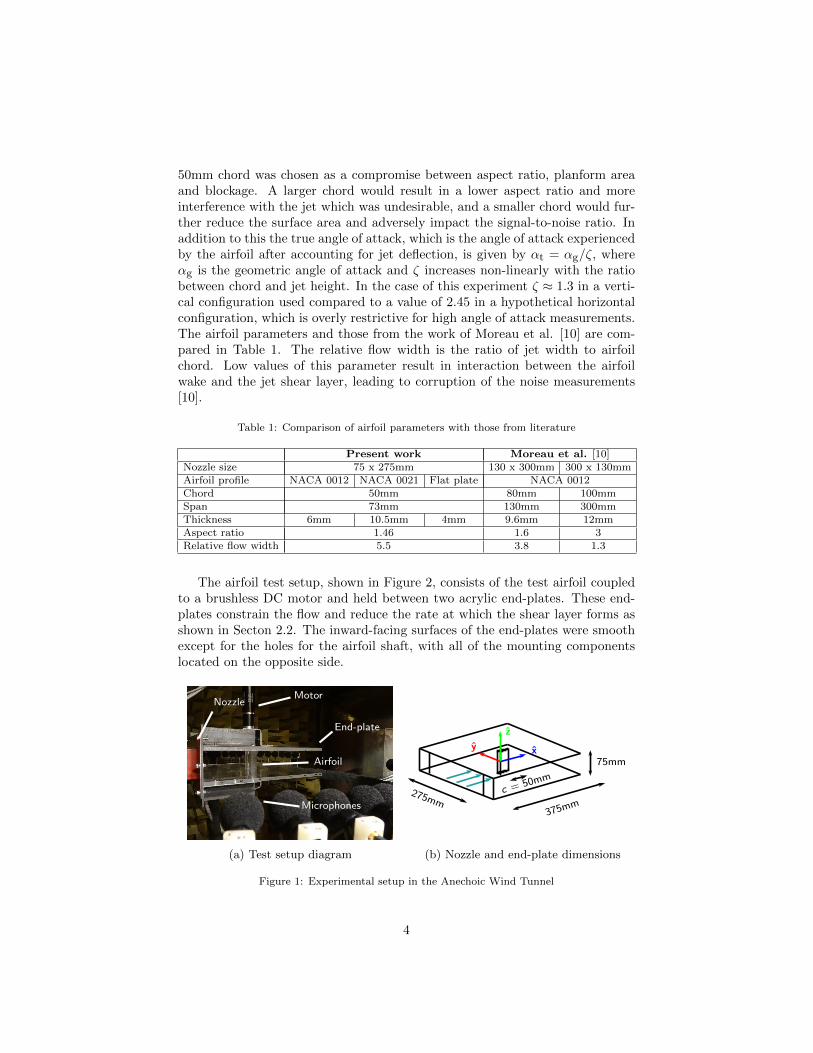
50mm chord was chosen as a compromise between aspect ratio, planform areaand blockage. A larger chord would result in a lower aspect ratio and moreinterference with the jet which was undesirable, and a smaller chord would fur-ther reduce the surface area and adversely impact the signal-to-noise ratio. Inaddition to this the true angle of attack, which is the angle of attack experiencedby the airfoil after accounting for jet deflection, is given by αt = αg/ζ, whereαg is the geometric angle of attack and ζ increases non-linearly with the ratiobetween chord and jet height. In the case of this experiment ζ ≈ 1.3 in a verti-cal configuration used compared to a value of 2.45 in a hypothetical horizontalconfiguration, which is overly restrictive for high angle of attack measurements.The airfoil parameters and those from the work of Moreau et al. [10] are com-pared in Table 1. The relative flow width is the ratio of jet width to airfoilchord. Low values of this parameter result in interaction between the airfoilwake and the jet shear layer, leading to corruption of the noise measurements[10].
Table 1: Comparison of airfoil parameters with those from literature
Present work Moreau et al. [10]Nozzle size 75 x 275mm 130 x 300mm 300 x 130mmAirfoil profile NACA 0012 NACA 0021 Flat plate NACA 0012Chord 50mm 80mm 100mmSpan 73mm 130mm 300mmThickness 6mm 10.5mm 4mm 9.6mm 12mmAspect ratio 1.46 1.6 3Relative flow width 5.5 3.8 1.3
The airfoil test setup, shown in Figure 2, consists of the test airfoil coupledto a brushless DC motor and held between two acrylic end-plates. These end-plates constrain the flow and reduce the rate at which the shear layer forms asshown in Secton 2.2. The inward-facing surfaces of the end-plates were smoothexcept for the holes for the airfoil shaft, with all of the mounting componentslocated on the opposite side.
Motor
Microphones
Airfoil
Nozzle
End-plate
(a) Test setup diagram
275mm375m
m
75mm
y
z
x
c = 50mm
(b) Nozzle and end-plate dimensions
Figure 1: Experimental setup in the Anechoic Wind Tunnel
4

One potential downside to using large end-plates is the introduction of hardsurfaces that can scatter and reflect the sound produced by the airfoils. Anyspecular reflection from the plates may increase the amplitude of sound receivedfrom ±25%to± 50% span, which will increase the contribution to the measuredsound from the boundary layer. This will introduce some uncertainty to theresults with regards to the top of the boundary layer where the velocity is stillclose to the free stream, but as the noise sources being investigated scale withU 5 the noise generated by the segment of the airfoil inside the boundary layerwill quickly become negligible regardless. Scattering of the sound will generate adiffuse secondary sound field which may obscure the directivity somewhat. Butas the focus of the current work is on changes in the sound field the effect on theresults due to the use of end-plates was not considered a high priority versus theadvantages of their use. These advantages were to introduce space between thenozzle and the airfoil to increase the available arc for directivity data collectionand space behind to allow development of the wake. It was observed during theexperiment that there is an increase in turbulence as the flow exits from the end-plates, and when a shorter plate setup was trialled to improve the signal-to-noiseratio the large-scale vortex shedding noise expected at high angles of attack wasnot observed. This indicated improper development of the airfoil wake underthese conditions, so testing was resumed with the extended plates. Anothersecondary trailing edge source is expected to form where the flow leaves theend-plates, as shown in Figure 2a but since the elevation angle between theselocations and the microphones is small (Figure 2b) and the directivity scaleswith the squared sine of this angle the contribution from this source at themicrophones will be small, with a directivity factor of -45dB for sound generatedat the airfoil junction and -39dB for sound generated at the edge of the plate.
(a) Primary and potential secondary noisesources
θ1 = 4◦ θ2 = 6◦
352.5mm
540mm
37.5mm
(b) Angles between end-plate surface andmicrophones
Figure 2: Illustration of low directivity between end-plates and microphone array
2.2. Side-plate boundary layer
In order to investigate the effect that the end-plates had on the flow fieldthe velocity and turbulent intensity were measured using a normal hot-wire
5

probe. Measurements taken in the y-z plane (Figure 1b) at the rotation axisof the airfoil show that the shear layer of the free jet has expanded to almost50% of the airfoil span by this location and the turbulence intensity is greaterthan 2% for over 90% of the airfoil as shown in Figure 3. However with theplates installed to constrain the flow the shear layer spans less than 30% of thechannel and the turbulence intensity is also greatly reduced, maintaining a valueless than 0.5% for much of the span.
U/U∞
%span
0.6 0.7 0.8 0.9 1 1.1
60
40
20
0
-20
-40
-60
Free jetRig installed
(a) Velocity profile
Turbulent Intensity (%)
%span
0 1 2 3 4 5
60
40
20
0
-20
-40
-60
Free jetRig installed
(b) Turbulence profile
Figure 3: Flow profiles at x = 0, y = 0, U∞ = 30m/s
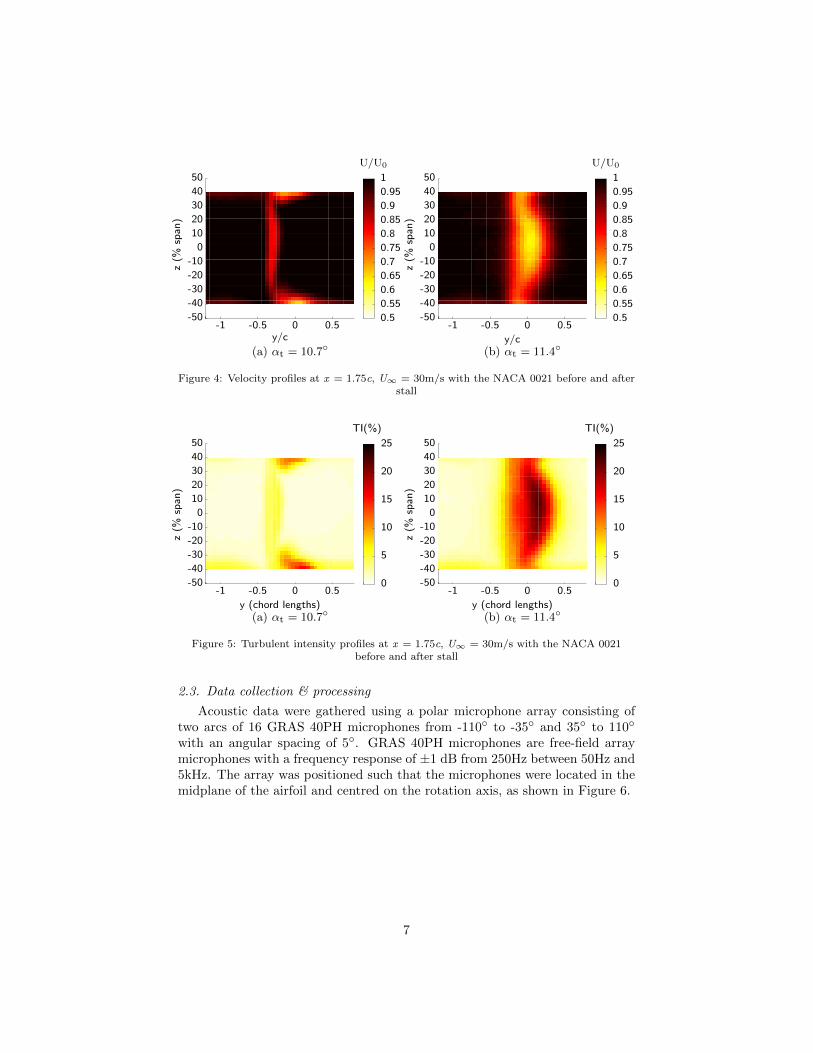
As the airfoil angle-of-attack is increased the boundary layer changes, whichmust also be taken into account. Hot-wire measurements of the flow in a planebehind the NACA 0021 test model at geometric angles of attack of 14◦ and 15◦
(Figures 4 & 5) show that when the airfoil experiences stall the proportion ofthe span affected by the boundary layer increases from approximately 30% toapproximately 50%. However as will be shown in Section 3.4 it is possible todetermine that the source of the observed sound is not within the boundarylayer.
6
y/c
z(%
span)
0.50-0.5-1
50
40
30
20
10
0
-10
-20
-30
-40
-50 0.5
0.55
0.6
0.65
0.7
0.75
0.8
0.85
0.9
0.95
1
U/U0
(a) αt = 10.7◦y/c
z(%
span)
0.50-0.5-1
50
40
30
20
10
0
-10
-20
-30
-40
-50 0.5
0.55
0.6
0.65
0.7
0.75
0.8
0.85
0.9
0.95
1
U/U0
(b) αt = 11.4◦
Figure 4: Velocity profiles at x = 1.75c, U∞ = 30m/s with the NACA 0021 before and afterstall
y (chord lengths)
z(%
span)
0.50-0.5-1
50
40
30
20
10
0
-10
-20
-30
-40
-50 0
5
10
15
20
25
TI(%)
(a) αt = 10.7◦y (chord lengths)
z(%
span)
0.50-0.5-10
5
10
15
20
25
TI(%)
50
40
30
20
10
0
-10
-20
-30
-40
-50
(b) αt = 11.4◦
Figure 5: Turbulent intensity profiles at x = 1.75c, U∞ = 30m/s with the NACA 0021before and after stall
2.3. Data collection & processing
Acoustic data were gathered using a polar microphone array consisting oftwo arcs of 16 GRAS 40PH microphones from -110◦ to -35◦ and 35◦ to 110◦
with an angular spacing of 5◦. GRAS 40PH microphones are free-field arraymicrophones with a frequency response of ±1 dB from 250Hz between 50Hz and5kHz. The array was positioned such that the microphones were located in themidplane of the airfoil and centred on the rotation axis, as shown in Figure 6.
7

x
y
θ = -35◦θ = -110◦
δθ = 5◦
re = 0.54m
Figure 6: Microphone locations in the x-y plane
Acoustic data were gathered in ten time series of fifteen second duration at athe sampling frequency of 32kHz. When processing the data each of the ten timeseries were converted to a power spectral density using Welch’s method with aHann window, a sample length of 8192 points, and an overlap of 50%. Initiallythe data were processed using a Hamming window, however it was found thatthe spectral leakage from the very low frequency pressure fluctuations in thewind tunnel was too great. The data were then reprocessed using a Hanningwindow which exhibits a much faster side-lobe roll-off, reducing spectral leakageas shown in Figure 7. While not shown in Figure 7 the global maximum of thespectrum is 98dB at 4Hz which is considerably higher than the rest of the data.Using these parameters gives a resolution bandwidth of 4Hz which sacrificessome of the definition of the narrow peaks but makes the spectra clearer. Takingthe root-mean-square amplitude of the ten resulting spectra resulted in the finalspectra shown in this article which represent a total of 1190 averages. Theseparameters are also collated in Table 2.
Frequency (Hz)
SPLPSD
(dB/Hzre
20–6Pa)
102 10320
25
30
35
40
45
50
55
60HammingHann
Figure 7: Sound pressure level PSD showing a comparison between the temporal windowfunctions
8

Table 2: Parameters of data used to plot spectra
Sample rate 32,768HzFFT length 8192Resolution bandwidth 4HzNumber of averages 1190
The data were collected by rotating the airfoil clockwise into positions from-5◦ to 40◦, holding stationary every 1◦ for recording and then counter-clockwisefrom 5◦ to -40◦ in -1◦increments, again holding stationary in 1◦ incrementsfor recording. Once this was done for both of the airfoils, the process wasperformed a second time to show repeatability and check for any effect removaland replacement the airfoils may have had on the results.
Each time one of the airfoils was installed there was a tolerance of ±1◦ inlocation of the 0◦datum. This is a source of error but not a cause for concernas determining the absolute angle tack at certain phenomena occur is not afocus of this research, and in cases where the error is greater than 1◦ it wasidentified and corrected for when examining the results, as they are expected tobe symmetrical between ±5◦.
In addition to the main dataset, a second dataset was obtained at the endof the experimental campaign in order to further investigate the rate of changeof noise levels as the airfoils enter stall. This has been previously investigatedat an angular resolution of δαg = 0.5◦[14] but in the current work it is revisitedwith an angular resolution of δαg = 0.1◦. Nominally the geometric angles ofattack range from 11◦ to 16◦ for the NACA 0012 and 13◦ to 17◦ for the NACA0021, but as the angular resolution is far higher than the error in the location ofthe 0◦ datum, only differences in angle of attack between two points in a set ofcontiguous data are meaningful. This could have been mitigated by gatheringdata about 0◦ before moving to the angles of attack of interest, but due toexperimental constraints this would have required a reduction in the range ofangles investigated.
Velocity data were acquired using a 2.5mm long, 5µm diameter, tungstensingle-wire hot-wire anemometer at a sampling freqeuency of 32kHz. This fre-quency is higher than the cutoff frequency of the probe use, but because the datawere acquired simultaneously with data from a reference microphone in orderto cross-reference the sound and velocity measurements, and obtain magnitude-squared coherence, the frequencies could not differ. The hot-wire was positionedusing a three-axis traverse with 6.25µm positional accuracy. While sample timesand positional resolutions varied depending on the data (as detailed in Section3.4), all measurements were taken in a single plane behind the airfoil at x = 1.75cas shown in Figure 8b. The measurements presented below were primarily takenin the y-direction at z = 0, and in the z-direction at y = –0.5c. y = –0.5c waschosen because it was the location where the signal from the Von Karman vor-tices shed from the trailing edge was expected to be the strongest based on theresults of Rodriguez et al. [15], as shown in Figure 8a.
9
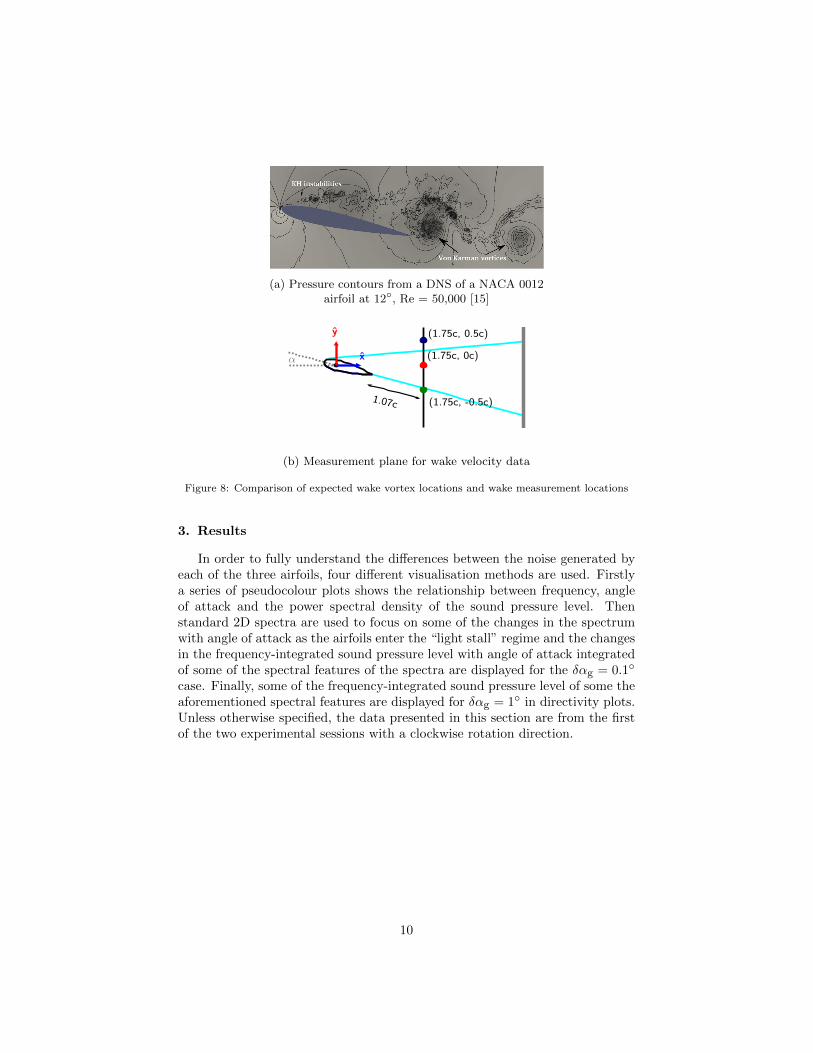
(a) Pressure contours from a DNS of a NACA 0012airfoil at 12◦, Re = 50,000 [15]
(1.75c, 0.5c)
(1.75c, 0c)
(1.75c, -0.5c)1.07c
x
y
α
(b) Measurement plane for wake velocity data
Figure 8: Comparison of expected wake vortex locations and wake measurement locations
3. Results
In order to fully understand the differences between the noise generated byeach of the three airfoils, four different visualisation methods are used. Firstlya series of pseudocolour plots shows the relationship between frequency, angleof attack and the power spectral density of the sound pressure level. Thenstandard 2D spectra are used to focus on some of the changes in the spectrumwith angle of attack as the airfoils enter the “light stall” regime and the changesin the frequency-integrated sound pressure level with angle of attack integratedof some of the spectral features of the spectra are displayed for the δαg = 0.1◦
case. Finally, some of the frequency-integrated sound pressure level of some theaforementioned spectral features are displayed for δαg = 1◦ in directivity plots.Unless otherwise specified, the data presented in this section are from the firstof the two experimental sessions with a clockwise rotation direction.
10
3.1. Pseudocolour plots
αt(◦)
Frequen
cy(H
z)
0 5 10 15 20 25 30
100
1000
10
20
30
40
50
60
70
50
8000
-4
tonal TE noise
”light stall”
”deep stall”
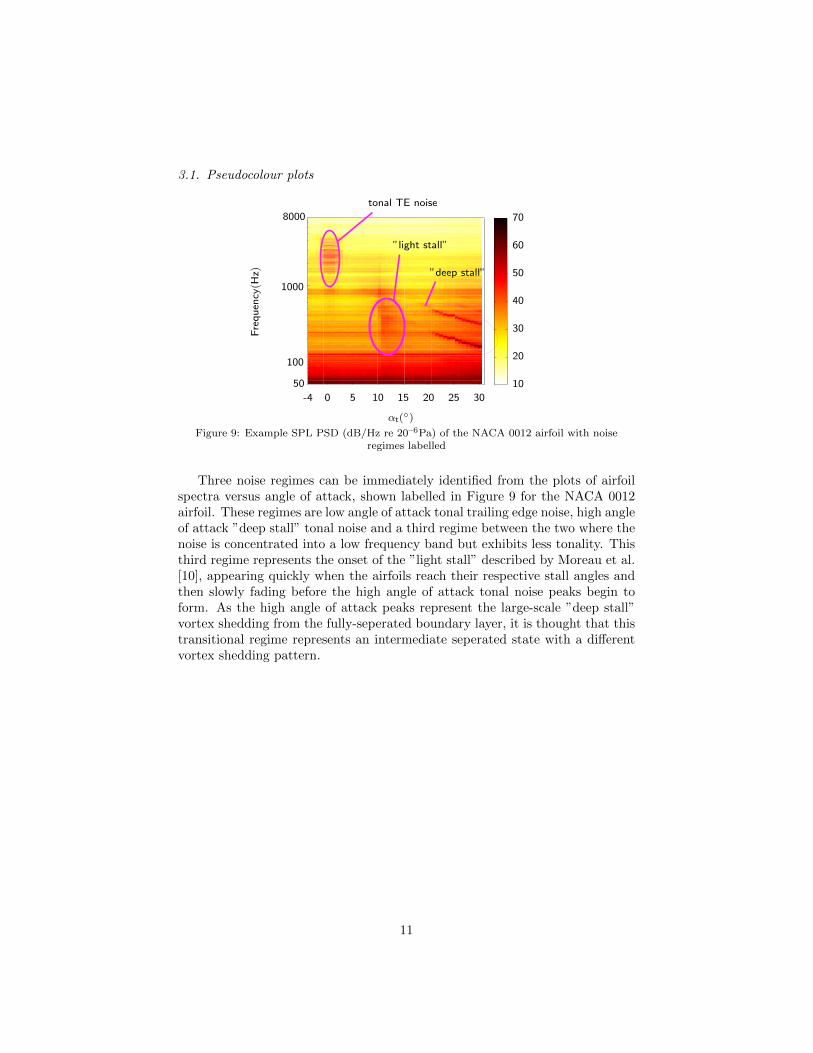
Figure 9: Example SPL PSD (dB/Hz re 20–6Pa) of the NACA 0012 airfoil with noiseregimes labelled
Three noise regimes can be immediately identified from the plots of airfoilspectra versus angle of attack, shown labelled in Figure 9 for the NACA 0012airfoil. These regimes are low angle of attack tonal trailing edge noise, high angleof attack ”deep stall” tonal noise and a third regime between the two where thenoise is concentrated into a low frequency band but exhibits less tonality. Thisthird regime represents the onset of the ”light stall” described by Moreau et al.[10], appearing quickly when the airfoils reach their respective stall angles andthen slowly fading before the high angle of attack tonal noise peaks begin toform. As the high angle of attack peaks represent the large-scale ”deep stall”vortex shedding from the fully-seperated boundary layer, it is thought that thistransitional regime represents an intermediate seperated state with a differentvortex shedding pattern.
11

αt(◦)
Frequen
cy(H
z)
0 5 10 15 20 25 30
100
1000
10
20
30
40
50
60
70
50
8000
-4
(a) NACA 0012αt(◦)
Frequen
cy(H
z)
0 5 10 15 20 25 30
100
1000
10
20
30
40
50
60
70
50
8000
-4
(b) NACA 0021
αt(◦)
Frequen
cy(H
z)
0 5 10 15 20 25 30
100
1000
10
20
30
40
50
60
70
50
8000
-4
(c) Flat plate
Figure 10: SPL PSD (dB/Hz re 20–6Pa) at θ = 90◦
The formation of peaks at the onset of stall occurs over a smaller rangeof angles of attack for the NACA 0021 than the NACA 0012, as previouslydiscussed [14]. As there are recordings from either side of the airfoil in this dataset the magnitude-squared coherence between the signals on either side of thechamber can be determined (Figures 11a, 11b & 11c). In this case a highervalue of coherence at a given frequency indicates that the signals received oneither side of the tunnel are generated by the same source. Coherence can belowered by the presence of measurement noise, but will also be lower if there aremultiple sources or if the sources are spatially distributed over a large enougharea [16].
12

αt(◦)
Frequen
cy(H
z)
0 5 10 15 20 25 30
100
1000
50
8000
-400.10.20.30.40.50.60.70.80.91
(a) NACA 0012αt(◦)
Frequen
cy(H
z)
0 5 10 15 20 25 30
100
1000
50
8000
-400.10.20.30.40.50.60.70.80.91
(b) NACA 0021
αt(◦)
Frequen
cy(H
z)
0 5 10 15 20 25 30
100
1000
50
8000
-400.10.20.30.40.50.60.70.80.91
(c) Flat plate
Figure 11: Coherence between signals at θ = ±90◦
3.2. Spectrum plots
In this section the measured sound pressure level power spectral densityfrom the experiment is presented. Figure 12,show the noise measured from theNACA 0012, NACA 0021 and flat plate models respectively at angles of attackfrom when they begin to exhibit the “light stall” noise described by Moreau etal.[10] until the it reaches its peak strength. The primary difference between thenoise generated by the NACA 0012 and NACA 0021 airfoils at light stall is aslight difference in the strength of the noise between 400Hz and 700Hz, makingthe stall noise portion of the NACA 0012’s spectra in this range appear flatter.Overall this means that the total noise generated at light stall by the NACA0012 is a few dB higher, as further discussed in Section 3.3.
It is also immediately apparent that the rates of onset of the light stallnoise signatures for these airfoils differ from one another, with the NACA 0012entering an intermediate state where the noise generated between 400Hz and700Hz has increased far more rapidly than that from 200Hz to 400Hz. Thisfeature does not appear in the NACA 0021 data which appears to immediatelytransition to the light stall noise signature when moving from 10.7◦ to 11.4◦.
The flat plate spectrum in Figure 12c show a much slower formation of thelight stall peaks as the angle of attack increases. The light stall spectrum for theflat plate is more similar to that of the NACA 0012 than the NACA 0021, witha relatively flat distribution and the formation of a broad peak between 400Hzand 700Hz before the portion of the noise between 200Hz and 400Hz forms.
13

Frequency (Hz)
SPLPSD
(dB/Hzre
20–6Pa)
102 1030
10
20
30
40
50
609.1◦9.9◦10.7◦no foil
(a) NACA 0012
Frequency (Hz)
SPLPSD
(dB/Hzre
20–6Pa)
102 1030
10
20
30
40
50
609.9◦10.7◦11.4◦no foil
(b) NACA 0021
Frequency (Hz)
SPLPSD
(dB/Hzre
20–6Pa)
102 1030
10
20
30
40
50
602.3◦3.8◦5.3◦6.9◦8.4◦no foil
(c) Flat plate
Figure 12: SPL PSD at onset of light stall noise at θ = 90◦
3.3. Noise levels
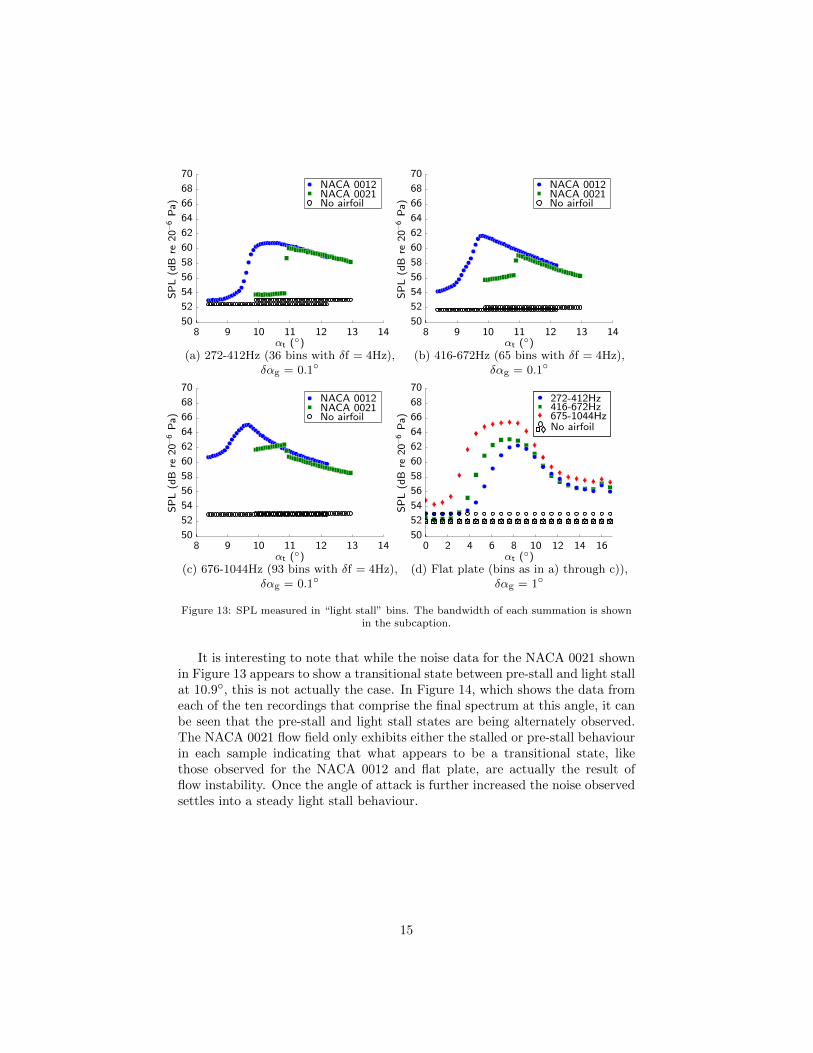
Integrating across the stall peaks and plotting the sound pressure level forthe high-resolution data reveals more information about the rate at which thestall signatures form. As shown in Figure 13 the trends from the δαg = 1◦ datacontinue in the δαg = 0.1◦ data. There remains a smooth transition between theNACA 0012’s pre-stall and “light stall” states, whereas the transition appearseven more abrupt and rapid for the NACA 0021 as it still occurs over very fewdata points. For the NACA 0021 there is a decrease in noise level during lightstall between 676Hz 1044Hz, and the noise level in this frequency range alsobehaves differently to the noise at lower frequencies. Conversely the flat platenoise levels maintain a similar shape for the three frequency ranges inspected,and transitions over a much larger range of angles of attack.
14
αt (◦)8 9 10 11 12 13 14
50
52
54
56
58
60
62
64
66
68
70NACA 0012NACA 0021No airfoil
SPL(dB
re20–6Pa)
(a) 272-412Hz (36 bins with δf = 4Hz),δαg = 0.1◦
αt (◦)8 9 10 11 12 13 14
50
52
54
56
58
60
62
64
66
68
70
SPL(dB
re20–6Pa)
NACA 0012NACA 0021No airfoil
(b) 416-672Hz (65 bins with δf = 4Hz),δαg = 0.1◦
αt (◦)8 9 10 11 12 13 14
50
52
54
56
58
60
62
64
66
68
70
SPL(dB
re20–6Pa)
NACA 0012NACA 0021No airfoil
(c) 676-1044Hz (93 bins with δf = 4Hz),δαg = 0.1◦
αt (◦)
50
52
54
56
58
60
62
64
66
68
70272-412Hz416-672Hz675-1044Hz
SPL(dB
re20–6Pa)
0 2 4 6 8 10 12 14 16
No airfoil
(d) Flat plate (bins as in a) through c)),δαg = 1◦
Figure 13: SPL measured in “light stall” bins. The bandwidth of each summation is shownin the subcaption.
It is interesting to note that while the noise data for the NACA 0021 shownin Figure 13 appears to show a transitional state between pre-stall and light stallat 10.9◦, this is not actually the case. In Figure 14, which shows the data fromeach of the ten recordings that comprise the final spectrum at this angle, it canbe seen that the pre-stall and light stall states are being alternately observed.The NACA 0021 flow field only exhibits either the stalled or pre-stall behaviourin each sample indicating that what appears to be a transitional state, likethose observed for the NACA 0012 and flat plate, are actually the result offlow instability. Once the angle of attack is further increased the noise observedsettles into a steady light stall behaviour.
15

Frequency (Hz)
SPLPSD
(dB/Hzre
20–6Pa)
102 1030
10
20
30
40
50
60Sample 1Sample 2Sample 3Sample 4Sample 5
Pre-stall
Light stall
Frequency (Hz)
SPLPSD
(dB/Hzre
20–6Pa)
102 1030
10
20
30
40
50
60Sample 6Sample 7Sample 8Sample 9Sample 10
Figure 14: Spectra of the individual NACA 0021 recordings from Figure 13 at αt = 10.9◦
3.4. Wake measurements
The results from Section 3.3 were used in order to target a study of velocityspectra downstream of the airfoil. Initially 10 second samples were collectedwithout the airfoil in order to determine if any of the observed noise was beinggenerated by the flow upstream. As shown in Figure 15 there is a peak in thevelocity spectrum near 50Hz which corresponds to a peak in the sound spectra.This indicates that this noise is being generated by a flow oscillation stemmingfrom an upstream source. There is no matching signal for the peak in thebackground noise around 100Hz indicating that this stems from a mechanicalsource, most likely the wind tunnel fan.
y/c0.50-0.5-1
Frequen
cy(H
z)
100
1000
50
8000
-80
-70
-60
-50
-40
-30
-20
-10
0
(a) z = 0mm, δy = 2.5mmz (% span)
Frequen
cy(H
z)
100
1000
50
8000
-80
-70
-60
-50
-40
-30
-20
-10
0
-40 -30-20 -10 0 10 20 30 40
(b) y = 0mm, δz = 2mm
Figure 15: Velocity PSD with no airfoil at x = 1.75c
Subsequently investigation of the NACA 0021 airfoil, again using 10 secondsamples, at true angles of attack of 10.7◦and 11.4◦(shown in Figure 16) showsthat when the light stall signature in the spectrum forms a corresponding broadpeak appears in the velocity spectrum. The coherence between the velocity andsound measurements also greatly increases when this happens, indicating thethe sound is generated upstream of the observation plane. This peak in the
16

velocity spectrum is observed on both sides of the airfoil for approximately onechord length, but not in the immediate wake where the spectrum is dominatedby a much larger broadband signal.
y/c0.50-0.5-1
0
0.1
0.2
0.3
0.4
0.5
0.6
Frequen
cy(H
z)
100
1000
50
8000
(a) αt = 10.7◦y/c
0.50-0.5-10
0.1
0.2
0.3
0.4
0.5
0.6
Frequen
cy(H
z)
100
1000
50
8000
(b) αt = 11.4◦
Figure 16: Velocity-sound pressure coherence of the NACA 0021 airfoil at z = 0mm, x =1.75c , δy = 2.5mm, δz = 2mm
It can be seen that apart from the signals that are found in the flow withoutthe airfoil installed there is little coherence in the velocity and sound spectra.However once the angle of the airfoil is increased and stall occurs peaks appear inthe coherence that correspond to the light stall noise. The coherence disappearsinside the wake, which is attributed to the large broadband velocity fluctuationsin this region. The data shown in Figure 16 were then used to determine thelocation where the velocity and sound spectra are the most coherent for furtherstudy.
When investigating the spanwise distribution of velocity-sound pressure co-herence, 30-second-long data samples were collected at locations from z = -40%to 40% span with δz = 2mm. An investigation of the spanwise coherence of thesound and velocity (Figure 17) indicates that the source of the light stall noiseis concentrated in the mid-span, outside the plate-foil boundary layer. Thisindicates that the primary sound source is located near the z = 0 plane of theairfoil.
17
0
0.1
0.2
0.3
0.4
0.5
0.6
Frequen
cy(H
z)100
1000
50
8000
z (% span)403020100-10-20-30-40
Figure 17: Velocity-sound presure coherence of the NACA 0021 airfoil at y = 0.5c, x =1.75c, αt = 11.4◦, δz = 2mm with δf = 4Hz
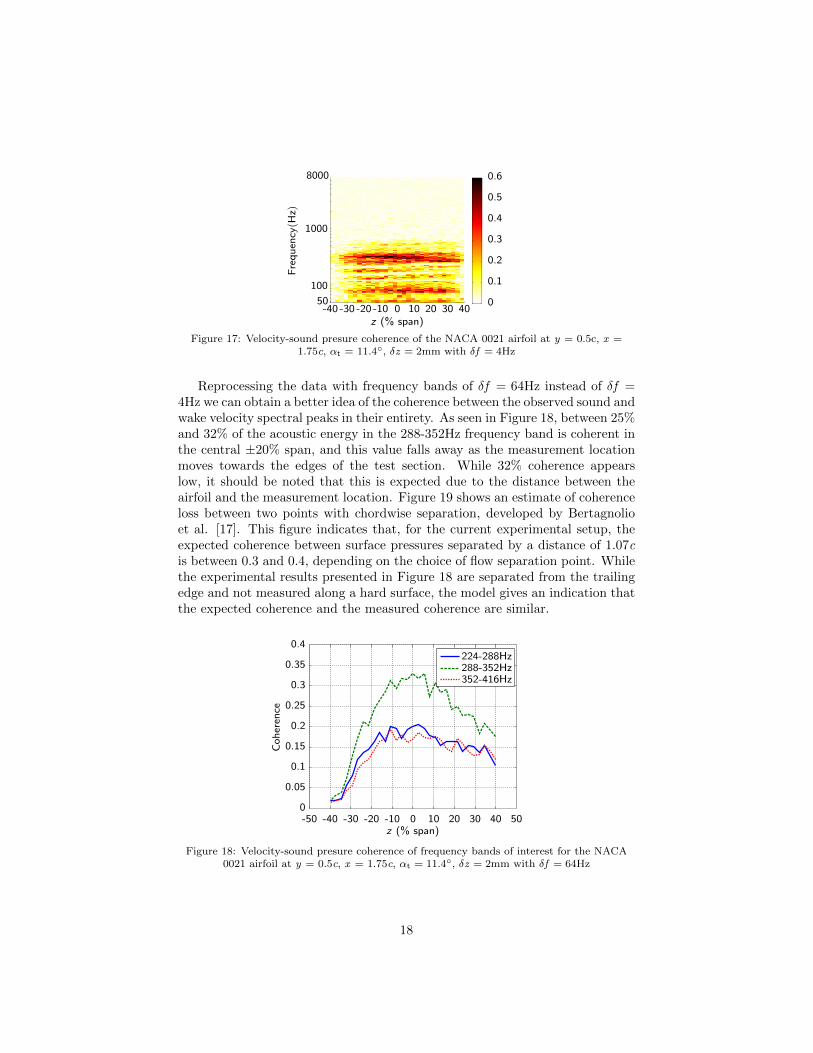
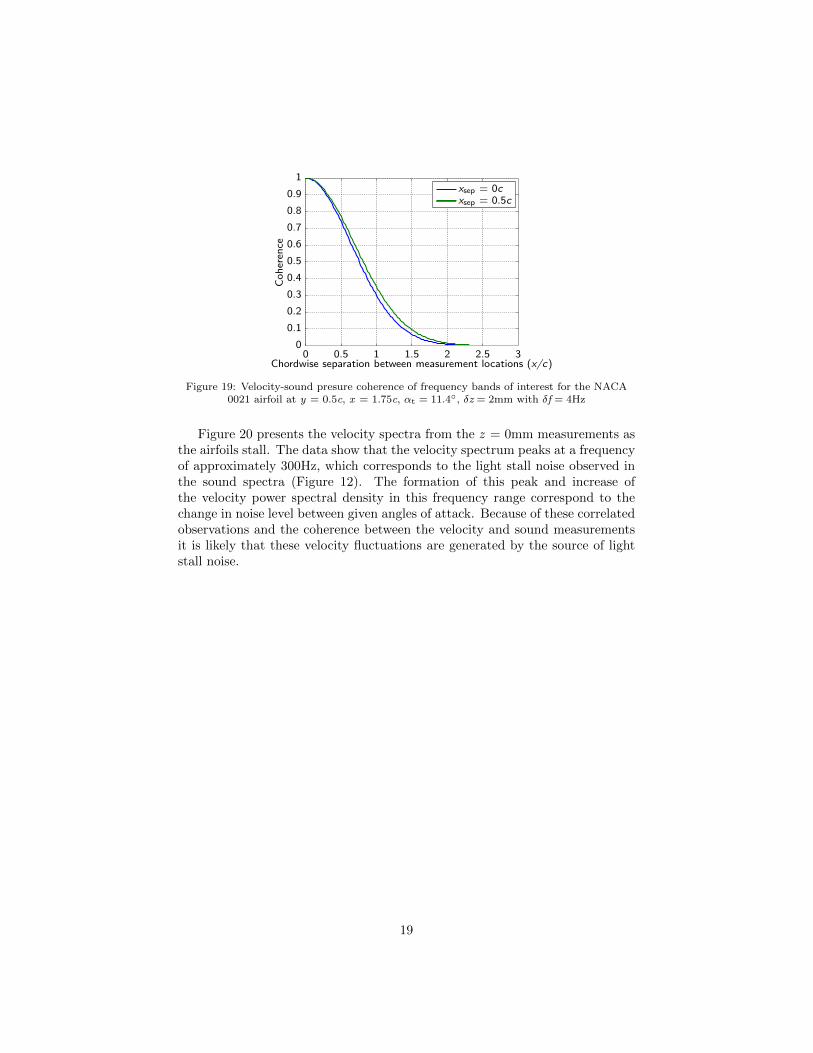
Reprocessing the data with frequency bands of δf = 64Hz instead of δf =4Hz we can obtain a better idea of the coherence between the observed sound andwake velocity spectral peaks in their entirety. As seen in Figure 18, between 25%and 32% of the acoustic energy in the 288-352Hz frequency band is coherent inthe central ±20% span, and this value falls away as the measurement locationmoves towards the edges of the test section. While 32% coherence appearslow, it should be noted that this is expected due to the distance between theairfoil and the measurement location. Figure 19 shows an estimate of coherenceloss between two points with chordwise separation, developed by Bertagnolioet al. [17]. This figure indicates that, for the current experimental setup, theexpected coherence between surface pressures separated by a distance of 1.07cis between 0.3 and 0.4, depending on the choice of flow separation point. Whilethe experimental results presented in Figure 18 are separated from the trailingedge and not measured along a hard surface, the model gives an indication thatthe expected coherence and the measured coherence are similar.
z (% span)
Coheren
ce
-50 -40 -30 -20 -10 0 10 20 30 40 500
0.05
0.1
0.15
0.2
0.25
0.3
0.35
0.4224-288Hz288-352Hz352-416Hz
Figure 18: Velocity-sound presure coherence of frequency bands of interest for the NACA0021 airfoil at y = 0.5c, x = 1.75c, αt = 11.4◦, δz = 2mm with δf = 64Hz
18
Chordwise separation between measurement locations (x/c)
Coheren
ce
0 0.5 1 1.5 2 2.5 30
0.1
0.2
0.3
0.4
0.5
0.6
0.7
0.8
0.9
1xsep = 0cxsep = 0.5c
Figure 19: Velocity-sound presure coherence of frequency bands of interest for the NACA0021 airfoil at y = 0.5c, x = 1.75c, αt = 11.4◦, δz = 2mm with δf = 4Hz
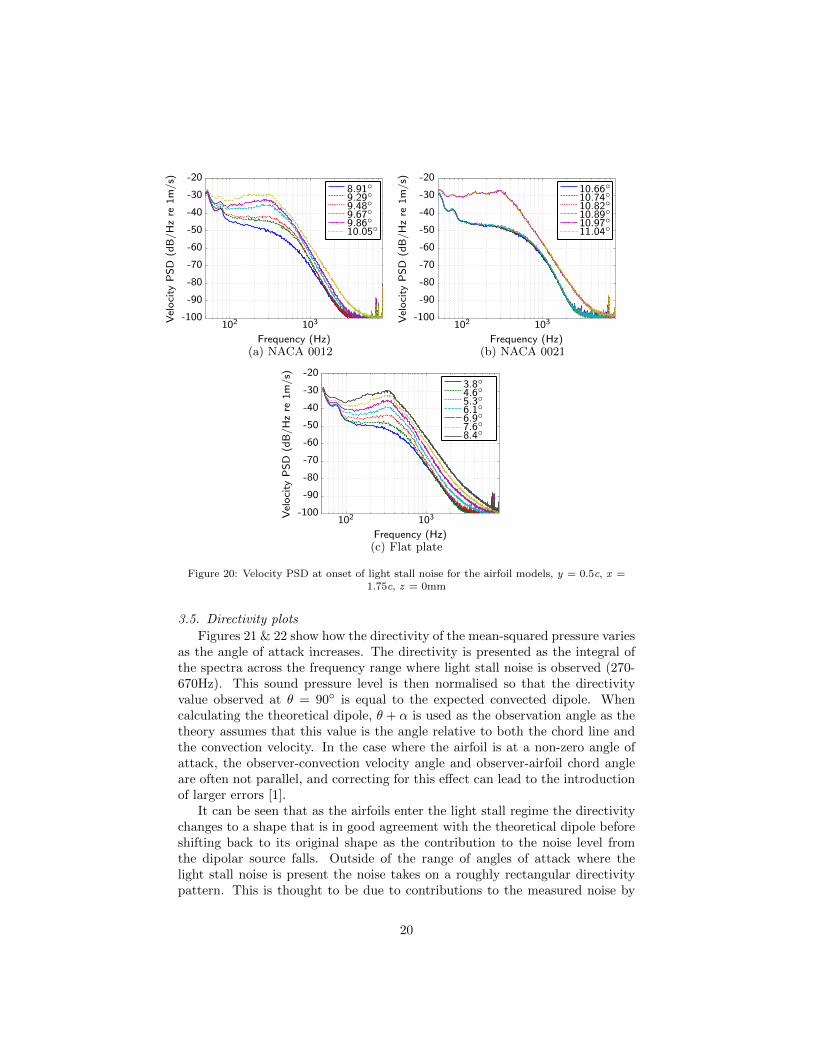
Figure 20 presents the velocity spectra from the z = 0mm measurements asthe airfoils stall. The data show that the velocity spectrum peaks at a frequencyof approximately 300Hz, which corresponds to the light stall noise observed inthe sound spectra (Figure 12). The formation of this peak and increase ofthe velocity power spectral density in this frequency range correspond to thechange in noise level between given angles of attack. Because of these correlatedobservations and the coherence between the velocity and sound measurementsit is likely that these velocity fluctuations are generated by the source of lightstall noise.
19
Frequency (Hz)
Velocity
PSD
(dB/Hzre
1m/s)
102 103-100
-90
-80
-70
-60
-50
-40
-30
-208.91◦9.29◦9.48◦9.67◦9.86◦10.05◦
(a) NACA 0012Frequency (Hz)
Velocity
PSD
(dB/Hzre
1m/s)
102 103-100
-90
-80
-70
-60
-50
-40
-30
-2010.66◦10.74◦10.82◦10.89◦10.97◦11.04◦
(b) NACA 0021
Frequency (Hz)
Velocity
PSD
(dB/Hzre
1m/s)
102 103-100
-90
-80
-70
-60
-50
-40
-30
-203.8◦4.6◦5.3◦6.1◦6.9◦7.6◦8.4◦
(c) Flat plate
Figure 20: Velocity PSD at onset of light stall noise for the airfoil models, y = 0.5c, x =1.75c, z = 0mm
3.5. Directivity plots
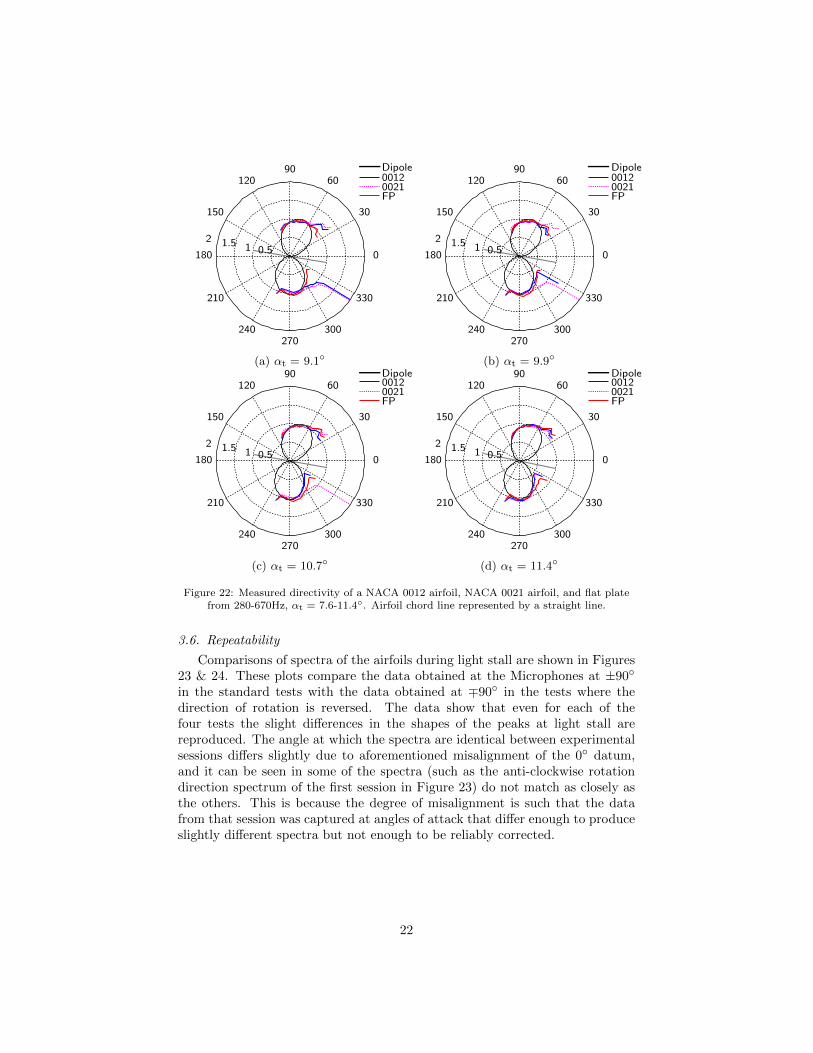
Figures 21 & 22 show how the directivity of the mean-squared pressure variesas the angle of attack increases. The directivity is presented as the integral ofthe spectra across the frequency range where light stall noise is observed (270-670Hz). This sound pressure level is then normalised so that the directivityvalue observed at θ = 90◦ is equal to the expected convected dipole. Whencalculating the theoretical dipole, θ + α is used as the observation angle as thetheory assumes that this value is the angle relative to both the chord line andthe convection velocity. In the case where the airfoil is at a non-zero angle ofattack, the observer-convection velocity angle and observer-airfoil chord angleare often not parallel, and correcting for this effect can lead to the introductionof larger errors [1].
It can be seen that as the airfoils enter the light stall regime the directivitychanges to a shape that is in good agreement with the theoretical dipole beforeshifting back to its original shape as the contribution to the noise level fromthe dipolar source falls. Outside of the range of angles of attack where thelight stall noise is present the noise takes on a roughly rectangular directivitypattern. This is thought to be due to contributions to the measured noise by
20
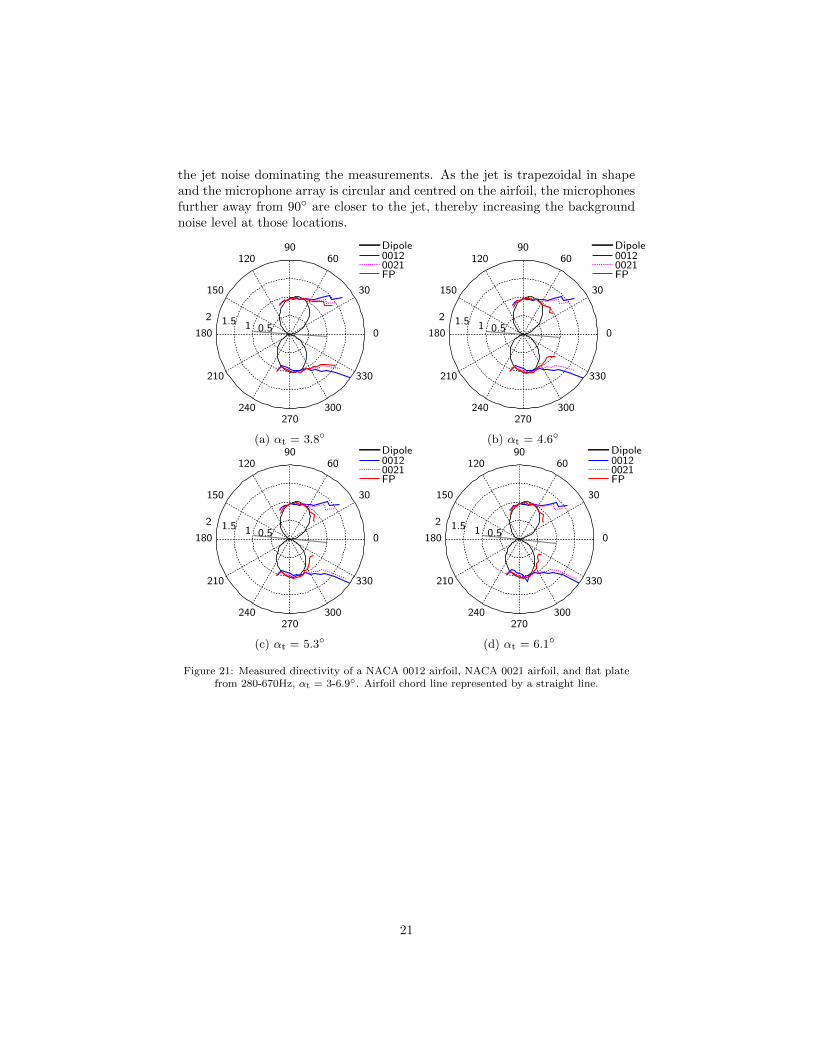
the jet noise dominating the measurements. As the jet is trapezoidal in shapeand the microphone array is circular and centred on the airfoil, the microphonesfurther away from 90◦ are closer to the jet, thereby increasing the backgroundnoise level at those locations.
11.520.5
30
210
60
240
90
270
120
300
150
330
180 0
00120021FP
Dipole
(a) αt = 3.8◦
11.52
30
210
60
240
90
270
120
300
150
330
180 0
00120021FP
0.5
Dipole
(b) αt = 4.6◦
11.520.5
30
210
60
240
90
270
120
300
150
330
180 0
00120021FP
Dipole
(c) αt = 5.3◦
11.52
30
210
60
240
90
270
120
300
150
330
180 0
00120021FP
0.5
Dipole
(d) αt = 6.1◦
Figure 21: Measured directivity of a NACA 0012 airfoil, NACA 0021 airfoil, and flat platefrom 280-670Hz, αt = 3-6.9◦. Airfoil chord line represented by a straight line.
21
11.52
30
210
60
240
90
270
120
300
150
330
180 0
00120021FP
0.5
Dipole
(a) αt = 9.1◦
11.52
30
210
60
240
90
270
120
300
150
330
180 0
00120021FP
0.5
Dipole
(b) αt = 9.9◦
11.52
30
210
60
240
90
270
120
300
150
330
180 0
00120021FP
0.5
Dipole
(c) αt = 10.7◦
11.52
30
210
60
240
90
270
120
300
150
330
180 0
00120021FP
0.5
Dipole
(d) αt = 11.4◦
Figure 22: Measured directivity of a NACA 0012 airfoil, NACA 0021 airfoil, and flat platefrom 280-670Hz, αt = 7.6-11.4◦. Airfoil chord line represented by a straight line.
3.6. Repeatability
Comparisons of spectra of the airfoils during light stall are shown in Figures23 & 24. These plots compare the data obtained at the Microphones at ±90◦
in the standard tests with the data obtained at ∓90◦ in the tests where thedirection of rotation is reversed. The data show that even for each of thefour tests the slight differences in the shapes of the peaks at light stall arereproduced. The angle at which the spectra are identical between experimentalsessions differs slightly due to aforementioned misalignment of the 0◦ datum,and it can be seen in some of the spectra (such as the anti-clockwise rotationdirection spectrum of the first session in Figure 23) do not match as closely asthe others. This is because the degree of misalignment is such that the datafrom that session was captured at angles of attack that differ enough to produceslightly different spectra but not enough to be reliably corrected.
22

Frequency (Hz)
SPLPSD
(dB
re20–6Pa)
102 1030
10
20
30
40
50
60Session 1 �, αg = 14◦Session 2 �, αg = 13◦Session 1 , αg = 14◦Session 2 , αg = 15◦
(a) θ = +90◦ for the clockwise rotationand θ = –90◦ for the anti-clockwise
rotation
Frequency (Hz)
SPLPSD
(dB/Hzre
20–6Pa)
102 1030
10
20
30
40
50
60Session 1 �, αg = 14◦Session 2 �, αg = 13◦Session 1 , αg = 14◦Session 2 , αg = 15◦
(b) θ = –90◦ for the clockwise rotationand θ = +90◦ for the anti-clockwise
rotation
Figure 23: SPL PSD of for at uncorrected “light stall” angles for the four sets of NACA0012 data
Frequency (Hz)
SPLPSD
(dB/Hzre
20–6Pa)
102 1030
10
20
30
40
50
60Session 1 �, αg = 15◦Session 2 �, αg = 16◦Session 1 , αg = 15◦Session 2 , αg = 15◦
(a) θ = +90◦ for the clockwise rotationand θ = –90◦ for the anti-clockwise
rotation
Frequency (Hz)
SPLPSD
(dB/Hzre
20–6Pa)
102 1030
10
20
30
40
50
60Session 1 �, αg = 15◦Session 2 �, αg = 16◦Session 1 , αg = 15◦Session 2 , αg = 15◦
(b) θ = –90◦ for the clockwise rotationand θ = +90◦ for the anti-clockwise
rotation
Figure 24: SPL PSD of for at uncorrected “light stall” angles for the four sets of NACA0021 data
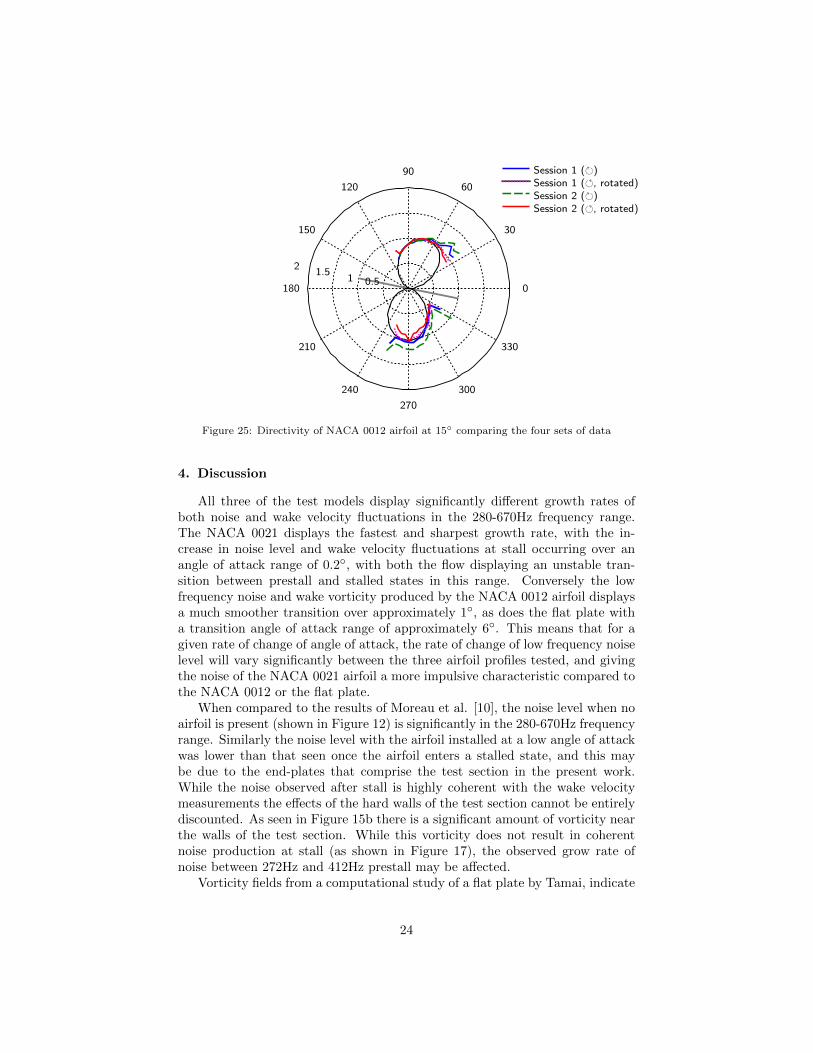
Figure 25 shows that the directivity of the NACA 0012 at 15◦ is repeatablefor both rotation directions. In this figure the data from the anti-clockwise rota-tion direction are shown rotated 180◦so that the observation angle is consistentwith the data for clockwise rotation direction. The figure also appears to showthat while the data are mostly consistent on the suction side of the airfoil, thedata from the pressure side is less uniform because the normalisation is refer-enced to the theoretical dipole at 90◦. If the data are normalised with referenceto -90◦ the situation is reversed. In addition, agreement between the data foreach rotation direction indicates that any asymmetry in the microphone arrayand wind tunnel is not significantly affecting the results.
23
11.5
2
30
210
60
240
90
270
120
300
150
330
180 0
Session 1 (, rotated)Session 2 (�)Session 2 (, rotated)
0.5
Session 1 (�)
Figure 25: Directivity of NACA 0012 airfoil at 15◦ comparing the four sets of data
4. Discussion
All three of the test models display significantly different growth rates ofboth noise and wake velocity fluctuations in the 280-670Hz frequency range.The NACA 0021 displays the fastest and sharpest growth rate, with the in-crease in noise level and wake velocity fluctuations at stall occurring over anangle of attack range of 0.2◦, with both the flow displaying an unstable tran-sition between prestall and stalled states in this range. Conversely the lowfrequency noise and wake vorticity produced by the NACA 0012 airfoil displaysa much smoother transition over approximately 1◦, as does the flat plate witha transition angle of attack range of approximately 6◦. This means that for agiven rate of change of angle of attack, the rate of change of low frequency noiselevel will vary significantly between the three airfoil profiles tested, and givingthe noise of the NACA 0021 airfoil a more impulsive characteristic compared tothe NACA 0012 or the flat plate.
When compared to the results of Moreau et al. [10], the noise level when noairfoil is present (shown in Figure 12) is significantly in the 280-670Hz frequencyrange. Similarly the noise level with the airfoil installed at a low angle of attackwas lower than that seen once the airfoil enters a stalled state, and this maybe due to the end-plates that comprise the test section in the present work.While the noise observed after stall is highly coherent with the wake velocitymeasurements the effects of the hard walls of the test section cannot be entirelydiscounted. As seen in Figure 15b there is a significant amount of vorticity nearthe walls of the test section. While this vorticity does not result in coherentnoise production at stall (as shown in Figure 17), the observed grow rate ofnoise between 272Hz and 412Hz prestall may be affected.
Vorticity fields from a computational study of a flat plate by Tamai, indicate
24

the vorticity produced by the separated shear layer peaks near 7.5◦ [18]. Thisangle corresponds to the peak value of noise in observed from the flat plate inthis study, indicating that the observed noise may be caused by this vorticityinteracting with the airfoil. Furthermore, a direct numerical simulation of aNACA 0012 airfoil performed by Rodriguez et al., for a Reynolds number of50,000 at angles of attack at 5◦, 8◦, 9.25◦ and 12◦, indicate a similar pattern[15]. In the study by Rodriguez et al. vorticity grows from 5◦ to 12◦ angle of attack,with strong vortex shedding starting in the 9.25◦ case. Again this correspondswith the angle of onset for the noise in the light stall regime for the NACA 0012in the present study, shown further in Section 3.3. Unfortunately to the author’sknowledge similar flow fields in this angle of attack range for the NACA 0021airfoil are not available in the literature. Overall, the available flow-field datafrom the literature corroborates the results of this study.
5. Conclusion
Self-noise from NACA 0012 and NACA 0021 airfoils at a Reynolds number of96,000 was measured in the anechoic wind tunnel at the University of Adelaideusing a polar microphone array. It was found that at the onset of stall the noiseproduced in the range of 200Hz-700Hz increased suddenly by approximately5dB and this was accompanied by a change in directivity to that of a convecteddipole. Furthermore, the noise generated by the NACA 0021 airfoil increasedby a smaller amount than the NACA 0012 and the flat plate in the range of 400-700Hz, but transitioned to this state much more rapidly than the NACA 0012.A subsequent wake study showed that the growth rate of the low frequency noiselevel is mirrored by that of wake vorticity in the same frequency range. Thisindicates that vorticity shed from the leading and trailing edge during light stall,previously reported in the literature, is the mechanism responsible for light stallnoise. Even after investigating the transition with an angle of attack resolutionof 0.1◦ no intermediate state between the pre-stall and stall noise regimes couldbe detected for the NACA 0021, compared with a smooth transition over a rangeof at least 1◦ for the NACA 0012 airfoil, and 6◦ for the flat plate. However,the NACA 0021 airfoil noise spectrum did briefly display an unstable transitionbetween the two noise regimes before settling into producing steady light stallnoise.
Acknowledgements
This work was supported by an Australian Government Research Training Pro-gram Scholarship
25

[1] Brooks, T. F., Pope, D. S., and Marcolini, M. A. Airfoil self-noiseand prediction. National Aeronautics and Space Administration, Office ofManagement, Scientific and Technical Information Division, 1989.
[2] Paterson, R. W., Vogt, P. G., Fink, M. R., and Munch, C. L.Vortex noise of isolated airfoils. Journal of Aircraft 10, 5 (1973), 296–302.
[3] Fink, M., and Bailey, D. Airframe noise reduction studies and clean-airframe noise investigation. Tech. rep., 1980.
[4] Madsen, H. A., Bertagnolio, F., Fischer, A., and Bak, C. Corre-lation of amplitude modulation to inflow characteristics.
[5] Oerlemans, S. Effect of wind shear on amplitude modulation of windturbine noise. International Journal of Aeroacoustics 14, 5–6 (2015), 715–728.
[6] Laratro, A., Arjomandi, M., Kelso, R., and Cazzolato, B. A dis-cussion of wind turbine interaction and stall contributions to wind farmnoise. Journal of Wind Engineering and Industrial Aerodynamics 127(2014), 1–10.
[7] Bianchi, S., Corsini, A., Sheard, A. G., and Tortora, C. A criti-cal review of stall control techniques in industrial fans. ISRN MechanicalEngineering 2013 (2013), 1–18.
[8] Oerlemans, S., and Schepers, J. Prediction of wind turbine noise andvalidation against experiment. Noise Notes 9, 2 (2010), 3–28.
[9] De Gennaro, M., and Kuehnelt, H. Broadband noise modelling andprediction for axial fans. In Proceedings of the Internataional ConferenceFan Noise, Technology and Numerical Methods (2012).
[10] Moreau, S., Roger, M., and Christophe, J. Flow features and self-noise of airfoils near stall or in stall. In 15th AIAA/CEAS AeroacousticsConference (2009).
[11] Swalwell, K., Sheridan, J., Melbourne, W., et al. The effect ofturbulence intensity on stall of the NACA 0021 aerofoil. In Proceedings ofthe14th Australasian Fluid Mechanics Conference (2001), pp. 10–14.
[12] Gaunaa, M. Unsteady aerodynamic forces on NACA 0015 airfoil in har-monic translatory motion. PhD thesis, 2002.
[13] Howe, M. Acoustics of fluid-structure interactions. Cambridge UniversityPress, 1998.
[14] Laratro, A., Arjomandi, M., Cazzolato, B., and Kelso, R. Self-noise of NACA 0012 and NACA 0021 aerofoils at the onset of stall. Inter-national Journal of Aeroacoustics (in press) (2017).
26

[15] Rodrıguez, I., Lehmkuhl, O., Borrell, R., and Oliva, A. Flowpast a NACA 0012 airfoil: From laminar separation bubbles to fully stalledregime. In Direct and Large-Eddy Simulation IX (2015).
[16] Bahr, C., and Cattafesta, L. N. Limits of coherence-based aeroa-coustic analysis in the presence of distributed sources. The Journal of theAcoustical Society of America 129, 6 (2011), 248–253.
[17] Bertagnolio, F., Madsen, H. A., Bak, C., Troldborg, N., andFischer, A. Aerodynamic noise characterization of a full-scale wind tur-bine through high-frequency surface pressure measurements. InternationalJournal of Aeroacoustics 14, 5-6 (2015), 729–766.
[18] Tamai, M. Experimental investigations on biologically inspired airfoils forMAV applications. Master’s thesis, Iowa State University, 2007.
[19] Huang, R. F., and Lin, C. L. Vortex shedding and shear-layer instabilityof wing at low-Reynolds numbers. AIAA Journal 33, 8 (1995), 1398–1403.
[20] Yarusevych, S., Sullivan, P. E., and Kawall, J. G. On vortexshedding from an airfoil in low-reynolds-number flows. Journal of FluidMechanics 632 (2009), 245–271.
27