self-audit of wastewater treatment processes to … research and development division final project...
TRANSCRIPT

`
E n e r g y R e s e a r c h a n d D e v e l o p m e n t D i v i s i o n F I N A L P R O J E C T R E P O R T
Self-Audit of Wastewater Treatment Processes to Achieve Energy Optimization
NOVE MBER 2014 CEC 500-11-003
Prepared for: California Energy Commission Prepared by: University of California, Irvine University of California, Los Angeles Southern California Edison

Prepared by: Primary Authors: University of California, Irvine Diego Rosso, Ph.D., Principal Investigator Reza Sobhani, Ph.D. Thomas Gocke University of California, Los Angeles Michael K. Stenstrom, Ph.D., PE
Shao-Yuan Ben Leu, Ph.D., PE (currently at the Hong Kong University of Technology) Kartiki Naik, Ph.D. Ben Li
Southern California Edison Lory Larson, PE Contract Number: 500-11-003 Prepared for: California Energy Commission David Weightman Contract Manager Virginia Lew Office Manager Energy Efficiency Research Office Laurie ten Hope Deputy Director Energy Research and Development Division Robert P. Oglesby Executive Director
DISCLAIMER This report was prepared as the result of work sponsored by the California Energy Commission. It does not necessarily represent the views of the Energy Commission, its employees or the State of California. The Energy Commission, the State of California, its employees, contractors and subcontractors make no warranty, express or implied, and assume no legal liability for the information in this report; nor does any party represent that the uses of this information will not infringe upon privately owned rights. This report has not been approved or disapproved by the California Energy Commission nor has the California Energy Commission passed upon the accuracy or adequacy of the information in this report.

i
ACKNOWLEDGEMENTS
The authors wish to acknowledge all water agencies that helped us during this project and provided us their data, as well as the consulting companies who provided their expertise and valuable feedback.
The project team would like to thank the sponsors of this project, California Energy Commission and Southern California Edison.
In addition, thanks to the faculty members, students and staff at University of California, Irvine, University of California, Los Angeles, and Southern California Edison who contributed to this work. Thanks, also, to our reviewers for their time.

ii
PREFACE
The California Energy Commission Energy Research and Development Division supports public interest energy research and development that will help improve the quality of life in California by bringing environmentally safe, affordable, and reliable energy services and products to the marketplace.
The Energy Research and Development Division conducts public interest research, development, and demonstration (RD&D) projects to benefit California.
The Energy Research and Development Division strives to conduct the most promising public interest energy research by partnering with RD&D entities, including individuals, businesses, utilities, and public or private research institutions.
Energy Research and Development Division funding efforts are focused on the following RD&D program areas:
• Buildings End-Use Energy Efficiency
• Energy Innovations Small Grants
• Energy-Related Environmental Research
• Energy Systems Integration
• Environmentally Preferred Advanced Generation
• Industrial/Agricultural/Water End-Use Energy Efficiency
• Renewable Energy Technologies
• Transportation
Self-Audit of Wastewater Treatment Processes to Achieve Energy Optimization is the final report for the project (contract number 500-11-003) conducted by University of Califronia, Irvine, University of California, Los Angeles, and Southern California Edison. The information from this project contributes to Energy Research and Development Division’s Industrial/Agricultural/Water End-Use Energy Efficiency Program.
For more information about the Energy Research and Development Division, please visit the Energy Commission’s website at www.energy.ca.gov/research/ or contact the Energy Commission at 916-327-1551.
iii
ABSTRACT
Wastewater treatment plants are a vital component of our infrastructure and within urban basins they are amongst the most energy-intensive facilities. Due to their size, treatment plants become important energy users on the electrical grid and are prime candidates for efficiency measures. In fact, the energy cost at the treatment plant and the power demand challenges for the electrical utilities have become major driving forces towards a more efficient usage of energy in the wastewater treatment processes. Moreover, concerns about greenhouse gas emissions add more incentive to consider wastewater treatment plants as prime candidates for energy-efficiency measures, both in the form of improved energy usage (through decreased oxygen demand) and improved energy recovery (through increased biogas production).
The research team developed a user-friendly software tool to facilitate the evaluation of energy efficient options for liquid and solids treatment processes within a plant. This software allows for time-dependent modelling and quantification of energy consumption and recovery in liquid and solids processing phases, and for evaluating of electrical energy saving measures options. The software was developed to support treatment plant managers and operators, design engineers, and energy efficiency program managers, to address the reasons for excessive energy consumption (based on process and water characteristics) and a list of energy saving recommendations for each process unit.
Since wastewater treatment plants in the United States consume on average approximately 1,600 kWh per million gallon (MG) of wastewater treated, the wastewater treatment plants that treat the majority of flow (>80%) in California contribute to a statewide daily energy consumption exceeding 7,500 MWh. Any of these POTW can utilize the software developled here to benchmark their energy consumption, regardless of plant size. Large treatment plants (i.e., with flow larger than 50MG per day) are candidates for energy conservation due to their large energy consumption on an aggregate basis, notwithstanding their more energy-efficient operation when compared to smaller facilities. At this scale, even relatively small energy-savings may result in large values on an absolute basis. Smaller facilities (i.e., with flow smaller than 50MG per day) are candidates due to their relatively lower energy-efficiency, which can be a relatively large portion of process costs. If plants implement the recommendations suggested by this software, the potential energy reduction in California can exceed 200 GWh/yr.
Keywords: Energy benchmarking; municipal wastewater treatment; modeling; efficiency
Please use the following citation for this report:
Rosso, D.; Sobhani, R.; Stenstrom, M.K.; Naik, K.; Leu, S-Y., Gocke, T.E.; Li, B.; Leu, S.-Y., Larson, L.E. (University of California, Irvine – University of California, Los Angeles – Southern California Edison). 2014. Self-Audit of Wastewater Treatment Processes to Achieve Energy Optimization. California Energy Commission. Publication number: CEC-500-11-003.
iv
TABLE OF CONTENTS
Acknowledgements ................................................................................................................................... i
PREFACE ................................................................................................................................................... ii
ABSTRACT .............................................................................................................................................. iii
TABLE OF CONTENTS ......................................................................................................................... iv
LIST OF FIGURES ................................................................................................................................. vi
LIST OF TABLES .................................................................................................................................... vi
EXECUTIVE SUMMARY ........................................................................................................................ 1
CHAPTER 1: Introduction ...................................................................................................................... 4
1.1 Wastewater Characteristics and Treatment Processes ............................................................. 4
1.2 Energy Consumption in Liquid Treatment Operations .......................................................... 5
1.3 Energy Consumption in Solid Treatmetn Operations ............................................................. 7
1.4 Objectives of this Research Project ............................................................................................. 9
CHAPTER 2: Software Development ................................................................................................. 11
2.1 Technology Assessment ............................................................................................................. 12
2.1.1 Quantification of energy consumption as a function of process conditions and wastewater characteristics ....................................................................................................... 12
2.1.2 Quantification of energy consumption as a function of equipment inventory and duty cycle .................................................................................................................................... 13
2.1.3 Creation of energy-footprint database .......................................................................... 14
2.2 Integration of Process Energy Balances .................................................................................... 14
2.3 Development of a Computer Code and Interface ................................................................... 14
2.3.1 Integration of solids and liquid processing for energy benchmarking software ...... 16
2.3.2 Debugging and Testing, File size Reduction, User Interface simplification for operating system compatibility................................................................................................. 16
2.3.3 Dynamic plots showing treatment plant’s energy standing, normalized energy consumption by hydraulic, solids or organic loading ........................................................... 16
2.3.4 Software tutorial ................................................................................................................. 18
v
2.3.5 Communicating with wastewater treatment plants for data collection and software validation ..................................................................................................................................... 18
CHAPTER 3: Technical Transfer and Software Evaluation ............................................................ 19
3.1 Plant A ........................................................................................................................................... 20
3.1.1. Schematic processes and output summary of Plant A ................................................ 20
3.2 Plant B ........................................................................................................................................... 23
3.2.1. Schematic processes and output summary of Plant B ................................................. 23
3.3 Results and Comparisons ........................................................................................................... 27
California IOU Electricity Ratepayer Benefits .................................................................................. 35
Potential Energy Savings for California ......................................................................................... 35
Future work ........................................................................................................................................ 36
Conclusions .............................................................................................................................................. 37
REFERENCES ......................................................................................................................................... 38
APPENDIXES ......................................................................................................................................... 39
vi
LIST OF FIGURES
Figure 1: Process schematic of a typical wastewater treatment plant ............................................... 5
Figure 2: Analytical approach for energy benchmark and compare it with the results available in the database .......................................................................................................................................... 12
Figure 3: Graphical user interface for the eBen ................................................................................... 15
Figure 4: Sample graphs showing total energy consumption for plant currently, and comparing overall results for competing manufacturers or consultants using labels ....................................... 17
Figure 5: Plant A - Schematic processes ............................................................................................... 21
Figure 6.a: Output summary of the energy consumption at Plant A ........................................................... 22
Figure 6.b: Output summary of the energy consumption at Plant A........................................................... 23
Figure 7: Plant B - Schematic processes ............................................................................................... 24
Figure 8.a: Output summary of the energy consumption at Plant B ................................................ 25
Figure 8.b: Output summary of the energy consumption at Plant B ................................................ 26
Figure 8.c: Output summary of the energy consumption at Plant B ................................................ 27
Figure 9.a: Results of normalized energy consumption based on unit process influent and unit solids removal ........................................................................................................................................... 28
Figure 9.b: Results of normalized energy consumption based on unit process influent and unit solids removal ........................................................................................................................................... 30
Figure 9.c: Results of normalized energy consumption based on unit process influent and unit solids removal ........................................................................................................................................... 31
Figure 10.a: Results of normalized energy consumption based on the plants’ capacity ............... 33
Figure 10.b: Results of normalized energy consumption based on the plants’ capacity ............... 34
LIST OF TABLES Table 1: Energy intensity of unit operations typically employed in large (100 MGD) and small (10 MGD) municipal wastewater treatment plants in the Unites States. ........................................... 8
1
EXECUTIVE SUMMARY
Rationale
Wastewater treatment plants are important points of power demand and energy consumption in California, ranking in the top tier of the State’s energy consumers, according to previous studies by the California Energy Commission. The current trend in this segment of industry is to reconsider the previous paradigm of energy-intensive treatment by reconfiguring and upgrading existing facilities to become resource recovery processes. For example, wastewater treatment plants that were designed and built a generation ago to rapidly treat sewage before discharging to coastal waters are now largely converted to reclamation plants that provide reclaimed water for beneficial reuse (e.g., irrigation, industrial cooling, indirect potable reuse, etc.). The current paradigm shift sees these facilities not only as a source of reclaimed water but as an energy production facility, where the sludge is converted to biogas and energy recovery from this renewable source is used to abate substantially the process energy importation. Along with energy recovery, the treatment process energy demand must be addressed if energy neutrality is desired. In fact, according to the California Energy Commission, a typical wastewater treatment plant may require up to 2,500 kWh/Mgal of wastewater treated. This energy is consumed by many individual units throughout the treatment process but is usually concentrated in wastewater pumping and aeration, and sludge processing. Energy audits in this sector are problematic, and the costs associated with professional-grade plant audits oftentimes run as high as tens of thousands of dollars. Additionally, these audits require a team of expert investigators because of their complexity. For those reasons, most wastewater treatment plants do not perform energy audits on a regular basis, or at all.
Project Goal
The purpose of this project was to develop a user-friendly software to help wastewater treatment utilities in the identification, evaluation, and prioritization of energy efficiency opportunities in their facilities. This energy benchmarking (eBen) software was developed specifically for treatment plant managers and operators, design engineers, as well as energy efficiency program managers. The screening software models the energy consumption and energy recovery of the unit operations in existing municipal wastewater treatment plants, and compares their energy values with a data base of other facilities. This energy benchmarking exercise is a rapid tool for the identification and evaluation of electrical energy saving measures.
Software Evaluation
During this project, the energy consumption from municipal wastewater treatment plants was categorized in two different ways: 1) energy consumption based on the influent water characteristics (e.g., BOD and NH4 concentration) and operating parameters during the treatment process (e.g., oxygen transfer efficiency); 2) energy consumption based on the
2
equipment set utilized for each process (e.g., pumps, motors, and blowers). The former represents the theoretical energy usage that the process should require. The latter represents the actual energy usage due to the limitations of the existing equipment size, number of units, and duty cycles. Comparing the results of these two methods gives a complete picture of the energy usage in treatment processes at a plant, and based on comparison with similar plants identifies the areas of priority candidates for energy efficiency improvements. Four objectives were set and met in this study:
• Assemble a comprehensive database of the equipment used in wastewater treatment processes and of the equipment’s energy intensity, to use as basis for energy benchmarking;
• Design and develop a user-friendly software (spreadsheet-based) to audit existing plant operation and evaluate energy savings measures, based on both the wastewater and process characteristics (i.e., theoretical energy requirements) and the existing equipment inventory and duty cycles (i.e., actual energy usage);
• Incorporate in the software the ability to compare process and equipment performance of the plant using theoretical data vs. actual plant data, and to prompt recommendations based on the energy quantifications and comparison to the equipment and energy intensity database;
• Demonstrate the use of the software on full-scale host treatment facilities. Results and Conclusions
The demonstration of the eBen is described in detail in this report and includes the energy benchmarking of two full-scale wastewater treatment plants in California. The software was evaluated by representatives of the different segments of this industry (i.e., treatment utility engineers/operators; design and consulting engineers; treatment process modelers; academics and researchers), indicating that its operation is accessible by all parties. Also, the demonstration at two facilities of different sizes (one was a small/medium treatment plant treating approximately 107 gallons per day, the other a large treatment plant treating approximately 108 gallons per day) showed that the software can be used regardless of the facility size and location. The comparative results, for example, highlight the value of solids processing on site, with the associated energy recovery from biogas. In fact, one of the two facilities that participated in the demonstration is not currently equipped with solids processing on site, and the energy savings potential from its implementation is quantified here. A second example of the energy quantifications that are discussed in more detail in the report pertains the energy consumption by aeration systems in both plants. While one of the two facilities exhibits high aeration energy use, the other has a comparatively reduced value,

3
indicating that some recommendations should be prompted (e.g., cleaning or replacing aeration equipment). In either case, only the treatment utility personnel looking at these plots can identify the process limitations that lead to such energy benchmarking differences. The electrical utility personnel looking at the eBen results can discuss with the treatment utility personnel the potential equipment replacement/upgrade that should be entertained to increase the process energy-efficiency while maintaining the process functional within the effluent limits imposed by permits.
The use of the eBen software can highlight energy savings per plant as high as 10%, which if implemented would exceed 105 MWh/yr statewide. The market penetration of the eBen is estimated to be high (potentially 50%), due to the free nature and ease of operation of the software, and to the existence of effective rebate programs to help finance energy efficiency measures. Moreover, most improvements recommended by the eBen can be made with little or no capital expenditure. Future work should include the systematic expansion of the equipment and energy intensity database through a centralized repository, potentially a web portal. The integration of eBen measures directly with existing treatment process control software could implement real-time, dynamic measures to continuously minimize energy consumption, power demand, or both, as applicable.

4
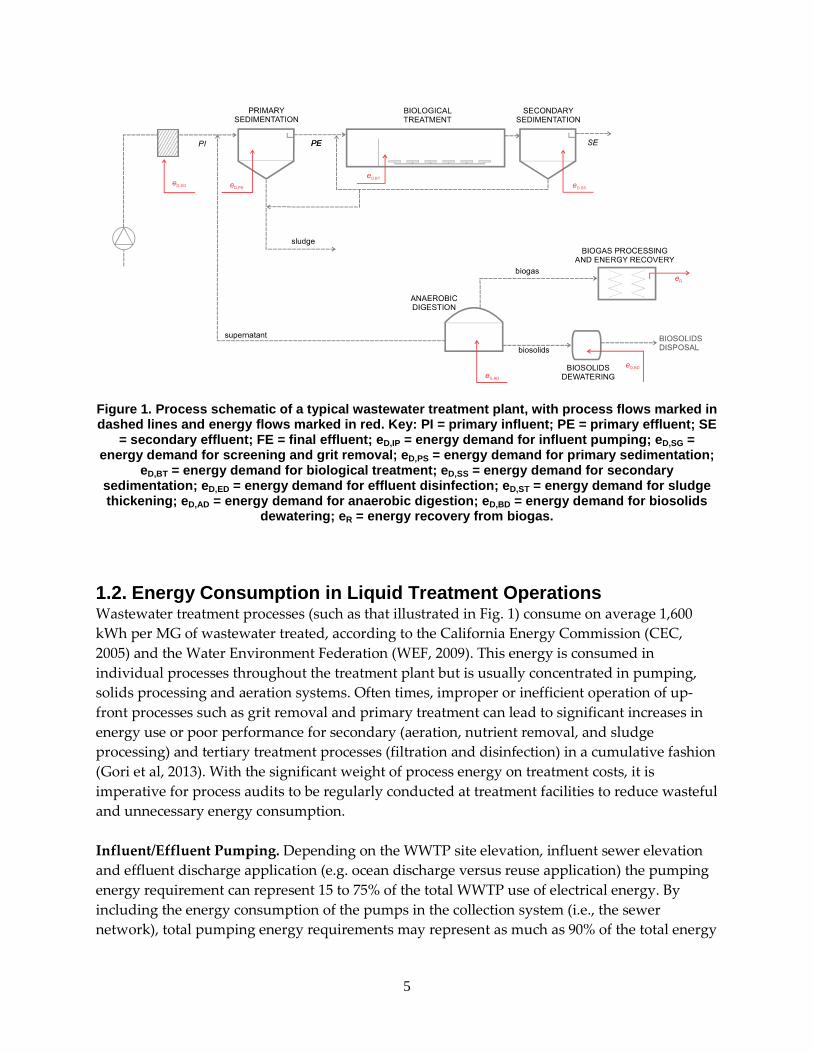
CHAPTER 1: INTRODUCTION 1.1. Wastewater Characteristics and Treatment Processes In recent years California water resources have been under extreme stress due to augmented demand from a growing population, changing climate conditions associated with global warming, and a multi-year drought. These conditions have increased water resource costs and the operational costs of convential water supply systems, produced uneven year-to-year revenues for water utilities, and have delayed the expansion or additions of new water supply and treatment infrastructure. Since water and wastewater conveyance and treatment require large amounts of energy, these infrastructural sectors of our society have been identified as a promising arena in which to reduce energy usage and costs. From a Statewide perspective, energy costs and energy intensity per unit of water consumed (on average) are high in Southern California, when compared to Northern California. This is because a significant source of supply for the Southern part of the State is imported from the Northern area. Energy is used to convey water through a network of canals, pipelines, and tunnels exceeding 700 miles in length, with the additional lift of approximately 2000 feet on its path to overcome elevation changes. In addition to lowering operating costs of wastewater treatment by more efficiently using energy at individual plants, using locally treated wastewater for non-potable uses as an alternative to importing water is a less energy intensive and is a more reliable supply. Although reclaimed water from wastewater treatment plants can displace raw and imported water supplies in all areas of the State thus lowering the energy use associated with the water management in California, wastewater treatement plants are typically energy intensive operations. According to the California Energy Commission, a typical secondary treatment plant (Fig. 1) may require up to 2,500 kWh per million gallon (MG) of wastewater treated. This energy use is consumed in many individual processes throughout the treatment plant but is usually concentrated in pumping, solids processing and aeration systems. Figure 1 illustrates the main wastewater treatment components, which are discussed in the following sections in more detail.
5
Figure 1. Process schematic of a typical wastewater treatment plant, with process flows marked in dashed lines and energy flows marked in red. Key: PI = primary influent; PE = primary effluent; SE
= secondary effluent; FE = final effluent; eD,IP = energy demand for influent pumping; eD,SG = energy demand for screening and grit removal; eD,PS = energy demand for primary sedimentation;
eD,BT = energy demand for biological treatment; eD,SS = energy demand for secondary sedimentation; eD,ED = energy demand for effluent disinfection; eD,ST = energy demand for sludge thickening; eD,AD = energy demand for anaerobic digestion; eD,BD = energy demand for biosolids
dewatering; eR = energy recovery from biogas.
1.2. Energy Consumption in Liquid Treatment Operations Wastewater treatment processes (such as that illustrated in Fig. 1) consume on average 1,600 kWh per MG of wastewater treated, according to the California Energy Commission (CEC, 2005) and the Water Environment Federation (WEF, 2009). This energy is consumed in individual processes throughout the treatment plant but is usually concentrated in pumping, solids processing and aeration systems. Often times, improper or inefficient operation of up-front processes such as grit removal and primary treatment can lead to significant increases in energy use or poor performance for secondary (aeration, nutrient removal, and sludge processing) and tertiary treatment processes (filtration and disinfection) in a cumulative fashion (Gori et al, 2013). With the significant weight of process energy on treatment costs, it is imperative for process audits to be regularly conducted at treatment facilities to reduce wasteful and unnecessary energy consumption. Influent/Effluent Pumping. Depending on the WWTP site elevation, influent sewer elevation and effluent discharge application (e.g. ocean discharge versus reuse application) the pumping energy requirement can represent 15 to 75% of the total WWTP use of electrical energy. By including the energy consumption of the pumps in the collection system (i.e., the sewer network), total pumping energy requirements may represent as much as 90% of the total energy
6
used (WEF, 2009). For a typical direct-drive influent pump with a 30 ft total dynamic head (TDH) and pump and motor efficiencies of 75% and 90% respectively, the power requirement would be 6 kW/MG (Lin, 2001). Hence, the energy use of influent pumping with the total dynamic head of 60 ft is 325 kWh for each MG per day (MGD). Screening and Grit Removal. Screens are typically the first treatment unit in WWTPs. Screening removes objects such as rags, paper, plastics, and metals to prevent damage and clogging of downstream equipment, piping, and appurtenances (US EPA, 2004). The energy consumption of influent screening is primarily due to the drive motor of the screen rake used to collect solids and prevent screen clogging. Screening represents typically a negligible portion of the total WWTP energy use, with units handling 15 MGD or less typically being driven by 0.55 kW motors (WEF, 2009). Larger treatment plants tend to be equipped with a proportional number of screening units, thus maintaining the small contribution of screening to the overall process power requirements and energy consumption. Although grit removal is a low or zero energy consuming process, effective grit removal can substantially reduce the energy required in other parts of the plant. If not properly removed, it can accumulate in anaerobic digesters, reduce effective digester volume by 50% (Gori et al, 2013), and reduce the biogas production. Primary Settling. The role of primary treatment is to remove the settleable solids from wastewater and decrease the cost and the energy consumption of the biological treatment downstream. Poor primary settling could cause larger use of energy in downstream operations. Conversely, efficient primary settling could increase the solid fraction of COD that is processed in anaerobic digestion, with an associated increase in biogas production and energy recovery, and a reduction in downstream biological energy consumption (Gori et al. 2013). On average, <5% of the total energy usage is used by primary settlers (Sobhani et al, 2011; WEF, 2009). Secondary Treatment. Following the preliminary and primary treatment, the remaining wastewater contaminants include colloidal and dissolved organic matter, nutrients, and dissolved inorganic solids flow to the secondary treatment process. In this process, the biological treatment is accomplished by employing an active culture of microorganism (either as suspended-growth or fixed-film), and introducing air or oxygen to maintain biological activity. Typically, the energy intensity of aearated secondary processes is 800-1,000 kWh/MG. In some cases, biofilm processes may be employed, ranging from 570 kWh/MG for trickling filters (WEF, 2009) to 3,500 kWh/MG for IFAS (Rosso et al, 2011). Secondary Settling. Most WWTPs use secondary clarifiers for solids settling from a biological process (e.g., activated sludge process or trickling filter). Secondary clarifiers are minor energy consumers (motors are seldom larger than 5 kW), therefore little energy cost savings can be found in this area. Effluent Disinfection. Disinfection destroys or inactivates most pathogens present in the secondary effluent. The most common methods, with respective energy intensity, WEF, 2009)
7
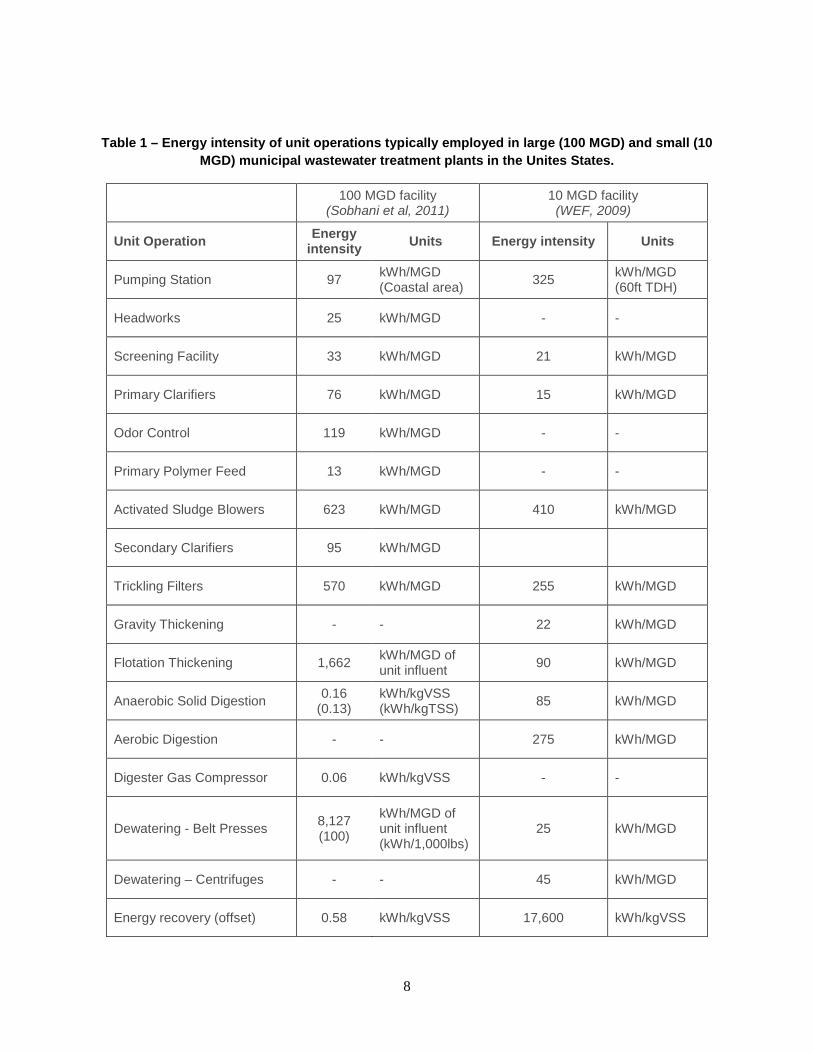
include: 1- chlorine gas solution or hypochlorite solution (42.5-170 kWh/MGD), 2- UV irradiation (50-150 kWh/MGD), and 3- ozone disinfection (100-500 kWh/MGD). 1.3. Energy Consumption in Solid Treatment Operations Sludge Thickening. The importance of thickening is in the reduction of the volume of sludge sent to digesters, consequently increasing the solids retention time (SRT) for the digester to convert sludge to biogas. Digester performance is dependent on SRT. Longer SRT enhances solids stabilization, reduces the pathogen density, and increases the biogas production. Similarly to sedimentation, thickening is a negligible contributor to the overall process energy requirements. Anaerobic Digestion. In the anaerobic digestion process, organic matter is converted to methane, carbon dioxide, ammonia, and water. Anaerobic digestion can result in a net production of energy and is a vital component to achieve process energy neutrality. During anaerobic decomposition, the optimum production of methane occurs in the 90-100oF mesophilic range and in the 125-140oF thermophilic range. Methane-rich digester gas can be collected and burned to produce mechanical and electrical energy, and heat. Also, it can be processed to match natural gas quality and used in the gas grid or compressed as vehicle fuel. According to the Water Environment Federation, the energy requirements for digester mixing and heating is 85 kWh/MGD of sludge treated, on average. Aerobic Digestion. Unlike anaerobic digestion, which reduces sludge volatile matter through anaerobic biochemical reduction process, aerobic digestion reduces sludge volatile matter through biochemical oxidation processes using an aerobic environment. Aerobic digestion is energy intensive and produces a sludge that is often difficult and costly to dewater. Due to its elevated energy-intensity and no energy recovery, aerobic digestion is uncommon in the United States. Energy Recovery. Digester gas contains 40 to 75% methane with 65% being a common percentage (Metcalf and Eddy, 2014). Pure methane has a heating value of 37,000 kJ/m3, which corresponds to 22,000 kJ/m3 for digester gas. Approximately 0.75-1.25 m3 of digester gas are produced per kg of volatile suspended solids (VSS) sludge destroyed in the anaerobic digestion. Table 1 summarizes the values reported in this section.
8
Table 1 – Energy intensity of unit operations typically employed in large (100 MGD) and small (10
MGD) municipal wastewater treatment plants in the Unites States.
100 MGD facility (Sobhani et al, 2011)
10 MGD facility (WEF, 2009)
Unit Operation Energy intensity Units Energy intensity Units
Pumping Station 97 kWh/MGD (Coastal area) 325 kWh/MGD
(60ft TDH)
Headworks 25 kWh/MGD - -
Screening Facility 33 kWh/MGD 21 kWh/MGD
Primary Clarifiers 76 kWh/MGD 15 kWh/MGD
Odor Control 119 kWh/MGD - -
Primary Polymer Feed 13 kWh/MGD - -
Activated Sludge Blowers 623 kWh/MGD 410 kWh/MGD
Secondary Clarifiers 95 kWh/MGD
Trickling Filters 570 kWh/MGD 255 kWh/MGD
Gravity Thickening - - 22 kWh/MGD
Flotation Thickening 1,662 kWh/MGD of unit influent 90 kWh/MGD
Anaerobic Solid Digestion 0.16 (0.13)
kWh/kgVSS (kWh/kgTSS) 85 kWh/MGD
Aerobic Digestion - - 275 kWh/MGD
Digester Gas Compressor 0.06 kWh/kgVSS - -
Dewatering - Belt Presses 8,127 (100)
kWh/MGD of unit influent (kWh/1,000lbs)
25 kWh/MGD
Dewatering – Centrifuges - - 45 kWh/MGD
Energy recovery (offset) 0.58 kWh/kgVSS 17,600 kWh/kgVSS
9
1.4. Objectives of this Research Project The costs associated with professional plant audits oftentimes run as high as tens of thousands of dollars and require a team with special knowledge and experience. Most wastewater treatment plants do not perform energy audits on a regular basis. The most common reasons are: too complex to be done by an operator, no allocation in the operations and maintenance (O&M) budget, too expensive and time consuming, or operators too busy or unwilling to take on this added responsibility. There could be a solution, if a tool could be provided so that a trained individual (i.e., a utility energy representative with no other services to sell, thereby acting as a disinterested party, only concerned with energy conservation) would need only a few hours of the plant staff to gather information and then be able to provide an audit of the plant energy consumption, with comparisons to recognized benchmarks and detailed recommendations and at no cost to the plant. In addition, this individual could also guarantee minimum energy efficiency improvements at the plant (e.g., at least 10%) with specific recommendations on specific equipment and process change needs. In most cases, capital expenditures would not be necessary because the audit recommendations would be implemented by improving operation of existing equipment. Many of the recommendations would result in minor process modifications, equipment adjustment, duty schedule modifications, and/or scheduled routine maintenance. Finally, for older plants, there may be recommendations for major capital improvements that may increase treatment efficiency as well as conserve energy. The intent of this study, unlike previous studies, was focused on benchmarking individual plants over time (i.e., what the plant performance is now versus what it was earlier and what could be with and without recommended improvements). The software for energy benchmarking (named eBen) produced by this project includes spreadsheets for benchmarking individual plants. Specifically, this study addressed four areas:
• Develop a comprehensive database of the performance and equipment used in the treatment processes;
• Design user-friendly spreadsheet software to audit existing plants, evaluate operations and energy savings;
• Compare process and equipment performance of the plant using model data vs. current plant data;
• Provide plant specific recommendations for energy efficiency improvement. The software was developed for the following users:
• Electric utility account representatives and energy efficiency program managers; • Treatment plant manager, design engineers, and plant operating personnel.

10
Using the eBen software, users are able to compare actual energy use with site-specific calculations, identify ways to improve energy efficiency, and calculate potential energy savings based on specific performance data. This can lead to improvements in rebate calculations and more accurate determination of energy saving measures. In addition, electric utility energy efficiency program managers can gather the results of site-specific evaluations into a service area assessment of the potential for electrical energy and peak power demand reduction. This spreadsheet-based software is editable, thus providing an opportunity for advanced users to expand it or tailor it to site-specific needs.

11
CHAPTER 2: Software Development This chapter presents the technology assessment, integration of process energy and the development of computer codes and interface. Both the energy consumption by the process units and the energy recovery from biogas combustions were quantified. The energy components were calculated in two different ways:
1) as a function of the water characteristics (e.g., BOD5, NH4, and TSS), process conditions (e.g., dynamic head, and oxygen requirements), and operating parameters (e.g., oxygen transfer efficiency, diffusers pressure drop). This calculation yields the theoretical energy usage that the process should require;
2) based on the equipment utilized in each unit (e.g., pumps, blowers, filters). This calculation yields the actual energy usage, reflecting the limitations of the existing equipment units, and their respective duty cycles.
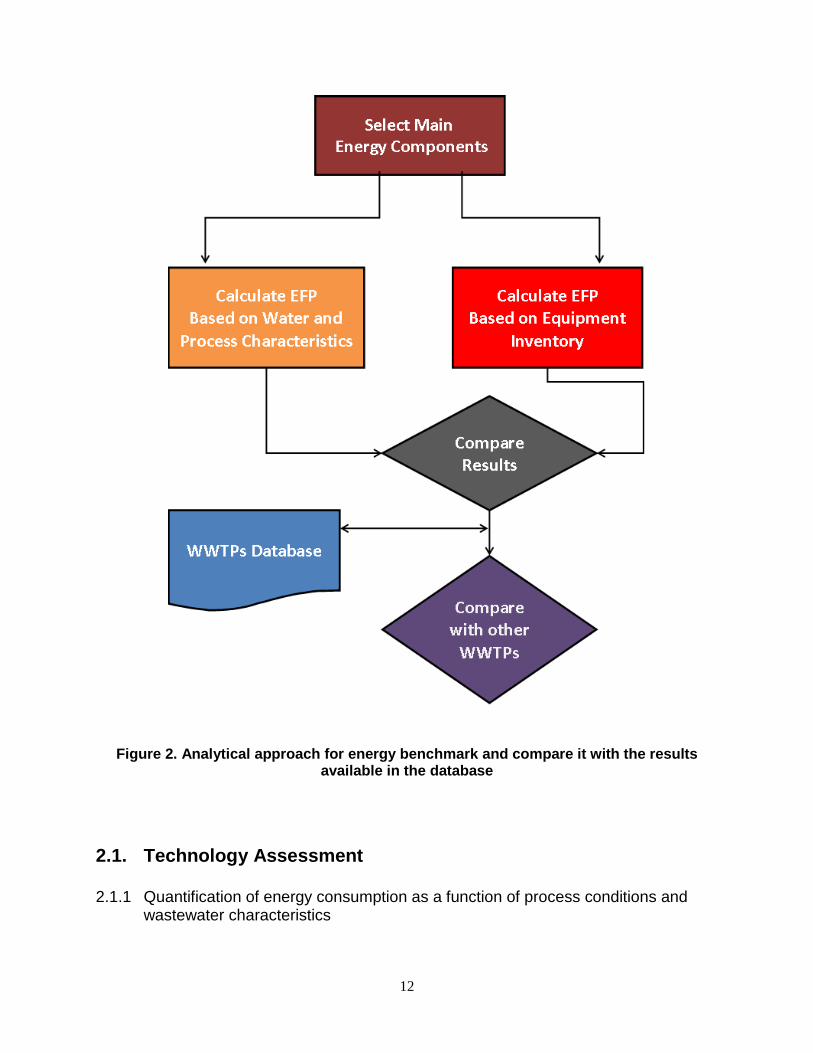
Comparing the results of these two methods portrays the most comprehensive picture of the energy usage and recovery in the treatment processes. By comparison with similar plants, the areas that are candidates for energy efficiency improvement are highlighted. Figure 2 presents the main components of the software architecture, highlighting the two methodologies used.
12
Figure 2. Analytical approach for energy benchmark and compare it with the results available in the database
2.1. Technology Assessment
2.1.1 Quantification of energy consumption as a function of process conditions and wastewater characteristics
13
The research team identified the components of energy consumption as a function of process conditions. Depending on the data availability, the software calculates for each of the following units the energy requirements based on either Table 1 or a specific formula:
• influent pumps (calculated using Table 1 or a pump formula; Lin 2001) • effluent sludge/cake pumps (calculated using using Table 1 or a pump formula; Lin
2001) • effluent liquid pumps (calculated using using Table 1 or a pump formula; Lin 2001) • drive units (calculated using using Table 1 or a pump formula; Lin 2001) • blower units (calculated using using Table 1 or an adiabatic compressor formula;
Metcalf and Eddy, 2014) • heating units (calculated using using Table 1 or a heat flow formula; Metcalf and Eddy,
2014) • mixing systems (calculated using using Table 1 or a mixing formula; Lin 2001) • odor control (calculated using using Table 1 or an adiabatic compressor formula;
Metcalf and Eddy, 2014) • disinfection units (calculated using Table 1 data) • miscellaneous units and appurtenances (calculated using Table 1 data) • energy recovery (calculated using the caloric value of biogas, i.e. 22MJ/m3)
The energy benchmarking values reported in Table 1, combined with mass balance analysis (Metcalf and Eddy, 2014), were used to calculate energy values as function of process conditions and wastewater characteristics. For example, using the energy intensity values in Table 1 and the process flow rate, several units can be benchmarked immediately. In the software developed here, if the load concentration (i.e., BOD5 or COD and ammonia) is known, a more refined estimation of the energy requirements for primary settling and biological treatment can be produced, using mass balance analysis on the primary clarifier and an adiabatic formula for the blowers needed in the secondary treatment (Lin, 2001; Metcalf and Eddy, 2014). All the calculations in this step follow the textbook procedures that universally acknowledged and used in process design (WEF, 2010).
2.1.2 Quantification of energy consumption as a function of equipment inventory and
duty cycle
For each process, the rational procedure for the calculation of energy consumption based on the inventory followed this:
where Eprocess = process energy Punit = power requirement for the equipment unit Nunit = number of units on duty Tduty = duration of the duty cycle
14
2.1.3 Creation of an energy-footprint database
The research team reviewed the energy footprint of solid processes presented in the available literature. For this purpose, the initial database is a compilation of results presented in proceedings of technical conferences (e.g., WEF specialty conferences, WEFTEC, IWA conferences, etc.), in peer-reviewed journal papers, in engineering consulting reports, and in manufacturers literature. As the eBen end-users continue to utilize the software, the results saved in the sheet contribute to populating the database, thereby increasing the robustness of the benchmarking quantifications and recommendations. Also, the results of the software demonstrations conducted at full-scale facilities were saved into the eBen database. The eBen provides features for the user to identify the results of an energy benchmarking exercise in the general database, or to simply save the results anonymously as part of the general data population. 2.2 Integration of Process Energy Balances A seamless integration of the process energy balances was performed for the following processes:
• Influent Pumping • Preliminary treatment (head works): grit chamber, coarse screens, and fine screens • Primary Treatment: gravity settling • Secondary Treatment: trickling filters, conventional activated-sludge, modified Ludzack-
Ettinger activated sludge, high purity oxygen activated sludge, oxidation ditches, and aerated lagoons, membrane bioreactors
• Further (Tertiary) Treatment : sand filters and multimedia filters • Disinfection: chlorination, UV irradiation, and ozonation • Thickening: gravity thickening, centrifugal thickening, and dissolved air flotation • Sludge Stabilization (digestion): anaerobic and aerobic digestion • Dewatering: belt filter presses and centrifuges • Energy Recovery: internal combustion engines and combined-cycle turbines
2.3 Development of a Computer Code and Interface
The activities in this section included: 2.3.1. Integration of solids and liquid processing (Phases I and II of the project) by achieving
computational and formatting consistency throughout the software; 2.3.2. Debugging in the VBA.net platform, reduction of file size, simplification of the user
interface to prevent compatibility issues in different operating systems; 2.3.3. Time-dependent plots to show the treatment plant’s standing in terms of energy
15
consumption and compare recommendations on energy consumption results normalized by hydraulic, solids or organic loading, depending on the unit process;
2.3.4. Production of a tutorial user-manual for the eBen (available in the Appendix); 2.3.5. Communication and demonstration of the eBen software at selected full-scale treatment
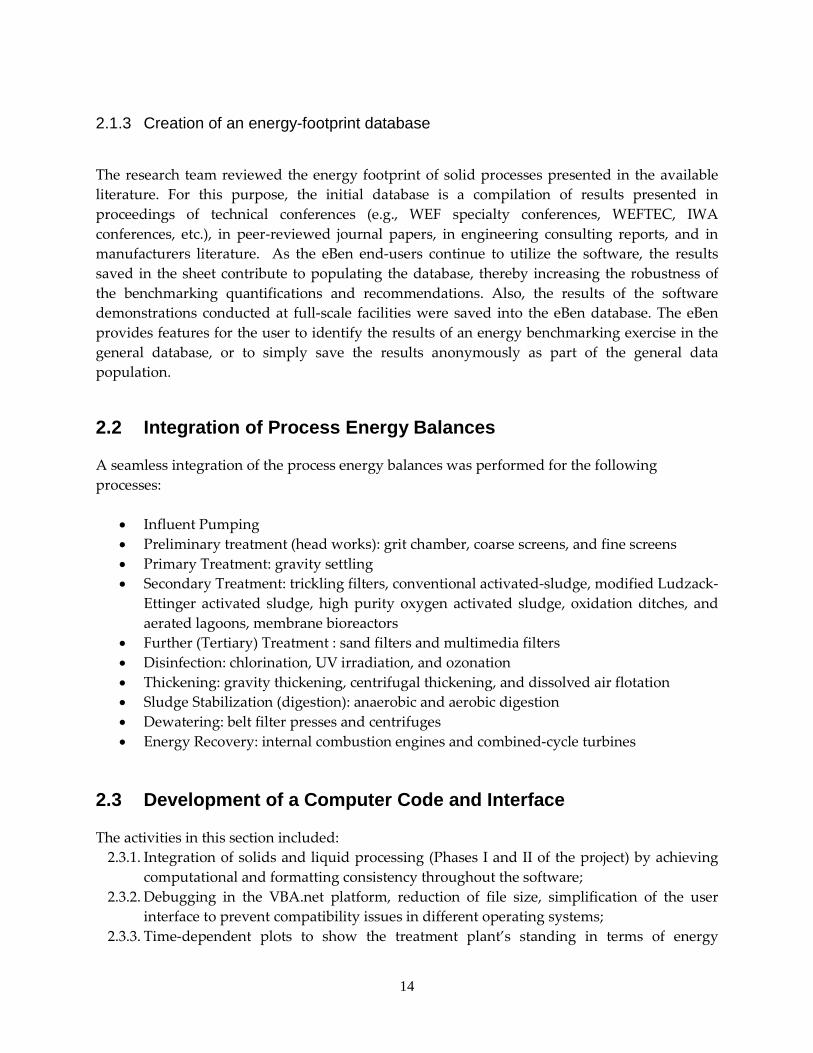
plants. Figure 3 presents the Graphical User Interface of the energy benchmarking software that was built to accomplish this task. The graphical user interface is dynamic in that it conforms to the plant's configuration.
Figure 3. Graphical User Interface for the eBen: a - (top image) Process Selection and
Process Flow Diagram; b - (bottom image) Process Selection, Basic Parameter Input and Executing Functions

16
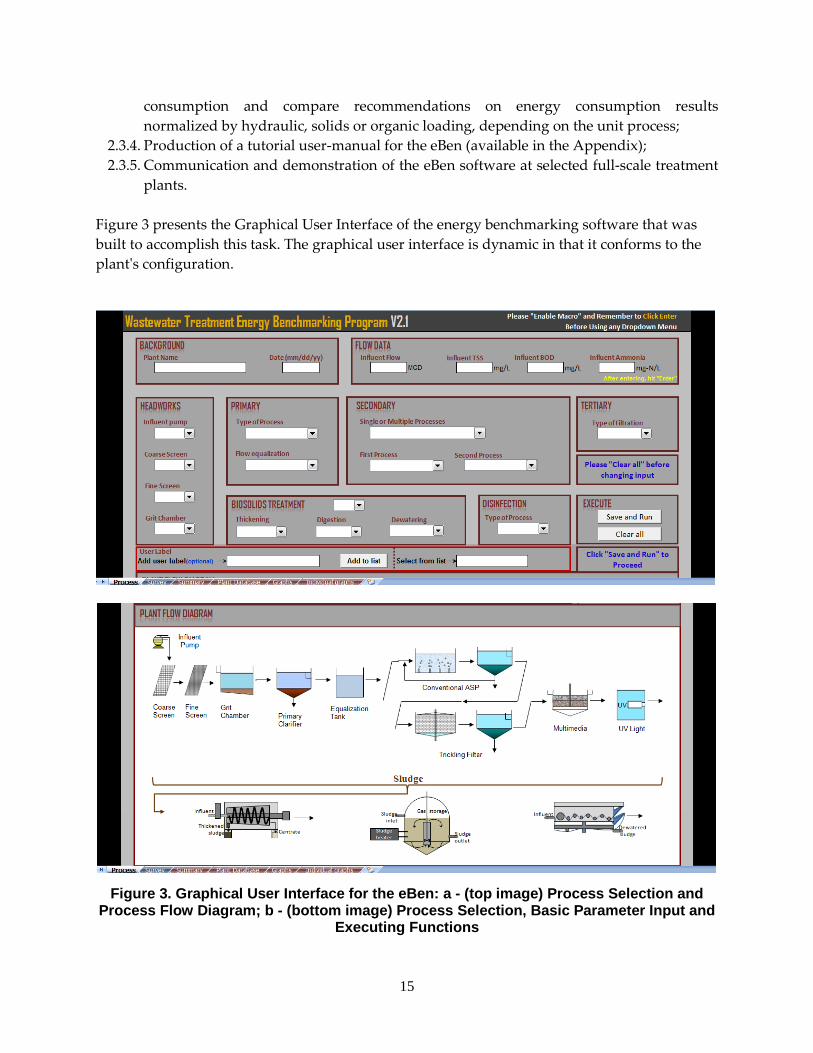
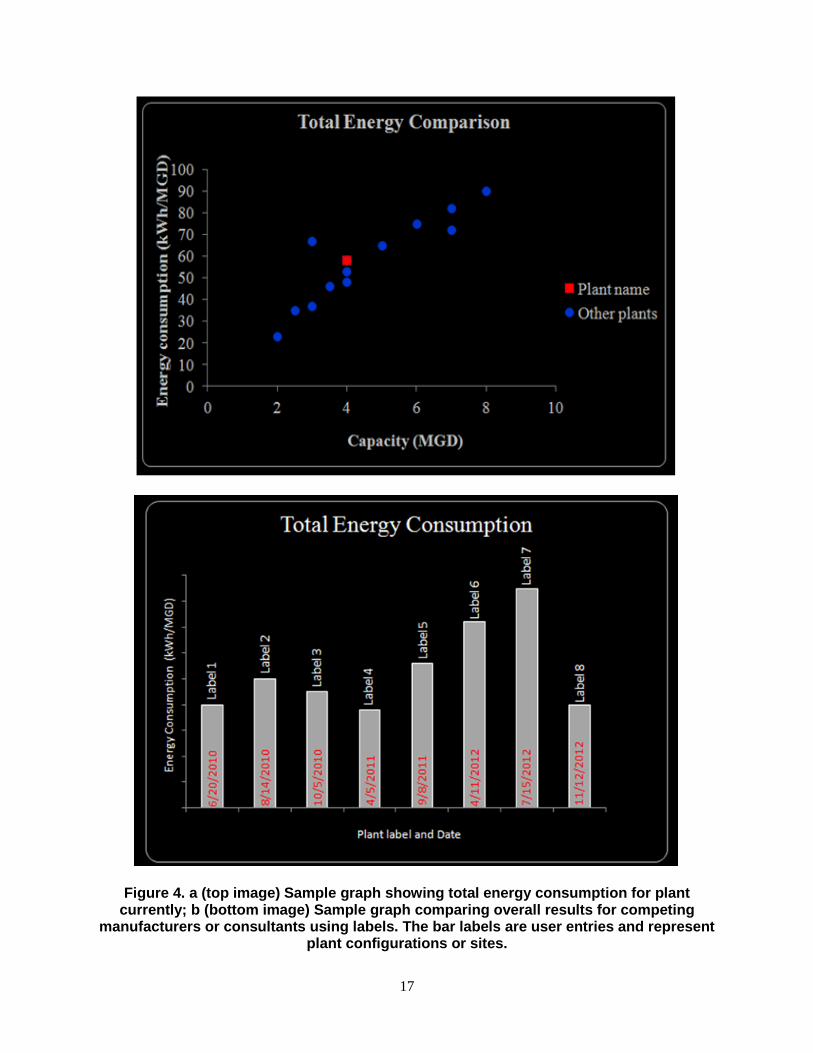
2.3.1 Integration of solids and liquid processing for energy benchmarking software All the unit process components for the solids phase were integrated with those of the liquid phase. Overall, all the liquid and solid treatment processes listed earlier were integrated in one software product. The team achieved seamless consistency in the computations and formatting across all unit processes. 2.3.2 Debugging and Testing, File size Reduction, User Interface simplification for operating system compatibility The possible and existing bugs in the computer code were evaluated by using the VBA.net platform. The spreadsheets were tested for possible bugs generated because of the program integration. The team also tested unit process calculations for Phase I and II. The unnecessary components were removed from the software to reduce file size, including extraneous images, computer code and shape files. These steps reduced the file size by 50% to facilitate sharing. The user interface layouts were simplified further for more rapid and easier input. 2.3.3 Time-dependent plots showing treatment plant’s energy standing, normalized energy consumption by hydraulic, solids or organic loading The plant database stored by the program was linked to the plots, which graph over time the total energy consumption for the plant being analyzed. These plots also graph over time the energy consumption normalized by the hydraulic or organic loading, which is generated by the software based on the unit process. The importance of such normalizations becomes apparent when highly concentrated or diluted wastewater needs to be treated and the facility under study needs to be compared at a leveled-field with others. The software generates plots for different labels denoting recommendations. Figure 4 shows examples.
17
Figure 4. a (top image) Sample graph showing total energy consumption for plant currently; b (bottom image) Sample graph comparing overall results for competing
manufacturers or consultants using labels. The bar labels are user entries and represent plant configurations or sites.

18
2.3.4 Software tutorial production
A detailed tutorial user manual was prepared for the eBen with updates for each version along the software development. This document describes each section of the program in detail to the user through a step-by-step procedure. The most recent version of the tutorial is available in the Appendix. 2.3.5 Communication and demonstration of the eBen software at selected full-scale treatment plants The team contacted several wastewater treatment plants in Los Angeles and Orange Counties for software demonstration. The software was demonstrated at the Whittier Narrows plant (Los Angeles County Sanitation District), Michelson Water Reclamation Plant (Irvine Ranch Water District), Terminal Island (City of Los Angeles), and the Simi Valley Plant (City of Simi Valley). Upon request of the participating entities, the demonstration results shown below are reported anonymously.

19
CHAPTER 3: Field Testing of Code through Plant Audits The activities in this chapter were conducted to carry out field testing and included:
1. Debugging using the VBA.net platform, reducing the file size, simplifying the user interface all became more compatible with different computer operating systems.
2. Conducting the ‘New Technologies to Reduce Energy Use at Wastewater Treatment Facilities’ workshop at Southern California Edison’s Annual Water Conference in 3 sessions. During the workshop the water agency representatives were educated about how the eBen software can highlight the energy efficiency priorities for their facilities and how it can inform about the operational and equipment modifications and upgrades that can be implemented to enhance the plant’s energy efficiency in an economic manner. The slides presented at the workshop are available in the Appendix.
3. Participating in different meetings with water agencies to demonstrate the eBen functionality, and collect feedback:
• Irvine Ranch Water District • Orange County Water District • City of Simi Valley Sanitation Services • City of Los Angeles, Bureau of Sanitation • Sanitation Districs of Los Angeles County • DC Water
4. Participating in different meetings with consulting companies (e.g., CH2MHILL, Hazen
and Sawyer, Waterways, inCtrl) to demonstrate the eBen functionality, test the spreadsheets, and collect feedback.
5. Preparing a database of energy consumption in each process based on collected data from participating water agencies and categorized through the following parameters:
• Plant size (MGD) • Normalized energy consumption for unit plant influent (kWh/MG) • Normalized energy consumption for unit solids removal (e.g., kWh/BODremoved,
kWh/TSSremoved)
6. Providing time-dependent plots to show the treatment plant’s standing in terms of energy consumption, and compare recommendations from consultants or devices from manufacturers, include energy consumption results normalized by hydraulic, solids or organic loading depending on the unit process.
The following sections presents the results of energy benchmarking conducted in two municipal treatment plants located in California using the eBen:

20
1- Plant A treats municipal wastewater and reclaims water for landscape and agricultural
irrigation, and for industrial and commercial needs. The biomass is transferred to another treatment plant for further treatment via anaerobic digestion
2- Plant B is a reclamation plant that treats the wastewater through the primary and secondarty treatment processes and transfers the treated water to downstream purification plant for indirect potable reuse.
These results represent a demonstration of the eBen capabilities and are an example of eBen use. 3.1. Plant A
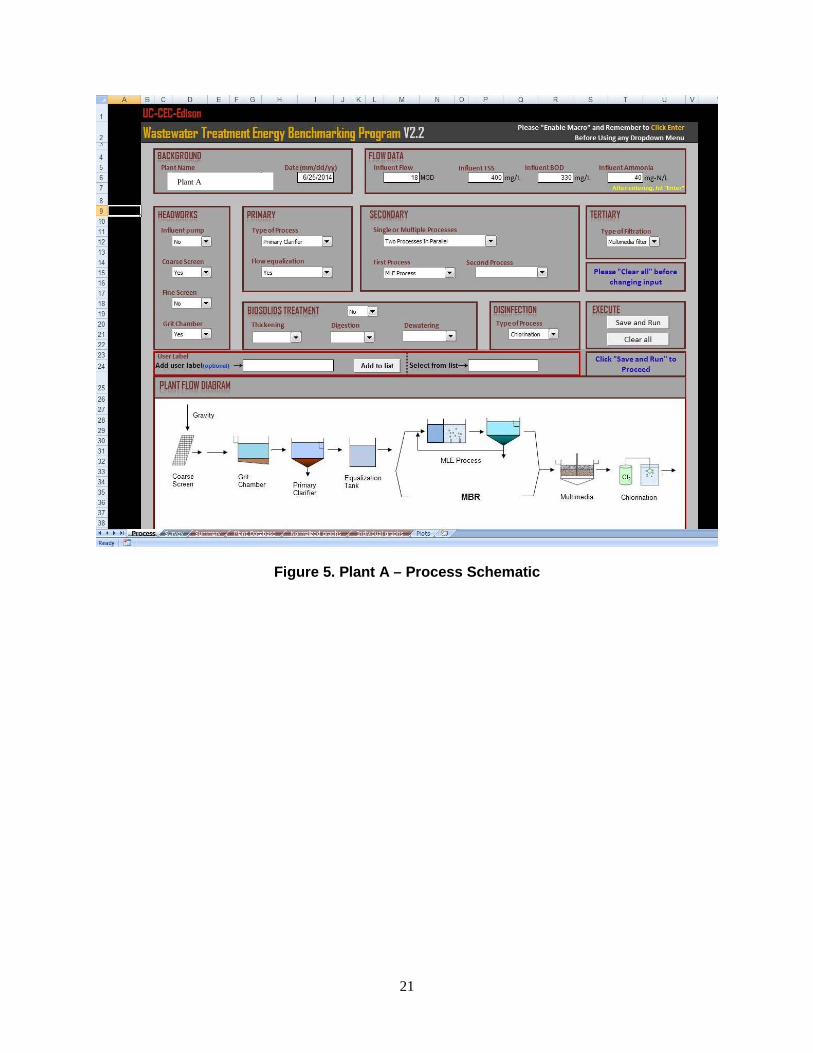
This facility treats municipal wastewater for reclamation, using these processes:
• Influent pumping • Coarse screens with grit removal • Primary clarifier with flow equalization tank • Parallel secondary processes: modified Ludzack-Ettinger activated sludge and
membrane bioreactor • Multimedia tertiary filtration • Effluent chlorination • No biosolids processing on site
3.1.1. Schematic processes and output summary of Plant A
Below is a schematic of Plant A’s processes and the output summary of its energy consumption in each process based on the process influent and solids removal provided by eBen.
21
Figure 5. Plant A – Process Schematic
Plant A
22
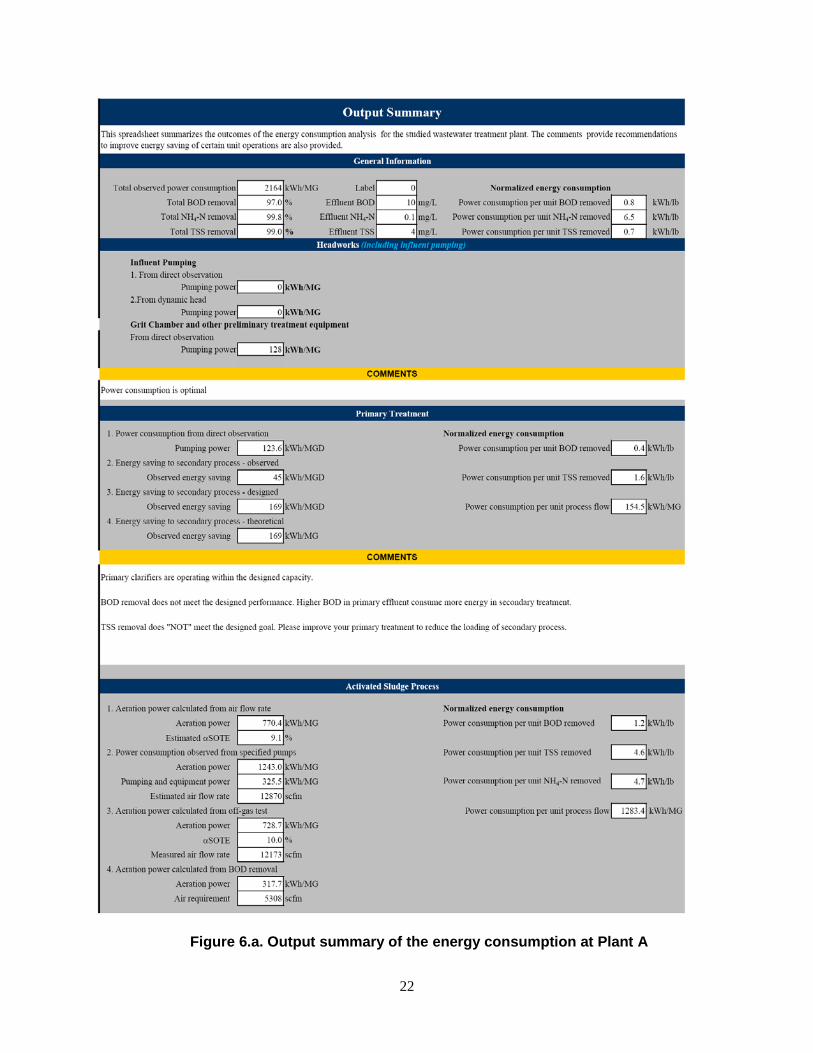
Figure 6.a. Output summary of the energy consumption at Plant A
23
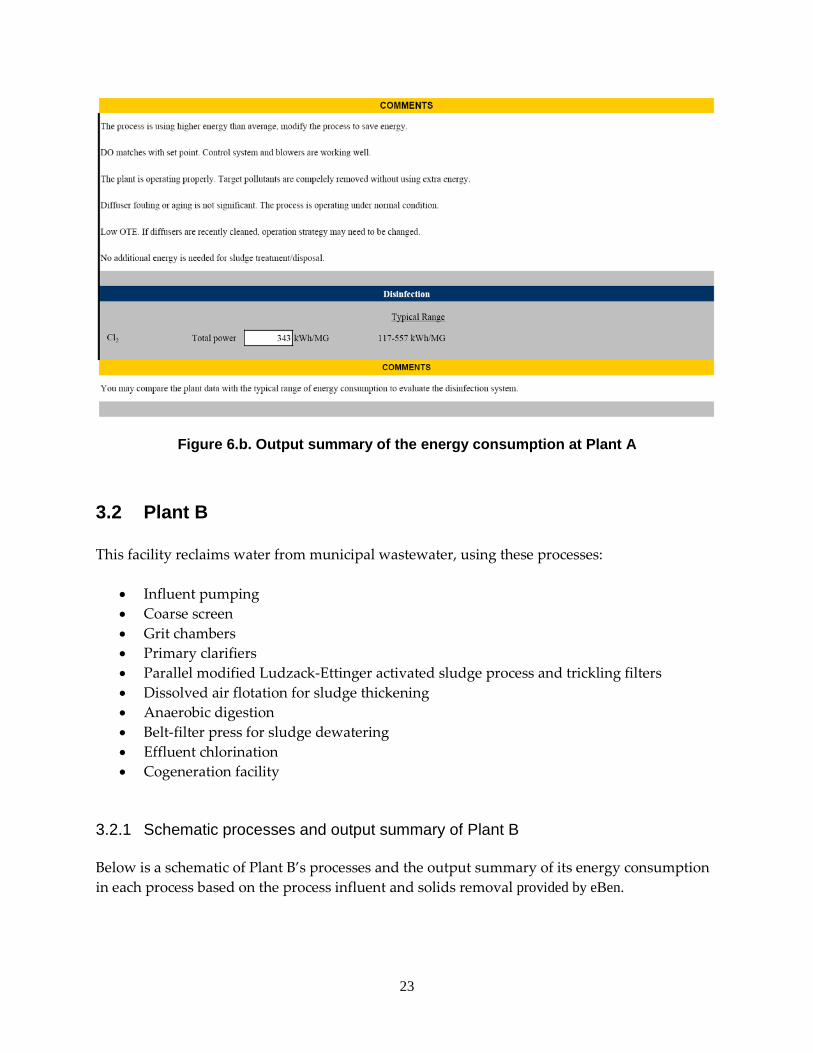
Figure 6.b. Output summary of the energy consumption at Plant A
3.2 Plant B
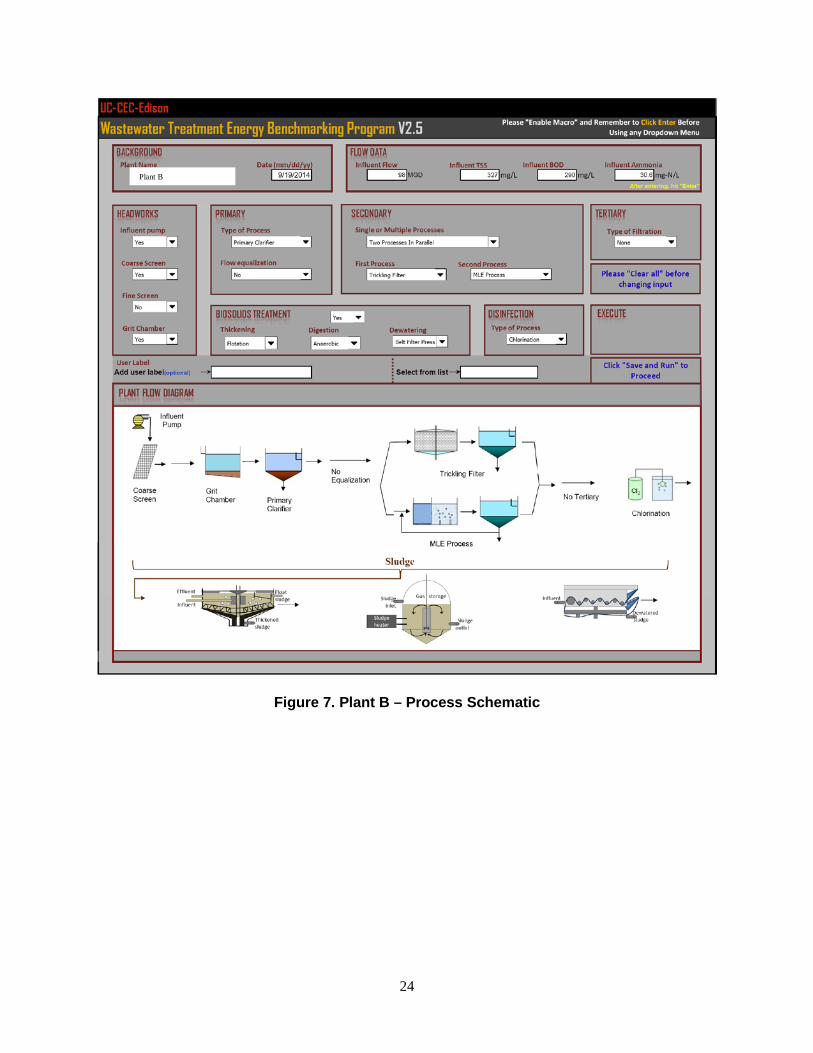
This facility reclaims water from municipal wastewater, using these processes:
• Influent pumping • Coarse screen • Grit chambers • Primary clarifiers • Parallel modified Ludzack-Ettinger activated sludge process and trickling filters • Dissolved air flotation for sludge thickening • Anaerobic digestion • Belt-filter press for sludge dewatering • Effluent chlorination • Cogeneration facility
3.2.1 Schematic processes and output summary of Plant B
Below is a schematic of Plant B’s processes and the output summary of its energy consumption in each process based on the process influent and solids removal provided by eBen.
24
Figure 7. Plant B – Process Schematic
Plant B
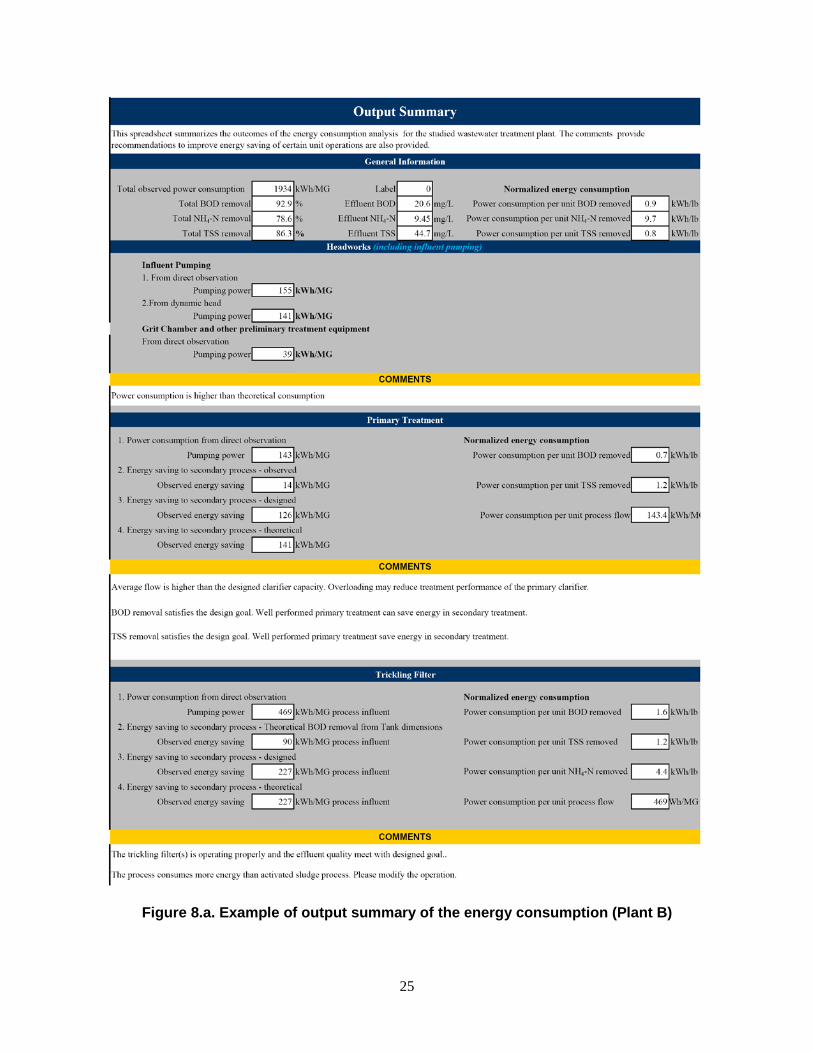
25
Figure 8.a. Example of output summary of the energy consumption (Plant B)
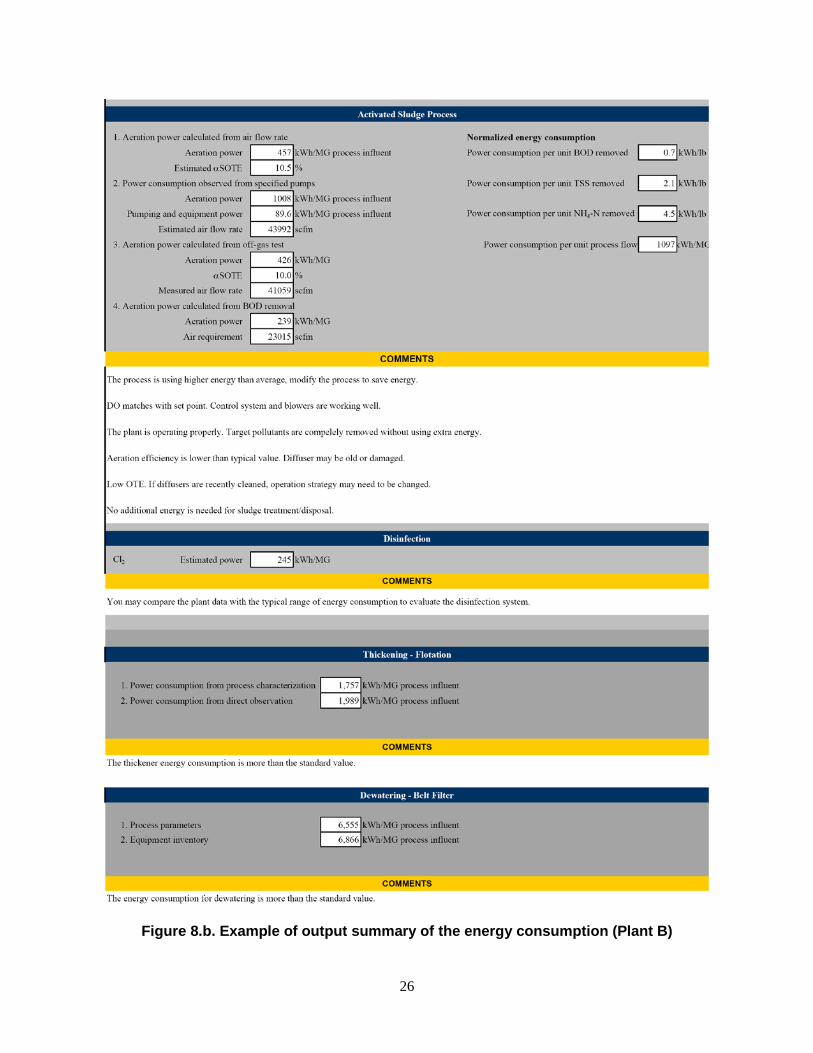
26
Figure 8.b. Example of output summary of the energy consumption (Plant B)
27
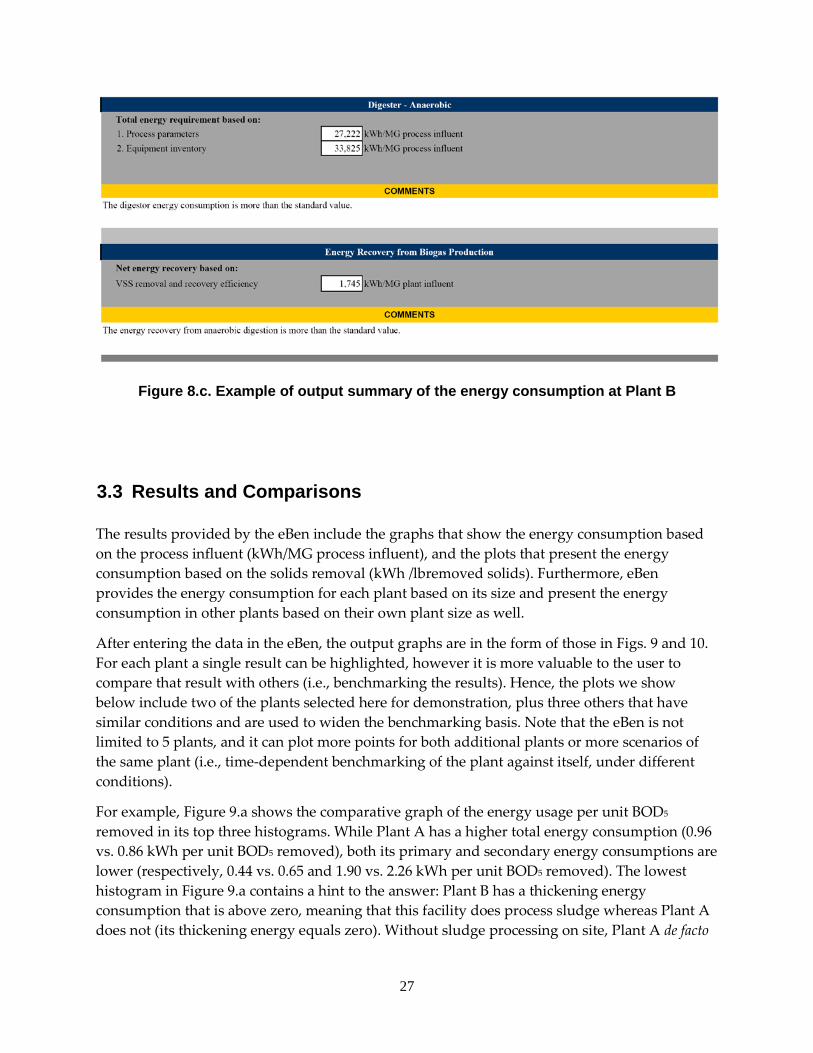
Figure 8.c. Example of output summary of the energy consumption at Plant B
3.3 Results and Comparisons
The results provided by the eBen include the graphs that show the energy consumption based on the process influent (kWh/MG process influent), and the plots that present the energy consumption based on the solids removal (kWh /lbremoved solids). Furthermore, eBen provides the energy consumption for each plant based on its size and present the energy consumption in other plants based on their own plant size as well.
After entering the data in the eBen, the output graphs are in the form of those in Figs. 9 and 10. For each plant a single result can be highlighted, however it is more valuable to the user to compare that result with others (i.e., benchmarking the results). Hence, the plots we show below include two of the plants selected here for demonstration, plus three others that have similar conditions and are used to widen the benchmarking basis. Note that the eBen is not limited to 5 plants, and it can plot more points for both additional plants or more scenarios of the same plant (i.e., time-dependent benchmarking of the plant against itself, under different conditions).
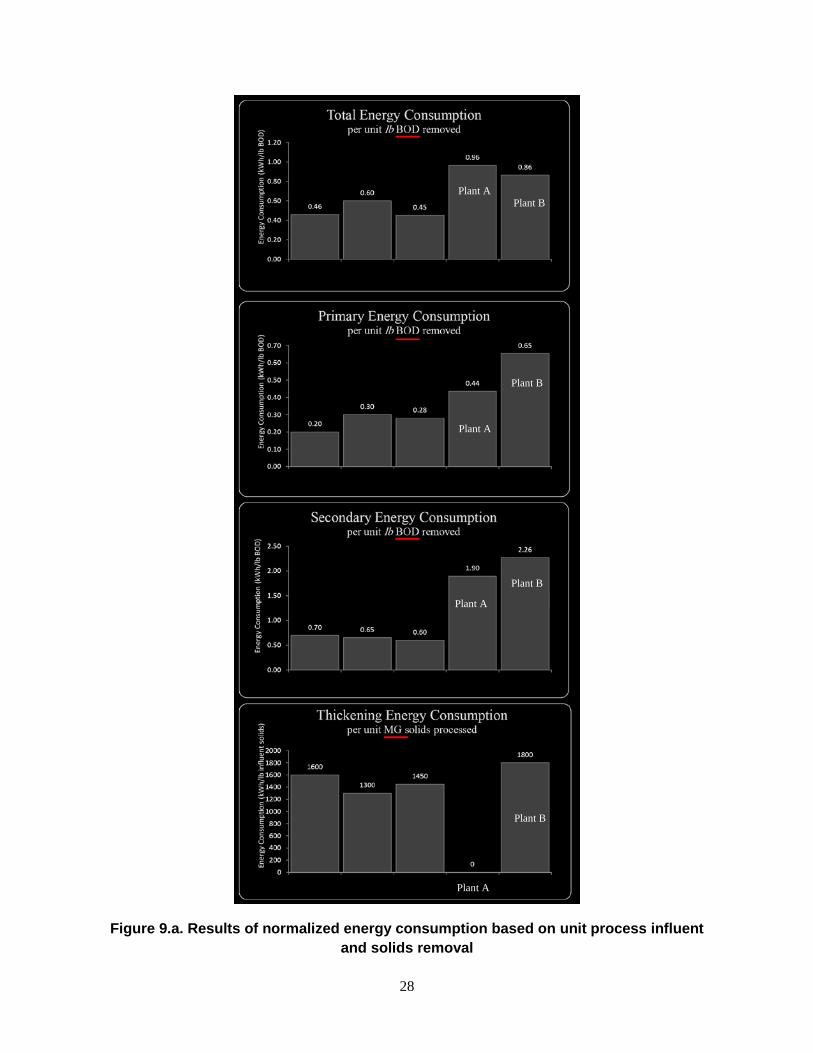
For example, Figure 9.a shows the comparative graph of the energy usage per unit BOD5 removed in its top three histograms. While Plant A has a higher total energy consumption (0.96 vs. 0.86 kWh per unit BOD5 removed), both its primary and secondary energy consumptions are lower (respectively, 0.44 vs. 0.65 and 1.90 vs. 2.26 kWh per unit BOD5 removed). The lowest histogram in Figure 9.a contains a hint to the answer: Plant B has a thickening energy consumption that is above zero, meaning that this facility does process sludge whereas Plant A does not (its thickening energy equals zero). Without sludge processing on site, Plant A de facto
28
Figure 9.a. Results of normalized energy consumption based on unit process influent and solids removal
Plant A Plant B
Plant A
Plant A
Plant A
Plant B
Plant B
Plant B
29
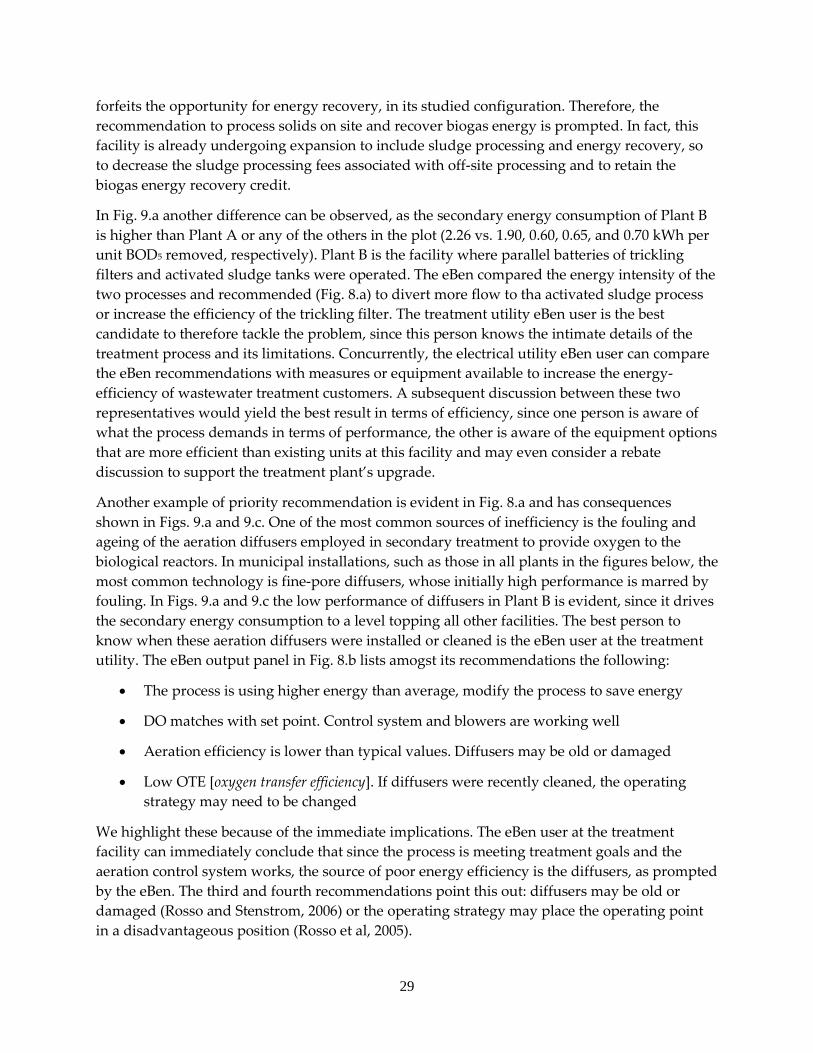
forfeits the opportunity for energy recovery, in its studied configuration. Therefore, the recommendation to process solids on site and recover biogas energy is prompted. In fact, this facility is already undergoing expansion to include sludge processing and energy recovery, so to decrease the sludge processing fees associated with off-site processing and to retain the biogas energy recovery credit.
In Fig. 9.a another difference can be observed, as the secondary energy consumption of Plant B is higher than Plant A or any of the others in the plot (2.26 vs. 1.90, 0.60, 0.65, and 0.70 kWh per unit BOD5 removed, respectively). Plant B is the facility where parallel batteries of trickling filters and activated sludge tanks were operated. The eBen compared the energy intensity of the two processes and recommended (Fig. 8.a) to divert more flow to tha activated sludge process or increase the efficiency of the trickling filter. The treatment utility eBen user is the best candidate to therefore tackle the problem, since this person knows the intimate details of the treatment process and its limitations. Concurrently, the electrical utility eBen user can compare the eBen recommendations with measures or equipment available to increase the energy-efficiency of wastewater treatment customers. A subsequent discussion between these two representatives would yield the best result in terms of efficiency, since one person is aware of what the process demands in terms of performance, the other is aware of the equipment options that are more efficient than existing units at this facility and may even consider a rebate discussion to support the treatment plant’s upgrade.
Another example of priority recommendation is evident in Fig. 8.a and has consequences shown in Figs. 9.a and 9.c. One of the most common sources of inefficiency is the fouling and ageing of the aeration diffusers employed in secondary treatment to provide oxygen to the biological reactors. In municipal installations, such as those in all plants in the figures below, the most common technology is fine-pore diffusers, whose initially high performance is marred by fouling. In Figs. 9.a and 9.c the low performance of diffusers in Plant B is evident, since it drives the secondary energy consumption to a level topping all other facilities. The best person to know when these aeration diffusers were installed or cleaned is the eBen user at the treatment utility. The eBen output panel in Fig. 8.b lists amogst its recommendations the following:
• The process is using higher energy than average, modify the process to save energy
• DO matches with set point. Control system and blowers are working well
• Aeration efficiency is lower than typical values. Diffusers may be old or damaged
• Low OTE [oxygen transfer efficiency]. If diffusers were recently cleaned, the operating strategy may need to be changed
We highlight these because of the immediate implications. The eBen user at the treatment facility can immediately conclude that since the process is meeting treatment goals and the aeration control system works, the source of poor energy efficiency is the diffusers, as prompted by the eBen. The third and fourth recommendations point this out: diffusers may be old or damaged (Rosso and Stenstrom, 2006) or the operating strategy may place the operating point in a disadvantageous position (Rosso et al, 2005).
30
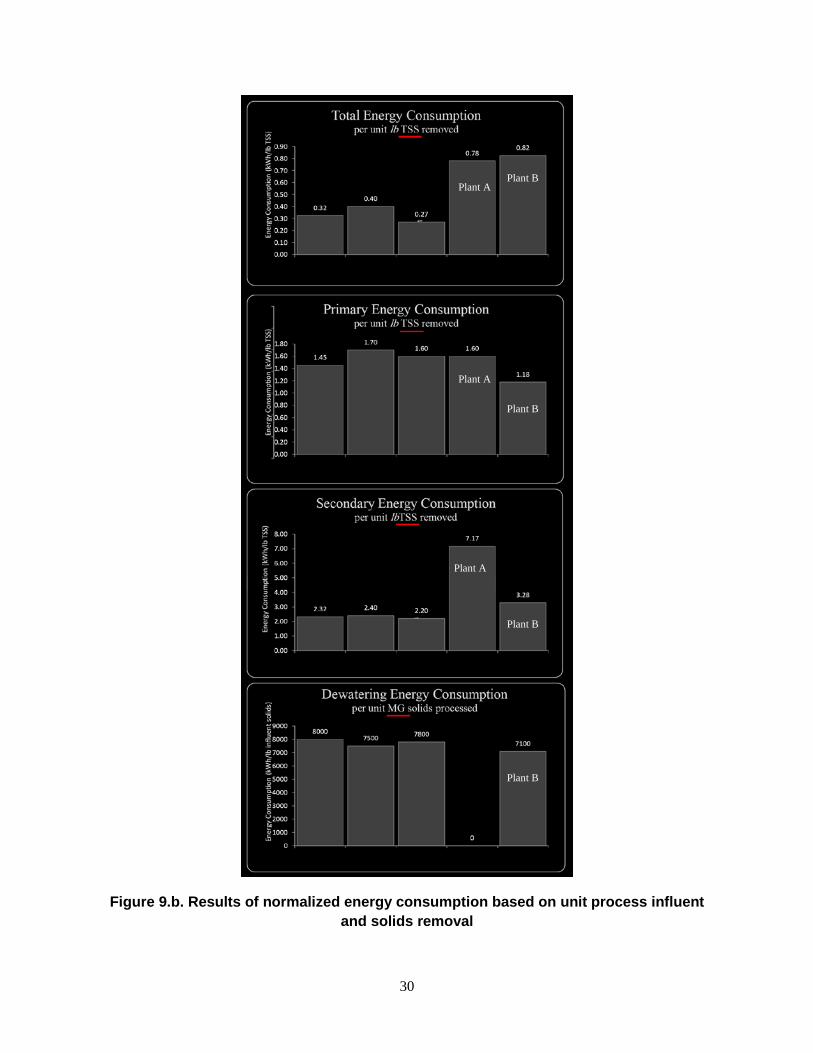
Figure 9.b. Results of normalized energy consumption based on unit process influent and solids removal
Plant A
Plant A
Plant A
Plant B
Plant B
Plant B
Plant B

31
Figure 9.c. Results of normalized energy consumption based on unit process influent and solids removal
In either case, only the treatment utility operator or engineer can verify the cause and discuss with the power utility representative the equipment and rebate options available to increase process energy efficiency.
Plant A
Plant A
Plant A
Plant B
Plant B
Plant B
32
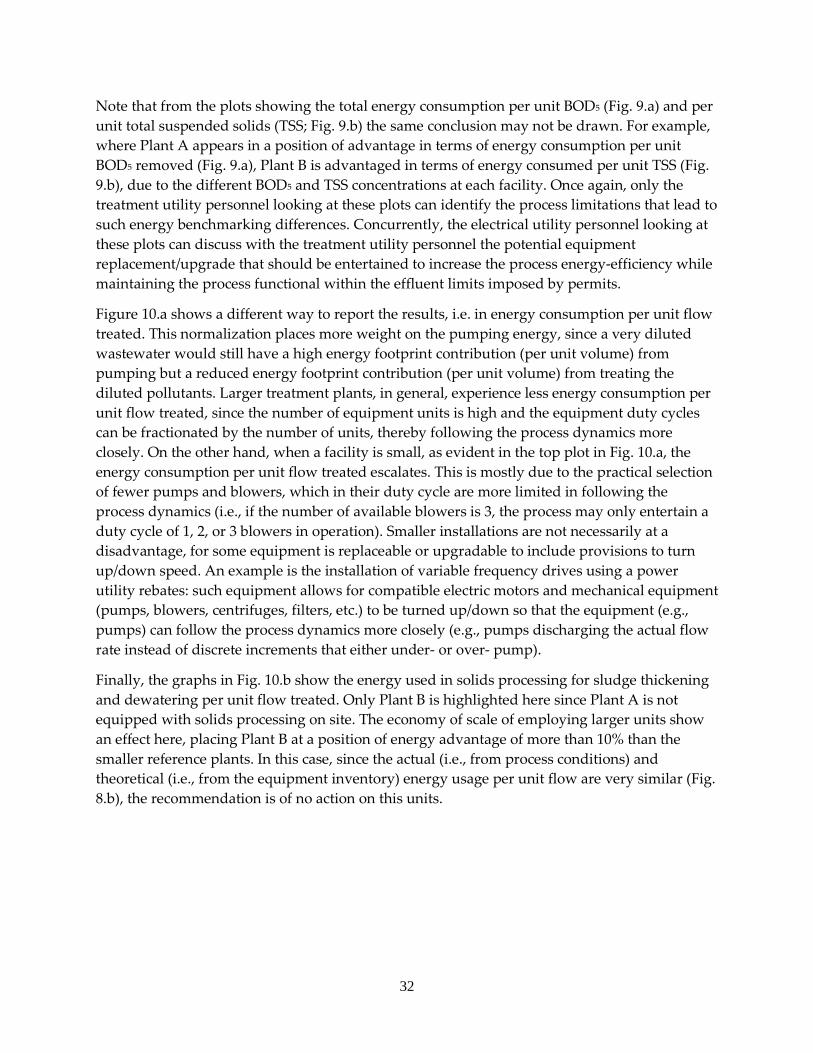
Note that from the plots showing the total energy consumption per unit BOD5 (Fig. 9.a) and per unit total suspended solids (TSS; Fig. 9.b) the same conclusion may not be drawn. For example, where Plant A appears in a position of advantage in terms of energy consumption per unit BOD5 removed (Fig. 9.a), Plant B is advantaged in terms of energy consumed per unit TSS (Fig. 9.b), due to the different BOD5 and TSS concentrations at each facility. Once again, only the treatment utility personnel looking at these plots can identify the process limitations that lead to such energy benchmarking differences. Concurrently, the electrical utility personnel looking at these plots can discuss with the treatment utility personnel the potential equipment replacement/upgrade that should be entertained to increase the process energy-efficiency while maintaining the process functional within the effluent limits imposed by permits.
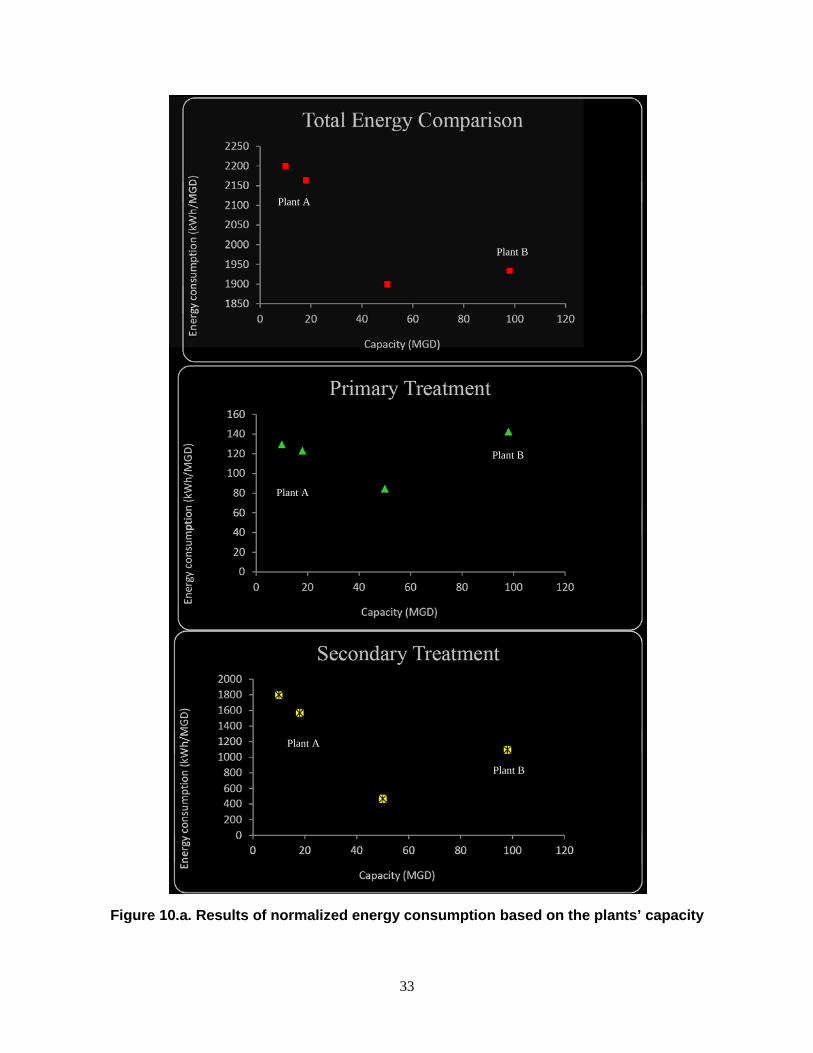
Figure 10.a shows a different way to report the results, i.e. in energy consumption per unit flow treated. This normalization places more weight on the pumping energy, since a very diluted wastewater would still have a high energy footprint contribution (per unit volume) from pumping but a reduced energy footprint contribution (per unit volume) from treating the diluted pollutants. Larger treatment plants, in general, experience less energy consumption per unit flow treated, since the number of equipment units is high and the equipment duty cycles can be fractionated by the number of units, thereby following the process dynamics more closely. On the other hand, when a facility is small, as evident in the top plot in Fig. 10.a, the energy consumption per unit flow treated escalates. This is mostly due to the practical selection of fewer pumps and blowers, which in their duty cycle are more limited in following the process dynamics (i.e., if the number of available blowers is 3, the process may only entertain a duty cycle of 1, 2, or 3 blowers in operation). Smaller installations are not necessarily at a disadvantage, for some equipment is replaceable or upgradable to include provisions to turn up/down speed. An example is the installation of variable frequency drives using a power utility rebates: such equipment allows for compatible electric motors and mechanical equipment (pumps, blowers, centrifuges, filters, etc.) to be turned up/down so that the equipment (e.g., pumps) can follow the process dynamics more closely (e.g., pumps discharging the actual flow rate instead of discrete increments that either under- or over- pump).
Finally, the graphs in Fig. 10.b show the energy used in solids processing for sludge thickening and dewatering per unit flow treated. Only Plant B is highlighted here since Plant A is not equipped with solids processing on site. The economy of scale of employing larger units show an effect here, placing Plant B at a position of energy advantage of more than 10% than the smaller reference plants. In this case, since the actual (i.e., from process conditions) and theoretical (i.e., from the equipment inventory) energy usage per unit flow are very similar (Fig. 8.b), the recommendation is of no action on this units.
33
Figure 10.a. Results of normalized energy consumption based on the plants’ capacity
Plant A
Plant A
Plant A
Plant B
Plant B
Plant B

34
Figure 10.b Results of normalized energy consumption based on the plants’ capacity
Plant B
Plant B

35
California IOU Electricity Ratepayer Benefits
By using the eBen software, users can compare actual energy use with site-specific calculations, identify ways to improve energy efficiency, and calculate potential energy savings based on specific performance data. This leads to fast prioritization of energy savings measures, to improvements in rebate calculations, and to more accurate determination of energy saving measures. In addition, managers of energy efficiency programs at electric utilities are able to gather the results of site-specific evaluations into a service area assessment of the potential for electrical energy and peak power demand reductions.
Potential Energy Savings for California Today there are more than 38 million people living in California. Currently, an average person uses about 100 gallons of water per day, of these approximately 80% ends up as wastewater via sewers to treatment plants. The total wastewater generated exceeds therefore 3,800 million gallons/day, or 3.8 BGD (billion gallons per day). According to the CEC IEPR-01E report published in 2005 (CEC, 2005), the amount of energy used for wastewater treatment in California is 1,911 kWh/MG. The total energy used in California wastewater treatment is, therefore, equal to approximately 7.3 GWh/day or approximately 2.7 TWh/yr. As a case in point, a typical 5 MGD wastewater treatment plant (treating the flow from approximately 50,000 people) would consume approximately 4.56 million kWh of energy annually. A potential of 10% savings would correspond to 456,000 kWh/yr of energy reduction, or at $0.12/kWh equate to over $500,000 per year of money saved. Furthermore, assuming the average greenhouse gas (GHG) emission intensity of 600g CO2-equivalent per kWh of electricity generation, the aforementioned energy savings could reduce 273.3 metric tonnes of CO2 emission per year. Therefore, the energy benchmarking of municipal wastewater treartment plants could result in both energy savings and reduction in greenhouse gas emission in the state of California, as mandated by California’s Assembly Bill 32 (2006). Assumptions for California: The average energy savings per plant can be 10% with the implementation of recommendations derived from the use of the eBen software. The market penetration potential is estimated at 50%, due to the free nature and ease of operation of the software, and to the existence of effective rebate programs to help finance energy efficiency measures. Furthermore, most improvements recommended by the eBen can be made with little or no capital expenditure. The calculations were conducted using an average aggregate energy consumption cost of 0.12 USD cost per kWh generation and transfer, and 600 gr CO2-equivalent emission per kWh power generation. Further monetary savings could result if the measures adopted not only reduce energy consumption but also curb power demand especially at peak demand periods.
36
Calculations for California: Total energy used in wastewater treatment = 2.7 TWh/yr. With 10% energy efficiency improvement, this equates to 270 GWh/yr in energy savings. This equals to the reduction of 160,000 metric tons of CO2 -equivalent (MTCO2E) emission and more than 32 million USD energy cost saving per year for California IOU ratepayers. Note that this calculation did not include power demand charges and other penalties and taxes encountered by end-users. The reduction in peak power demand, if obtained at the same level at the energy savings (i.e., 10% or 31MW) may play an even more significant role in relieving the power grid from peak stress and potential brownouts/blackouts, which in turn may result in much more significant benefits to California than the energy consumption monetary savings alone. Future work Wastewater treatment processes are monitored and controlled using supervisory control and data acquisition (SCADA) systems. These software tools are the computing engine of the process and provide operators with all the necessary information to act upon field signals or monitor automatic actions from a control room. The software developed here should in the coming future be integrated with such SCADA systems, so that operators could visualize real-time energy consumption and power demand for each unit in the process, along with the operating parameters (e.g., dissolved oxygen, flow rates, temperature, etc.) already collected and displayed by the SCADA system. Such permanent installations may qualify for rebates by power utilities. Furthermore, to enhance the market penetration of this software and therefore the energy savings in California and beyond, commercialization of the software through a third-party and/or distribution of software packages through on-line web pages and applications should be considered. Finally, to increase the size (hence the robustness) of the data base, a web-based data entry portal should be developed, or an application package that can transmit the data collected from using the software to a centralized server where a large and consistent data base on energy benchmarking in treatment is maintained and kept public. This could potentially become the largest database on this subject and could become the reference point for baseline establishment, rebates evaluation, academic and industrial research, etc.

37
Conclusions The eBen tool was developed to perform time-dependent energy benchmarking of wastewater treatment plants, showing during its demonstration significant differences in energy consumption for the treatment plants investigated. The treatment plants selected for demonstrations were well designed and operated, and managed by agencies with the expertise to operate and maintain sophisticated process equipment, such as fine-pore diffusers for aeration. Therefore, one should expect even larger differences as the eBen software is applied to treatment plants owned and operated by utilities unable to maintain such high levels of efficiency. Further work to expand the database and to seek additional distribution channels for the software will open more opportunities for energy savings.
38
References California Energy Commission - CEC (2005), California’s Water – Energy Relationship, Report 04-
IEPR-01E.
EPA (2004) United States Environmental Protection Agency, Wastewater Technology Fact Sheet Screening and Grit Removal.
Gori, R., Giaccherini, F., Jiang, L-M., Sobhani, R., Rosso, D. (2013) Role of Primary Sedimentation on Plant-Wide Energy Recovery and Carbon Footprint. Water Science and Technology, 68(4), pp. 870-8.
Lin, S., Water and Wastewater Calculations Manual. McGraw-Hill (2001).
Metcalf and Eddy, Inc. (2014) Wastewater Engineering: Treatment and Resource Recovery, 5th edition, McGraw Hill, New York.
Rosso, D. and Stenstrom, M.K. (2006) Economic implications of fine pore diffuser aging, Wat. Env. Res., 78 810-815.
Rosso, D., Iranpour, R., Stenstrom, M.K. (2005) Fifteen years of OTE measurements on fine-pore aerators: key role of sludge age and normalized air flux, Wat. Env. Res.,77 266-273.
Rosso, D., Lothman, S.E., Jeung, M.K., Pitt, P., Gellner, W.J., Stone, A.L., Howard, D. (2011) Oxygen transfer and uptake, nutrient removal, and energy footprint of parallel full-scale IFAS and activated sludge processes, Water Research 45, 5987-5996.
Sobhani, R., Jiang, L-M., Chau, A.M., Brown, J., Torres, E., Shao, Y.J. , Rosso, D., (2011) Energy Footprint Analysis of Orange County Sanitation District’s Operations. Proc. 84th Annual Water Environment Federation Conference, Los Angeles, USA, 2011.
US EPA (2004) Wastewater Technology Fact Sheet Screening and Grit Removal. Washington, DC.
WEF (2009) MOP 32: Energy Conservation in Water and Wastewater Facilities. Water Environment Federation (WEF), McGraw Hill
WEF (2010) MOP 8: Design of Wastewater Treatment Plants, 5th ed., Water Environment Federation, Alexandria, VA.

39
APPENDIX A: Link to EPL for eBen download eBen Tutorial
APPENDIX B: “New Technologies to Reduce Energy Use at Wastewater Treatment Facilities” Slides from workshop at Southern California Edison’s 2014 Annual Water Conference
APPENDIX C: Nashville conference abstract
APPENDIX D: Iwa Nepal paper