selenium, total mercury and methylmercury in sardine
TRANSCRIPT

Full Terms & Conditions of access and use can be found athttps://www.tandfonline.com/action/journalInformation?journalCode=lesb20
Journal of Environmental Science and Health, Part BPesticides, Food Contaminants, and Agricultural Wastes
ISSN: 0360-1234 (Print) 1532-4109 (Online) Journal homepage: https://www.tandfonline.com/loi/lesb20
Selenium, total mercury and methylmercury insardine: Study of molar ratio and protective effecton the diet
Tainá Elisa de Mello Lazarini, Raquel Fernanda Milani & Marcelo AntonioMorgano
To cite this article: Tainá Elisa de Mello Lazarini, Raquel Fernanda Milani & Marcelo AntonioMorgano (2019) Selenium, total mercury and methylmercury in sardine: Study of molar ratio andprotective effect on the diet, Journal of Environmental Science and Health, Part B, 54:5, 387-393,DOI: 10.1080/03601234.2019.1574167
To link to this article: https://doi.org/10.1080/03601234.2019.1574167
Published online: 12 Feb 2019.
Submit your article to this journal
Article views: 47
View Crossmark data

Selenium, total mercury and methylmercury in sardine: Study of molar ratio andprotective effect on the diet
Tain�a Elisa de Mello Lazarini, Raquel Fernanda Milani , and Marcelo Antonio Morgano
Science Center and Food Quality (CCQA), Institute of Food Technology (ITAL), Campinas, Brazil
ABSTRACTThe purpose of this work was to evaluate the risk-benefit associated with canned sardine con-sumption, considering the selenium, the mercury and the methylmercury contents and the Se:Hgmolar ratio and the Se-health benefit value (HBV) index. In this study, 63 canned sardine sampleswere purchased worldwide and for the determination of selenium and mercury species, theinductively coupled plasma optical emission spectrometry and thermal decomposition and amal-gamation atomic absorption spectrometry were employed. The mean results obtained for theBrazilian samples varied between 12.6 and 65.5lg kg�1 for Hg; <3.7 and 45.4lg kg�1 for methyl-mercury; 310 and 1370lg kg�1 for Se. The MeHg/Hg ratio showed that the most toxic forms ofHg (MeHg) is predominant in 52 and 39% of the Brazilian samples conserved in tomato sauce andin oil, respectively. Nevertheless, the Se-HBV index and the Hg:Se and Se:Hg molar ratios indicatedthat the selenium content in canned sardine samples is enough to provide a protective effect onthe Hg species.
ARTICLE HISTORYReceived 7 August 2018Accepted 11 January 2019
KEYWORDSCanned fish; heavy metals;TDA AAS; Se-HBV
Introduction
Fish can accumulate substantial mercury (Hg) levels in theirtissues, being considered one of the main sources of thistoxic metal to humans.[1] Hg is distributed in the environ-ment by industrial activities and by natural process, whilethe amount of Hg accumulation in fish tissues is mainlyrelated to the concentration of this element in the environ-ment.[2] Mercury is found in three oxidation states: elemen-tal or metallic Hg, inorganic Hg and organic species(methylmercury, MeHg), which vary according to theirexposure routes, metabolism and toxicity.[3,4]
MeHg is a neurotoxin easily absorbed by the gastrointes-tinal tract and, when distributed throughout the body andtissues is capable to injury the central nervous system,mainly fetuses of pregnant women.[5,6] Based on some epi-demiological studies, provisional tolerable weekly intakes(PTWI) of 1.6 lg kg�1 and 4 lg kg�1 per body weight wereestablished for MeHg and Hg, respectively.[7]
On the other hand, it is important to mention that fish isa source of essential nutrients,[8] proteins, fatty acids (omega3), vitamins and minerals, such as selenium that exhibitsantioxidant properties and a protective effect against the freeradicals.[4] Fish represents one of the best sources of selen-ium in the human diet[9] and some studies reported aremarkable Se content sardines, tuna and swordfish.[10–13]
Even though individually high exposure of Se or Hg canlead to human intoxication, an antagonist effect betweenthese elements, especially MeHg, may reduce or eliminatethe toxicity symptoms.[14]
Peterson et al.[14] reported in their comprehensive reviewthat Hg toxicity is related to Se-dependent enzymes (such asselenoenzymes) inhibition by Hg presence. Apparently, Hgbonding with Se results in both organic and inorganic com-plexes in brain and body tissues and, as intracellular Hglevel exceeds Se, the symptoms of Hg toxicity appears.Therefore, the ratio of Hg:Se in tissues become a remarkabletool to the accurate assessment of Hg toxicity: when Hg:Seratio is near or above 1:1, Se-dependent enzymes activitiesare not inhibit by Hg, increasing the protect effect.
Raymond et al.[15] evaluated the selenium content in1100 foods and reported that the main sources of dietaryselenium were originated from fish. Although mercury isalso found in these foods, selenium is usually more abun-dant. Some studies show that the Hg:Se molar ratio and theSe-health benefit value (HBV) index have been useful toolsto verify the risk associated with fish ingestion.[16]
Squadrone et al.[17] and Ralston et al.[8] suggested that theSe:Hg molar ratio above one and a positive value for the Se-HBV index indicate protective effects against the adverseeffects of Hg consumption, while when the Se:Hg molarratio is lower than one, the risk of toxicity increases.
Lino et al.[18] studied the Hg and Se levels in Tapaj�osRiver basin fishes (Brazil) and the authors found that carni-vore species presented higher Se:Hg molar ratio and Se-HBV than the non-carnivore ones. The authors alsoobserved that fishes in lowest trophic levels (iliophagous andherbivorous) presented the highest levels of Se, Se:Hg molarratio and Se-HBV while carnivorous fishes exhibited Se:Hg
CONTACT Marcelo Antonio Morgano [email protected] Science Center and Food Quality (CCQA), Institute of Food Technology (ITAL), Av. Brasil,2880, Campinas, SP, 13070-178, Brazil.� 2019 Taylor & Francis Group, LLC
JOURNAL OF ENVIRONMENTAL SCIENCE AND HEALTH, PART B2019, VOL. 54, NO. 5, 387–393https://doi.org/10.1080/03601234.2019.1574167
ratios above 1. Even though a reduction on carnivorous fishspecies consumption may possibly be recommended, furtherstudies are needed evaluating the Hg contamination on dif-ferent fish species.
In this context, the objectives of this work were: (i) toevaluate the risks and the benefits associated with the con-sumption of canned sardines, considering the Se, Hg andMeHg levels and (ii) to determine if the consumption of sar-dines is healthy based on the Hg:Se and Se:Hg molar ratios,as well as the Se-HBV index.
Material and methods
Samples, reagents and solutions
Fifty canned sardine samples of five different brands (A, B, C,D and E), conserved with oil (n¼ 25) and tomato sauce(n¼ 25) were purchased in local markets in the state of S~aoPaulo, Brazil. The canned sardine samples commercialized inBrazil are predominantly from Sardinella brasiliensis species,which inhabit mainly the regions of S~ao Goncalo do Sapuca�ı,MG, (Southeastern Brazil) and Navegantes, SC, (SouthernBrazil). However, as the national production cannot attend thegreat demand, in some months of the year sardines areimported from other countries, such as Morocco. Furthermore,13 samples were purchased in markets from Germany (Sardinapilchardus, n¼ 1, conserved with olive oil), Argentina (n¼ 1,conserved with olive oil), Canada (Clupea harengus, n¼ 1, con-served with soybean oil), France (Sardina pilchardus, n¼ 1,conserved with extra virgin oil), Spain (Sardina pilchardus,n¼ 2, both conserved with olive oil), Morocco (Sardina pilchar-dus, n¼ 3, conserved with sunflower oil (2) and olive oil),Portugal (n¼ 3; conserved with tomato sauce, soybean andolive oil) and Thailand (n¼ 1, conserved with tomato sauce)were also evaluated. For Argentina, Portugal and Thailand sam-ples, sardine species were unavailable. All samples were drainedand milled individually using a domestic processor after remov-ing the scales, pimples and viscera. Homogenized samples werefrozen (�18 �C) until the analyses.
Instrumentation
The total mercury and MeHg contents were evaluated usingthe thermal decomposition and amalgamation atomicabsorption spectrometry system with a direct mercury ana-lyzer (DMA-80, Dual Cell, Milestone, Sorisole, Italy). MeHgwas determined after an extraction step carried out using aclosed microwave system (Start E, Milestone, Sorisole, Italy),according to Paiva et al.[19]
The selenium content was determined using an induct-ively coupled plasma source optical emission spectrometer(ICP OES, 5100 VDV, Agilent Technologies, Tokyo, Japan)under the conditions adapted from Paiva et al.[20]
Determination of total mercury and MeHg
For total Hg evaluation, samples were weighed (wet weight)into nickel recipients (100mg) and transferred to the Hg
analyzer.[21] For the determination of MeHg the sardinesamples were subjected to the microwave assisted closedextraction system using toluene in an acid medium. Onegram of sample was weighed into a Teflon PFA recipient,and then 8mL of toluene (Synth, Diadema, Brazil), 1mL ofpurified water (18.2 MX cm, using a reverse osmosis system(Gehaka, S~ao Paulo, Brazil) and 0.75mL of 30% (v/v) HCl(Merck, Darmstadt, Germany) solution were added. Theanalytical conditions for the digestion in the microwaveextractor were: power applied 1000W; heating up to 110 �Cfor 10min, followed by the maintenance at this temperaturefor 5min. After cooling, the recipients were opened, and4mL aliquots of the organic phase were transferred to grad-uated tubes containing 2mL of a 2.5% (m/v) L-cysteine(Sigma, Steinheim, Germany) solution. Then, the tubes werestirred and the solutions were centrifuged (Fanem, S~aoPaulo, Brazil) for 6min at 3500 rpm. A 100mg portion ofthe aqueous phases were weighed into a quartz recipientand the optimized instrumental conditions for the determin-ation of MeHg were: sample drying temperature¼ 120 �Cfor 60 s; decomposition temperature of 300 �C for 180 s;desorption temperature of 850 �C for 12 s and wavelength of253.7 nm. The tests were performed in triplicate.
Determination of selenium
Approximately 1 g of fish was weighed into a Teflon diges-tion flask, 4mL of concentrated nitric acid (Synth, Diadema,Brazil) purified in a sub-boiling distiller (Distillacid,Berghof, Eningen, Germany) were added and the sampleswere kept overnight. For the digestion in the microwave sys-tem, 4mL of purified water and 2mL of 30% hydrogen per-oxide (Merck, Darmstadt, Germany) were added. Thesardine samples were digested using four heating ramps asfollow, with the application of 1000W power: (a) room tem-perature to 70 �C for 5min; (b) from 70 to 120 �C for 5min;(c) from 120 to 170 �C for 5min and (d) maintenance at170 �C for 25min. The digested samples were diluted to25mL with purified water and the selenium content wasquantified in ICP OES using the following optimized condi-tions: radiofrequency generator power (RF¼ 1200W); stabil-ization and reading time (17 s); argon flow rate (12.0 L/min),auxiliary air flow rate (1.0 L/min); seaspray concentric nebu-lizer with flow rate of 0.60 L/min; number of readings (3);axial view of plasma and wavelength k¼ 196.026 nm. Allexperiments were done in triplicate and analytical blankswere also performed.
Analytical curvesThe analytical curves were prepared from the dilution ofmercury (1000mg L�1, Fluka, Sigma-Aldrich, Steinheim,Germany) and selenium (1000mg L�1, Specsol, Quimlab,Jacare�ı, Brazil) certified standard solutions in 0.5% (v/v)solution of purified HNO3 using the following concentrationranges: 0.5–1000 lg L�1 for mercury and 2.5–1000 lg L�1
for selenium.
388 T. E. M. LAZARINI ET AL.

Statistical analysesThe results were evaluated using one-way ANOVA andTukey post-hoc test, with a significance level of 95%(P< 0.05), by XLSTAT program (Addinsoft, Paris, France).
Determination of Se-HBV index and the protective effectThe calculation of Se-HBV index was done according to thefollowing equation proposed by Ralston et al.[8]:
Se�HBV ¼ Se½ �� Hg½ � or MeHg½ �ð Þ� �
Se½ �x Se½ � þ Hg½ �� �
or MeHg½ �ð Þ (1)
where: [Se], [Hg] and [MeHg] correspond to the molar con-centrations of the analytes.
The protective effect of selenium present on sardine sam-ples with respect to mercury was estimated using the Hg:Seand Se:Hg molar ratios.
Analytical quality control
The validation of the analytical methods considered the fig-ures of merit: precision, limits of detection and quantifica-tion, accuracy and linearity of the analytical curves,according to recommendations of the National Institute ofMetrology, Quality and Technology (INMETRO).[22] Theresults obtained are shown in Table 1.
The limits of detection (LOD) and quantification (LOQ)were calculated as 3 and 5 times the standard deviation val-ues for 10 analytical replicates of a sardine sample with lowcontent of the analytes and multiplied by the sample dilu-tion factor (25�). The accuracy of the method was evaluatedusing the certified reference materials: LobsterHepatopancreas (NRC TORT-2) for Hg, MeHg and Se; andOyster Tissue (NIST SRM 1566b) for Se. The recovery assayfor MeHg was performed at the fortification levels of 10,100 and 1000 lg kg�1 and the recoveries obtained were 105,
89 and 100%, respectively. All recovery values are in accord-ance with the conditions recommended by AOAC[23]
(80–110%). The linearity of the analytical curves was deter-mined from the coefficient of determination and r2 valueswere above 0.999. The precision of the method was eval-uated from analytical replicates of a sardine sample analysisperformed with eight measurements on two distinct days.The results for Hg, MeHg and Se were below 11%, accord-ing to the AOAC recommendation [23]
Results and discussion
Total mercury (Hg), methylmercury (MeHg) andselenium (Se)
The Hg, MeHg and Se levels present in the canned sardinesamples commercialized in Brazil are shown in Table 2.
The values obtained for Hg, MeHg and Se showed a sig-nificant difference, with a level of significance of 95%, forthe brands with the same type of conserve. However, con-sidering both conserves (oil and tomato sauce), the resultsdid not vary significantly, meaning that the type of conserveused in canned sardines did not have an effect on total Hg,MeHg, and Se contents. Thus, the contamination is possiblycharacteristic of the area in which the fish live.
The canned sardine conserved with oil presented valuesbetween 16 and 66lg kg�1 for total Hg; <3.7 and45 lg kg�1 for MeHg; 410 and 1370 lg kg�1 for Se, whereasthe results for the samples conserved with tomato sauceranged from 13 to 59lg kg�1 for total Hg; from <3.7 to45 lg kg�1 for MeHg and from 310 to 1070 lg kg�1 for Se.
Regarding the MeHg/Hg ratio, the results varied from 12to 71% and from10 to 96% for samples conserved with oiland tomato sauce, respectively. The average values for theoil and tomato sauce conserves were 39 and 52%, respect-ively, indicating that the MeHg predominates in most of thecanned sardine samples analyzed.
Table 1. Results obtained for validation of the analytical methods.
Analyte Certified values (mg kg�1) Obtained values (mg kg�1) Recovery (%) LOD (mg kg�1) LOQ (mg kg�1) Precision (%)
Total Hg 270 ± 60a 266 ± 2 99 ± 1 1.3 2.2 4.3MeHg 152 ± 13a 161 ± 5 106 ± 3 2.2 3.7 5.4Se 5630 ± 670a 5126 ± 100 91 ± 2 0.03 0.04 3.1
2060 ± 150b 2028 ± 21 98 ± 1
LOD, limit of detection; LOQ, limit of quantification.aCertified reference material (Lobster Hepatopancreas – NRC TORT-2).aCertified reference materials (Oyster Tissue – NIST SRM 1566b).
Table 2. Mean values ± standard deviation for total Hg, MeHg, MeHg/Hg ratio and Se in canned sardines samples commercialized in Brazil.
Brand
Sardine conserved with oil (n¼ 25) Sardine conserved with tomato sauce (n¼ 25)
Total Hg (mg kg�1) MeHg (mg kg�1) MeHg/Hg (%) Se (mg kg�1) Total Hg (mg kg�1) MeHg (mg kg�1) MeHg/Hg (%) Se (mg kg�1)
A 32 ± 9ab
(24–45)20 ± 6a
(13–28)60 ± 7(54–71)
958 ± 13a
(920–1030)34 ± 16A
(16–58)24 ± 13A
(9–45)67 ± 9(54–77)
912 ± 71A
(840–1010)B 22 ± 5b
(16–29)4 ± 1a
(<3.7–5)22 ± 9(13–34)
446 ± 36b
(410–500)29 ± 15A
(13–48)18 ± 9A
(7–31)65 ± 19(44–96)
510 ± 135C
(310–650)C 47 ± 13a
(29–66)28 ± 17a
(<3.7–45)52 ± 27(14–71)
960 ± 371a
(600–1370)32 ± 14A
(21–56)11 ± 3A
(<3.7–14)42 ± 10(31–53)
878 ± 103AB
(700–960)D 29 ± 6ab
(22–37)7 ± 3a
(<3.7–10)22 ± 8(12–30)
644 ± 220ab
(470–1000)24 ± 4A
(18–30)10 ± 4A
(4–14)41 ± 12(21–51)
700 ± 99BC
(570–830)E 36 ± 15ab
(18–60)13 ± 8a
(5–25)33 ± 12(17–43)
912 ± 222a
(630–1120)48 ± 10A
(34–59)20 ± 15A
(5–42)44 ± 28(10–70)
950 ± 121A
(750–1070)a,b,A,B,CValues followed by different letters in the same column significantly differ according to Tukey test (P� 0.05).
JOURNAL OF ENVIRONMENTAL SCIENCE AND HEALTH, PART B 389
The results for the inorganic contaminants content (Hgand MeHg) were evaluated with respect to the maximumvalues established by the Brazilian legislation[24] and the rec-ommendations of the FAO/WHO.[7] All samples showedlower values than the maximum limits of these compoundsin fish, which corresponds to 500 lg kg�1 (wet weight) forHg[24] and MeHg.[7]
Considering the mean value of total Hg in canned sar-dine samples commercialized in Brazil (33 lg kg�1), thisresult is close to those reported in the literature. Panichevet al.[25] studied canned sardines (Sprattus sprattus) con-served with vegetable oil from Latvia and verified an averagevalue of 27.7lg kg�1 for total Hg. Evaluating sardines(Sardina pilchardus) commercialized in Turkey, Yabanli[26]
observed an average value of 30 lg kg�1 for total Hg, whileOlmedo et al.[27] in a similar work with sardines (Sardinapilchardus) from Spain found an average valueof 34 lg kg�1.
With respect to MeHg, the mean value for the sampleswith both conserves was 16 lg kg�1 in the current study,lower than the values pointed out by Xu et al.[28] Theauthors studied sardines (Sardinella jussiu species) fromChina and found an average value of 25lg kg�1 for MeHg.Regarding the selenium levels, the mean value observed was790lg kg�1, which is lower than the results reported by
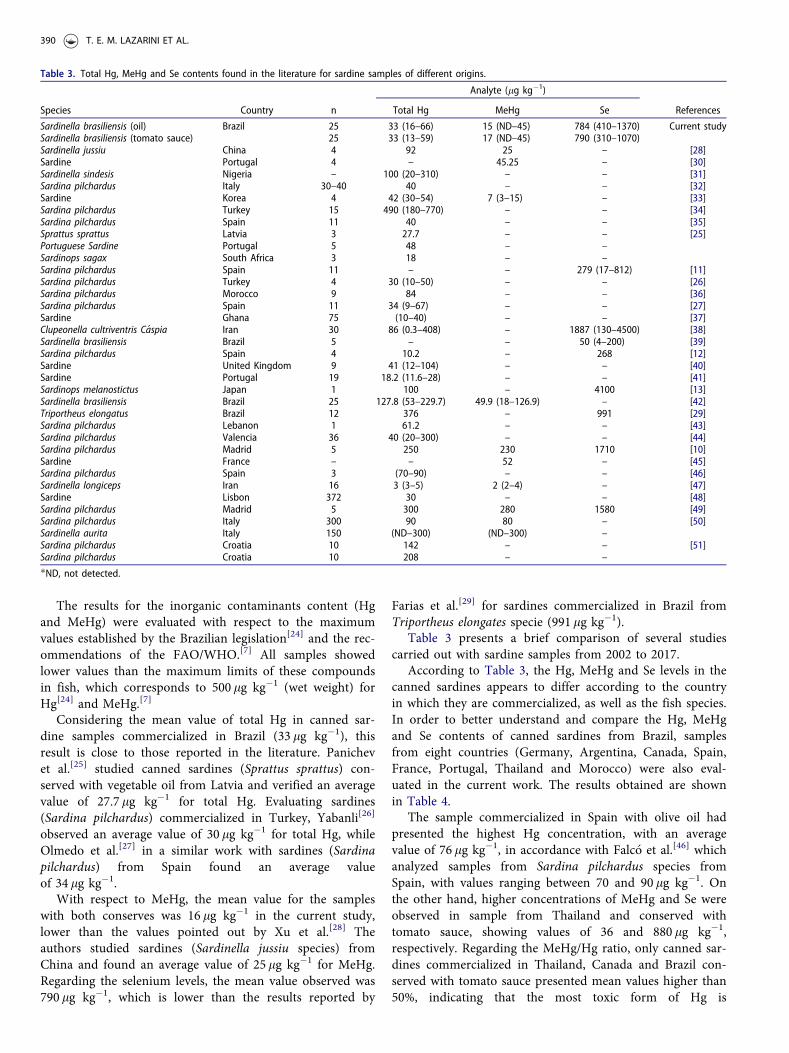
Farias et al.[29] for sardines commercialized in Brazil fromTriportheus elongates specie (991lg kg�1).
Table 3 presents a brief comparison of several studiescarried out with sardine samples from 2002 to 2017.
According to Table 3, the Hg, MeHg and Se levels in thecanned sardines appears to differ according to the countryin which they are commercialized, as well as the fish species.In order to better understand and compare the Hg, MeHgand Se contents of canned sardines from Brazil, samplesfrom eight countries (Germany, Argentina, Canada, Spain,France, Portugal, Thailand and Morocco) were also eval-uated in the current work. The results obtained are shownin Table 4.
The sample commercialized in Spain with olive oil hadpresented the highest Hg concentration, with an averagevalue of 76 lg kg�1, in accordance with Falc�o et al.[46] whichanalyzed samples from Sardina pilchardus species fromSpain, with values ranging between 70 and 90 lg kg�1. Onthe other hand, higher concentrations of MeHg and Se wereobserved in sample from Thailand and conserved withtomato sauce, showing values of 36 and 880 lg kg�1,respectively. Regarding the MeHg/Hg ratio, only canned sar-dines commercialized in Thailand, Canada and Brazil con-served with tomato sauce presented mean values higher than50%, indicating that the most toxic form of Hg is
Table 3. Total Hg, MeHg and Se contents found in the literature for sardine samples of different origins.
Species Country n
Analyte (lg kg�1)
ReferencesTotal Hg MeHg Se
Sardinella brasiliensis (oil) Brazil 25 33 (16–66) 15 (ND–45) 784 (410–1370) Current studySardinella brasiliensis (tomato sauce) 25 33 (13–59) 17 (ND–45) 790 (310–1070)Sardinella jussiu China 4 92 25 – [28]Sardine Portugal 4 – 45.25 – [30]Sardinella sindesis Nigeria – 100 (20–310) – – [31]Sardina pilchardus Italy 30–40 40 – – [32]Sardine Korea 4 42 (30–54) 7 (3–15) – [33]Sardina pilchardus Turkey 15 490 (180–770) – – [34]Sardina pilchardus Spain 11 40 – – [35]Sprattus sprattus Latvia 3 27.7 – – [25]Portuguese Sardine Portugal 5 48 – –Sardinops sagax South Africa 3 18 – –Sardina pilchardus Spain 11 – – 279 (17–812) [11]Sardina pilchardus Turkey 4 30 (10–50) – – [26]Sardina pilchardus Morocco 9 84 – – [36]Sardina pilchardus Spain 11 34 (9–67) – – [27]Sardine Ghana 75 (10–40) – – [37]Clupeonella cultriventris C�aspia Iran 30 86 (0.3–408) – 1887 (130–4500) [38]Sardinella brasiliensis Brazil 5 – – 50 (4–200) [39]Sardina pilchardus Spain 4 10.2 – 268 [12]Sardine United Kingdom 9 41 (12–104) – – [40]Sardine Portugal 19 18.2 (11.6–28) – – [41]Sardinops melanostictus Japan 1 100 – 4100 [13]Sardinella brasiliensis Brazil 25 127.8 (53–229.7) 49.9 (18–126.9) – [42]Triportheus elongatus Brazil 12 376 – 991 [29]Sardina pilchardus Lebanon 1 61.2 – – [43]Sardina pilchardus Valencia 36 40 (20–300) – – [44]Sardina pilchardus Madrid 5 250 230 1710 [10]Sardine France – – 52 – [45]Sardina pilchardus Spain 3 (70–90) – – [46]Sardinella longiceps Iran 16 3 (3–5) 2 (2–4) – [47]Sardine Lisbon 372 30 – – [48]Sardina pilchardus Madrid 5 300 280 1580 [49]Sardina pilchardus Italy 300 90 80 – [50]Sardinella aurita Italy 150 (ND–300) (ND–300) –Sardina pilchardus Croatia 10 142 – – [51]Sardina pilchardus Croatia 10 208 – –�ND, not detected.
390 T. E. M. LAZARINI ET AL.

predominant in these samples. The mean values for Hg con-tent in canned sardine samples from Brazil and Moroccoexhibited near values (33 and 39 mg kg�1, respectively).
Some studies have shown that the inorganic contami-nants concentration depends on the country and the regionin which the fish species live, probably due to the degree ofenvironmental pollution of a particular region. This fact ispointed out by Obeid et al.[43] in their study to evaluate thepresence of Hg in sardines from several locations inLebanon. The authors observed that the sardines with thehighest Hg concentration were from areas containing one ofthe largest coal-fired power plants, which release significantamounts of mercury, and from areas with cement factories.Therefore, although the pollution is widespread, it may varyaccording to geographic location, affecting mar-ine organisms.
Determination of the estimated intake of Se and theexposure of total Hg and MeHg in sardines
In order to calculate the estimated intake of Se for the con-sumption of canned sardines, the average drained weight ofthe samples commercialized in Brazil was determined (84 g).Taking into account the mean values obtained for the sar-dines conserved in oil (784lg kg�1) and sauce(790lg kg�1), as well as the daily intake of Se (34 lg),[52]
the consumption of only 43 g of sardines (approximatelyhalf a can) contributes with 100% of the recommended dailyintake for Se. This fact indicates that sardine can be consid-ered as a good source of this essential micronutrient.
For the evaluation of the estimated exposure to the inor-ganic Hg and MeHg present in the sardine samples, themean values of inorganic Hg (obtained by the differencebetween the total Hg and MeHg contents) and MeHg,33 mg kg�1 and 16 mg kg�1 were considered, respectively.Besides, the calculations were done using the PTWI forinorganic Hg[7] and MeHg[7] (4 and 1.6 mg kg�1 per bodyweight, respectively), the average drained weight of a cannedsardine (84 g) and the weight of an adult as 60 kg. Theresults showed that the consumption of sardines is respon-sible for only 0.6 and 1.4% of PTWI for Hg and MeHg,respectively, indicating a small contribution of the sardine inthis case. Although no risk for canned sardine consumptionwas found in this study, a periodic program monitoring Hgspecies in canned fish is recommended to ensurefood safety.
Hg:Se and Se:Hg molar ratio; Se-HBV index
For Hg:Se, Se:Hg molar ratios and Se-HBV index, the Hgand Se mean values for canned sardine samples were dividedby the molecular weight of each respective element (Hg,MeHg and Se). The parameters Hg:Se, Se:Hg molar ratiosand the Se-HBV index were used to evaluate the safety withrespect to sardine consumption and these results are shownin Table 5. According to Ralston et al.[8] a healthy food pro-file is observed under the following conditions: (i) Se:Hgmolar ratio higher than one; (ii) Hg:Se molar ratio lowerthan one and (iii) positive value for the Se-HBV index.
In order to evaluate the Se-HBV index,[8] the results werecalculated in two different ways: using the Hg or MeHgmolar concentration (Eq. 1). Same values were obtained forboth equations, demonstrating a positive value of the Se-HBV index for the two forms of Hg.
According to Table 5, all canned sardine samples showedHg:Se ratio lower than one and Se:Hg ratio values higherthan one, while the Se-HBV index, calculated using the Hgand MeHg contents, was positive. Thus, these results indi-cate a safe consumption of sardines with a lower risk of Hgingestion, since the Se content is high enough to compensatefor the toxic effects of MeHg.[8]
The characterization of sardine as a healthy fish due tothe protective effect of Se with respect to MeHg was alsostated by Olmedo et al.[11] The authors evaluated cannedsardines of the Sardina pilchardus species, commercializedin Spain, and found a positive value for the Se-HBV index(>1000) and values higher than one (>100) for the Se:Hgmolar ratio. Calatayud et al.[12] also studying canned
Table 4. Mean values (triplicate) and concentration range for Hg, MeHg, MeHg/Hg ratio and Se in canned sardine samples purchased from different countries.
Country (conserve) Species n Hg (lg kg�1) MeHg (lg kg�1) MeHg/Hg (%) Se (lg kg�1)
Brazil (Oil) Sardinella brasiliensis 25 33 (16–66) 15 (<3.7–45) 39 (13–71) 784 (410–1370)Brazil (Sauce) Sardinella brasiliensis 25 33 (13–59) 17 (<3.7–45) 52 (10–96) 790 (310–1070)Germany (Olive oil) Sardina pilchardus 1 29 6 21 490Argentina (Olive oil) N.A. 1 69 22 32 770Canad�a (Soybean oil) Clupea harengus 1 37 19 52 500Spain (Olive oil) Sardina pilchardus 2 76 (56–95) 20 (4–39) 27 (5–51) 700 (547–861)France (Extra virgin oil) Sardina pilchardus 1 43 9 21 670Morocco (Olive oil/Sunflower oil) Sardina pilchardus 3 39 (31–41) 4 (<3.7–6) 11 (5–15) 520 (474–566)Portugal (Olive oil/Sunflower oil) N.A. 3 64 (42–98) 19 (<3.7–47) 30 (3–73) 550 (474–632)Thailand (Sauce) N.A. 1 58 36 61 880
N.A., not Available.
Table 5. Molar concentration for [Se], [Hg], [MeHg], [Hg:Se] molar ratio,[Se:Hg] molar ratio and Se-HBV index obtained for canned sardine samples.
Country [Se]� [Hg]� [MeHg]� [Hg:Se]�� [Se:Hg]��Se-HBV (Hg)
andSe-HBV (MeHg)���
Brazil (Oil) 9.9 0.2 0.07 0.02 60 10Brazil (Sauce) 10.0 0.2 0.07 0.02 61 10Germany 6.2 0.1 0.03 0.02 43 6Argentina 9.8 0.3 0.10 0.04 28 10Canada 6.3 0.2 0.08 0.03 34 6Spain 8.9 0.4 0.09 0.04 23 9France 8.5 0.2 0.04 0.03 40 8Morocco 6.6 0.2 0.02 0.03 34 7Portugal 7.0 0.3 0.08 0.05 22 7Thailand 11.2 0.3 0.16 0.03 39 11�Molar concentration.��Molar ratio.���Se-HBV (health benefit value) calculated according to Ralston et al. [8]
JOURNAL OF ENVIRONMENTAL SCIENCE AND HEALTH, PART B 391

sardines from Spain, obtained 0.015lg kg�1 for the Hg:Semolar ratio and 227 for the Se-HBV index. Both studiesmeet the parameters necessary to classify the safe consump-tion of sardines.
The Se-HBV index can be considered a practical and use-ful tool to evaluate the risks related to the mercury exposurepresent in the sardine samples.[15] The results observed inthe current study are in agreement with those established byRaymond et al.,[15] which established that it is importantthat the Se and Hg molar ratios in marine fish are deter-mined and incorporated into the risk assessments related totheir consumption. In addition, the Se-HBV index can alsobe used to establish a food classification, selecting those con-sidered as sources of selenium and then nutritionally benefi-cial to health.
Conclusion
� The consumption of half canned sardine commercializedin Brazil can contribute with 100% of the recommendeddaily intake for Se, allowing canned sardine to be consid-ered as the source of this essential micronutrient.
� The Se-HBV index and the Hg:Se and Se:Hg molar ratiosdetermined in this work indicated that selenium levels incanned sardine samples are enough to provide a protect-ive effect on the Hg species.
� All canned sardine samples analyzed presented Hg andMeHg levels below the maximum allowable limits.However, the MeHg/Hg ratio showed that the most toxicform of Hg (MeHg) is predominant in 52 and 39% ofthe Brazilian samples conserved in tomato sauce and inoil, respectively.
Acknowledgment
The authors are grateful to CAPES (master’s scholarship of TEMLazarini) and to CNPq for the financial support (process 442025/2014-9), for the research productivity scholarship of MA Morgano and LCde Sousa for analytical support.
Disclosure statement
No potential conflict of interest was reported by the authors.
ORCID
Raquel Fernanda Milani http://orcid.org/0000-0002-2403-960XMarcelo Antonio Morgano http://orcid.org/0000-0001-8332-3953
References
[1] Grandjean, P.; Satoh, H.; Murata, K.; Eto, K. Adverse effects ofmethylmercury: environmental health research implications.Environ. Health Perspect. 2010, 118, 1137–1145. doi:10.1289/ehp.0901757.
[2] Kidd, K. A.; Stern, G.; Lemoalle, J. Mercury and other contami-nants in fish from Lake Chad, Africa. Bull. Environ. Contam.Toxicol. 2004, 73, 249–256.
[3] Clarkson, T. W.; Magos, L. The toxicology of mercury and itschemical compounds. Crit. Rev. Toxicol. 2006, 36, 609–662.
[4] Afonso, C.; Costa, S.; Cardoso, C.; Bandarra, N. M.; Batista, I.;Coelho, I.; Castanheira, I.; Nunes, M. L. Evaluation of the risk/benefit associated to the consumption of raw and cookedfarmed meagre based on the bioaccessibility of selenium, eicosa-pentaenoic acid and docosahexaenoic acid, total mercury, andmethylmercury determined by an in vitro digestion model.Food Chem. 2015, 170, 249–256. doi:10.1016/j.foodchem.2014.08.044.
[5] Clarkson, T. W.; Vyas, J. B.; Ballatori, N. Mechanisms of mer-cury disposition in the body. Am. J. Ind. Med. 2007, 50,757–764.
[6] Silbernagel, S. M.; Carpenter, D. O.; Gilbert, S. G.; Gochfeld,M.; Groth, E.; III, Hightower, J. M.; Schiavone, F. M.Recognizing and preventing overexposure to methylmercuryfrom fish and seafood consumption: information for physicians.J. Toxicol. 2011, 2011, 1–7. doi:10.1155/2011/983072.
[7] FAO/WHO Codex Alimentarius Commission. Joint FAO/WHOFood Standards Program. CF/11 INF/1 2017, 1–162.
[8] Ralston, N. V. C.; Raymond, L. J. Dietary selenium’s protectiveeffects against methylmercury toxicity. Toxicology 2010, 278,112–123. doi:10.1016/j.tox.2010.06.004.
[9] Navarro-Alarcon, M.; Cabrera-Vique, C. Selenium in food andthe human body: a review. Sci. Total Environ. 2008, 400,115–141.
[10] Caba~nero, A. I.; Madrid, Y.; C�amara, C. Mercury-selenium spe-cies ratio in representative fish samples and their bioaccessibil-ity by an in vitro digestion method. Biol. Trace Elem. Res. 2007,119, 195–211. doi:10.1007/s12011-007-8007-5.
[11] Olmedo, P.; Hern�andez, A. F.; Pla, A.; Femia, P.; Navas-Acien,A.; Gil, F. Determination of essential elements (copper, manga-nese, selenium and zinc) in fish and shellfish samples. Risk andnutritional assessment and mercury-selenium balance. FoodChem. Toxicol. 2013, 62, 299–307. doi:10.1016/j.fct.2013.08.076.
[12] Calatayud, M.; Devesa, V.; Virseda, J. R.; Barber�a, R.; Montoro,R.; V�elez, D. Mercury and selenium in fish and shellfish: occur-rence, bioaccessibility and uptake by Caco-2 cells. Food Chem.Toxicol. 2012, 50, 2696–2702.
[13] Yamashita, Y.; Amlund, H.; Suzuki, T.; Hara, T.; Hossain,M. A.; Yabu, T.; Touhata, K.; Yamashita, M. Selenoneine, totalselenium, and total mercury content in the muscle of fishes.Fish. Sci. 2011, 77, 679–686. doi:10.1007/s12562-011-0360-9.
[14] Peterson, S. A.; Ralston, N. V. C.; Whanger, P. D.; Oldfield,J. E.; Mosher, W. D. Selenium and mercury interactions withemphasis on fish tissue. Environ. Bioindic. 2009, 4, 318–334.doi:10.1080/15555270903358428.
[15] Raymond, L. J.; Ralston, N. V. C. Selenium’s importance inregulatory issues regarding mercury. Fuel Process. Technol.2009, 90, 1333–1338. doi:10.1016/j.fuproc.2009.07.012.
[16] Burger, J.; Gochfeld, M. Mercury and selenium levels in 19 spe-cies of saltwater fish from New Jersey as a function of species,size, and season. Sci. Total Environ. 2011, 409, 1418–1429.
[17] Squadrone, S.; Benedetto, A.; Brizio, P.; Prearo, M.; Abete,M. C. Mercury and selenium in European Catfish (Silurus gla-nis) from Northern Italian Rivers: can molar ratio be a predict-ive factor for mercury toxicity in a top predator? Chemosphere2015, 119, 24–30. doi:10.1016/j.chemosphere.2014.05.052.
[18] Lino, A. S.; Kasper, D.; Guida, Y. S.; Thomaz, J. R.; Malm, O.Mercury and selenium in fishes from the Tapaj�os River in theBrazilian Amazon: an evaluation of human exposure. J. TraceElem. Med. Biol. 2018, 48, 196–201.
[19] de Paiva, E. L.; Milani, R. F.; Boer, B. S.; Quintaes, K. D.;Morgano, M. A. Methylmercury in fish species used in prepar-ing sashimi: a case study in Brazil. Food Control. 2017, 8,104–112. doi:10.1016/j.foodcont.2017.04.027.
392 T. E. M. LAZARINI ET AL.

[20] de Paiva, E. L.; Morgano, M. A.; Milani, R. F. Cadmium, lead,tin, total mercury, and methylmercury in canned tuna commer-cialised in S~ao Paulo, Brazil. Food Addit. Contam. Part BSurveill. 2017, 10, 185–191.
[21] Morgano, M. A.; Milani, R. F.; Perrone, A. A. M.Determination of total mercury in sushi samples employing dir-ect mercury analyzer. Food Anal. Methods 2015, 8, 2301–2307.doi:10.1007/s12161-015-0117-7.
[22] INMETRO. Orientac~ao Sobre Validac~ao de M�etodos Anal�ıticos.DOQ-CGCRE-008 Rev. 2016, 05, 1–31.
[23] AOAC, Guidelines for single laboratory validation of chemicalmethods for dietary supplements and botanicals. 2013.
[24] Brasil, A. N. d V. S. Resoluc~ao RDC n� 42, de 29 de Agosto de2013.
[25] Panichev, N. A.; Panicheva, S. E. Determination of total mer-cury in fish and sea products by direct thermal decompositionatomic absorption spectrometry. Food Chem. 2015, 166,432–441. doi:10.1016/j.foodchem.2014.06.032.
[26] Yabanli, M. Assessment of the heavy metal contents of Sardinapilchardus sold in Izmir, Turkey. Ekoloji 2013, 22, 10–15. doi:10.5053/ekoloji.2013.872.
[27] Olmedo, P.; Pla, A.; Hern�andez, A. F.; Barbier, F.; Ayouni, L.;Gil, F. Determination of toxic elements (mercury, cadmium,lead, tin and arsenic) in fish and shellfish samples. Risk assess-ment for the consumers. Environ. Int. 2013, 59, 63–72. doi:10.1016/j.envint.2013.05.005.
[28] Xu, X.; Wang, W. X. Mercury exposure and source tracking indistinct marine-caged fish farm in southern China. Environ.Pollut. 2017, 220, 1138–1146. doi:10.1016/j.envpol.2016.11.021.
[29] Farias, L. A.; F�avaro, D. I.; Santos, J. O.; Vasconsellos, M. B.;Pessoa, A.; Aguiar, J. P. L.; Yuyama, L. Cooking process evalu-ation on mercury content in fish. Acta Amaz. 2010, 40,741–748. doi:10.1590/S0044-59672010000400015.
[30] Jacobs, S.; Sioen, I.; Jacxsens, L.; Domingo, J. L.; Sloth, J. J.;Marques, A.; Verbeke, W. Risk assessment of methylmercury infive European countries considering the national seafood con-sumption patterns. Food Chem. Toxicol. 2017, 104, 26–34. doi:10.1016/j.fct.2016.10.026.
[31] Ekere, N. R.; Ukoha, P. O.; Udeogu, U. V.; Ihedioha, J. N.;Agbazue, V. E. Human exposures and potential health hazardassessment of Hg and Pb in some major imported frozen fishspecies in Nigeria. Hum. Ecol. Risk Assess. An Int. J. 2016, 22,393–400. doi:10.1080/10807039.2015.1078224.
[32] Barone, G.; Storelli, A.; Garofalo, R.; Busco, V. P.; Quaglia,N. C.; Centrone, G.; Storelli, M. M. Assessment of mercury andcadmium via seafood consumption in Italy: estimated dietaryintake (EWI) and target hazard quotient (THQ). Food Addit.Contam. A 2015, 32, 1277–1286. doi:10.1080/19440049.2015.1055594.
[33] Yang, H. R.; Kim, N. Y.; Hwang, L. H.; Park, J. S.; Kim, J. H.Mercury contamination and exposure assessment of fisheryproducts in Korea. Food Addit. Contam. B 2015, 8, 44–49. doi:10.1080/19393210.2014.968808.
[34] Ozden, O.; Erkan, N. Evaluation of risk characterization formercury, cadmium, lead and arsenic associated with seafoodconsumption in Turkey. Expo. Health. 2016, 8, 43–52. doi:10.1007/s12403-015-0181-7.
[35] Zmozinski, A. V.; Carneado, S.; Ib�a~nez-Palomino, C.;Sahuquillo, �A.; Lopez-Sanchez, J. F.; Silva, M. M. Method devel-opment for the simultaneous determination of methylmercuryand inorganic mercury in seafood. Food Control. 2014, 46,351–359. doi:10.1016/j.foodcont.2014.05.054.
[36] Chahid, A.; Hilali, M.; Benlhachimi, A.; Bouzid, T. Contents ofcadmium, mercury and lead in fish from the Atlantic Sea(Morocco) determined by atomic absorption spectrometry.Food Chem. 2014, 147, 357–360.
[37] Okyere, H.; Voegborlo, R. B.; Agorku, S. E. Human exposure tomercury, lead and cadmium through consumption of cannedmackerel, tuna, pilchard and sardine. Food Chem. 2015, 179,331–335. doi:10.1016/j.foodchem.2015.01.038.
[38] Hosseini, S. V.; Aflaki, F.; Sobhanardakani, S.; Tayebi, L.;Babakhani Lashkan, A.; Regenstein, J. M. Analysis of mercury,selenium, and tin concentrations in canned fish marketed inIran. Environ. Monit. Assess. 2013, 185, 6407–6412.
[39] Medeiros, R. J.; Santos, L. M. G.; Freire, A. S.; Santelli, R. E.;Braga, A. M. C. B.; Krauss, T. M.; Jacob, S. C. Determination ofinorganic trace elements in edible marine fish from Rio DeJaneiro state. Food Control. 2012, 23, 535–541. doi:10.1016/j.foodcont.2011.08.027.
[40] Knowles, T. G.; Farrington, D.; Kestin, S. C. Mercury in UKimported fish and shellfish and UK-farmed fish and their prod-ucts. Food Addit. Contam. 2003, 20, 813–818.
[41] Vieira, C.; Morais, S.; Ramos, S.; Delerue-Matos, C.; Oliveira,M. B. P. P. Mercury, cadmium, lead and arsenic levels in threepelagic fish species from the Atlantic Ocean: intra- and inter-specific variability and human health risks for consumption.Food Chem. Toxicol. 2011, 49, 923–932. doi:10.1016/j.fct.2010.12.016.
[42] Silva, C. A. d.; Tessier, E.; K€utter, V. T.; Wasserman, J. C.;Donard, O. F. X.; Silva-Filho, E. V. S. Mercury speciation infish of the cabo frio upwelling, Se – Brazil. Braz. J. Oceanogr.2011, 59, 259–266. doi:10.1590/S1679-87592011000300006.
[43] Obeid, P. J.; El-Khoury, B.; Burger, J.; Aouad, S.; Younis, M.;Aoun, A.; El-Nakat, J. H. Determination and assessment of totalmercury levels in local, frozen and canned fish in Lebanon. JEnviron Sci. (China) 2011, 23, 1564–1569.
[44] Yus�a, V.; Suelves, T.; Ruiz-Atienza, L.; Cervera, M. L.; Benedito,V.; Pastor, A. Monitoring programme on cadmium, lead andmercury in fish and seafood from Valencia, Spain: levels andestimated weekly intake. Food Addit. Contam. B, Surveill. 2008,1, 22–31. doi:10.1080/19393210802236935.
[45] Roosen, J.; Marette, S.; Blanchemanche, S.; Verger, P. The effectof product health information on liking and choice. Food Qual.Prefer. 2007, 18, 759–770. doi:10.1016/j.foodqual.2006.12.002.
[46] Falc�o, G.; Llobet, J. M.; Bocio, A.; Domingo, J. L. Daily intakeof arsenic, cadmium, mercury, and lead by consumption ofedible marine species. J. Agric. Food Chem. 2006, 54,6106–6112.
[47] Al-Reasi, H. A.; Ababneh, F. A.; Lean, D. R. Evaluating mercurybiomagnification in fish from a tropical marine environmentusing stable isotopes (delta13C and delta15N). Environ. Toxicol.Chem. 2007, 26, 1572–1158.
[48] Lourenco, H. M.; Afonso, C.; Martins, M. F.; Lino, A. R.;Nunes, M. L. Levels of toxic metals in canned seafood. J.Aquat. Food Prod. Technol. 2004, 13, 117–125. doi:10.1300/J030v13n03_11.
[49] Caba~nero, A. I.; Madrid, Y.; C�amara, C. Selenium and mercurybioaccessibility in fish samples: an in vitro digestion method.Anal. Chim. Acta 2004, 526, 51–61. doi:10.1016/j.aca.2004.09.039.
[50] Storelli, M. M.; Giacominelli-Stuffler, R.; Storelli, A.;D’Addabbo, R.; Palermo, C.; Marcotrigiano, G. O. Survey oftotal mercury and methylmercury levels in edible fish from theAdriatic Sea. Food Addit. Contam. 2003, 20, 1114–1119. doi:10.1080/02652030310001622773.
[51] Juresa, D.; Blanusa, M. Mercury, arsenic, lead and cadmium infish and shellfish from the Adriatic Sea. Food Addit. Contam.2003, 20, 241–246.
[52] Brasil, A. N. d V. S. Resoluc~ao RDC n� 360, de 23 de Dezembrode 2003.
JOURNAL OF ENVIRONMENTAL SCIENCE AND HEALTH, PART B 393