selenium in north san francisco bay: conceptual model and recommendations for numerical model...
TRANSCRIPT

Selenium in North San Francisco Bay: Conceptual Model and Recommendations for Numerical Model Development
Technical Memoranda 4 and 5
Prepared by Tetra Tech
Sujoy Roy, Limin Chen, Bill Mills, and Tom Grieb
Presentation to
Technical Review Committee
September 16, 2008

Objectives
Explain important selenium-related processes, and lay out broad areas of agreement in the scientific literature.
Summarize spatial and temporal trends in selenium data, with a focus on concentrations in bivalves, waterfowl and fish, so that they can be compared against toxicological and health-based guidelines.
Highlight data gaps and uncertainties of relevance to the TMDL.
Guide the development of a numerical model that is proposed to be used to link selenium sources quantified in TM-2 to biota.

Technical Support Documents
TM-2: Source Analysis
TM-4: Conceptual
Model
TM-5: Recommendation
for Numerical Model
TM-6: Model Application and
Results

Overview of Presentation
Summary of processes in • Water column• Sediments• Phytoplankton/bacteria• Fish and birds
Recent data from NSFB
Recommendations for numerical model development

Selenium Cycling in North San Francisco Bay

Water Column Selenium
Selenium (+VI) (selenate): Present in very oxidizing environments, and does not adsorb strongly to particulates.
Selenium (+IV) (selenite): This form of selenium is common in oxygenated estuarine waters and can be taken up microbes and algae more readily than selenate.
Selenium-II (selenide): Selenides can form through the uptake of oxidized selenium by plankton or microbes, where the selenium is biologically reduced and incorporated into organic compounds.
In addition, particulate selenium can exist in one of these forms or as elemental selenium (Se-0).

Relative importance of loadings from different sources Total
(kg/yr)Dissolved
(kg/yr)Particulate
(kg/yr) Uncertainty
Sources:
Atmospheric deposition
17.8-163.5 13.7-78.1 1.4-85.4 High
Local tributaries 354-1511 (354-834 best estimate)
- 118.21 High
Municipal and industrial wastewater
250 - - Low
Refineries 538 - - Low
Input from Delta 1,110-11,752(mean: 3,962)
814-9,736(Mean: 3,354)
151-1,5092
(mean: 698)Moderate
Sacramento River at Freeport
670-2,693 (mean: 1,577) for 1991-2007
Moderate
San Joaquin River at Vernalis
760-7,2705 (mean: 2,972) for 1994-2007
838-4,711 (mean: 2,289) for 1991-2007
Moderate
Sediment 293 18.24 275 Moderate-High
South Bay 106 High
Sinks:
Outflow 4,5003 3,7503 7503 Moderate-High
Sediment Dredging 82.5 82.5 Moderate

San Joaquin River at Vernalis
San Joaquin River at Vernalis
Date
1/1/84 1/1/86 1/1/88 1/1/90 1/1/92 1/1/94 1/1/96 1/1/98 1/1/00 1/1/02 1/1/04 1/1/06 1/1/08
Sel
eni
um ( g
/L)
0.0
2.0
4.0
6.0
8.0
10.0
Total Se (SWAMP) Dissolved Se (Cutter and Cutter, 2004)

Se
in p
art
icu
late
( g
/g)
0.0
0.5
1.0
1.5
2.0
2.5
Salinity0 5 10 15 20 25 30 35
Dis
solv
ed
Se
( g
/L)
0.00
0.05
0.10
0.15
0.20
0.25
0.30
0.35
Sep 86Nov 97Oct 98Nov 99
Particulate and Dissolved Se: Low Flow (Source: Cutter Research Group papers)
No significant change over 1986-1999 in particulate concentrations

Key Findings-Water and Sediments
Evaluation performed using data from the mid-1980s to 2001, with additional water and sediment data from the RMP
Although variable, field data show minimal change in particulate selenium concentrations patterns (expressed as mg/g) despite changes in dissolved concentrations in the late 1990’s.
The role of particulates in the uptake of selenium implies that the modeling of the freshwater residence time and uptake in the bay is critical to understanding potential risk.
From the sediment coring performed to date, there is limited knowledge of the historical signal of selenium in the bay, especially conditions that were prevalent prior to large scale irrigation in the San Joaquin Valley.

Bioaccumulation
Definition: Bioaccumulation is a general term for the accumulation of substances in an organism or part of an organism.
For selenium, little direct uptake from the dissolved phase for most species, besides algae and bacteria
Uptake occurs through particulates and higher particulate selenium concentrations should result in greater bioaccumulation

In Lab Tests, Algal Uptake Response Non-Linear to Ambient Concentrations
With some exceptions, over a wide range of concentrations, algal concentrations are relatively similar.Baines and Fisher, 2001

Resident Bivalve Data (USGS)
Bivalve Data from Carquinez Strait
Year
1976 1985 1995 1999
Se
in T
issu
e (
g/g
dry
wei
ght)
0
2
4
6
8
10
12
14
16
Mussel
Corbicula
Potamocorbula
Refinery cleanup in 1998
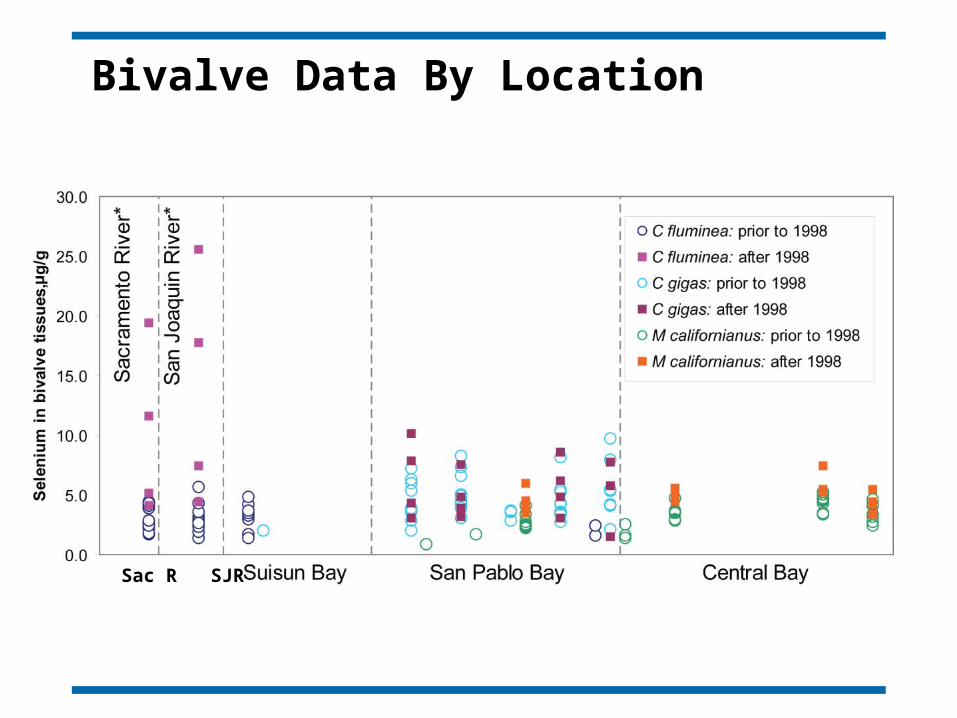
Bivalve Data By Location
Sac R SJR

Zooplankton Data

Year
80 85 90 95 00 05 10
Mus
cle
sele
nium
con
cent
ratio
n (
g/g)
0
10
20
30
40
50
60
Refinery Cleanup
White Sturgeon Muscle Tissue Data

Splittail and Sturgeon Data Compared

Concentrations in Diving Ducks
1980 1990 2000 2010
Se
len
ium
co
nce
ntr
atio
ns
in s
urf
sco
ter
(mu
scle
, g
/g)
0
10
20
30
40
50
60
70
Refinery cleanup

Bioconcentration/Bioaccumulation Factors
Media Concentration Bioconcentration/Bioaccumulation Factors
Water Column 0.10 μg/l (low flow)0.12 μg/l (high flow)
Seston 0.73 μg/g (low flow)0.49 μg/g (high flow)
7,300 L/kg (low flow)4,800 L/kg (high flow)
Plankton 3 μg/g 25,000 – 100,000 L/kg
Sediment 0.25 μg/g 2,200 L/kg
Bivalve P. amurensis 11 μg/g 100,000 L/kg3 – 4 times plankton concentrations
White Sturgeon (liver) 24.1 μg/g 219, 000 L/kg2 - 3 times P. amurensis concentrations
Zooplankton 4.5 μg/g (low flow)1.9 μg/g (high flow)
17, 200 - 40, 900 L/kg0.6 – 1.5 times plankton concentrations
Splittail (liver) 11.4 μg/g 103,600 L/kg2 - 6 times zooplankton concentrations

Key Findings-Selenium in Biota
In addition to the load changes, there have been recent changes in the ecology of the bay, primarily an increase in phytoplankton productivity to levels seen prior to the P. amurensis invasion.
There is no information now on what the P. amurensis populations are, and whether a decline in its numbers may reduce the levels of bioaccumulation in the future.
Laboratory data show the significant effect of algal species on selenium uptake, although this information is not collected in the field.
Although 1999-2005 particulate, bivalve, and white sturgeon selenium data do not show decreases from prior periods, the very small amount of bird muscle data does indicate a decrease

Dissolved Particulate Prey Items Predators
Se
len
ium
in D
iffe
ren
t C
om
pa
rtm
en
tsK
ey
Fa
cto
rs f
or
TM
DL
A
nal
ysis
Speciation data needed for accurate understanding of uptake.
Speciation data shows a decline in selenite concentrations after refinery cleanup in mid-1998.
No speciation data available after 1999.
The bioavailability of different particulate forms varies, with algal selenium being more bioavailable than other forms.
Particulate selenium data available for select years, most recently for 1999.
In recent years algal concentrations in NSFB have increased.
Bivalve uptake of selenium is primarily through particulates.
Different bivalve species have different uptake rates.
Bivalve data are not available after 1999. Prior data show stable concentrations in the late 1990s.
Limited recent data on predator species.
Most data show similar results over the late 1990s, although a small amount of diving duck muscle tisse data suggest a small decrease.
Uncertainty in Predicting Bioaccumulation
Selenate, Selenite, and Organic Selenide
Bacteria, Phytoplankton
Mineral Particles
Organic Detritus
Water Column Species (e.g., zooplankton)
Benthic Species (e.g., bivalves)
Splittail, Striped bass
White Sturgeon
Diving Ducks (Greater and Lesser Scaup,
Surf Scoter)

Numerical Model Development
Why needed? An approach to link point and non-point sources to numeric targets adopted in the TMDL
Numeric targets could be in the form of water column and/or tissue concentrations and have not yet been proposed for the NSFB TMDL
Specific scenarios to be modeled will be developed later in the TMDL process

Modeling Approaches (1): Presser and Luoma (2006) Title: Forecasting Selenium Discharges to the San
Francisco Bay-Delta Estuary: Ecological Effects of a Proposed San Luis Drain Extension
All loads enter at the head of the estuary, concentration gradient from head of the estuary to Golden Gate a function of salinity
Bioaccumulation in different trophic levels using DYMBAM and regressions from data
Calibrated to field data from the bay
Scenarios tested include baseline and different levels of loads from San Joaquin Valley, different runoff scenarios; and different bioavailability and assimilative efficiency

Modeling Approaches (2): Meseck and Cutter (2006)
Title: Evaluating the Biogeochemical Cycle of Selenium in San Francisco Bay through Modeling
Focused on North bay; uses a 1-D model from Rio Vista on Sacramento River to the Golden Gate. Developed using ECoS modeling tool
Representation of selenium biogeochemistry and conversion between different forms, calibrated to Cutter group data collected in the 1980s and 1990s
No representation of bioaccumulation processes

Recommendation in TM-5
Use existing peer-reviewed modeling information to the extent feasible
Employ the Meseck and Cutter (2006) approach for selenium transport, and the Presser and Luoma (2006) approach for bioaccumulation
Calibrate to detailed water chemistry and biological data from ~1999
Validate for water chemistry to RMP data in 2001 and 2005
Predictions for other years with a given hydrology