selection of new distinct sweet potato clones using
TRANSCRIPT

J. Adv. Agric. Res. (Fac. Agric. Saba Basha)
ـــــــــــــــــــــــــــــــــــــــــــــــــــــــــــــــــــــــــــــــــــــــــــــــــــــــــــــــــــــــــــــــــــــــــــــــــــــــــــــــــــــــــــــــــ 168 Vol. 23 (1), 2018
Selection of New Distinct Sweet Potato Clones Using Chemical Mutagen Agents and Gamma-ray Radiation
Mahmoud K.M. Mansour1, Aly I. A. Abido2, Sameh A.M. Moussa1,
Mona M.Yousry2 1. Potato and Vegetative Reproduction Res. Dept., Horticulture Res. Inst., ARC.
2. Plant Production Dept., Faculty of Agric., Saba Bash, Alexandria Univ.
ABSTRACT: Improving sweet potato plants by traditional breeding methods has some
limitations. Furthermore, the existence of self- and cross-incompatibility in sweet potato limits the use of genetic resources and causes a difficult for the breeders through cross breeding. Breeding using mutants as gamma rays and chemical mutagen agents such as colchicine and sodium azide can be used as a key approach in improving sweet potato genotypes, since it is a clonally propagated crop. Therefore, the objectives of this study are production improved clones of sweet potato with high productivity and quality. This investigation was carried out through the years of 2014, 2015 and 2016. Physical and chemical mutagenesis were performed using gamma ray radiation, colchicine and sodium azide which were applied to stem cuttings of "Abees and Mabrouka
" cultivars to produce new sweet potato clones prone to have both high
productivity and tuber roots quality. Cuttings were treated with three different mutagens: 1) exposed to gamma radiation with four doses (30, 50, 70 and 90 Gy), 2) soaked in colchicine solution with three concentrations (100, 300 and 500 mg/L) for sixteen hours and 3) soaked in sodium azide solution with three concentrations (50, 75 and 100 mg/L) for sixteen hours. Fifteen new clones were selected among three hundred ones according to tuber root morphological and physical characteristics for planting in a field trial along with the above-mentioned local sweet potato cultivars for evaluation in two different locations in Alexandria and El-Gharbeya governorates. Generally, the tested sweet potato genotypes were significantly differed for all the studied characters, viz., vegetative characters, yield and yield components, physical and morphological tuber root characteristics. Most studied characters showed strong dependence on the environmental factors (locations). The interaction between genotype and environment; had highly significant effects on all studied traits. The obtained results expressed such positive and significant correlations among sweet potato yield per feddan with each of fresh foliage weight (kg), plant length (m), number of main branches per plant, number of tuber roots per plant, average tuber root weight (kg), marketable yield per plant and percentage of marketable yield per plant. So, the aforementioned characters were considered as good indicators for the prediction of high sweet potato crop production. It is worth mentioning that; three clones (No. 3, 4 and 6) were superior to all tested genotypes especially in yield and quality characters as total sugars and dry matter percentages. These clones considered suitable for both domestic and foreign markets. The clone No. 16 is starchy one and dedicated to be suitable for starch industry due to its superiority compare to all tested clones in terms of starch content.
Keywords: sweet potato, Ipomoea batatas, L., gamma-ray radiation, colchicine, sodium azide,
mutation, physical and chemical mutagens, genotype x environment interaction.
INTRODUCTION
Sweet potato (Ipomoea batatas, L.) is a perennial plant, dicotyledonous, belongs to the family convolvulacea and considered one of the important crops in many developing countries; especially, in Africa and Asia. Sweet potato ranks seventh among the world's most important crops and the fifth order in developing countries (Loebenstein et al., 2003; Hironori et al. 2007). Furthermore, it ranked the second important tuber root crop after cassava in many tropical countries (FAOSTAT, 2006). Because of the enormous genetic diversity of sweet potato and the accompanying diversity in phenotypic and morphological traits; the crop has a great potential for further development to

J. Adv. Agric. Res. (Fac. Agric. Saba Basha)
ـــــــــــــــــــــــــــــــــــــــــــــــــــــــــــــــــــــــــــــــــــــــــــــــــــــــــــــــــــــــــــــــــــــــــــــــــــــــــــــــــــــــــــــــــ 169 Vol. 23 (1), 2018
accommodate specific uses. In 2014, sweet potatoes production quantity for Egypt was 339049 tonnes (FAOSTAT, 2014).
Improving of sweet potato plants by traditional breeding methods has
some limitations. Traditional methods are able to generate many mutations at once because sweet potato exhibits polyploidy and has many chromosomes. The number of chromosomes in the sweet potato plant is 2n = 6x = 90. This indicates that it is a hexaploid plant with a basic chromosome number x = 15. However, it is hard to determine the genetic phenomenon of specific traits. Moreover, the flowering of sweet potato should artificially be induced under grafting and short-day treatment (Ahn et al., 2002). Furthermore, the existence of self- and cross-incompatibility in sweet potato limits the use of genetic resources, and it is very difficult for the breeders through cross breeding (Ahn et al., 2002). Breeding using mutants can be used as a key approach in improving sweet potato genotypes, since it is a clonally propagated crop. Many breeders take advantage of Irradiation-induced mutation breeding. The breeders claim that it is might be effective in improving sweet potato characters such as yield, quality characters and disease resistance (Wang et al., 2007; Ahn et al., 2010; Ji et al., 2011). Irradiation has also been successfully used for mutation in various crops and ornamental plants to induce genetic variations through the breeding programs (Song and Kang, 2003). Using irradiation has significantly contributed to the promotion of the expression of recessive genes and producing new genetic variations (Yoon et. al., 1990; Schum, 2003; Song and Kang, 2003). Gamma rays is, also, used for improving growth and quality of plants, for their high mutation frequency and can interact with atoms and molecules; thus producing free radicals in cells that affect morphology, anatomy, biochemistry and physiology of the plants (Chahal and Gosal, 2002). Mohan (2006) reported that induced mutations are highly effective to enhance natural genetic resources for vegetatively propagated crops. Radiation mediated morphological, structural and functional changes in a plant are governed by the intensity and duration of the gamma rays which, generally, induce cytological, biochemical, physiological, morphological and genetically changes in cells and tissues (Rahimi and Bahrani, 2011; Jan et al., 2012; Chandrashekar et al., 2013; Haris et al., 2013).
Physical and/or chemical mutagens cause random changes in the
nuclear DNA or cytoplasmic organelles, resulting in gene, chromosomal or genomic mutations. Induced mutagenesis is an established method for plant improvement, whereby plant genes are altered by treating seeds or other plant parts with chemical or physical mutagens. Notably, voluminous work has been done worldwide for the improvement of both seed and vegetatively propagated crops through induced mutation (Shu, 2009).
Colchicine, a poisonous medicinal chemical, has been used since 1937
in plant breeding work to produce changes in plants by doubling the number of chromosomes in cells, a condition referred to as polyploidy. The increased number of chromosomes usually brings about an increase in size of the affected cells and various degrees of changes in their functions. The colchicine solution
J. Adv. Agric. Res. (Fac. Agric. Saba Basha)
ـــــــــــــــــــــــــــــــــــــــــــــــــــــــــــــــــــــــــــــــــــــــــــــــــــــــــــــــــــــــــــــــــــــــــــــــــــــــــــــــــــــــــــــــــ 170 Vol. 23 (1), 2018
affects plant cells during the division stages and has no apparent effect on non-dividing cells (Dermen and Emsweller 1961).
Sodium azide (NaN3) is inorganic compound, colorless salt, gas forming;
also, it is an ionic substance, highly soluble in water and very toxic. Sodium azide is a chemical that has been, widely used in agriculture, and medical practices, and is known to be highly mutagenic to plants (Rines, 1985; Raicu and Mixich, 1992; Grant and Salamone, 1994). It has been used in various crops to improve yield, quality, resistance to pathogens, and tolerance to abiotic stresses (Khan et al., 2009).
The objective of the present study aimed to produce some improved
clones of sweet potato characterized with high productivity and high tuber roots quality for local markets and for exportation; using chemical mutagen agents and gamma radiation.
MATERIALS AND METHODS
This investigation was carried out during the three successive years 2014, 2015 and 2016. Stem cuttings of 20-25 cm length, were taken from common Egyptian sweet potato cultivars (Abees and Mabrouka) were treated with three different mutagens: 1) exposed to gamma radiation with four doses (30, 50, 70 and 90 Gy) using a Co60 source from a unit gamma chamber at the National Center for Radiation Res. and Tech., Nasr City, Cairo, Egypt, 2) soaked in colchicine solution with three concentrations (100, 300 and 500 mg/L) for sixteen hours and 3) soaked in sodium azide solution with three concentrations (50, 75 and 100 mg/L) for sixteen hours. The treated cuttings were planted on 1st March in pots containing soil composed of clay, sand and peat moss (1:1:1).The planted stems were covered with a transparent plastic sheet to retain moisture. After one month, the transplants were planted again on 1st of April 2014 in rows, 0.70 m apart, and at spacing of 0.50 m within rows at El-Sabaheya Horticultural Research Station farm, Alexandria governorate. Three months later, each new branch (emerged from an individual bud) was cut and replanted again on the 1st of July 2014, as previously explained. At the end of October, when the temperatures began to drop, the plants were covered with plastic sheets under low tunnels. The cultivated plants began to grow again when the temperatures began to rise during April 2015 and the tunnels were removed. The vegetative growth considerably increased during the summer season. In the mid of August 2015, the growing plants (300 clones) were individually harvested and inspected on the basis of the produced tuber roots morphology (uniformed tuber root shape, smoothness, skin color and flesh color) and its physical characteristics (shape index and TSS). From the mutants obtained, only fifteen clones were selected; cut and the stems of each clone were replanted separately in the field. At the end of October, the cultivated plants were covered with plastic sheets under low tunnels till 1st of April 2016. After that, stem cuttings of 25 cm length of each selected clone were made. Abees and Mabrouka cultivars was planted in addition to the selected clones for the evaluation in two different locations at Abees area, Alexandria governorate and Bassioun area, El-Gharbeya governorate. The experimental layout was

J. Adv. Agric. Res. (Fac. Agric. Saba Basha)
ـــــــــــــــــــــــــــــــــــــــــــــــــــــــــــــــــــــــــــــــــــــــــــــــــــــــــــــــــــــــــــــــــــــــــــــــــــــــــــــــــــــــــــــــــ 171 Vol. 23 (1), 2018
arranged in a randomized complete blocks design (R.C.B.D.) with three replicates. The stem cuttings were planted in rows, 70 cm apart and at spacing of 25 cm within rows. The experimental unit consisted of four rows (6.0 m long and 0.70 m wide) making an area of 16.8 m2. All the agricultural practices used for commercial sweet potato production, as common in each area, were followed. Harvesting was done on 1st of August 2016. The physical and chemical analyses of the experimental soils are presented in Table (1).
Table (1). Physical and chemical analyses of the experimental soils
Location Mechanical analysis
Texture pH EC
(dS/m) CaCO3
% O.M.
% Sand % Silt % Clay %
Abees area 43.90 14.90 41.20 Clay Loam 7.75 2.70 25.22 1.80 Bassioun area 36.40 40.00 23.60 Loam 7.50 1.15 28.60 1.22
Chemical analysis
Location Cations (meq/L) Anions (meq/L)
N+ P
+ Ca
++ Mg
++ Na
+ K
+ CO3
- HCO3
- CL
- SO4
--
Abees area 0.88 19.7 0.65 0.39 1.24 1.43 zero 0.63 1.09 0.95 Bassioun area 0.81 21.20 1.39 0.39 0.81 0.12 zero 0.90 0.36 1.83
Measurements:
The recorded measurements were assigned as follows:
1-Vegetative growth: samples of ten whole plants per plot were randomly selected, 90 days after planting, for determination of the vegetative growth (plant length (m), number of main branches/plant and average fresh foliage weight/plant (kg)). 2-Yield parameters: Tuber root yield trait was calculated for a plot (16.8 m2) and then attributed to yield per feddan. Ten randomly plants per plot were taken for determining yield component characters (number of tuber roots/plant, average tuber root weight (g) and weight of marketable tuber root yield per plant (kg) and percentage of marketable tuber root yield). 3-Tuber root characteristics: Ten tuber roots per plot were randomly used for determining the following characteristics: root shape index (calculated by dividing tuber root length by its diameter), hairiness (scored from 1 to 10; whereas, 1 denotes a smooth root; and 10 refers to a hairy root), skin color (scored from 1 to 10;whereas, 1 denotes a white skin color; and 10 denotes a dark purple skin color) and flesh color (scored from 1 to 10; and 1 denotes a white creamy flesh color and 10 denotes a dark orange flesh color). Tuber root quality: 1- Tuber root dry matter (%): Dry matter percentage of tuber roots were carried out by weighing a certain weight of sliced fresh tuber roots and then dried at 70 ◦C for 48 hrs. 2- Total soluble solids (TSS) %: determined using the Zeiss hand refractometer. 3- Reducing and non-reducing sugars percentages (%): Five grams of dried tuber root was taken to determine reducing and non-reducing sugars, according to the method of Dubois et. al., (1956). 4- Starch (%): Tuber root starch percentage (%) was determined according to the method described in A.O.A.C. (1970).

J. Adv. Agric. Res. (Fac. Agric. Saba Basha)
ـــــــــــــــــــــــــــــــــــــــــــــــــــــــــــــــــــــــــــــــــــــــــــــــــــــــــــــــــــــــــــــــــــــــــــــــــــــــــــــــــــــــــــــــــ 172 Vol. 23 (1), 2018
5- Carotene content (mg/100 g): Carotene content was determined in dried samples as β carotene, using the method described by Umiel and Gabelman (1971), using a Milton Roy, spectrophotometer-601 at 440 nm.
Statistical analysis Collected data from the experiments were statistically analyzed, using
the analysis of variance method. Data from both locations were subjected to a combined analysis of variance as outlined by Miller et al. (1959). Comparisons among the means of different clones were carried out using least significant differences (L.S.D) test procedure at p ≤ 0.05 level of probability, as explained by Snedecor and Cochran (1980) using Costat software program. Simple correlation coefficients (r) were calculated for different pairs of the studied characters as reported by Dospekhove (1984).
RESULTS AND DISCUSSION
Mean performance of the tested genotypes at Alexandria Governorate
Data presented in Table (2) showed highly significant differences among the tested sweet potato clones for all the studied characters. The results of the studied vegetative traits clearly appeared that the clones number 3, 4, 6 and 10; significantly, gave rise to the highest significantly mean values for fresh foliage weight (kg) character. While, the data of plant length characters showed that the clones No. 3 and 6; significantly, possessed the highest mean values. On the other hand, both clones No. 3 and 10; had the significantly highest mean values for number of main branches per plant character. In terms of sweet potato yield and its component characters, the data recorded showed that clones No. 10 and 11; significantly, recorded the highest mean values of number of tuber roots per plant trait. The significantly highest value of average tuber root weight (Kg) was recorded with the clone No. 6 followed by the clones No. 3, 4 and 10 which did not have significant differences among each other. As for tuber root yield character (ton/fed.); the results obviously showed that, clone No. 10; brought about the highest mean value in this regard followed by the clone No. 6 with insignificant difference between them. Each of the clones No. 3 and 4 ranked in the second order regarding tuber root yield per fed. with insignificant difference with the clone No. 6. According the previously mentioned, the relatively highest yield was produced by the clones; No. 10 and 6, which is related to the previously noticed high mean values of fresh foliage weight, plant length, number of main branches per plant, no. of tuber roots per plant, and average tuber root weight. Similar results were, also, detected by Moussa and Gomaa (2017) in their study on sweet potato; where, the authors found that the relatively highest yield was produced by the clones, which are related to high values of vegetative measurements and yield component characters. The results illustrated also that the highest significant mean values achieved for the marketable yield per plant (Kg) were through the clones No. 3 and 10. followed by the clone No. 6 (Table 2). The highest significant percentages of marketable yield per plant were obtained from the clone's No. 3 and 9 without significant differences with the clone's No. 4, 6,10,11,12 and 13.
J. Adv. Agric. Res. (Fac. Agric. Saba Basha)
ـــــــــــــــــــــــــــــــــــــــــــــــــــــــــــــــــــــــــــــــــــــــــــــــــــــــــــــــــــــــــــــــــــــــــــــــــــــــــــــــــــــــــــــــــ 173 Vol. 23 (1), 2018
Results of physical and quality properties of the tested sweet potato clones are presented in Table (2). The tabulated results showed that clones No. 2, 4, 6, 8 and 10; significantly, produced the longest oblong tuber roots. On the other side, clone No. 14 produced more round tuber roots. Total soluble solids (TSS) were the highest at clone No. 9, while, ''Mabrouka'' cv. was the lowest ones. Each of clones No. 3, 4, 5, 7,14,15,17 and ''Mabrouka'' cv. produced the hairless tuber root, whereas clones No. 2 and 12 produced the hairiness. Tuber skin color, significantly, varied from creamy (clone No. 16) to purple-red (clone No. 3). The data clearly appeared that there was wide range for flesh color trait (from white creamy in ''Mabrouka'' cv. to dark orange in clones No. 4 and 7). Dry matter percentages showed highly significant differences among the tested clones; where clones No. 5, 6, 15, 16 and ''Mabrouka'' cv. had the highest dry matter percentages, while ''Abees'' cv. and clones No. 7, 8, 9 had the lowest percentages. Results of carotene content demonstrated that clones No. 4, 7 and 10; gave the highest mean values in this respect, which can be linked to the obtained results of flesh color; as these clones also possessed high mean values. On the contrary, ''Mabrouka'' cv. and clones No. 5, 13 were the least regarding carotene content. As for non-reducing and reducing sugars, clones No. 2,6 and 8, significantly, possessed the highest percentages for non-reducing sugars; while, clone No. 13, significantly, had the highest percentage for reducing sugars. Records of total sugars percentage showed that clones No 3, 6, 8 and 10 had the highest total sugars percentage among the tested clones, alternatively, the lowest percentage of the given trait by ''Mabrouka'' cv. Regarding starch percentage, ''Mabrouka'' cv. and clone No. 16 were the most starchy, while clones No. 5, 9 and 15 reflected the lowest value regarding the starch percentage.
Results tabulated in Table (2), declared that; both clones No.6 and 10 can be nominated for planting in Alexandria region, where they possessed the highest productivity compared to the other tested genotypes. These two genotypes were characterized with high total sugars content, making them suitable as a table item, also distinguished by attractive flesh color. These two genotypes significantly outweigh ''Abees'' commercial cultivar in the ratio of dry matter, which reduces both loss percentage of weights and the damage percentage during storage and export for foreign markets

J. Adv. Agric. Res. (Fac. Agric. Saba Basha)
ـــــــــــــــــــــــــــــــــــــــــــــــــــــــــــــــــــــــــــــــــــــــــــــــــــــــــــــــــــــــــــــــــــــــــــــــــــــــــــــــــــــــــــــــــ 174 Vol. 23 (1), 2018
Table (2). Mean performance of sweet potato genotypes for the studied characters grown in Alexandria Governorate
To be continued..
Marketable yield/plant
(%)
Marketable yield/plant
(kg)
Yield (ton/fed.)
Average tuber root weight (kg)
No. of tuber roots/plant
No. of main branches/plant
Plant length (m)
Fresh foliage
weight (kg) Genotypes No.
86.76cdef 1.08d 12.50c 0.21ef 6.00cd 2.62b 1.66b 1.39b Abees cv.# 1 76.59g 0.28h 3.70i 0.10hi 3.67jk 1.68h 0.68i 0.59g A 30 Gy 2 98.04a 1.67ab 17.00b 0.26bc 6.44bc 3.20a 1.87a 1.589a A 70 Gy-a 3
91.65abcde 1.47c 16.00b 0.25bcd 6.44bc 2.57bc 1.63bc 1.60a A 70 Gy-b 4 87.41bcdef 1.03d 11.83cd 0.19f 6.32c 2.50bc 1.21e 1.29bc A 70 Gy-c 5 92.37abcd 1.60bc 17.33ab 0.31a 5.67de 2.67b 1.77ab 1.60a A 70 Gy-d 6
81.98fg 0.50g 6.10h 0.19f 3.11 l 2.00fg 0.93h 1.01d A 90 Gy-a 7 86.99bcdef 0.58g 6.70gh 0.22def 3.10 l 2.03fg 1.00fgh 0.96de A 90 Gy-b 8
96.97a 0.97de 10.00ef 0.23cde 4.33hi 2.30cdef 1.10efg 1.20c A 100 Col. a 9 93.64abcd 1.75a 18.67a 0.27b 6.89ab 3.17a 1.60bcd 1.61a A 100 Col. b 10 95.24abc 0.60g 6.33h 0.09i 7.11a 1.97gh 1.47cd 1.40b Mabrouka cv. 11 96.30ab 0.77f 8.00g 0.12gh 6.44bc 2.17defg 1.13ef 1.02d M 30 Gy 12
90.64abcdef 1.00d 11.03de 0.22def 5.00fg 2.40bcde 1.17ef 1.20c M 50 Gy 13 83.02efg 0.50g 6.00h 0.15g 3.99ij 2.03fg 1.03fgh 0.76f M 90 Gy 14 82.14fg 0.60g 7.33gh 0.21ef 3.44kl 2.10efg 0.96gh 0.82ef M 300 Col.a 15
85.93cdefg 0.83ef 9.67f 0.21ef 4.67gh 2.30cdef 1.43d 1.17c M 300 Col.b 16 85.00defg 0.85ef 10.00ef 0.19f 5.22ef 2.42bcd 1.47cd 1.22c M 500 Col. 17

J. Adv. Agric. Res. (Fac. Agric. Saba Basha)
ـــــــــــــــــــــــــــــــــــــــــــــــــــــــــــــــــــــــــــــــــــــــــــــــــــــــــــــــــــــــــــــــــــــــــــــــــــــــــــــــــــــــــــــــــ 175 Vol. 23 (1), 2018
Continued..
Means having an alphabetical letter in common, within a comparable group of means, do not significantly differ, using least significant differences test
procedure (L.S.D) at p ≤ 0.05 level of probability. # A:- clone mutated from Abees cv.; M:- clone mutated from Mabrouka cv; Gy:- abbreviation of Gray (concentration unit of gamma ray) ; Col.:- colchicine;
a,b,c,d:- discrimination of selected clone.
ch percentage
(D.W.)
Total sugars
percentage (D.W.)
Reducing sugars
percentage (D.W.)
Non-reducing sugars
percentage (D.W.)
Carotene mg/100 g (D.W.)
Tuber root dry matter
(%)
Flesh color
Skin color
Hairiness TSS (%)
Root shape index
Genotypes No.
62.10ef 16.77cd 7.46d 9.31d 7.41b 16.34g 9.00b 7.00b 1.03c 9.00h 3.84bc Abees cv. 1 69.33c 18.27b 5.09f 13.18a 6.38cde 18.69f 8.00c 5.00d 3.00a 12.60b 4.07ab A 30 Gy 2 66.28d 19.167a 8.55c 10.61c 4.09g 22.73bc 3.03e 8.03a 1.00d 11.07c 2.75e A 70 Gy-a 3 65.57d 18.90ab 7.74d 11.15c 8.77a 19.29ef 10.00a 7.00b 1.00d 10.67de 4.07ab A 70 Gy-b 4 57.17i 17.16c 8.40c 8.76d 1.18i 23.30abc 2.00g 5.00d 1.00d 10.40ef 2.26e A 70 Gy-c 5 70.00c 18.53ab 5.19f 13.33a 7.16bc 23.09abc 9.00b 7.00b 2.00b 10.07g 3.93abc A 70 Gy-d 6 66.20d 17.05c 4.62g 12.43b 8.81a 17.61fg 10.00a 6.67c 1.00d 11.00c 3.82bc A 90 Gy-a 7 59.33gh 18.90ab 5.42f 13.48a 5.39ef 16.17g 9.00b 5.00d 2.00b 12.60b 4.200ab A 90 Gy-b 8 57.17i 15.69e 3.47i 12.22b 5.84def 16.01g 8.00c 7.00b 2.00b 13.00a 3.39cd A 100 Col.a 9
60.50fg 18.94ab 8.37c 10.57c 8.55a 20.80de 9.00b 7.00b 2.00b 10.60e 4.48a A 100 Col.b 10 85.00a 4.37k 1.57j 2.80h 1.27i 24.13ab 1.00h 5.00d 1.00d 4.13 l 2.74e Mabrouka cv. 11 69.33c 10.09h 6.04e 4.06fg 6.58bcd 22.32cd 4.00d 5.00d 3.00a 8.00i 2.61e M 30 Gy 12 77.00b 13.88f 10.48a 3.41gh 1.91i 22.00cd 3.00f 5.00d 2.00b 10.07g 2.47e M 50 Gy 13 63.00e 9.18i 5.01fg 4.17f 5.33f 22.05cd 3.00f 4.00e 1.00d 7.133j 1.72f M 90 Gy 14 58.00hi 16.06de 9.45b 6.61e 5.89def 24.16ab 3.00f 5.00d 1.00d 10.93cd 2.96de M 300 Col.a 15 84.67a 5.82j 4.09h 1.74i 3.01h 24.81a 3.00f 3.67f 2.00b 4.67k 2.56e M 300 Col.b 16 60.17g 11.07g 5.02fg 6.05e 3.73gh 22.93bc 3.00f 5.00d 1.00d 10.13fg 2.74e M 500 Col. 17
J. Adv. Agric. Res. (Fac. Agric. Saba Basha)
ـــــــــــــــــــــــــــــــــــــــــــــــــــــــــــــــــــــــــــــــــــــــــــــــــــــــــــــــــــــــــــــــــــــــــــــــــــــــــــــــــــــــــــــــــ 176 Vol. 23 (1), 2018
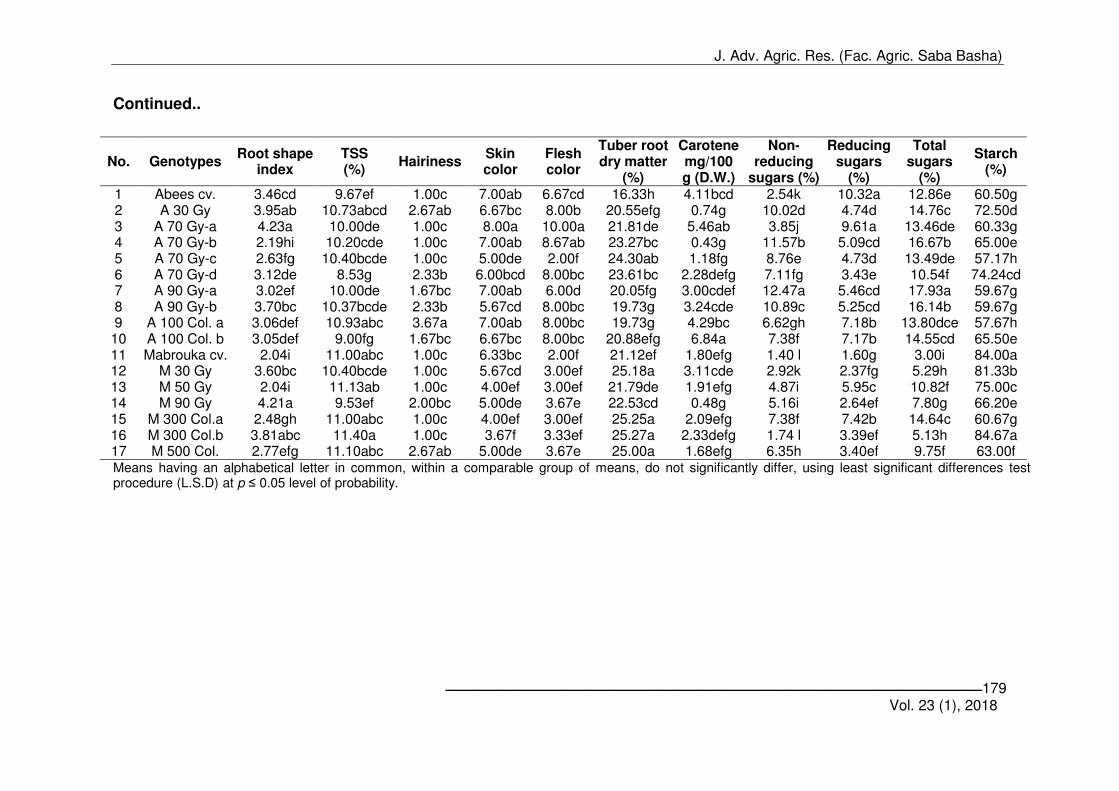
Mean performance of the tested genotypes at El-Gharbeya Governorate Data in Table (3) showed that tested clones were significantly differed as
for the studied characters. The obtained results appeared that vegetative characters, yield and yield components showed highly significant differences among the tested clones. In this respect, the results showed that "Mabrouka" cv. and / or the clone No. 16 had high mean values for most studied traits, i.e., foliage weight, plant length, No. of main branches / plant, No. of tuber roots / plant, average tuber root weight, yield per feddan, marketable yield / plant and percentages of marketable yield per plant. There were insignificant differences among the clone No. 2 with each of "Mabrouka" cv. and the clone No. 16 respecting number of tuber roots per plant character. The mean value of average tuber root weight character revealed that clones No. 4, 11, 16 and "Mabrouka" cv., significantly possessed the highest mean values. The clone No. 16, significantly, gave the highest mean value for marketable yield character. Clones No. 12, 15, 16 and "Mabrouka" cv. appeared to have the highest and significant mean values in terms of percentage of marketable yield per plant character.
Concerning tuber root characteristics and quality traits, clone No. 2 had
the longest tuber root with insignificant differences from each of the clones No. 3, 14 and 16, while "Mabrouka" cv. gave the shortest tuber root without significant differences with the clones No. 4 and 13. The highest values for the total soluble solids trait were recorded with the clones No. 2,9,11,13,15,16 and 17, while the lowest mean values were obtained by clones No. 6 and 10. The tested clones revealed smooth skin with varying degrees where the scored values ranged from 1 (smoothest tuber root) to 3.67 (somewhat smooth tuber root). Skin color trait ranged from creamy for the clone No. 16 with insignificant differences with clones No. 13 and 15 to purple red for the clone No. 3 with insignificant differences with each of "Abees" cv., clones No. 4, 7 and 9. Flesh color trait for the tested clones ranged from dark orange flesh color for the clone No. 3 with insignificant differences with the clone No. 4 to white creamy flesh color for "Mabrouka" cv. with insignificant differences with the clones No.5, 12, 13, 15 and 16.
There were significant differences in the dry matter percentage among
the tested clones. Five clones; No. 5,12, 15,16 and 17 significantly had the highest dry matter percentages, while "Abees" cv., significantly, had the lowest dry matter percentage. Two clones (No. 3 and 10) produced high values for carotene content without significant differences between them; the lowest significant values were obtained through clones No. 4,5,6,13,14,15,16,17 and "Mabrouka" cv. The results of Table (3) appeared, also, that clone No. 7, significantly, brought about the highest percentages for non-reducing sugars and total sugars traits. In this respect, "Abees" cv. and the clone No. 3, significantly, recorded the highest percentages for reducing sugars trait.
On the other extreme, "Mabrouka" cv. registered the lowest percentages
for all the determinations of sugars content in tuber root with insignificant differences with each of the clone No. 16 for non-reducing sugars content and the clone No. 12 for reducing sugars content. Starch percentages were the

J. Adv. Agric. Res. (Fac. Agric. Saba Basha)
ـــــــــــــــــــــــــــــــــــــــــــــــــــــــــــــــــــــــــــــــــــــــــــــــــــــــــــــــــــــــــــــــــــــــــــــــــــــــــــــــــــــــــــــــــ 177 Vol. 23 (1), 2018
highest in "Mabrouka" cv. and the clone No. 16, while clones No. 5 and 9 significantly had the lowest starch percentages.
Results of Table (3) exhibited that each of "Mabrouka" cv. and the clone
No. 16 are suitable for planting in Gharbeya area; where these two genotypes possessed the highest production compared with the other tested genotypes. Also, both genotypes characterized by high content of starch, making them suitable for starch extract industry.

J. Adv. Agric. Res. (Fac. Agric. Saba Basha)
ـــــــــــــــــــــــــــــــــــــــــــــــــــــــــــــــــــــــــــــــــــــــــــــــــــــــــــــــــــــــــــــــــــــــــــــــــــــــــــــــــــــــــــــــــ 178 Vol. 23 (1), 2018
Table (3). Mean performance of sweet potato genotypes for the studied characters grown in El-Gharbeya Governorate
To be continued..
Marketable yield/plant
(%)
Marketable yield/plant
(kg)
Yield (ton/fed.)
Average tuber root weight
(kg)
No. of tuber roots/plant
No. of main branches/plant
Plant length (m)
Fresh foliage
weight (kg) Genotypes No.
86.90abcd 0.57cd 6.67c 0.15c 4.33ab 2.03def 1.03cd 0.83bc Abees cv. 1 75.00defg 0.30fg 4.00de 0.14c 2.89de 2.00def 0.93de 0.63def A 30 Gy 2 72.19efg 0.51de 7.00bc 0.14c 5.00a 1.93ef 0.93de 0.73bcde A 70 Gy-a 3 69.74fg 0.58cd 8.33b 0.23ab 3.67bcd 2.27bc 1.30ab 0.80bcd A 70 Gy-b 4
78.57bcdefg 0.30fg 3.83de 0.17c 3.33cde 2.00def 0.97cde 0.57ef A 70 Gy-c 5 68.67g 0.52de 7.67bc 0.22b 3.43cde 2.00def 0.97cde 0.60ef A 70 Gy-d 6
75.00defg 0.30fg 4.00de 0.15c 2.78e 2.00def 0.93de 0.67cdef A 90 Gy-a 7 75.79cdefg 0.30fg 3.50de 0.12c 3.00de 1.83f 0.90e 0.60def A 90 Gy-b 8 83.33bcde 0.37fg 4.33de 0.15c 3.11cde 2.03def 0.97cde 0.53f A 100 Col.a 9 73.11efg 0.24g 3.33e 0.11c 3.00de 1.93ef 1.03cd 0.67cdef A 100 Col.b 10 90.49ab 0.97b 10.67a 0.25ab 4.33ab 2.17bcd 1.41a 1.13a Mabrouka cv. 11 88.52abc 0.31fg 3.50de 0.12c 3.00de 2.00def 0.97cde 0.53f M 30 Gy 12
82.88bcdef 0.39ef 4.73d 0.15c 3.11cde 2.04de 1.07c 0.57ef M 50 Gy 13 78.33bcdefg 0.37fg 4.67de 0.14c 3.33cde 2.03def 0.90e 0.57ef M 90 Gy 14 86.57abcd 0.67c 7.67bc 0.24ab 3.22cde 2.33b 1.00cde 0.90b M 300 Col.a 15
96.97a 1.17a 12.00a 0.28a 4.33ab 3.00a 1.27b 1.10a M 300 Col.b 16 77.78bcdefg 0.37fg 4.67de 0.13c 3.89bc 2.07cde 0.94cde 0.63def M 500 Col. 17
J. Adv. Agric. Res. (Fac. Agric. Saba Basha)
ـــــــــــــــــــــــــــــــــــــــــــــــــــــــــــــــــــــــــــــــــــــــــــــــــــــــــــــــــــــــــــــــــــــــــــــــــــــــــــــــــــــــــــــــــ 179 Vol. 23 (1), 2018
Continued..
Means having an alphabetical letter in common, within a comparable group of means, do not significantly differ, using least significant differences test procedure (L.S.D) at p ≤ 0.05 level of probability.
Starch (%)
Total sugars
(%)
Reducing sugars
(%)
Non-reducing
sugars (%)
Carotene mg/100 g (D.W.)
Tuber root dry matter
(%)
Flesh color
Skin color
Hairiness TSS (%)
Root shape index
Genotypes No.
60.50g 12.86e 10.32a 2.54k 4.11bcd 16.33h 6.67cd 7.00ab 1.00c 9.67ef 3.46cd Abees cv. 1 72.50d 14.76c 4.74d 10.02d 0.74g 20.55efg 8.00b 6.67bc 2.67ab 10.73abcd 3.95ab A 30 Gy 2 60.33g 13.46de 9.61a 3.85j 5.46ab 21.81de 10.00a 8.00a 1.00c 10.00de 4.23a A 70 Gy-a 3 65.00e 16.67b 5.09cd 11.57b 0.43g 23.27bc 8.67ab 7.00ab 1.00c 10.20cde 2.19hi A 70 Gy-b 4 57.17h 13.49de 4.73d 8.76e 1.18fg 24.30ab 2.00f 5.00de 1.00c 10.40bcde 2.63fg A 70 Gy-c 5 74.24cd 10.54f 3.43e 7.11fg 2.28defg 23.61bc 8.00bc 6.00bcd 2.33b 8.53g 3.12de A 70 Gy-d 6 59.67g 17.93a 5.46cd 12.47a 3.00cdef 20.05fg 6.00d 7.00ab 1.67bc 10.00de 3.02ef A 90 Gy-a 7 59.67g 16.14b 5.25cd 10.89c 3.24cde 19.73g 8.00bc 5.67cd 2.33b 10.37bcde 3.70bc A 90 Gy-b 8 57.67h 13.80dce 7.18b 6.62gh 4.29bc 19.73g 8.00bc 7.00ab 3.67a 10.93abc 3.06def A 100 Col. a 9 65.50e 14.55cd 7.17b 7.38f 6.84a 20.88efg 8.00bc 6.67bc 1.67bc 9.00fg 3.05def A 100 Col. b 10 84.00a 3.00i 1.60g 1.40 l 1.80efg 21.12ef 2.00f 6.33bc 1.00c 11.00abc 2.04i Mabrouka cv. 11 81.33b 5.29h 2.37fg 2.92k 3.11cde 25.18a 3.00ef 5.67cd 1.00c 10.40bcde 3.60bc M 30 Gy 12 75.00c 10.82f 5.95c 4.87i 1.91efg 21.79de 3.00ef 4.00ef 1.00c 11.13ab 2.04i M 50 Gy 13 66.20e 7.80g 2.64ef 5.16i 0.48g 22.53cd 3.67e 5.00de 2.00bc 9.53ef 4.21a M 90 Gy 14 60.67g 14.64c 7.42b 7.38f 2.09efg 25.25a 3.00ef 4.00ef 1.00c 11.00abc 2.48gh M 300 Col.a 15 84.67a 5.13h 3.39ef 1.74 l 2.33defg 25.27a 3.33ef 3.67f 1.00c 11.40a 3.81abc M 300 Col.b 16 63.00f 9.75f 3.40ef 6.35h 1.68efg 25.00a 3.67e 5.00de 2.67ab 11.10abc 2.77efg M 500 Col. 17

J. Adv. Agric. Res. (Fac. Agric. Saba Basha)
ـــــــــــــــــــــــــــــــــــــــــــــــــــــــــــــــــــــــــــــــــــــــــــــــــــــــــــــــــــــــــــــــــــــــــــــــــــــــــــــــــــــــــــــــــ 180 Vol. 23 (1), 2018
Genotype X environmental interaction
Results of Table (4) showed highly significant differences among the tested clones regarding all of the studied traits, which indicated that the evaluated sweet potato genotypes differed in their genetic potential with respect to these characters. Also, results clearly indicated that most of the studied characters demonstrated strong dependence on the environmental factor (locations), with the exceptions of root shape index, skin color and flesh color traits. The highly significant environmental effects (location) indicated that there was variability between both locations (Alexandria and El-Gharbeya governorates) due to the differences in soil types, soil moisture conditions and temperature during the growing season, which was also suggested by Nguyen et al. (1980). Similar results were, also, detected by Moussa (1995). The results obtained by Ali et al. (2008) and Ara et al. (2009) on potato, emphasized that environmental factors had enough effects on most studied characters. The interaction between sweet potato genotype x environment (location) reflected highly significant effects on all the studied characters. This finding, generally, suggested that the evaluated genotypes showed different responses, within the studied characters, when grown under different environments. Moussa et al. (2011) and Moussa and Gomaa (2017) who found that most of the studied characters of sweet potato were affected significantly owing to genotype x environment interaction. The authors demonstrated that the new cultivars or strains of sweet potato should be evaluated in a wide range of environments to define the suitable location for each clone. Mean performance of sweet potato genotypes across both locations
Table (5) showed that, "Mabrouka" cv.; gave the highest mean value of fresh foliage weight (kg) per plant among all tested genotypes with insignificant differences with each of the clones No. 3 and 4. With regard to the results of plant length trait, the obtained data appeared that each of clones No. 3, 4, 6 and "Mabrouka" cv., significantly, showed the highest mean values. The highest numbers of branches/plant were recorded by clones No. 3, 10 and 16 with insignificant differences among them. However, the clone No. 3 and "Mabrouka" cv. recorded the highest mean value for number of tuber roots/plant, which significantly differed from the other tested clones. The different tested clones significantly varied, in the average tuber root weight; where, clones No. 4, 6 and 11 produced the maximum average tuber root weight, while the minimum values were recorded by clones No. 2, 12 and 14. The relatively highest tuber root yields (ton/fed.) were recorded by clones No. 3, 4 and 6, which are related to the previously noted high mean values of studied vegetative traits (i.e., fresh foliage weight, plant length and number of main branches /plant) and/or yield component characters (No. of tuber roots/plant and average tuber root weight). Five clones (No. 3,4,6,10 and 16), significantly, established the highest mean values for marketable yield/plant trait, while the clone No. 2 significantly; gave the lowest mean value in this respect. The percentage of marketable yield/plant character appeared that the clones No. 12 possessed the highest value with insignificant differences with each of the following genotypes; "Abees" cv., clones No. 3, 9,11,12,13 and 16. For tuber root characteristics and quality

J. Adv. Agric. Res. (Fac. Agric. Saba Basha)
ـــــــــــــــــــــــــــــــــــــــــــــــــــــــــــــــــــــــــــــــــــــــــــــــــــــــــــــــــــــــــــــــــــــــــــــــــــــــــــــــــــــــــــــــــ 181 Vol. 23 (1), 2018
characters, results in Table (5) appeared that although tuber shape is mainly a varietal characteristic, it can be influenced by environmental conditions and cultural practices, which complicates the evaluation of this trait. Each of genotypes "Abees" cv., clones No. 2, 8 and 10, significantly, possessed the longest tuber root, while clones No. 13, significantly, had the shortest tuber root without significant difference with the "Mabrouka" cv. The highest significant value for the total soluble solids trait was recorded with the clone No. 9 with insignificant differences with each of the two clones No. 2 and 12, while the lowest value was obtained by "Mabrouka" cv. without significant differences with the clone No. 16. Results of hairiness trait showed that the clone No. 2 is the smoothest one. Generally, the tested sweet potato genotypes appeared smooth tuber roots with narrow range for hairiness trait (1.00 - 2.80).
These results might be due to the selection happened for smooth tuber
roots in the early generations of the breeding program. As for skin color, the results of Table (5) showed that clone No.3 possessed purple red skin, while clone No.16 showed creamy skin color. Clone No. 4 showed the most distinct flesh color and possessed dark orange flesh color. On the other side, "Mabrouka" cultivar possessed creamy flesh color. There was wide range for tuber root flesh color trait. Clone No. 4, significantly, gave; somewhat, the dark orange flesh color, while each of the clones No. 12, 13,14,15,16 and 17,significantly, possessed the creamy flesh color. For tuber root dry matter percentage, it appears from Table (5) that the clones No. 15, 16 and 17, significantly, had the highest percentage while the lowest value was obtained by "Abees" cv. Clone No. 10 had the highest significant value in carotene content, followed by Abees cv., clone No. 7 and clone No. 9 with insignificant differences among them, and clone No. 5 was the lowest with insignificant differences with "Mabrouka" cv. and clone No. 13. Each of the clones No. 7, 8 and 9, significantly, recorded the highest percentage for non-reducing sugars and total sugars percentage in addition to clone No. 4 for total sugars trait. The lowest value for non-reducing sugars trait was given by clone No. 16 without significant difference with "Mabrouka" cultivar while it, significantly, gave rise to the lowest percentage for total sugars trait (Table 5). The results of reducing sugars showed that "Abees" cultivar and clone No. 3, significantly, produced the highest percentages while "Mabrouka" cv., significantly, gave the lowest value. These results showed that the clones No. 4, 7, 8 and 9 could be considered more suitable than the other tested genotypes for cooking because of the sweetness of taste followed by the clones A 30 Gy and A 70 Gy-a. Kohyama and Nishinari (1991) illustrated that sweetness is considered one of the important characteristics of sweet potato in food processing and cooking. The results of starch content appeared that each of "Mabrouka" cv. and the clone No. 16 are the starchiest genotypes, where both genotypes, significantly, had the highest value for starch percentage. Starch content plays very important roles in the quality of sweet potato whereas, sweet potatoes with higher starch content are well suited for starch manufacture.

J. Adv. Agric. Res. (Fac. Agric. Saba Basha)
ـــــــــــــــــــــــــــــــــــــــــــــــــــــــــــــــــــــــــــــــــــــــــــــــــــــــــــــــــــــــــــــــــــــــــــــــــــــــــــــــــــــــــــــــــ 182 Vol. 23 (1), 2018
It could be concluded from Table (5) that new three clones; No. 3, 4 and 6 possessed the best mean performances for tuber root yield per feddan when tested overall both locations. Also, clone No. 4 was superior of them due to its content of total sugars. On the contrary, clone No. 16; gave the best results for starch percentage overall both locations. It should be noted that this clone significantly possessed the highest starch percentage in both locations. This means that this clone (No.16) has high stability performance for starch percentage character.

J. Adv. Agric. Res. (Fac. Agric. Saba Basha)
ـــــــــــــــــــــــــــــــــــــــــــــــــــــــــــــــــــــــــــــــــــــــــــــــــــــــــــــــــــــــــــــــــــــــــــــــــــــــــــــــــــــــــــــــــ 183 Vol. 23 (1), 2018
Table (4). Combined analysis of variance across two locations for the studied characters of the tested sweet potato genotypes
S.O.V. df Fresh foliage weight (kg)
Plant length (m)
No. of main branches/plant
No. of tuber roots/plant
Average tuber root weight
(kg)
Yield (ton/fed.)
Marketable yield/plant (kg)
Marketable yield/plant (%)
Blocks 2 0.00 0.02 0.07 0.49 0.00 0.58 0.00 16.18 Location (L) 1 6.09** 1.85** 1.75** 69.72** 0.03** 531.79** 5.51** 2006.69**
Genotype (G) 16 0.23** 0.26** 0.31** 4.71** 0.01** 45.25** 0.38** 151.23** (G) x (L) 16 0.17** 0.15** 0.39** 2.15** 0.01** 36.77** 0.40** 149.39**
Error 66 0.01 0.01 0.02 0.19 0.00 0.67 0.01 47.76
To be continued..
Continued..
S.O.V. df Root
shape index
TSS (%)
Hairiness Skin color
Flesh color
Tuber root dry matter
(%)
Carotene mg/100 g (D.W.)
Non-reducing
sugars (%)
Reducing sugars
(%)
Total sugars
(%)
Starch (%)
Blocks 2 0.17 0.03 0.36 0.03 0.56 1.08 0.22 0.08 0.04 0.07 1.41 Location (L) 1 0.23 7.69** 0.08** 0.47 0.36 35.25** 189.14** 96.15** 23.14** 213.64** 23.43**
Genotype (G) 16 1.63** 9.58** 2.32** 8.71** 47.30** 40.80** 17.69** 73.28** 27.33** 119.39** 461.51** (G) x (L) 16 1.79** 11.38** 1.26** 0.88** 7.27** 5.03** 10.32** 12.31** 7.53** 6.72** 27.48**
Error 66 0.10 0.17 0.21 0.23 0.37 0.90 0.81 0.15 0.22 0.33 1.10 ** denotes significance at 1% level of probability.

J. Adv. Agric. Res. (Fac. Agric. Saba Basha)
ـــــــــــــــــــــــــــــــــــــــــــــــــــــــــــــــــــــــــــــــــــــــــــــــــــــــــــــــــــــــــــــــــــــــــــــــــــــــــــــــــــــــــــــــــ 184 Vol. 23 (1), 2018
Table (5). Mean performance of tested sweet potato genotypes for the studied characters, calculated from the combined data across the two locations
To be continued..
Marketable yield/plant
(%)
Marketable yield/plant (kg)
Yield (ton/fed.)
Average tuber root weight (kg)
No. of tuber roots/plant
No. of main branches/plant
Plant length (m)
Fresh foliage weight (kg)
Genotypes No.
86.83abcd 0.83b 9.58c 0.18defg 5.17b 2.33cd 1.34bc 1.11b Abees cv. 1 75.79f 0.29g 3.85g 0.123i 3.28gh 1.84i 0.81h 0.61f A 30 Gy 2
85.11abcde 1.09a 12.00a 0.20cd 5.72a 2.57ab 1.40abc 1.16ab A 70 Gy-a 3 80.70def 1.02a 12.17a 0.24ab 5.06bc 2.42bc 1.47a 1.20ab A 70 Gy-b 4 82.99cdef 0.67d 7.83de 0.15gh 4.83bcd 2.25cde 1.09e 0.93c A 70 Gy-c 5 80.52def 1.06a 12.50a 0.27a 4.55cde 2.33cd 1.37abc 1.10b A 70 Gy-d 6 78.49ef 0.40f 5.05f 0.17efgh 2.94h 2.00ghi 0.93g 0.84cd A 90 Gy-a 7 81.40def 0.43f 5.10f 0.17efgh 3.05h 1.93hi 0.95fg 0.80d A 90 Gy-b 8 90.15abc 0.67d 7.17e 0.194de 3.72fg 2.17defg 1.04efg 0.87cd A 100 Col. a 9 83.37cdef 0.99a 11.00b 0.19de 4.94bcd 2.55ab 1.32c 1.14b A 100 Col. b 10
92.86a 0.78bc 8.50d 0.17efgh 5.72a 2.07fgh 1.43ab 1.27a Mabrouka cv. 11 92.41a 0.54e 5.75f 0.12i 4.72bcd 2.08efgh 1.05ef 0.78de M 30 Gy 12
86.76abcd 0.69cd 7.88de 0.19def 4.05ef 2.22def 1.12de 0.88cd M 50 Gy 13 80.67def 0.43f 5.33f 0.15hi 3.67fg 2.03gh 0.97fg 0.66ef M 90 Gy 14
84.36bcde 0.63de 7.50e 0.23bc 3.33gh 2.22def 0.98fg 0.86cd M 300 Col. a 15 91.45ab 1.00a 10.83b 0.24ab 4.50de 2.65a 1.35bc 1.13b M 300 Col. b 16 81.39def 0.61de 7.33e 0.16fgh 4.56cde 2.24cdef 1.21d 0.93c M 500 Col. 17

J. Adv. Agric. Res. (Fac. Agric. Saba Basha)
ـــــــــــــــــــــــــــــــــــــــــــــــــــــــــــــــــــــــــــــــــــــــــــــــــــــــــــــــــــــــــــــــــــــــــــــــــــــــــــــــــــــــــــــــــ 185 Vol. 23 (1), 2018
Continued..
Means having an alphabetical letter in common, within a comparable group of means, do not significantly differ, using least significant differences test procedure (L.S.D) at p ≤ 0.05 level of probability.
Starch (%)
Total sugars
(%)
Reducing sugars (%)
Non-reducing sugars
(%)
Carotene mg/100 g (D.W.)
Tuber root dry matter
(%)
Flesh color
Skin color
Hairiness TSS (%)
Root shape index
Genotypes No.
61.30f 14.82cd 8.89ab 5.94g 5.76bc 16.33j 7.83b 7.00b 1.02e 9.33ef 3.65ab Abees cv. 1 70.92c 16.52b 4.92f 11.60b 3.56fg 19.62h 8.00b 5.83c 2.83a 11.67ab 4.01a A 30 Gy 2 63.30e 16.31b 9.08a 7.23f 4.77cde 22.27def 6.52c 8.02a 1.00e 10.53cd 3.49bcd A 70 Gy-a 3 65.28d 17.78a 6.42e 11.36b 4.60def 21.29fg 9.33a 7.00b 1.00e 10.43d 3.13def A 70 Gy-b 4 57.17h 15.33c 6.57e 8.76e 1.18i 23.80bc 2.00e 5.00de 1.00e 10.40d 2.63hi A 70 Gy-c 5 72.12c 14.53d 4.31g 10.22c 4.72de 23.35cd 8.50b 6.50b 2.17b 9.30f 3.53bc A 70 Gy-d 6 62.93e 17.49a 5.04f 12.45a 5.93b 18.83hi 8.00b 6.83b 1.33de 10.50cd 3.42bcde A 90 Gy-a 7 59.50g 17.52a 5.33f 12.18a 4.31def 17.95i 8.50b 5.33cd 2.17b 11.48b 3.95a A 90 Gy-b 8 59.50g 17.52a 5.33f 12.18a 5.06bcd 17.95i 8.50b 5.33cd 2.17b 11.97a 3.22cdef A 100 Col. a 9 72.12c 14.53d 4.310g 10.22c 7.70a 23.35cd 8.50b 6.50b 2.17b 9.80b 3.76ab A 100 Col. b 10 84.05a 3.69j 1.54i 2.10k 1.54i 22.62de 1.50e 5.67c 1.00e 7.57h 2.39ij Mabrouka cv. 11 75.33b 7.69h 4.20gh 3.49j 4.85cde 23.75bc 3.50d 5.33cd 2.00bc 11.67ab 3.10efg M 30 Gy 12 76.00b 12.35e 8.21cd 4.14i 1.90hi 21.89efg 3.00d 4.50e 1.50cde 10.60cd 2.26j M 50 Gy 13 64.60d 8.49g 3.83gh 4.66h 2.90gh 22.29def 3.33d 4.50e 1.50cde 8.33g 2.97fgh M 90 Gy 14 59.33g 15.35c 8.43bc 6.91f 3.99ef 24.70ab 3.00d 4.50e 1.00e 10.97c 2.72hi M 300 Col. a 15 84.67a 5.48i 3.74h 1.74k 2.67gh 25.04a 3.17d 3.67f 1.50cde 8.03gh 3.19cdef M 300 Col. b 16 61.58f 10.41f 4.21gh 6.201g 2.71gh 23.97abc 3.33d 5.00de 1.83bcd 10.62cd 2.76gh M 500 Col. 17

J. Adv. Agric. Res. (Fac. Agric. Saba Basha)
ـــــــــــــــــــــــــــــــــــــــــــــــــــــــــــــــــــــــــــــــــــــــــــــــــــــــــــــــــــــــــــــــــــــــــــــــــــــــــــــــــــــــــــــــــ 186 Vol. 23 (1), 2018
Correlations between studied characters of tested sweet potato enotypes over two locations
Results presented in Table (6) showed that correlation coefficient values were positive and significant with the following pairs of characters:
Foliage weight (kg) with each of plant length (m), No. of main branches/plant, No. of tuber roots/plant, average tuber root weight (kg), yield (ton/fed.), marketable yield/plant (kg), marketable yield/plant (%), carotene (mg/100g) and total sugars (%). Plant length (m) with each of No. of main branches/plant, No. of tuber roots/plant, average tuber root weight (kg), yield (ton/fed.), marketable yield/plant (kg), marketable yield/plant (%), skin color, carotene (mg/100g) and starch (%). No. of main branches/plant with each of No. of tuber roots/plant, average tuber root weight (kg), yield (ton/fed.), marketable yield/plant (kg), marketable yield/plant (%), TSS and reducing sugars (%). No. of tuber roots/plant with each of average tuber root weight (kg), yield (ton/fed.), marketable yield/plant (kg), marketable yield/plant (%), carotene (mg/100g), and reducing sugars (%). Average tuber root weight (kg) with each of yield (ton/fed.), marketable yield/plant (kg) and marketable yield/plant (%), TSS, carotene (mg/100g) and total sugars (%).Yield (ton/fed.) with each of marketable yield/plant (kg), marketable yield/plant (%), skin color, carotene (mg/100g), reducing sugars (%) and total sugars (%). Marketable yield/plant (kg) with each of marketable yield/plant (%), skin color, carotene (mg/100g), reducing sugars (%) and total sugars (%). Marketable yield/plant (%) with starch (%). Root shape index with each of TSS, skin color, flesh color, carotene (mg/100g), non-reducing sugars (%) and total sugars (%). Total soluble solids (TSS) with each of skin color, flesh color, non-reducing sugars (%) and total sugars (%). Hairiness with flesh color. Skin color with each of flesh color, carotene (mg/100g), non-reducing sugars (%), reducing sugars (%) and total sugars (%). Flesh color with each of carotene (mg/100gm), non-reducing sugars (%), reducing sugars (%) and total sugars (%). Dry matter (%) with starch (%). Carotene (mg/100g) with each of non-reducing sugars (%), reducing sugars (%) and total sugars (%). Non-reducing sugars (%) with total sugars (%). Reducing sugars (%) with total sugars (%).
Results presented in Table (6) showed that each pair of the following characters was significantly and negatively correlated:
Plant length (m) with total soluble solids (TSS). No. of main branches/plant with hairiness. No. of tuber roots/plant with total soluble solids (TSS). Marketable yield/plant (%) with flesh color. Total soluble solids (TSS) with each of dry matter (%) and starch (%). Skin color with starch (%). Flesh color with each of dry matter (%) and starch (%). Dry matter (%) with each of carotene (mg/100g), non-reducing sugars (%), reducing sugars (%) and total sugars (%). Carotene (mg/100g) with starch (%). Non-reducing sugars (%) with starch (%). Reducing sugars (%) with starch (%). Total sugars (%) with starch (%).

J. Adv. Agric. Res. (Fac. Agric. Saba Basha)
ـــــــــــــــــــــــــــــــــــــــــــــــــــــــــــــــــــــــــــــــــــــــــــــــــــــــــــــــــــــــــــــــــــــــــــــــــــــــــــــــــــــــــــــــــ 187 Vol. 23 (1), 2018
It worth mentioning that the absence of a significant correlation between any pair of characters indicates that selection of any of these characters is largely independent from the other character. Correlations of characteristics among yield, its components, and other economic traits are important for making a selection in a breeding program. Correlation coefficient analysis measures the mutual relationship between various plant characteristics and determines the component characters on which selection can be based for improvement in yield. Knowledge of inter-relationships between different traits is important in breeding for direct and indirect selection of characters that are not easily measured and those with low heritability (Patil et al., 1981). Selection for root yield, which is a polygenic trait, often leads to changes in other characters. Therefore knowledge of the relation that exists between root yield and other characters and also inter-relationships among various characters is necessary to be able to design appropriate selection criteria in sweet potato breeding (Engida et al., 2006). Fongod et al. (2012) illustrated that there was a positive correlation between most of the agronomic and morphological parameters of sweet potato. The results of Gedamu et al. (2010) indicated that phenotypic correlation analysis presented highly significant association between root diameter and root yield, and significant correlation between average root weight and total root yield. Total root yield was also significant and negatively associated with root length and root dry matter content. Therefore, yield components should receive more attention during varietal selection. Moussa and Gomaa (2017) stated that tuber root yield per feddan was positively correlated with each of foliage weight, plant length, number of tuber roots per plant and average tuber root weight. Shin et al. (2011) demonstrated in their study that there was a negative correlation between sugars content and starch content in sweet potato tuber roots.
CONCLUSION
Using gamma-ray radiation or chemical mutagen agents on sweet potato stems has been able to obtain genetic variations, reduces time, saves a lot of effort of sweet potato breeders and overcomes self- and cross-incompatibility problems in sweet potato cultivars. Through the use of mutants on sweet potato cultivars, we were able to obtain new clones that outperform the traditional cultivars in terms of productivity, quality and exportable to foreign markets.

J. Adv. Agric. Res. (Fac. Agric. Saba Basha)
ـــــــــــــــــــــــــــــــــــــــــــــــــــــــــــــــــــــــــــــــــــــــــــــــــــــــــــــــــــــــــــــــــــــــــــــــــــــــــــــــــــــــــــــــــ 188 Vol. 23 (1), 2018
Table (6). Correlation coefficient values (r) for pairs of studied characters of seventeen sweet potato genotypes across two locations
1-Plant length (m), 2-No. of main branches/plant, 3-No. of tuber roots/plant, 4-Average tuber root weight (kg), 5-Yield (ton/fed.), 6- Marketable yield/plant (kg), 7-Marketable yield/plant (%), 8-Root shape index, 9-TSS, 10-Hairness, 11-Skin color, 12-Flesh color, 13-Dry matter (%),14-Carotene (mg/100g), 15- Non-reducing sugars (%), 16- Reducing sugars (%), 17- Total sugars (%), 18- Starch (%). * and ** denote significant and highly significant at 5% and 1% levels of probability, respectively.
Characters 1 2 3 4 5 6 7 8 9 10 11 12 13 14 15 16 17 18
Fresh foliage weight (Kg) 0.84** 0.73
** 0.81
** 0.61
** 0.89
** 0.89
** 0.58
** 0.09 -0.12 -0.23 0.19 0.03 -0.07 0.36
** 0.14 0.19 0.21
* 0.11
Plant length (m) 0.75** 0.73
** 0.58
** 0.83
** 0.84
** 0.48
** -0.04 -0.22
* -0.27
* 0.23
* -0.03 0.07 0.21
* 0.03 0.09 0.07 0.20
*
No. of main branches/plant 0.57** 0.72
** 0.86
** 0.86
** 0.53
** 0.07 0.09
* -0.20
* 0.14 -0.05 0.12 0.17 0.08 0.23
* 0.19 0.05
No. of tuber roots/plant 0.23* 0.73
** 0.74
** 0.46
** 0.04 -0.32
** -0.17 0.16 -0.09 0.07 0.26
** -0.08 0.22
* 0.05 0.10
Average tuber root weight (kg) 0.80** 0.78
** 0.39
** 0.07 0.24
* -0.15 0.15 0.14 0.00 0.20
* 0.19 0.16 0.24
* 0.06
Yield (ton/fed.) 0.99** 0.50
** 0.13 0.04 -0.19 0.25
* 0.10 0.01 0.34
** 0.15 0.28
** 0.27
** 0.06
marketable yield/plant (kg) 0.62** 0.13 0.05 -0.17 0.23
* 0.05 0.00 0.35
** 0.13 0.26
** 0.24
* 0.08
Marketable yield/plant (%) -0.01 0.00 -0.04 -0.06 -0.24* -0.02 0.18 -0.13 0.03 -0.09 0.20
*
Root shape index 0.29** 0.18 0.35
** 0.62
** -0.40
** 0.42
** 0.38
** 0.07 0.34
** -0.15
Total soluble solids (%) 0.06 0.23** 0.30
** -0.32
** 0.12 0.48
** 0.17 0.48
** -0.40
**
Hairiness -0.02 0.27** -0.14 0.06 0.18 -0.10 0.10 -0.04
Skin color 0.60** -0.43
** 0.35
** 0.41
** 0.29
** 0.48
** -0.31
*
Flesh color -0.62** 0.56
** 0.61
** 0.22
* 0.61
** -0.35
**
Tuber root dry matter (%) -0.48** -0.44
** -0.22
* -0.47
** 0.37
**
Carotene (mg/100 g ) 0.37** 0.32
** 0.46
** -0.28
**
Non-reducing sugars (%) 0.10 0.86** -0.53
**
Reducing sugars (%) 0.59** -0.48
**
Total sugars (%) -0.68**

J. Adv. Agric. Res. (Fac. Agric. Saba Basha)
ـــــــــــــــــــــــــــــــــــــــــــــــــــــــــــــــــــــــــــــــــــــــــــــــــــــــــــــــــــــــــــــــــــــــــــــــــــــــــــــــــــــــــــــــــ 189 Vol. 23 (1), 2018
REFERENCES A.O.A.C. (1970). Official Methods of Analysis. 11th ed. P. 526. Ahn, Y.O., S.H. Kim, C.Y. Kim, J.S. Lee, S.S. Kwak and H.S. Lee (2010).
Exogenous sucrose utilization and starch biosynthesis among sweet potato cultivars. Carbohyd. Res., 345: 55-60.
Ahn, Y.S., K.S. Min, B.C. Jeong, M.N. Chung, J.S. Lee, Y.H. Oh and Y.I. Kuk (2002). Cross-compatibility and incompatibility of Korean Sweet potato Varieties. Korean J. Breed. Sci., 34(3): 236-243.
Ali, M.Z.M., A.M. El-Gamal, A.H. El-Nadi, W.S. Ragheb and A.S. Soliman (2008). Stability of some genetic characters of some potato cultivars under different environments. The Fourth International Conference for Development and the Environment. King Saud University, Riyadh, Saudi Arabia.
Ara, T., A. Haydar, M.A. Islam, M.A.S. Azad and H. Khokan (2009). Path analysis in potato. J. Soil Nature 3 (2): 20-23.
Chahal, G. S. and S. S. Gosal (2002). Principles and Procedures of Plant Breeding. Alpha Science International Ltd., pp: 399-412.
Chandrashekar, K. R., H. M. Somashekarappa, and J. Souframanien (2013). Effect of gamma irradiation on germination, growth, and biochemical parameters of Terminalia arjuna Roxb. Rad. Protec. & Environ., 36(1): 38-44.
Dermen, H and S.L. Emsweller (1961). The use of colchicine in plant breeding. Publisher (Beltsville, Md.) : U.S. Dept. of Agric., Agricultural Research Service.
Dospekhove, B.A. (1984). Field Experimental Statistical Procedures. Mir Publishers, Russia 349.
Dubois, M., K.A. Gilles, J.K. Hamilton, P.A. Rebers and F. Smith (1956). Colorimetric method for determination of sugars and related substances. Analytical Chemistry, 28 (3): 350 – 356.
Engida T.E.V., D. Sastry and D. Nigussie (2006). Correlation and Path Analysis in Sweet Potato and Their Implications for Clonal Selection. J. Agron., 5(3): 391-395.
FAOSTAT (2006). FAO database. (http://faostat.fao.org/site/567/default.aspx). (http:/www.ars-grin.gov/)
FAOSTAT (2014). FAO database. (http://www.fao.org/faostat/en/#data/QC) Fongod, A.G.N., A.M. Mih and T.N. Nkwatoh (2012). Morphological and
agronomical characterization of different accessions of sweet potato (Ipomoea batatas) in Camiron. International Research J. of Agric. Sci. and Soil Sci. (2): 234-245.
Gedamu, Y., G. Belay and N. Dechassa (2010). Genotypic and phenotypic correlations of root yield andother traits of orange fleshed sweet potatoes [Ipomoea batatas(L.) Lam.]. J. Dry lands. 3(2): 208-213.
Grant, W.F. and M.F. Salamone (1994).Comparative mutagenicity of chemicals selected for test in the international program on chemical safety collaborative study on plant systems for the detection of environmental mutagens. Mutation Res. 310: 187-209.

J. Adv. Agric. Res. (Fac. Agric. Saba Basha)
ـــــــــــــــــــــــــــــــــــــــــــــــــــــــــــــــــــــــــــــــــــــــــــــــــــــــــــــــــــــــــــــــــــــــــــــــــــــــــــــــــــــــــــــــــ 190 Vol. 23 (1), 2018
Haris, A., B. Abdullah, A. Subaedah, and K. Jusoff (2013). Gamma ray radiation mutant rice on local aged dwarf. Middle-East Journal of Scientific Research, 15(8): 1160-1164.
Hironori, M., F. Ogasawara, K. Sato, H. Higo and Y. Minobe (2007). Isolation of a regulatory gene of anthocyanin biosynthesis in tuberous roots of purple-fleshed sweet potato. Pl. Physio., 143: 1252-1268.
Jan, S., T. Parween and T. O. Siddiqi (2012). Effect of gamma radiation on morphological, biochemical, and physiological aspects of plants and plant products. Environ. Rev., 20(1): 17-39.
Ji, M. S., B.K. Kim, S.G. Seo, S.B. Jeon, J.S. Kim, B.K. Jun, S.Y. Kang, J.S. Lee, M.N. Chung and S.H. Kim (2011). Mutation breeding of sweet potato by gamma-ray radiation. African J. Agric. Res., 6 (6): 1447-1454.
Khan, S., F. Al-Qurainy and F. Anwar (2009). Sodium Azide: a Chemical Mutagen for Enhancement of Agronomic Traits of Crop Plants. Environ. We Int. J. Sci. Tech. 4: 1-21.
Kohyama, K. and K. Nishinari (1991). Effect of soluble sugars on gelatinization and retro gradation of sweet potato starch. J. Agric. Food Chem. 39: 1406-1410.
Loebenstein, G., S. Fuentes, J. Cohen and L.F. Salazar (2003). Sweet potato. In: Loebenstein, G., Thottappilly, G. (Eds.), Virus and Virus-Like Diseases of Major Crops in Developing Countries. Kluwer Academic Publishers, Dordrecht, The Netherlands,pp. 223–248.
Miller, P.A., J.C. Williams and H.F. Robinson (1959). Variety × environment interactions in cotton variety tests and their implications on testing methods. Agron. J., 50: 132-134.
Mohan, J. S. (2006). Mutation-assisted breeding for improving ornamental plants. Acta Hort., 714:85-98.
Moussa, S.A.M. (1995). Effect of environmental conditions on some characteristics of potato (Solanum tuberosum, L.) cultivars. M. Sc. Thesis, Fac. Agric. Saba-Bacha, Alex. Univ., Egypt.
Moussa, S.A.M., H.A. Abd El-Aal and N. A. El-Fadl (2011). Stability study of sweet potato yield and its component characters under different environments by joint regression analysis. J. Hort. Sci. & Ornam. P., 3 (1): 43-54.
Moussa, S.A.M. and S.E. Gomaa (2017). Mutation breeding and assessment of clones induced through gamma radiation of the sweet potato cultivar (Abees). Egypt. J. Pl. Breed., 21 (2): 321-338.
Nguyen, H.T., D.A. Sleper and K.L. Hunt (1980). Genotype × environment interactions and stability analysis for herbage yield of tall fescue synthetics. Crop Sci. 20: 221-224.
Patil, V.D., V.G. Makane and P.R. Chopde (1981). Genetic variability and character association in intervarietal crosses of linseed. Ind. J. Agric. Sci.51: 631-633.
Rahimi, M. M. and A. Bahrani (2011). Effect of gamma irradiation on qualitative and quantitative characteristics of Canola (Brassica napus L.). Mid. East J. Sci. Res., 8(2): 519-525.
Raicu, P. and F. Mixich (1992). Cytogenetic effects of sodium azide mutagnesis in barley. Hered. 98: 89-94.
J. Adv. Agric. Res. (Fac. Agric. Saba Basha)
ـــــــــــــــــــــــــــــــــــــــــــــــــــــــــــــــــــــــــــــــــــــــــــــــــــــــــــــــــــــــــــــــــــــــــــــــــــــــــــــــــــــــــــــــــ 191 Vol. 23 (1), 2018
Rines, H.W. (1985). Sodium azide mutagenesis in diploid and hexaploid oats and comparison with ethyl methane sul-fonate treatments. Env. Exp. Bot. 25: 7-16.
Schum, A. (2003). Mutation breeding in ornamentals and efficient breeding method. Acta Hort., 612: 47-60.
Shin, J.M., K. Bong-Kyu, S. Sang-Gyu, B.J. Seo, K. Ji-Seong, K. Byung, K. Si-Yong, L.S. Joon, C. Mi-Nam and K. Sun-Hyung (2011). Mutation breeding of sweet potato by gamma-ray radiation. Afri. J. Agric. Res., 6 (6): 1447-1454.
Shu, Q.U. (ed.) (2009). Induced Plant Mutations in the Genomics Era. Food and Agriculture Organization of the United Nations, Rome, 253-256.
Snedecor, G.W. and W.G. Cochran (1980). Statistical Methods. The Iowa State Univeristy Press, Ames, USA.
Song, H.S. and S.Y. Kang (2003). Application of Natural Variation and Induced Mutation in Breeding and Functional Genomics: Papers for International Symposium; Current Status and Future of Plant Mutation Breeding. Korean J. Breed. Sci., 35(1): 24-34.
Umiel, N. and W.H. Gabelman (1971). Analytical procedures for detecting carotenoids of carrot (Daucus carota L.) roots and tomato (Lycopersicone sculentum) fruits. J. Amer. Soc. Hort. Sci. 96: 702-704.
Wang, Y, F. Wang, H. Zhai and Q. Liu (2007). Production of a useful mutant by chronic irradiation in sweet potato. Sci. Horti., 111(2): 173-178.
Yoon, K.E., Y.H. Park and B.G. Im (1990). Effect of gamma radiation on seed germination and androgenesis in Nicotiana tabacum L. Korean J. Breed. Sci., 21: 256-262.

J. Adv. Agric. Res. (Fac. Agric. Saba Basha)
ـــــــــــــــــــــــــــــــــــــــــــــــــــــــــــــــــــــــــــــــــــــــــــــــــــــــــــــــــــــــــــــــــــــــــــــــــــــــــــــــــــــــــــــــــ 192 Vol. 23 (1), 2018
������ ����
�� ���� ������� �� ����� � � � ���� ����� �������� � �!����"��#���� �$
��%�� ��&� '� ��&�( � ��) �) ��*���� �) +, + ���� �&� ������ �) -���( +
�&� ���.���,
��������� �� �� ���� � ����� �� �� ���� � ������� ����� ������ ���� �� �� ��� .
������� ��!� � "�� #�� $��#%� ���.– ���' � �(� � ��� ����#��%�
�) � �*+ � ,�- "!� .�/� . ���0�� 1� 2�!� ����!0��� �� ���� 3�� ���� �� ����� 3+����� ��� "��4�5 ��'
� "��-�� "�!��� ���� �� "+������) �� ��� �� ���6���7 ��8��') �#� �� ��!� � ��6 9�(� ��� ���� !� ��#�
:������� �� ;�#�'���� . ���� !� �������� � ���' ��(< 9�� ;��=���� ������* �� ����/ ��8������� ;��=���� �< 9��
���� �� �< �� ���� !� �������� :������� ����� "+ ��#� .��=��%� ������ �� ���< �����6�� � ����(�����
. ������� ?��� 9�6�� � �� �#��� ;@/� $��#) "4 ������� A-4 B��4<����� ���� � "+ .����� $��#%�
. �4��-' .��' ;�=6 �(�#��� �� < B#6�� ��4� ��!���� ���� �� B�#6< �� ��=#6� ��=���� ?�'<2������ .
� ����#��%� �5+��� 2������ .�(�#��� ���� � B#6��� "+�����< .������ ��� ;�5+��� 1� ;< ���' ��(
"8����+ �=��� /� �����<�� . ��8����� ;��=��� ���< �����6�� ������(����� �� �� 9/� �� ��=����:D ��)
���� �� 90� 1���� ;���'� ��<;�'�� ���' ��( EF �GF �HF �IF ?��' "+ ���� �� 90� ��J �< �
;������ ����(����� 9�!���FF�EFF�GFF ��� / �'� .����K ����� �<�����6�� 9�!�� "+ 90��� ��J
;������ ���< GF �HG ��FF ��� / �'� .����K ���� . .�=���� 90��� ;��� ���� "=�6�� ������ "+
F�L ��� 6�� ����� �� �� ���� ����� D ����#��%� . ������� �� ��(< ��/� ���� �� � ��( 9/�
����� 9�� ?��� M�+ -�<EF ;��� �� ?��< .�� M��� �!0��� "!� "��# ��� 9� �� ��EFF 9��� �!�(
EFF ��#� ;��� #�� ;��� . "���� :���� ���� N��� ���< ��( ,���/ �� ;��� #�� ���O� �� �� ��������
.������ ;�'�� ��=�#��� ���� "=�6�� ������ ���� N� . F�G JP� ;!��< ��#�� ;��� #�� ;���� ������/ �� ���
. ���� � .��6 ����# "+ ���J< ��( ����� �=# �� ;6�+ ����#�� ;��� #��?�� "!� ;� # 9� ��� :��#<�
�G �� ��� "!� �Q�# �0+ ��/��� ;�=6 ���+�����7���� �� ��-'� ��8����=��� �� "4� ��5�#) 9�( ��-'��
� �!'�� ����� ��-'�� ��!���"!����� ��!�� ���� . � 8�-�� � !6�� ������ � �#� � � ��#��� ;@/�!� 9�0�� ?�'<
?��P� ;@/��� �� .��=#� ��/� 9� 90� ;������ 9�P� "+ ,���/ �� ;��� #�� ���O� ;�� � ���<
�� �������� .������ ;�'�� 1�=�#) ����< ���� 9�� ) ��( ���� N� . F�K �� ������/ �� ���JP� ;!��<
��=#6�� "�� �+��%� � ��#��� .���'�� ;@/��� ;��� ���!6P� ���� �� �� < � �#��0�!����0�� ��'��#%�
.��'�� ;�=6� "+ �� �O�� �5+��� ���� �0�#�� � ����#��)@� �5+��� �� < �0�#� ��4 ��=!��� ������ "+

J. Adv. Agric. Res. (Fac. Agric. Saba Basha)
ـــــــــــــــــــــــــــــــــــــــــــــــــــــــــــــــــــــــــــــــــــــــــــــــــــــــــــــــــــــــــــــــــــــــــــــــــــــــــــــــــــــــــــــــــ 193 Vol. 23 (1), 2018
�'���� ;����0�� ���6� ��8��(��� �!����� ;����� /� �- ��6��� �� . 9�< "+ ���J< F�K� ;��5< ���
: "!��� R8��#�� D
� D . �������� ;�=6�� N��' "+ .� ����� ���� �� ;@/� �� ���#�� ;�+/��) ��'�
D "!� �� � ?�#�� ���S� (������� N����) "8� �� 9���!� ���� �������� ;�=6�� 3�=� R8��#�� ;��5< ��
�� < �0�#� �0�#� "!� ����#��%� �5+��� ������� ;�=6!� � �#�� �� �O�� �5+��� ���� ;�=6� �
� .��'�� ;�=6 �5���� ����#���� ��'��#%� 1� ��V8�6� . ���� �� ��-'� ��8����=��
E D 2� ��� "������ "8� �� 9��=���< �������� ;�=6�� N��' "!� �� � ?�#�� �� .���� "!� ��W� ��� ���0�
"+ � ��#��� ���� �� ;@/� ;@/��� "!� ����� ���� "�� ��8� �� ��68�6� "+ �#�� ���� N������ �� ����
. N��� 9�� ;@/��� :�#< ������ ����6 �0��� .���'��
L D ;��/� R8��# ;��5<�� ��%� �� ��/� ��'� �������� ;�=6�� $���<�� ��) :'�� A�'�) ;�-� ���#��
;�=6 �� 9� N� (���=!� ���� ) ��-'�� �� "!��� 9�6���� �=6 �� 9�� � (�'��� ) $����� X���� ���
� (����� ) ;� #���-'�� ��� ����� � ;� #!� ��-'�� ��� � ;� #�� "!� ���8��� M��=�� ��� � (�'��� )
�� 3����!� 9 �0�� 9�6�� ;� # /3����!� 9 �0�� 9�6��!� ���8��� � �#�� � (�'��� );� # / .
G D ��=�� ��#� ;@/� /� ; ����<)E �L �K( �������� :������� "�� "!� � �#�� ���#�� ���=� ��������
��#%� �� �� ;@/��� ,!� ;��=�� �-4 � ���=!� ���� ��'��#@� �=6����!���� ��=#6�� "!� ��' � � �� <
���� � ��=!��� ������ "+ ���0��� 9/� �� ����=�� :�# ��6�� �-4 "+� .;��=� ;@/��� ����<E �L �K
:�# �� < B#6�� "!� K, G % �FL, H � %L[,EF ;@/��� �=# ;��=� ��#� � "������ "!� %
:�# ���� � B#6�� "!��0 �����[,L� � %�[,LE% �FK,LH . "������ "!� % ;@/� /��� ;����
;������� �� ����� � �# "!� ��8����* �0 ���� \!6� ���<� � .�8�� ;@/�� .���� ;@/��� A-4 9�'� ���
��#������ ������ �� ���� ��� �4��-' �+�'�� .����� � �# .����� �� < B#6�� �#��0� ���6�!� .
K D �=� ��/��� ;� ����K ��/� ��!�'� ��� �4��-' �(#�� "!� ��8����) "+ �������� �������� :������� "�� "!�
.���� 9'< �� �����!� N�#6����(#�� $�����%.