selecting your bond portfolio in today’s environment
TRANSCRIPT

Selecting your bond portfolio in today’s environment
Christine Thorpe Institutional Portfolio Manager Michael Danaher Portfolio ManagerPete Stringfellow National Brokerage CoachThom Maciula Regional Brokerage Consultant
Fidelity Brokerage Services LLC, Member NYSE, SIPC, 900 Salem Street, Smithfield, RI 02917
2021 FMR LLC, All rights reserved. 832020.4.0
October 6, 2021

2
What is on our agenda today?
Bond market context
Building and maintaining an individual bond portfolio
Investing in individual bonds
Questions
Investing in a Separately Managed Account (SMA)

2021 Bond market context

4
2021 Bond Market Recap
Source: Bloomberg, August 2021EM – Bloomberg USD Emerging Markets Index, IG Corp – Bloomberg U.S. Corporate Investment Grade Index, TIPS – Bloomberg U.S. TIPS Index, Muni – Bloomberg Municipal Bond Index, MBS – Bloomberg U.S. Mortgage-Backed Securities (MBS) Index, US Agg – Bloomberg U.S. Aggregate Index, UST – Bloomberg U.S. Treasury Index (see index definitions page 25).Past performance is no guarantee of future results.
-2.00%
-1.00%
0.00%
1.00%
2.00%
3.00%
4.00%
5.00%
Year-To-Date Total Returns of Major Bond Sub-asset Classes through August 2021
UST US Agg MBS Fix rate IG Corp EM Muni TIPS

5
Source: Morningstar EnCorr, Fidelity Investments (AART).Past performance is no guarantee of future results. It is not possible to invest directly in an index. All indices are unmanaged. Index performance is not meant to represent that of any Fidelity mutual fund. Diversification does not ensure a profit or guarantee against loss. Bond returns represented by the performance of the Bloomberg U.S. Aggregate Bond Index from January 1976 and by a composite of the IA SBBI U.S. Intermediate-Term Government Bond Index (67%) and the IA SBBI U.S. Long-Term Corporate Bond Index (33%) from January 1926 through December 1975. Stock returns represented by the performance of the S&P 500 Index.
CALENDAR YEAR TOTAL RETURN (%)
-50
-40
-30
-20
-10
0
10
20
1929 1930 1931 1932 1934 1937 1939 1940 1941 1946 1953 1957 1962 1966 1969 1973 1974 1977 1981 1990 2000 2001 2002 2008 2018
Tota
l Ret
urn
(%)
Investment Grade Bonds S&P 500®
When Stocks Fall, Bonds Have Tended to Stabilize Portfolio Returns(1926–2021)

6
0%
2%
4%
6%
8%
10%
12%
14%
16%
2020
2017
2014
2011
2008
2005
2002
1999
1996
1993
1990
1987
1984
1981
1978
1975
1972
1969
1966
1963
1960
1957
1954
1951
1948
1945
1942
1939
1936
1933
1930
1927
1924
1921
1918
1915
1912
1909
1906
1903
1900
1897
1894
1891
1888
1885
1882
1879
1876
1873
Yie
ld %
Even When Rates Rise, Bond Returns Can Be Resilient
IG: Investment Grade. Past performance is no guarantee of future results. Asset class total returns are represented by indexes from Fidelity Investments, Morningstar, and Bloomberg. Fidelity Investments proprietary analysis of historical asset class performance, which is not indicative of future performance. Sources: U.S. Treasury, Bloomberg Finance L.P., Fidelity Investments (AART) as of 12/31/2020. U.S. Treasury data reflects year-end closing daily yield from 1873 to present except for current year to date period as noted.
10-Year U.S. Treasury YieldsPeriod of Rising Rates
(1941-1981)Period of Falling Rates
(1982-2020)
Average Annualized IG Bond Returns 3.4% 7.7%

Investing in individual bonds
Building & maintaining an individual bond portfolio
8
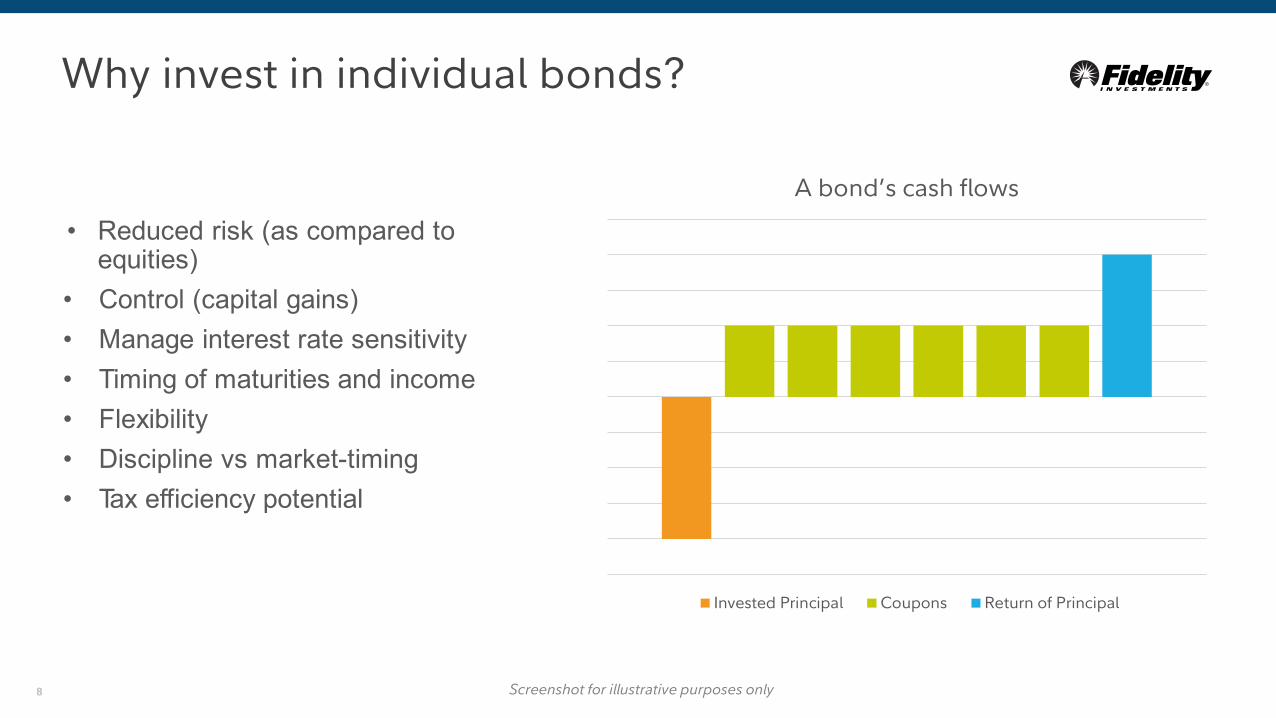
Why invest in individual bonds?
A bond’s cash flows
Invested Principal Coupons Return of Principal
• Reduced risk (as compared to equities)
• Control (capital gains)• Manage interest rate sensitivity• Timing of maturities and income• Flexibility• Discipline vs market-timing• Tax efficiency potential
Screenshot for illustrative purposes only

9
Building a self-managed portfolio of individual bonds
A repeatable process• Beyond Yield - Criteria• Bond Search (& Save)• Analyzing Results• Researching the Issuer• Bond Ladders• Ownership Experience
News & Research > Fixed Income, Bonds& CDs > Understanding Bonds tab > Fixed Income Insights
Screenshot for illustrative purposes only

10
Fidelity’s bond inventory aggregation platform
~75K Unique Bonds Offered
~120KTotal Offerings

11
Search for bonds: using multiple criteriaFinding the bonds you want
• Screen for bond and CD offerings• Search across multiple product types:
‐ US Treasuries‐ Municipal Bonds‐ Agency Bonds‐ Corporate Investment Grade Bonds‐ Corporate High Yield Bonds‐ Brokered Certificate of Deposit
• Save search criteria for future efficiency• Secondary market and new issue
bonds available for most bond types
News & Research > Fixed Income, Bonds& CDs > Find Bonds and CDs tab > Bonds
Screenshot for illustrative purposes only

12
Bond research: understand the structure and recent events
Screenshot for illustrative purposes only
Bond Details page for cusip-specific info
• Understand “structural” aspects of a bond‐ Coupon‐ Yield‐ Call risk‐ Credit ratings
• View Material Events (Munis)• View Issuer Events (Corporates)• View Recent Trades• Link to 3rd-party research• Broader market data and news
From the Bond Search Results page, click a bond’s Description field to see Details.
News & Research > Fixed Income, Bonds & CDs > Research & Markets tab

13
Bond Ownership Experience: Subscribe to alerts on your bond holdings and/or availability of new issues
Screenshot for illustrative purposes only
• Be reminded when a bond or CD in your portfolio is about to mature‐ Email‐ Fidelity.com’s Message Center
• Stay informed of certain issuer or material events such as bond calls
• Receive updates on credit ratings status: Upgrades, downgrades and credit watch
• Take advantage of brief opportunities to purchase new issues
News & Research > Fixed Income, Bonds & CDs > Bond Tools tab > Fixed Income Alerts > Fixed Income Holding or Fixed Income New Issues & Secondary Offerings

14
Bond Ladder Tool: build a portfolio of bonds with staggered maturity dates
• Intuitive design allows you to seamlessly build, edit, & purchase a bond ladder
• View estimated income and principal information in a chart format
• Manage interest rate risk and reinvestment risk
• Ability to export the ladder to the Fixed Income Analysis tool for income analysis before you invest
Screenshot for illustrative purposes only
News & Research > Fixed Income, Bonds & CDs > Bond Tools tab > Bond Ladder Tool > Build a Bond Ladder

15
Fixed Income Analysis tool: Monitor your bond portfolio
Screenshot for illustrative purposes only
• Efficiently analyze of your bond & bond fund positions held at Fidelity
• Integrate outside holdings for holistic analysis
• Evaluate the timing of cash flows• Identify sources of call risk &
concentration risk
News & Research > Fixed Income, Bonds & CDs > Bond Tools tab > Fixed Income Analysis Tool

16
Fidelity’s Cost Transparency
Minimum markup or markdown of $19.95 applies if traded with a Fidelity representative. For U.S. Treasury purchases traded wit h a Fidelity representative, a flat charge of $19.95 per trade applies. A $250 maximum applies to all trades, reduced to a $50 maximum for bonds maturing in one year or less. Rates are for U.S. dollar-denominated bonds; additional fees and minimums apply for non-dollar bond trades. Other conditions may apply; see Fidelity.com/commissions for details. Please note that markups and markdowns may affect the total cost of the transaction and the total, or "effective," yield of your investment. The offering broker, which may be our affiliate, National Financial Services LLC, may separately mark up or mark down the price of the security and may realize a trading profit or loss on the transaction.
AFidelity Process: “Transparent Pricing”
OFFERINGS SEEN BY TRADERS
PRICES SEEN BY CUSTOMERS IN
OFFERINGS
PRICES SEEN BY CUSTOMERS IN TRADE TICKET
BMarkup Broker Process: “Undisclosed Pricing”
Inventory (and prices) from dealers
Inventory (and prices) from dealers
Disclosed Mark-up
($1/Bond)
Inventory (and prices) from dealers
$1
Bond
Inventory (and prices) from dealers
Inventory (and prices) from dealers
Inventory (and prices) from dealers
Undisclosed Mark-up
($?/Bond)
Undisclosed Mark-up
($?/Bond)
$?
Bond
1 2 3

Investing in a Separately Managed Account (SMA)
18
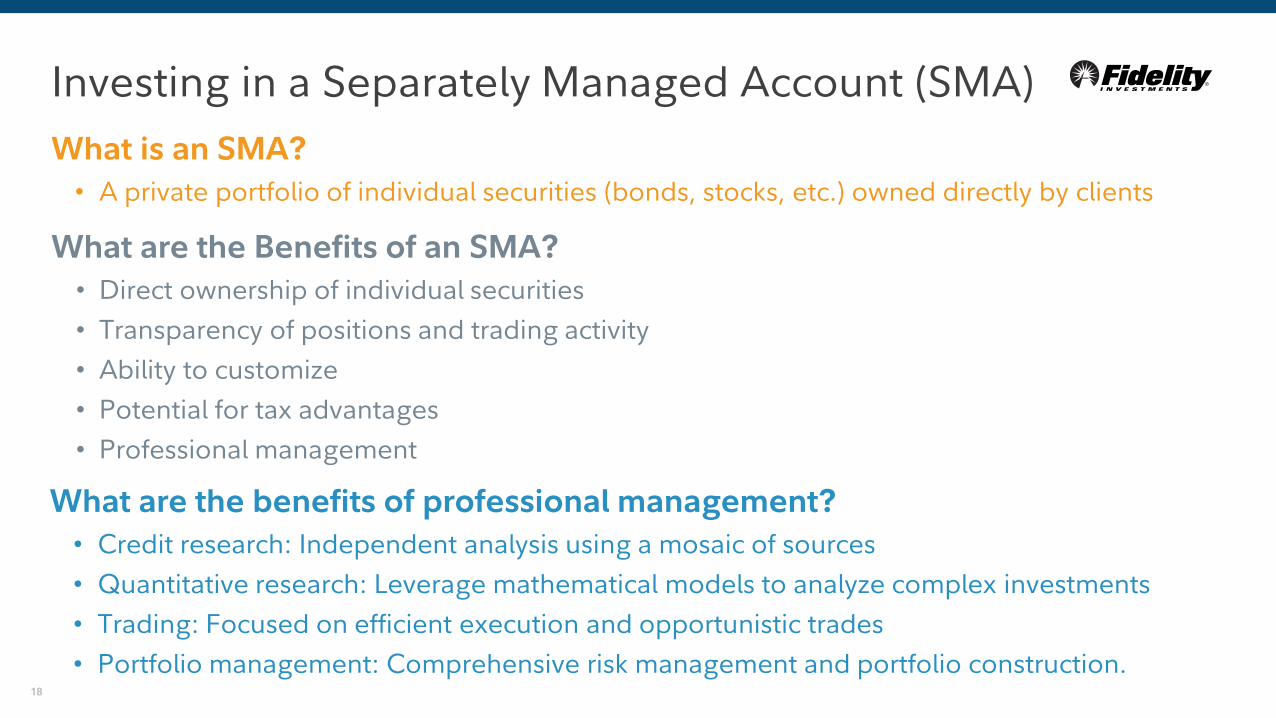
What are the Benefits of an SMA?• Direct ownership of individual securities• Transparency of positions and trading activity• Ability to customize • Potential for tax advantages• Professional management
What are the benefits of professional management?• Credit research: Independent analysis using a mosaic of sources• Quantitative research: Leverage mathematical models to analyze complex investments• Trading: Focused on efficient execution and opportunistic trades• Portfolio management: Comprehensive risk management and portfolio construction.
What is an SMA?• A private portfolio of individual securities (bonds, stocks, etc.) owned directly by clients
Investing in a Separately Managed Account (SMA)

19
Investment Philosophy and Team
INVESTMENT PHILOSOPHY
Focus on In-Depth Research
• Fully independent and proprietary research
• Leverage research across fixed income, high yield, and equity
• Analyze opportunities and risks using proprietary models and tools
Diversify across Investment-Grade Bonds
• Invest in a broad range of investment-grade bonds*
• Limited exposure to lower credit quality investment grade bonds*
• Seek to provide an experience consistent with client expectation.
Balance Income Potential and Risk
• Employ a total return approach— consider both yield and risk
• Emphasize opportunities that have price upside potential
• Strive to avoid bonds whose yields may not offset their risks
Size of firm-wide research team allows for broad coverage and analyst specialization
Over 350 research professionals around the globe:
More than 13,000 company contacts per year
More than 5,000 in-house visits per year
More than 35,000 proprietary research notes per year
• 42 Portfolio Managers• 113 Research Professionals
• 34 Traders• 17 Other
Fidelity Fixed Income Professionals²
Fidelity Fixed Income Division$1,531.8B Assets Under Management¹
Managing Fixed Income since 1971
* At time of purchase1. Fidelity Investments, as of 6/30/21. Data is unaudited. Fidelity fixed income assets include investment-grade and high-income products, bond sub-portfolios of multi-asset class strategies and money market cash management vehicles.Fidelity fixed income assets under management include accounts managed by Fidelity Institutional Asset ManagementSM (FIAM®)and its affiliates, not all of which may be part of the FIAM firm for GIPS purposes.2. Fidelity Investments, as of 6/30/21. Data is unaudited. These figures reflect the resources of Fidelity Management & Research Company a U.S. company, and its subsidiaries. Research professionals include both analysts and associates.Other includes division management and other investment professionals.
A research-based approach that seeks to balance income with risk management

20
Fidelity Personal Bond Management Investment Process
* Number of portfolio holdings dependent on overall portfolio size.Source: Fidelity Investments.
INVESTMENT UNIVERSE
CREDIT ANALYSIS
CLIENTPORTFOLIO
QUANTITATIVEANALYSIS
PORTFOLIO CONSTRUCTION
TRADING
Review issuer strength
Understand sector dynamics
Eliminate unsuitable issuers
Develop and utilize proprietary tools
Evaluate risk
Identify undervalued bonds
Diversify at sector and issuer level
Monitor portfolio and rebalance
Identify trading opportunities
Capitalize on fragmented market
Seek efficient execution
Apply multiple lenses to identify attractive bonds.
A broad universeof investment grade fixed income securities across different sectors and maturities
Sourcing both primary and secondary market opportunities
Intermediate Municipal and Taxable Core mandates
Approximately 25-50 holdings *

21
Fidelity Fixed Income SMA Line-UpFidelity Intermediate Municipal Strategy
Fidelity Core Bond Strategy
• Strategy: National municipal portfolio with some state preference (CA, NY) and alternative minimum tax (AMT) selection
• Interest Rate Sensitivity: 4–6 year duration
• Credit Quality: Investment-grade-rated securities
• Approximately 25–50 holdings*
• Diversified across revenue and general obligation bonds
• Strategy: Core taxable investment-grade bond portfolio
• Interest Rate Sensitivity: 4–6 year duration
• Credit Quality: Investment-grade-rated securities
• Approximately 25–50 holdings*
• Diversified across Treasuries, government agencies, investment-grade corporates, mortgage bonds, asset-backed bonds, and taxable municipal bonds
Minimum investment$350,000
Gross annual advisory fee0.35%–0.40%**
* Number of portfolio holdings dependent on overall portfolio size.** Varies based on total assets invested. The advisory fee does not cover charges resulting from trades effected with or through broker-dealers other than affiliates of Fidelity Investments, mark-ups or mark-downs by broker-dealers, transfer taxes, exchange fees, regulatory fees, odd-lot differentials, handling charges, electronic fund and wire transfer fees, or any other charges imposed by law or otherwise applicable to your account. You will also incur underlying expenses associated with the investment vehicles selected.*** Fidelity Strategic Disciplines clients must generally qualify for support from a dedicated Fidelity advisor, which is based on a variety of factors (for example, a client with at least $250,000 invested in eligible Fidelity account (s) would typically qualify). For details, review the Program Fundamentals available online or through a representative.
https://fixedincome.fidelity.com/ftgw/fi/FILanding#tbmanagedaccts

22
Key Takeaways
1 Fixed income continues to contribute towards reduced volatility and principal protection despite facing unexpected market challenges.
2 Transparency helps you align to your needs. Owning individual bonds, whether in a self-managed approach or through a Separately Managed Account (SMA), provides you the transparency of knowing what you own and the ability to adjust cash flows and maturities.
3 If you prefer to manage your investments independently, Fidelity’s fixed income tools can help you research markets, search inventory, and manage your bond portfolio with confidence. In addition, our Fixed Income Specialists can help you get started and answer your questions.
4 Fidelity’s fixed income SMAs utilize a research-based approach seek to balance the opportunity to generate income and deliver capital appreciation with a deep emphasis on risk management.

23
ThankYou
Please join us for ourupcoming webinars
Learn more online atFidelity.com/fixedincome > Service & Solutions
Fidelity.com/managed-accounts > Separately Managed Accounts > Fixed Income
Questions? Set an appointment with your local Financial Consultant

24
Important InformationIn general, the bond market is volatile, and fixed income securities carry interest rate risk. (As interest rates rise, bond prices usually fall, and vice versa. This effect is usually more pronounced for longer-term securities.) Fixed income securities also carry inflation risk, liquidity risk, call risk, and credit and default risks for both issuers and counterparties. Any fixed income security sold or redeemed prior to maturity may be subject to loss. The municipal market can be affected by adverse tax, legislative, or political changes, and by the financial condition of the issuers of municipal securities.
References to individual securities are for illustrative purposes only, and should not be considered an offer to sell, a solicitation of an offer to buy, or a recommendation for the security.
Diversification does not ensure a profit or guarantee against loss.
Fidelity Investments is not affiliated with either Tradeweb Direct or Interactive Data Corporation.
A bond ladder, depending on the types and amount of securities within it, may not ensure adequate diversification of your investment portfolio. While diversification does not ensure a profit or guarantee against loss, a lack of diversification may result in heightened volatility of your portfolio value. You must perform your own evaluation as to whether a bond ladder and the securities held within it are consistent with your investment objectives, risk tolerance, and financial circumstances. To learn more about diversification and its effects on your portfolio, contact a representative.
The Fixed Income Analysis tool, and Bond Ladder tool are designed for educational purposes only and you should not rely on them as the primary basis for your investment, financial or tax planning decisions.

25
Important Information ContinuedViews expressed are as of the date indicated, based on the information available at that time, and may change based on market or other conditions. Unless otherwise noted, the opinions provided are those of the speakers and not necessarily those of Fidelity Investments or its affiliates. Fidelity does not assume any duty to update any of the information.
All indexes are unmanaged, and performance of the indexes includes reinvestment of dividends and interest income, unless otherwise noted. Indexes are not illustrative of any particular investment, and it is not possible to invest directly in an index.
Bloomberg U.S. High Yield Index is a market value–weighted index that covers the universe of dollar-denominated, fixed-rate, non-investment grade debt.
Bloomberg Emerging Market Bond Index is an unmanaged index that tracks total returns for external-currency-denominated debt instruments of the emerging markets.
Bloomberg U.S. Corporate Investment Grade Index is a market value–weighted index of investment-grade corporate fixed-rate debt issues with maturities of one year or more.
Bloomberg U.S. TIPS Index is an unmanaged index that consists of inflation-protected securities issued by the U.S. Treasury.
26
Important Information ContinuedBloomberg Municipal Bond Index is an unmanaged index that includes investment-grade, tax-exempt, and fixed-rate bonds with at least one year until final maturity selected from issues larger than $75 million.
Bloomberg U.S. Aggregate Index is an unmanaged index that tracks domestic investment-grade bonds, including corporate, government, and mortgage-backed securities.
The Bloomberg U.S. Mortgage-Backed Securities (MBS) Index tracks agency mortgage-backed pass-through securities (both fixed-rate and hybrid ARM) guaranteed by Ginnie Mae (GNMA), Fannie Mae (FNMA), and Freddie Mac (FHLMC). The index is constructed by grouping individual TBA-deliverable MBS pools into aggregates or generics based on program, coupon and vintage. Introduced in 1985, the GNMA, FHLMC and FNMA fixed-rate indices for 30- and 15-year securities were backdated to January 1976, May 1977, and November 1982, respectively. In April 2007, agency hybrid adjustable-rate mortgage (ARM) pass-through securities were added to the index.
Bloomberg U.S. Treasury Index is a market value–weighted index of public obligations of the U.S. Treasury with maturities of one year or more.
The IA SBBI U.S. Intermediate-Term Government Bond Index is a custom index designed to measure the performance of intermediate-term U.S. Government bonds.
IA SBBI U.S. Long-Term Corporate Bond Index is a custom index designed to measure the performance of long-term U.S. corporate bonds.

27
Important Information ContinuedStandard & Poor's 500 Index (S&P 500 Index) is an index of 500 stocks chosen for market size, liquidity and industry grouping, among other factors. The S&P 500 is designed to be a leading indicator of U.S. equities and is meant to reflect the risk/return characteristics of the large cap universe.
Fidelity® Strategic Disciplines provides nondiscretionary financial planning and discretionary investment management for a fee. Fidelity® Strategic Disciplines includes the Fidelity® Intermediate Municipal Strategy and the Fidelity® Core Bond Strategy. Advisory services offered by Fidelity Personal and Workplace Advisors LLC (FPWA), a registered investment adviser. Brokerage services provided by Fidelity Brokerage Services LLC (FBS), and custodial and related services provided by National Financial Services LLC (NFS), each a member NYSE and SIPC. FPWA, FBS, and NFS are Fidelity Investments companies.
FPWA has engaged Fidelity Management & Research Company LLC , a registered investment adviser and a Fidelity Investments company, to provide the day-to-day discretionary portfolio management of Fidelity® Intermediate Municipal Strategy and Fidelity® Core Bond Strategy accounts, including investment selection and trade execution, subject to FPWA's oversight.
© 2021 FMR LLC. All rights reserved. Fidelity Brokerage Services LLC, Member NYSE, SIPC, 900 Salem Street, Smithfield, RI 02917