selected antecedents of customer loyalty within a
TRANSCRIPT

The Pennsylvania State University
The Graduate School
The College of Health and Human Development
SELECTED ANTECEDENTS OF CUSTOMER LOYALTY
WITHIN A RESTAURANT LOYALTY PROGRAM:
PERCEIVED CONTROL, PRIVACY CONCERN, PERCEIVED VALUE OF A
LOYALTY PROGRAM, AND WILLINGNESS TO DISCLOSE INFORMATION
A Dissertation in
Hotel, Restaurant and Institutional Management
by
Hee Seok Lee
© 2008 Hee Seok Lee
Submitted in Partial Fulfillment
of the Requirements
for the Degree of
Doctor of Philosophy
December 2008

This dissertation of Hee Seok Lee was reviewed and approved* by the following:
Carolyn U. Lambert Associate Professor of Hotel, Restaurant and Institutional Management Dissertation Adviser Chair of Committee
David A. Cranage Associate Professor of Hotel, Restaurant and Institutional Management
Karthik Namasivayam Associate Professor of Hotel, Restaurant and Institutional Management
Dongwon Lee Associate Professor of College of Information Science and Technology
Hubert B. Van Hoof Professor of Hotel, Restaurant and Institutional Management Director of the Department of Hotel, Restaurant and Institutional Management
*Signatures are on file in the Graduate School

iii
ABSTRACT
The objectives of this study were to examine a conceptual model of information
disclose and customer loyalty with respect to the sensitive level of information, perceived
control, privacy concern, and perceived value of a loyalty. Data for the study were
collected using an online survey distributed to customers who made a reservation for
dinner at a student managed restaurant and 300 participants completed the online survey.
The data were analyzed by univariate and multivariate analyses including analysis of
variance, analysis of covariance, multivariate analysis of variance, regression analyses
and the structural equation modeling. The findings indicated 1) customers’ willingness to
disclose and perceived value of a loyalty program are the determinants of customer
loyalty (e.g. behavioral intent and relative attitude); 2) willingness to disclose is affected
by perceived control (e.g. perceived cognitive and decisional control), privacy concern
and perceived value of a loyalty program; 3) privacy concern is affected by the sensitivity
level of information and perceived cognitive control; and 4) perceived value of loyalty
program is affected by information privacy concern.
The implications of the findings for restaurant managers are that they can collect
more disclosure-based information in a restaurant loyalty program by controlling the
sensitivity level of information and providing a loyalty program which has a high
perceived value. Also, restaurants may provide customers with more control over the way
that companies use personal information to collect disclosure-based information.
For future research, the generalizability could be improved by recruiting
participants from a restaurant which practices CRM with a loyalty program. By doing so,

iv
the information requested by the company would be more realistic. Also, other marketing
strategies to reduce privacy concern, other than providing an information edit function,
need to be examined in a restaurant loyalty context. Additionally, further examination of
an information edit function utilized in this study and its effect on privacy concern and
willingness to disclose would help to explain the relationship between greater willingness
to disclose (and greater privacy concern) and absence of information edit function.

v
TABLE OF CONTENTS
LISTS OF TABLES........................................................................................................... ix
LISTS OF FIGURES ........................................................................................................ xii
CHAPTER 1 INTRODUCTION ....................................................................................... 1
Statement of the Problem................................................................................................ 2
Objectives of the Study................................................................................................... 4
Research Questions......................................................................................................... 5
Significance of the Study ................................................................................................ 6
Organization of the Study ............................................................................................... 6
CHAPTER 2 LITERATURE REVIEW ............................................................................ 7
Customer Relationship Management.............................................................................. 7
Winer’s CRM Model .................................................................................................. 7
Construction of a Customer Database....................................................................... 10
Self-disclosure............................................................................................................... 10
Dimensions of Self-disclosure .................................................................................. 10
Intimacy and Sensitivity of Information ................................................................... 13
Privacy Concern............................................................................................................ 15
Perceived Control.......................................................................................................... 17
Averill’s Conceptualization of Perceived Control.................................................... 18
Perceived Control in the Information Disclosure Contexts ...................................... 19
Perceived Value ............................................................................................................ 21
Economic Benefits and Social Benefits.................................................................... 23
Exchange Theory: Perceived Value and Information Disclosure............................. 25

vi
Social Penetration Theory: Perceived Social Benefits and Information Disclosure. 26
Customer Loyalty.......................................................................................................... 29
Conceptual Model......................................................................................................... 32
Overview................................................................................................................... 32
Summary of Hypotheses ............................................................................................... 48
CHAPTER 3 METHODOLOGY .................................................................................... 50
Pilot Test ....................................................................................................................... 50
Development of Measurement Items ........................................................................ 50
Participants and Procedures for the Data Collection ................................................ 59
Results....................................................................................................................... 60
Main Study.................................................................................................................... 74
Design of the Study................................................................................................... 74
Experimental Treatments .......................................................................................... 75
Dependent Variables................................................................................................. 77
Participants................................................................................................................ 79
Procedures for the Data Collection ........................................................................... 80
Statistical Analysis........................................................................................................ 82
CHAPTER 4 RESULTS AND DISCUSSION................................................................ 87
Manipulation Check...................................................................................................... 88
Reliability and Validity of the Measurement Items...................................................... 90
Perceived Cognitive and Decisional Control............................................................ 90
Privacy Concern........................................................................................................ 91
Perceived Value of a Loyalty Program..................................................................... 91

vii
Customer Loyalty...................................................................................................... 91
Descriptive Characteristics of the Respondents............................................................ 92
Test of the Hypotheses.................................................................................................. 92
Hypothesis 1.............................................................................................................. 92
Hypotheses 2a and 2b ............................................................................................... 94
Hypotheses 2c and 2d ............................................................................................... 95
Hypotheses 3, 4a and 6 ............................................................................................. 99
Hypothesis 4b.......................................................................................................... 104
Hypotheses 5a, 5b, and 5c....................................................................................... 106
Hypothesis 7............................................................................................................ 109
Hypothesis 8............................................................................................................ 110
Summary ..................................................................................................................... 113
CHAPTER 5 SUMMARY, CONCLUSIONS, IMPLICATIONS, AND
RECOMMENDATIONS................................................................................................ 115
Introduction................................................................................................................. 115
Summary of the Findings............................................................................................ 116
Discussion ................................................................................................................... 120
Determinants of Customer Loyalty: Perceived Value of a Loyalty Program and
Willingness to Disclose........................................................................................... 120
Information Sensitivity, Privacy Concern, and Willingness to Disclose................ 121
Information Edit Function, Perceived Control, and Willingness to Disclose......... 122
Privacy Concern, Perceived Value, and Willingness to Disclose........................... 124
Conclusions and Implications ..................................................................................... 126

viii
Limitations and Recommendations for Future Research............................................ 129
Limitations .............................................................................................................. 129
Recommendations for Future Research .................................................................. 131
REFERENCES ............................................................................................................... 133
APPENDIX A DEFINITION OF TERMS.................................................................... 144
APPENDIX B SCREEN CAPTURES OF PILOT STUDY QUESTIONNAIRE ........ 147
APPENDIX C SCREEN CAPTURES OF HIGH SENSITIVE AND PRESENCE OF
INFORMATION EDIT FUNCTION QUESTIONNAIRE............................................ 156
APPENDIX D SCREEN CAPTURES OF LOW SENSITIVE AND ABSENCE OF
INFORMATION EDIT FUNCTION QUESTIONNAIRE............................................ 172

ix
LISTS OF TABLES
Table 1. Lists of information items and their categories in previous research. ................ 51
Table 2. Measurement items for cognitive control, adapted from Faranda’s study (2001).
................................................................................................................................... 55
Table 3. Measurement items for decisional control, adapted from previous research (de
Rijk et al., 1998; Mathwick & Rigdon, 2004). ......................................................... 55
Table 4. Measurement items for perceived value, adapted from previous research
(Gwinner et al., 1998; Lacey, 2007). ........................................................................ 57
Table 5. List of the benefits offered in the scenario and the scale to measure the
importance of the benefits, adapted from previous research (Gwinner et al., 1998;
Lacey, 2007). ............................................................................................................ 57
Table 6. Measurement items for customer loyalty, adapted from previous research
(Lacey, 2007; Mattila, 2006; Yi & Jeon, 2003)........................................................ 58
Table 7. Descriptive statistics of the measurement items for information sensitivity. ..... 61
Table 8. Analysis of variance for the measurement items for information sensitivity. .... 63
Table 9. Test of homogeneity of variance for the measurement items for information
sensitivity. ................................................................................................................. 63
Table 10. Multiple mean comparisons among the mean of the measurement items for
information sensitivity. ............................................................................................. 65
Table 11. Categorization of the measurement items for information sensitivity.............. 66
Table 12. Total variance explained for perceived control. ............................................... 68
Table 13. Rotated component matrix for the measurement items for perceived control.. 69

x
Table 14. Total variance explained for importance of perceived benefits........................ 72
Table 15. Rotated component matrix for the measurement items for importance of
perceived benefits. .................................................................................................... 73
Table 16. Measurement items for privacy concern, adapted from previous research
(Milne & Culnan, 2004; Miyazaki & Fernandez, 2001)........................................... 78
Table 17. Summary of independent and dependent variables and the statistical analysis
methods to examine the interests in hypotheses. ...................................................... 85
Table 18. Descriptive statistics of the perceived sensitivity level of the information items.
................................................................................................................................... 89
Table 19. Analysis of variance for the perceived sensitivity level of the information
items.......................................................................................................................... 89
Table 20. Chi-square test for the information edit function manipulation and the response
to the presence of the information edit function. ...................................................... 90
Table 21. Demographics of the participants. .................................................................... 92
Table 22. Means and standard deviation for privacy concern by information sensitivity
level........................................................................................................................... 93
Table 23. Means and standard deviation for perceived cognitive and decisional control by
information edit function. ......................................................................................... 95
Table 24. Means and standard deviation for information privacy concern by information
edit function level. .................................................................................................... 96
Table 25. Analysis of covariance for information privacy concern by information edit
function. .................................................................................................................... 96
Table 26. Parameter estimates from ANCOVA for information privacy concern. .......... 97

xi
Table 27. Fit indices for perceived value – privacy concern – willingness to disclose
model....................................................................................................................... 100
Table 28. Centroids and the number of cases in each cluster. ........................................ 102
Table 29. Means and standard deviation for willingness to disclose information by
information edit function. ....................................................................................... 103
Table 30. Means and standard deviation for willingness to disclose information by
information sensitivity level. .................................................................................. 105
Table 31. Analysis of covariance for willingness to disclose by information sensitivity.
................................................................................................................................. 105
Table 32. Analysis of covariance for willingness to disclose by information edit function.
................................................................................................................................. 107
Table 33. Parameter estimates from ANCOVA for willingness to disclose................... 107
Table 34. Means and standard deviation for willingness to disclose information by
information sensitivity level. .................................................................................. 108
Table 35. Regression coefficients for perceived value on customer loyalty. ................. 109
Table 36. Regression coefficients for willingness to disclose information on customer
loyalty. .................................................................................................................... 110
Table 37. Measurement items correlations among perceived value of a loyalty program,
willingness to disclose (IVs) and customer loyalty (DV)....................................... 112
Table 38. Regression coefficients for perceived value of a loyalty program and
willingness to disclose information on privacy concern......................................... 112
Table 39. Summary of the hypotheses and the results from the statistical analyses. ..... 113

xii
LISTS OF FIGURES
Figure 1. Winer’s seven-step customer relationship management (CRM) model. ............ 9
Figure 2. The relationship of three components of self-disclosure. ................................. 11
Figure 3. Conceptual model of information disclosure and its relationship with
information sensitivity, privacy concern, perceived value, perceived control and
customer loyalty........................................................................................................ 33
Figure 4. Summary of conceptual model of information disclosure and its relationship
with information sensitivity, privacy concern, perceived value, perceived control and
customer loyalty........................................................................................................ 48
Figure 5. Scree plot of the measurement items for perceived control.............................. 68
Figure 6. Scree plot of the measurement items for importance of perceived benefits. .... 72
Figure 7. Conceptual model of willingness to disclose information disclosure and its
relationship among information sensitivity, privacy concern, perceived value,
perceived control and customer loyalty. ................................................................... 88
Figure 8. Means for privacy concern by information sensitivity and information edit
function level. ........................................................................................................... 98
Figure 9. Parameter estimates of perceived value – privacy concern – willingness to
disclose model......................................................................................................... 100
Figure 10. Summary of the results from the hypotheses tests. ....................................... 117

1
CHAPTER 1
INTRODUCTION
Customer relationship management (CRM), also known as database marketing, is
an integrated concept of business processes, technology and the relationship between a
company and its customers (Chen & Popovich, 2003; Greenberg, 2004; Hughes, 2000;
Winer, 2001). Customer relationship management has emerged because customer
retention is more profitable than customer acquisition. For example, repeated customers
generate over twice as much gross income as new customers (Cigliano, Georgiadis,
Pleasance, & Whalley, 2000).
The main objective of CRM is to retain existing customers and increase their
loyalty by establishing long-term relationships (Dyche, 2002; Fitzgibbon & White, 2005).
The companies practicing CRM achieve the goal by way of various approaches such as
customer recognition, customization and individualization. Companies can more
precisely tailor service to customers by learning about the specific characteristics and
requirements of individual customers based on the data captured (Berry, 1983).
Customer information plays a critical role in the provision of customized services
because knowledge and insight about customers are obtained through a customer
database. Customer data are collected from two sources: customers’ transactions with a
company (transaction-based data) and customers’ disclosure (disclosure-based data)
(Norberg & Dholakia, 2004). Transaction-based data refer to data typically found in
transaction detail records on completion of a purchase and examples of transaction-based
data include name, address and telephone number. Disclosure-based data refer to data

2
that are typically related to internal beliefs and attitudes and are not usually collected
during completion of a commercial transaction.
Disclosure-based personal information is not obtainable unless customers agree to
provide it. However, customers may become concerned about information privacy when
they are asked to release their personal information (Hoffman, Novak, & Peralta, 1999;
Moon, 2000; Norberg & Dholakia, 2004). Privacy concern refers to the level of consumer
anxiety for the way that their personal information is used by companies (Phelps,
D'Souza, & Nowak, 2001). Besides privacy concern, other factors related to willingness
to disclose information include perceived control and perceived value of a loyalty
program.
This study focused on disclosure-based data collection and customers’ willingness
to disclose. Therefore, it is important to understand the effects of the antecedents on
customers’ willingness to disclose information and the relations among factors.
Statement of the Problem
Despite the importance of a customer information file, little is understood about
customers’ privacy concern and willingness to disclose in a restaurant loyalty program
context. While customers’ concern about information privacy was found to vary
depending on types of information requested, the information type does not fully explain
a situational influence. For example, a telephone number and social security number can
be categorized as examples of personal identification information; however, concern
about how companies use the information will vary. Therefore, another categorization of
information and its influence on privacy concern are worthy of investigation.

3
While privacy concern and control (e.g. desire for control and perceived control)
were examined as antecedents of willingness to disclose information in previous studies,
little research was found on the relationship between privacy concern and perceived
control empirically examined in a loyalty program context. Since perceived control was
proposed to have a stress-reducing effect on the impending stressful event in previous
research (Averill, 1973), the empirical examination of the effect of perceived control on
privacy concern needs to be examined.
In previous research, it was proposed that consumers are reluctant to disclose
personal information due to privacy issues and due to these tendencies, customers’
information disclosure is based on the assessment of benefits and costs associated with
providing such information (Franzak, Pitta, & Fritsche, 2001; Lee, Im, & Taylor, 2008).
That is, customers assess some form of a trade-off between what is received (e.g. benefits
received) and what is given (e.g. information and other costs associated with information
disclosure) and customers’ information disclosure is made based on such assessment. In a
loyalty program context, customers’ assessment of benefits associated with providing
information will be tied with benefits associated with a loyalty program. However,
benefits in a loyalty program seem to be closely associated with repeated patronage and
long-term relationship and loosely associated with information disclosure, so customers’
assessment of benefits associated with information disclosure may be less in a loyalty
context than in the context where information disclosure and benefits are closely
associated because customers perceive fewer benefits. That is, customers may think that
they receive benefits mainly due to repeated patronage, not due to information disclosure.
If so, customers’ assessment of benefits and costs associated with a loyalty program may

4
not explain information disclosure entirely. Instead, privacy concern might explain
willingness to disclose better than perceived value of a loyalty program. However, little is
known about the relationship between privacy concern and perceived value of a loyalty
program with respect to willingness to disclose. It is worth investigating how the
perceived value of a loyalty program and privacy concern play roles in willingness to
disclose in a loyalty program context.
Customer loyalty has been examined in terms of value proposition and
satisfaction, but few research studies were found on customer loyalty related to
customers’ willingness to disclose. While customers who assess benefits offered through
a loyalty program valuable are more likely to show loyalty (Yi & Jeon, 2003), little is
known about whether or not customers who value a loyalty program are more willing to
disclose personal information.
Objectives of the Study
The objectives of the study were to explore 1) the relationship between
customers’ willingness to disclose information and customer loyalty in a restaurant
loyalty program; 2) the role of privacy concern and perceived value of a loyalty program
in willingness to disclose; 3) the effects of requested information based on sensitivity
level and choice availability on privacy concern; and 4) the relationship between
perceived control and privacy concern.
This study examined customers’ willingness to disclose information and its
relationship with customer loyalty. Behavioral intent (e.g. intent to purchase or visit) and
relative attitude (e.g. commitment to continuing the relationship with the company)

5
toward the company were measured for customer loyalty in this study. Also, the
relationship of perceived value of a loyalty program on customer loyalty was examined.
The effects of privacy concern and perceived value of the loyalty program were
examined on customers’ willingness to disclose. More specifically, the accountability of
privacy concern and perceived value was examined on willingness to disclosure.
Privacy concern was examined with respect to the sensitivity level of information
requested and an option to edit, show, hide and view information. The effect of the option
availability was examined with respect to perceived control. Also, the direct effect of
sensitivity level of information and the availability of an option to manage information
was investigated on willingness to disclose.
Research Questions
1. What is the relationship between customers’ willingness to disclose and customer
loyalty?
2. What is the relationship between customers’ perception about value of a loyalty
program and customer loyalty?
3. What is the relationship among customers’ concern about privacy, perception about
value of a loyalty program, and willingness to disclose personal information?
4. Do customers’ concerns about privacy differ depending on types of information
requested?
5. What is the relationship between perceived control and privacy concern?
6
Significance of the Study
This study has two main contributions. First, this study embraced two fields of
research, namely, customer loyalty and information disclosure by examining the
relationship between customers’ willingness to disclose and customer loyalty. While
existing research on customer loyalty focuses mainly on the perceived value of the
loyalty program and satisfaction with products and services, this study explored an
integrated approach for customer loyalty from information disclosure explained by
customers’ concern about privacy, control over information disclosure and perceived
value of a loyalty program.
Second, this study was conducted in a restaurant loyalty program context. By
exploring a loyalty program and information disclosure in a restaurant context, this study
expanded the scope of the topic to restaurants in hospitality research.
Organization of the Study
This dissertation reviews the relevant literature including self-disclosure, privacy
concern, perceived control, perceived value, and customer loyalty in Chapter Two.
Chapter Three describes the development of measurement items with a pilot test and the
design of the main study, variables used and participants and procedures of data
collections in the main study. Results are presented and discussed in Chapter Four.
Chapter Five provides a summary, discussion of the findings, implications with
limitations and recommendations for future research. Definitions of terms are listed in
Appendix A.

7
CHAPTER 2
LITERATURE REVIEW
This chapter presents the concept of customer relationship management (CRM)
and focuses on the construction of a customer database in a CRM model. The concept of
self-disclosure is discussed with respect to the construction of a customer database. Then,
privacy concern, perceived control and their relationship are presented as influential
factors on self-disclosure. The concept of perceived value of a loyalty program and its
relationship with self-disclosure follow. Also, this chapter discusses the concept of
customer loyalty and its relationship with self-disclosure. From these discussions, a
conceptual research model and the hypotheses for the relationships in the model are
proposed.
Customer Relationship Management
Winer’s CRM Model
The marketing interest of many companies has shifted from acquiring a new
customer to retaining current ones (Reichheld, 1996) because repeated customers
generate over twice as much gross income as new customers (Cigliano, Georgiadis,
Pleasance, & Whalley, 2000). Consequently, the companies that focus on customer
retention have started implementing customer relationship management (CRM)
initiatives. Customer relationship management, also known as database marketing, is an
integrated concept of business processes, technology and the relationship between a

8
company and its customers (Chen & Popovich, 2003; Greenberg, 2004; Hughes, 2000;
Winer, 2001). Retaining existing customers by establishing long-term relationships is the
ultimate goal of CRM (Dyche, 2002; Fitzgibbon & White, 2005). The companies
practicing CRM achieve the goal by way of various approaches such as customer
recognition, customization and individualization. Companies can more precisely tailor
service to customers by learning about the specific characteristics and requirements of
individual customers based on the data captured (Berry, 1983).
Winer (2001) presented a model for CRM that consists of seven steps for a
successful program as shown in Figure 1. In his model (2001), the construction of a
customer database or information file is a necessary first step to a complete CRM
solution. The database usually contains information such as transactions, customer
contacts, descriptive information and responses to marketing stimuli (Winer, 2001). Once
a customer database is established, knowledge and insight about customers can be
obtained through cluster and discriminant analyses of the database (Gordon, 2002; Winer,
2001). In many cases, a target customer is selected based on lifetime customer value
(LCV), which is computed in terms of current and future profitability to the company
(Gordon, 2002; Reinartz & Kumar, 2000; Reinartz & Kumar, 2002).

9
Figure 1. Winer’s seven-step customer relationship management (CRM) model.
Relationships with target customers are maintained through various relationship,
or loyalty, programs. Loyalty programs, also called frequency programs, reward
customers for repeated purchases in various ways: customer service, customization, and
community building (Winer, 2001). Examples of customization in loyalty programs
include that customers are greeted by name; their preferences are recognized; and
products and services that fit their needs and wants are offered. Such customization based
on knowledge preferences and behaviors is available at the time of interaction and such
knowledge preferences and behaviors are based on the customer database (Dyche, 2002).
Also, customers can be reached through multiple communication media that fit
customers’ interaction preference. Since the CRM system depends on a database of
customer information and analysis of that data, many consumers are concerned about the
amount of personal information that is contained in databases and how it is being used
(Winer, 2001). In e-commerce, customers are provided with two choices as a way to
reduce privacy concern: opt-in and opt-out. In the opt-in case, customers must consent to
the collection and use of personal data while customers have to explicitly forbid the

10
collection and use in the opt-out case. As the last stage, metrics to measure the success of
the customer-centric CRM solution such as loyalty measures, retention rates, customer
share and other CRM-based measures are calculated.
Construction of a Customer Database
Among the seven steps in Winer’s CRM model, it is worthwhile to focus on a
customer database because the construction of a customer database is a necessary first
step to a complete CRM solution and the foundation for any customer relationship
management activity (Berry, 1983; Winer, 2001). Customer data are collected from two
sources: customers’ transactions with a company (transaction-based data) and customers’
disclosure (disclosure-based data) (Norberg & Dholakia, 2004). Transaction-based data
refer to data typically found in transaction detail records upon completion of a purchase
and examples of transaction-based data include name, address and telephone number.
Disclosure-based data refer to data that are typically related to internal beliefs and
attitudes and are not usually collected upon completion of a commercial transaction in
most cases. This study focuses on the construction of a customer database that relies on
disclosure-based data collection. Therefore, it is important to understand what factors
influence customers’ disclosure.
Self-disclosure
Dimensions of Self-disclosure
Jourard (1971) described self-disclosure as “the act of revealing personal
information to others” (p. 2) while other researchers define it as personal information that

11
is either oral or written communication to others (Cozby, 1973; Omarzu, 2000). The
emphasis of Jourard’s definition is on the behavioral aspect, the act to disclose, while the
emphasis of Omarzu and Cozby’s definitions is on the objective aspect, what is disclosed.
For the purpose of this study, the definition of self-disclosure follows Jourard’s definition
and the terms self-disclosure and information disclosure are used interchangeably.
Self-disclosure, by definition, consists of three components: the discloser, the
target-person, and the information that is disclosed and communicated as shown in Figure
2. Consequently, research on self-disclosure has been conducted with respect to these
components. Regarding self-disclosure research on the discloser component, Jourard
(1971) investigated the impacts of race and gender on the amount of information
disclosed.
Figure 2. The relationship of three components of self-disclosure.
Research on the target-person component has been examined under the topic of
reciprocity (Altman & Taylor, 1973; Jourard, 1971; Omarzu, 2000; Wheeless, 1976).
Reciprocity of self-disclosure was described as a dyadic effect in Jourard’s study (1971).
He proposed that the amount of information that an individual was willing to disclose
was correlated to the closeness of the relationship. That is, people disclose most to those
individuals who most confide in them, and vice versa. Similarly, other researchers

12
postulated a positive relationship between the depth of information exchanged and the
history of an interaction (Altman & Taylor, 1973; Omarzu, 2000; Wheeless, 1976).
Self-disclosure research on information disclosed has investigated the contents
and the measure of information disclosed (Cozby, 1973; Jourard, 1971; Omarzu, 2000).
Researchers suggested that information disclosed can be measured based on three
parameters, namely, breadth, depth, and duration (Cozby, 1973; Jourard, 1971; Moon,
2000; Omarzu, 2000). Breadth refers to the amount of information disclosed or the
number of topics covered while depth describes the intimacy of information or the
intimacy level of disclosure. The level of intimacy is the degree of reluctance to let others
know information about the disclosers. Duration is the time spent disclosing or words
used describing information. While depth and duration are partially independent, depth
and breadth are inversely dependent. That is, the more intimate information is, the less
individuals tend to disclose (Cozby, 1973). Intimate information either is emotionally
intense or contains potentially negative, risky or embarrassing information (Omarzu,
2000). Therefore, intimate self-disclosure will make the discloser feel vulnerable in some
way (Moon, 2000).
Research on self-disclosure has examined what and how much information is
disclosed in relation to the discloser and the target-person. The characteristics of the
discloser and the relationship with the target-person have been suggested to influence
self-disclosure. In addition, the intimacy of information has been proposed to impact self-
disclosure. While intimacy of information relates to emotional intensity, it does not
include monetary loss that may occur at the time of interaction. For example, revealing a
PIN number of a bank account to a third party may cause monetary loss. Thus, the

13
following section discusses intimacy, sensitivity, and type of information related to self-
disclosure.
Intimacy and Sensitivity of Information
While the intimacy level was proposed to influence willingness to disclose
information negatively in some studies (Cozby, 1973; Moon, 2000; Omarzu, 2000), the
type of information was examined as an influential factor on the willingness to disclose in
other studies (Cranor, Reagle, & Ackerman, 1999; Horne, Norberg, & Ekin, 2007;
Phelps, Nowak, & Ferrell, 2000). Previous research found that an individual’s
willingness to disclose and perceived comfort of providing information vary among the
types of information requested (Cranor et al., 1999; Horne et al., 2007; Phelps et al.,
2000). The types of information examined in previous research include demographic data
(e.g. age, marital status, and occupation), lifestyle interests (e.g. hobbies), media habits
(e.g. favorite TV show), personal identification data (e.g. name, address, or telephone
number) and financial data (e.g. annual income). Phelps and his colleagues (2000) found
that customers were more willing to provide demographic and lifestyle information than
purchased-related, personal identifier information, and financial information.
However, studies on the types of information and information disclosure do not
seem to fully explain a situational influence. For example, giving a home phone number
to a cashier at a department store may be perceived more appropriate or legitimate than
giving the same information to a cashier at a restaurant. This discrepancy may occur
because a cashier’s request for a home phone number or zip code occurs frequently at a
department store while such an event rarely happens at a restaurant. Servers or cashiers at
a restaurant usually don’t ask customers’ phone number or zip code so customers might
14
perceive such a request inappropriate. Thus, perceived appropriateness or relevance of
information requested is proposed to be a better indicator to examine information
disclosure (Annacker, Spiekermann, & Strobel, 2001; Chaikin & Derlega, 1974).
Perceived appropriateness or relevance is dependent on the specific circumstance
(Annacker et al., 2001; Howell & Conway, 1990) and it has been operationalized as
intimacy and sensitivity in previous studies (Moon, 2000; Norberg & Dholakia, 2004).
According to Norberg and Dholakia (2004), information intimacy is related to intrinsic
risk whereas information sensitivity is related to extrinsic risk. Information about
personality and physical characteristics is considered intimate information whereas
information about income and credit is considered sensitive information. According to
Moon (2000), intimacy and sensitivity are not mutually exclusive. Intimate self-
disclosure was defined as disclosure of high-risk information that makes the discloser feel
vulnerable in some way (Moon, 2000). The vulnerability is not only described
psychologically and emotionally but also associated with physical harm or material
damage.
Since the ambiguous delineation between intimacy and sensitivity exist in studies
on information disclosure, a clear definition is required to reconcile the ambiguity. For
the purpose of this study, information sensitivity refers to comprehensive information
characteristics that amalgamate emotion intensity and monetary value and reflects a
situational influence. Since sensitive information disclosure relates to psychological,
physical or material risk (Moon, 2000), customers might feel vulnerable upon disclosing
their personal information. Such vulnerable feeling and worries have been examined
under the topic of privacy concern and a discussion follows.

15
Privacy Concern
Privacy concern needs to be discussed with respect to information disclosure.
Customers become cautious when they are asked to disclose personal information
because they are concerned about privacy (Norberg & Dholakia, 2004). Privacy is
defined as “the ability of the discloser to control the access others have to personal
information” (Culnan, 1993, p. 344) and Phelps, Nowak and Ferrell (2000) expanded the
scope of access not only to information but also to the dissemination and use of
information. For the purpose of this study, privacy concern refers to the level of
consumer anxiety for the way their personal information is used by companies (Phelps,
D'Souza, & Nowak, 2001) and is used interchangeably with the term information privacy
concern. Prosser (1960) described privacy-invasion in terms of the legal torts, namely,
intrusion, public disclosure, a false light, and appropriation. Previous research has
examined customers’ privacy concerns, or perceptions of privacy invasion, instead of
privacy itself (Culnan, 1993; Hoffman, Novak, & Peralta, 1999; Martínez-López, Luna,
& Martínez, 2005; Phelps et al., 2000; Phelps et al., 2001). Whether or not they have an
actual ability to control the access that others have to their personal information,
customers are concerned about their information privacy whenever personal information
is requested (Hoffman et al., 1999). The four underlying dimensions of privacy concern
include collection (e.g. too much collection), unauthorized secondary use, errors and
improper access of personal information (Milberg, Burke, Smith, & Kallman, 1995).
Previous research has examined the antecedents and consequences of privacy
concern on the Web context. Examples of the antecedents are type of personal
information requested, control over information use, and consumer characteristics

16
(Phelps et al., 2000), attitude to the stimulus and desire for control (Phelps et al., 2001),
Internet experience and mode/medium (Miyazaki & Fernandez, 2001) and relevance of
information requested (Culnan & Armstrong, 1999). The consequences examined in
research include behavioral responses (Liu, Marchewka, & Ku, 2004; Miyazaki &
Fernandez, 2001; Phelps et al., 2000; Phelps et al., 2001), trust (Liu et al., 2004; Milne &
Culnan, 2004), attitudes or perceptions toward company’s information use or toward the
company (Culnan & Armstrong, 1999; Culnan, 1993; Martínez-López et al., 2005).
Behavioral responses include actual purchase, purchase intention, and request to remove
personal information from a company’s database. A negative relationship of privacy
concern with actual purchase and purchase intention, and a positive relationship with
request to remove personal information have been suggested (Liu et al., 2004; Miyazaki
& Fernandez, 2001; Phelps et al., 2000; Phelps et al., 2001). Similarly, negative
relationships of privacy concern with trust (Liu et al., 2004; Milne & Culnan, 2004) and
with attitudes toward information use by company were proposed (Culnan & Armstrong,
1999; Culnan, 1993; Martínez-López et al., 2005).
While previous research examined various behavioral responses to privacy
concern, little research was conducted on information disclosure as a behavioral response
(Nam, Song, Lee, & Park, 2005). Given that privacy concern, by definition, relates to
worries and risks (Phelps et al., 2001), and self-disclosure is a risk-involved action
(Norberg & Dholakia, 2004), privacy concern and self-disclosure can be examined jointly
and self-disclosure can be treated as a behavioral response to privacy concern (Nam,
Song, Lee, & Park, 2005).

17
Most customers are concerned about the way that personal information is used by
marketers and want more control over it (Phelps et al., 2000; Phelps et al., 2001). More
specifically, consumers desire more information about how companies use personal
information and the more concerned they are about the way their information is used, the
more they desire control over the use of their personal information by companies (Phelps
et al., 2000; Phelps et al., 2001). While previous research examined desire for control
with respect to the way that companies use personal information, the effects of perceived
control on customers’ privacy concern need to be explored. Perceived control is
discussed in the following section.
Perceived Control
Perceived control is worthy of investigation with respect to self-disclosure as an
extension of previous research on the influence of perceived control on behavior or
behavioral intention (Ajzen, 1991; Hui & Bateson, 1991; Povey, Conner, Sparks, James,
& Shepherd, 2000). The relationship between perceived control and behavior was
introduced in the theory of planned behavior, which was developed from the theory of
reasoned action (Ajzen, 1991). In the theory of reasoned action, a person’s behavioral
intention depends on the person’s attitude about the behavior and subjective norm. Due to
the limitations in explaining behaviors over which people have incomplete volitional
control (e.g. lack of confidence or control), the theory of reasoned action was extended to
the theory of planned behavior. The theory of planned behavior proposed that human
behavioral achievement is predicted by the combination of motivation (intention) and
ability (perceived control over behavior). Perceived control in the theory is not actual

18
control over behavior, but perception of ease or difficulty of performance. Literature on
perceived control is presented in the following section and then perceived control in a
loyalty program context is discussed.
Averill’s Conceptualization of Perceived Control
Averill (1973) examined perceived control with respect to stress and separated it
into three different types, namely, behavioral control, cognitive control and decisional
control. An individual takes various forms of actions in order to control unpleasant
situations by preventing entirely, terminating prematurely, or modifying the event
(Averill, 1973; Namasivayam, 2004). Such direct controllability over an external event
can be interpreted as behavioral control. Contrary to direct control to influence the
external environment, cognitive control deals with appraisal and reappraisal of the
impending threatening event (Averill, 1973). It implies that the impending threatening
event is not necessarily changed to be less threatening in order for cognitive control to be
perceived; instead, cognitive control can be perceived through appraisal and reappraisal
of potentially threatening information in a positive way without changing anything in the
threatening event. Thus, the stress-inducing or stress-reducing propertied of personal
control depend on the context in which it is bedded and not just on the effectiveness to
prevent or mitigate a potentially harmful stimulus (Averill, 1973).
Cognitive control is obtained by processing potentially threatening information to
reduce stress. Previous experiments showed that people preferred to have information
about the impending stress and those who had information were willing to endure more
intense stress than those who had no information (Jones, Bentler, & Petry, 1966; Staub &
Kellett, 1972). However, the former subjects did not differ in pain tolerance from the

19
latter. Thus, the result implies that gain in cognitive control makes people prepare for the
impending stressful event whether or not they act or feel differently toward the stress.
Decisional control refers to the range of choice or number of options available
and involves choices prior to an event (Averill, 1973). No freedom of choice often results
in extreme stress (Zimbardo, 1969) and the experience of choice varies as a function of
individual capabilities (Averill, 1973). While a form of choices is required to obtain
decisional control, decisional control is dependent on how a person perceived the choice
available, rather than on the objective range or number of choices. Decisional control is
perceived, so it is the degree to which people agree or identify with the choices available,
no matter how limited.
Perceived Control in the Information Disclosure Contexts
With respect to Averil’s conceptualization of control (1973), the concept of
perceived control has been examined in the service exchange context (Namasivayam,
2004; Van Raaij & Pruyn, 1998). Based on Averil’s conceptualization of control (1973),
Namasivayam (2004) proposed that cognitive control plays a lesser role in service
exchanges because it is less likely for customers to alter their evaluation process toward a
potentially poor service. He posited that two forms of control, behavioral and decisional
controls, are directly relevant to a service exchange. Customers are proactive to direct the
actions of service providers (i.e. behavioral control) and to decide the components of
service provided (i.e. decisional control).
Van Raaij and Pruyn (1998) postulated that control in the service context could be
characterized on the continuum between customer-controlled service and service
provider-controlled service. They define control as “the degree of power and influence on

20
the service specification, realization, and outcome” (p. 816). For example, a bus is an
example of a service provider-controlled service due to the lack of customers’ control
over its fixed route to a destination while a taxi is an example of a customer-controlled
service due to the customer’s freedom of routes.
Similar to Van Raaij and Pruyn’s (1998) and Namasivayam’s studies (2004),
Averill’s conceptualization of perceived control is relevant to the information disclosure
context. Both Averill’s conceptualization of perceived control and self-disclosure relate
to stress. Perceived control was examined to manage stressful situations (Averill, 1973)
and self-disclosure was examined in risks, worries and stress (Norberg & Dholakia, 2004;
Sassaroli & Ruggiero, 2004). However, the difference of this study from Van Raaij and
Pruyn (1998) and Namasivayam’s (2004) studies, where behavioral control is mainly
discussed in the service exchanges context, is in the focus of cognitive control in a loyalty
program context. In the service exchange situation, a customer’s action toward the
service provider is simultaneously interdependent; customers direct, or have freedom to
direct, the actions of the service provider. However, the loyalty program context differs
from a service exchange situation. That is, a company requests a set of information from
a customer, and the customer reacts toward its request: acceptance or denial. Customers
can’t direct the requests from the service provider. When an item of personal information
is requested, customers can’t alter the way that the question was asked or the content that
was requested. The only options available to customers are either disclosure of the
information requested or non-disclosure. Due to the lack of direct control over the actions
of the service provider, behavioral control plays a lesser role than cognitive and
decisional controls in the information disclosure context.

21
As perceived control is expected to influence the disclosure act or disclosure
intent, perceived value is also expected to have an impact, specifically a positive impact,
on the disclosure act or intent. While a positive relationship between perceived value and
a behavioral intent, such as willingness to purchase, was found in previous research
(Dodds, Monroe, & Grewal, 1991), little research was found on the relationship between
perceived value of a loyalty program and information disclosure. The discussion about
perceived value of a loyalty program and information disclosure follows.
Perceived Value
Given that self-disclosure is a behavior, it is worthwhile to investigate the
relationship between perceived value and information disclosure because it is legitimate
to consider self-disclosure to be dependent on perceived value (Dodds et al., 1991;
Monroe & Krishnan, 1985). In this study, perceived value is explained in terms of the
perceived value of a loyalty program, not perceived value of information requested or
disclosed.
The conceptualization of perceived value has been discussed in terms of utilities:
what is received and what is given. Zeithaml (1988) defined perceived value as the
consumer’s overall assessment of the utility of a product based on perceptions of what is
received and what is given. What is received also refers to benefits associated with the
loyalty program and what is given refers to costs or sacrifices associated with the loyalty
program (Monroe & Krishnan, 1985; Ravald & Gronroos, 1996; Zeithaml, 1988).
Christopher (1982) examined value in terms of price a customer is willing to pay
for a product offering, and pointed out that willingness to pay needs to be understood in

22
terms of the set of perceived benefits that the product offering provides to a customer. He
related this aspect of value to the notion of a customer surplus, which he expressed as the
amount by which the monetary equivalent of the set of perceived benefits exceeds the
price paid for it. Similarly, Ravald and Gronroos (1996) suggested perceived value as a
ratio between benefits and costs.
The benefit components of perceived value include salient intrinsic and extrinsic
attributes, and other relevant abstractions such as convenience (Zeithaml, 1988). Since a
loyalty program rewards repeated patronage with relational benefits such as discount and
tailored service (Winer, 2001), the relational benefits associated with the loyalty program
are discussed in the following section.
The cost components of perceived value include monetary and nonmonetary costs
(Zeithaml, 1988). Monetary costs include the amount of money paid, installation, and
handling costs and nonmonetary costs include time, energy, and effort to obtain products
and service. In a loyalty program context, costs of a loyalty program include those
monetary and nonmonetary costs to obtain the desired benefits associated with the loyalty
program such as price (e.g. price to purchase a reward card), effort (e.g. presentation of a
card to a cashier, and personal information disclosure) and other resources.
What is received and what is given are highly idiosyncratic and situational
(Bowman & Ambrosini, 2000; Christopher, 1982; Ravald & Gronroos, 1996; Zeithaml,
1988). A $39 calculator can be coded as expensive for some consumers and cheap for
others; thus, the perceptions of the same price stimulus may vary across consumers and
for one consumer across products, purchase situations, and time (Dodds et al., 1991).
Also consumers weight the components of perceived benefits and costs differently

23
(Christopher, 1982; Sweeney & Soutar, 2001; Zeithaml, 1988). Some consumers may
want volume, others high quality, still others convenience. Similarly, some are concerned
only with the money expended, other with time and effort (Zeithaml, 1988).
For the purpose of this study, perceived value refers to a subjective assessment of
the trade-off between what is received and what is given (Christopher, 1982; Lynn, 1991;
Zeithaml, 1988) and, consequently, customers’ assessment of benefits and costs
associated with a loyalty program. The influence of perceived value on behavior or
behavioral intention was examined in previous research (Dodds et al., 1991; Monroe &
Krishnan, 1985). Monroe and Krishnan (1985) proposed a model relating perceived value
and its impact on willingness to buy. Similarly, Dodds, Monroe and Grewal (1991)
provided a model conceptualizing perceived value as a direct antecedent of consumer
purchase intention. However, little research has been found on the relationship between
perceived value and information disclosure as its consequence in a loyalty program
context. The following sections present economic and social benefits as perceived
benefits and discuss two existing theories regarding trade-offs between perceived value
of a loyalty program and an individual’s willingness to disclose information.
Economic Benefits and Social Benefits
What is received in the loyalty program context relates to benefits associated with
loyalty programs. Loyalty programs commonly reward customers for repeated purchases
and offer relational benefits (Gwinner, Gremler, & Bitner, 1998; Winer, 2001) and
relational benefits refer to benefits that customers receive from long-term relationships
besides the core service. Gwinner and his colleagues (1998) identified four relational
benefits, namely, social, psychological, economic, and customization benefits. Social

24
benefits describe a kind of fraternization in addition to the delivery of the core service.
Psychological benefits describe a comfort or feeling of security. Economic benefits relate
to economic consideration such as discounts, price break and time savings.
Customization benefits are tailored services to meet particular needs.
Lacey, Suh and Morgan (2007) used the term preferential treatment as relational
benefits and identified two types of preferential treatment: economic-based and
customization-based. Economic-based preferential treatment describes the monetary
value and/or time-savings benefits. Examples of this type of benefit are product/service
rewards, complimentary product and service upgrades, gift certificates and discounts.
Economic-based preferential treatment matches to economic benefits in the relational
benefits (Gwinner et al., 1998). Customization-based preferential treatment refers to
customers’ perceptions of personal recognition, extra attention, and specific services not
available to regular customers. Examples of this type of benefit include customized
products, access to new product shipments, members-only concierge service, advanced
sales notices, private tours, and members-only invitations to special events.
Customization-based preferential treatment is the mixture of social benefits and
customization benefits in Gwinner et al.’s research (1998).
Based on previous research on the relational benefits and preferential treatments
(Gwinner et al., 1998; Lacey et al., 2007), what is received in this study is proposed to the
combination of economic benefits and social benefits. Economic benefits in this study
refer to the benefits associated with monetary value and time-savings as economic
benefits in Gwinner et al.’s research (1998) and economic-based treatment in Lacy et
al.’s research (2007). Social benefits in this study refer to the benefits associated with a

25
kind of fraternization including personal recognition, extra attention and specific service
not available to non-loyalty program members as customization-based treatment in Lacy
et al.’s research (2007).
While perceived value refers to trade-off between perceived benefits and costs,
how trade-offs are balanced is discussed with exchange theory and social penetration
theory in the following section. A quid pro quo mentality and equilibrium are common in
both theories, but social penetration theory includes the forecasted value derived from
interaction.
Exchange Theory: Perceived Value and Information Disclosure
The exchange between a customer and a company is reciprocal in the loyalty
program context. That is, a customer reveals personal information to a company on the
basis of value perceived in return (Lacey & Sneath, 2006) and this exchange is explained
in exchange theory (Bagozzi, 1975; Houston & Gassenheimer, 1987). Bagozzi (1975)
postulated three types of exchange: restricted, generalized, and complex exchange.
Among the three types of exchange, restricted exchange describes a reciprocal exchange
between two parties whereas generalized and complex exchanges describe an exchange
among three or more parties (Bagozzi, 1975). Therefore, restricted exchange is relevant
in the loyalty program context where dyadic exchanges occur between a customer and a
company occur.
Restricted exchanges include two characteristics, namely, equality and a quid pro
quo mentality, or “something of value in exchange for something for value” (Bagozzi,
1975, p. 33). In a loyalty program context, information disclosed (something of value to
companies) can be exchanged with perceived value of a loyalty program (something of

26
value to customers) when differences in the assessment of the utility of the loyalty
program and of the information disclose are minimized. In Bagozzi’s research (1975), an
attempt to maintain equality was made in repeatable social exchange, and emotional
reaction was heightened when equality is breached. Also, there was an attempt to balance
the mutual reciprocal exchange. Based on exchange theory, the utility of perceived value
should be equal to that of information disclosed at the moment of exchange and the
exchange is repeated as long as equality of the exchanged entities (e.g. perceived value of
a loyalty program and information disclosed) is maintained.
Social Penetration Theory: Perceived Social Benefits and Information Disclosure
Social penetration theory proposes growth or deterioration of interpersonal
relationships based on the reward and cost balance. According to social penetration
theory, the advancement of the relationship is dependent on the amount and nature of the
rewards and costs. People assess the reward/cost balance of an ongoing or previous
interaction and also forecast or predict implications of future interaction at the same or
deeper layers of exchange (Altman & Taylor, 1973). That is, they extrapolate to future
contacts with the other person, including more personal interactions. Assuming such
predictions to be favorable, it is hypothesized that the pair then gradually moves to
successively more intimate levels of encounters, from superficial biographical features to
emotions and attitudes.
Social penetration theory states that relationships proceed from non-intimate to
intimate areas and the more time people spend with others, the more likely people are to
disclose intimate thought and details of their life (Altman & Taylor, 1973; Cozby, 1973).
Social penetration refers to “overt interpersonal behaviors which take place in social

27
interaction and internal subjective processes which precede, accompany, and follow overt
exchange” (Altman & Taylor, 1973, p. 5). Overt interpersonal behaviors can be described
in terms of depth and breadth. Depth of penetration indicates the layers of an individual’s
ideas, beliefs, feelings and emotions and breath of penetration indicates the numbers of
major topical areas or categories and the amount of interaction within a certain topical
area or category.
Social penetration theory proposes that social penetration is affected by personal
characteristics of participants, outcomes of exchanges, and the situational context.
Personal characteristics of participants describe biographical properties, personality
features and social need characteristics. Outcomes of exchange are reward or cost
properties obtained from a relationship. The situational context describes the situational
and psychological determinants that excel, force or prevent a reciprocal interaction.
Outcomes of exchange can be examined with respect to perceived value because
both relate to reward and cost properties. Social penetration theory presents the following
reward/cost properties: reward/cost ratios, absolute reward and cost properties,
immediately obtained rewards and costs, forecast rewards and costs, and cumulative
reward and costs. Rewards and costs in the theory are conceptualized with several
dimensions. Rewards include the pleasure, satisfaction and gratification that a person
enjoys while costs refers to any factors that operate to inhibit or deter a performance of a
sequence of behavior. Costs hold opposite conceptualizations to rewards.
Reward/cost ratio refers to the balance of positive and negative relationships in an
interpersonal relationship. The higher the ratio is, the more satisfying the relationship is
considered. While the ratios of two relationship events can be equal, they can be different

28
when the absolute magnitude of positive and negative experiences is considered. For
example, when rewards are worthy of ten dollars, the same value of costs, $10, is
required in order to achieve the ratio of one. When rewards change to two dollars, costs
need to change to two dollars to maintain the ratio of one. Comparing the former event to
the latter, the absolute value of the former is five times higher than the latter while their
ratios are equal to one. It implies that, in order to maintain the same level of relationships,
some relationships require more effort while others require less. However, the
relationships where more effort is required need to provide more pleasure, satisfaction,
and gratification than the relationships where less effort is required.
Immediately obtained rewards and costs refer to the set of rewards and costs that
accrue from relatively immediate interaction whereas forecast rewards and costs are
projections to future rewards and costs. Cumulative reward and costs encompass the
accumulation of rewards and costs throughout the history of interaction.
The conceptualization of reward/cost ratio in social penetration theory is the same
as that of perceived value because both concepts are assessed based on a comparison
between benefits – or rewards in social penetration theory – and costs. Rewards in social
penetration theory refer to a positive experience in interpersonal relationship and
examples of the positive experience include a positive exchange of objects, symbolic
signs, gratifications and goal accomplishment via a relationship. According to social
penetration theory, rewards will be higher when the satisfying relationship is forecasted
than when it is not. In other words, perceived value will be higher for those who forecast
satisfying relationships (Altman & Taylor, 1973; Cozby, 1973).

29
Customer Loyalty
Since the objective of CRM is to retain customers through establishing long-term
relationship, how can customer retention be determined? Customer retention can be
identified in terms of repeated purchases and attitudinal commitment to the brand or
company, or customer loyalty (Winer, 2001). Customer loyalty has been proposed to
consist of two dimensions, namely, behavior and attitude (Baloglu, 2002; Dick & Basu,
1994; Fitzgibbon & White, 2005; Yi & Jeon, 2003). Behavioral loyalty is defined as
repeated purchases of particular products or service while attitudinal loyalty is defined
when repeated purchases occur due to a customer’s attitudinal commitment to the brand
or company. That is, repeat patronage is the key element of loyalty, but loyalty can be
categorized based on what drives repeated purchase. Behavioral loyalty is also called
spurious loyalty (Dick & Basu, 1994) or program loyalty (Yi & Jeon, 2003) whereas
attitudinal loyalty is also called brand loyalty (Yi & Jeon, 2003).
Dick and Basu (1994) described loyalty in terms of relative attitude and repeat
patronage. Relative attitude was used under the consideration of valence. Attitude is an
association between an object and an evaluation and customers’ attitude varies among
situations. Consequently, “relative attitude” reflects situational attitude. Dick and Basu
(1994) postulated that loyalty is customers’ repeat patronage with the positive relative
attitude. Repeat patronage in a loyalty relationship is directly influenced by relative
attitude whereas external factors such as social norm and situational influence impact
patronage. Dick and Basu (1994) assumed that loyal customers should have positive
relative attitudes and show repeat patronage while the magnitude of attitude and repeat
patronage would vary among customers.

30
Dick and Basu (1994) segmented loyalty into four categories based on the degree
of relative attitude and repeat patronage: loyalty, spurious loyalty, latent loyalty and no
loyalty. Spurious loyalty describes the situation when customers show high repeat
patronage while they have a low positive relative attitude. The impact of the attitude on
repeat patronage is weak, but other environmental factors such as social norm and
situational influence have a strong impact. Latent loyalty describes a high relative attitude
and low repeat patronage while environmental factors have the same strong impact on
repeat patronage as spurious loyalty. The magnitude of the environmental factors to the
loyalty relationship is high in both loyalty conditions, but the direction is opposite. The
environmental factors force repeated purchases in the spurious loyalty condition, and
prevent repeat purchases in the latent loyalty condition regardless of relative attitude. The
loyalty condition, or true loyalty (Oliver, 1997), is the most preferred condition with high
relative attitude and high repeat patronage. While the environmental factors are
influential, it is comparably hard to control them. When only internal factors are
considered, loyalty can be explained in the relationship between attitude (relative
attitude) and behavior (repeat patronage).
Oliver (1997) postulated that cognitive loyalty is initiated by the offers that
companies provide. He (1997) postulated that loyalty is developed sequentially from
cognitive to affective to conative loyalty while Dick and Basu’s research (1994)
examined cognitive, affective and conative elements as independent antecedents of
loyalty. Affective loyalty is developed from cognitive loyalty with the addition of
satisfaction. If the service/product is satisfactory, affective loyalty is developed from
cognitive loyalty. However, affective elements do not guarantee “true loyalty” because

31
satisfaction itself is not sufficient to lead to the behavioral aspect (e.g. purchase intention
or repeated purchase). Conation implies an intention or commitment to behave (Oliver,
1997) and conative loyalty is developed from affective loyalty when commitment to the
brand and to purchase plays a role.
It is worthwhile to note that behavior or behavioral intention is centered in the
conceptualization of loyalty in the previous research (Dick & Basu, 1994; Oliver, 1997).
However, repeated purchases do not necessarily represent psychological and attitudinal
preference and commitment towards the brand or company. Morgan and Hunt (1994)
define commitment as “an exchange partner believing that an ongoing relationship with
another is so important as to warrant maximum efforts at maintaining it; that is, the
committed party believes the relationship is worth working on to ensure that it endures
indefinitely” (p. 23). Behaviorally loyal customers are swayed when better alternatives
are available (Shankar, Smith, & Rangaswamy, 2003) while attitudinally loyal customers
repurchase despite situational influences and marketing efforts (Dick & Basu, 1994; Yi &
Jeon, 2003). True loyalty is posited as the balance between behavioral loyalty (e.g.
repeated patronage) and attitudinal, or affective, loyalty (e.g. favorability) in the sense of
higher magnitude (Dabholkar, 1996; Lee-Kelley, Gilbert, & Mannicom, 2003).
Customer loyalty in this study refers to behavioral intent (e.g. intent to repurchase
or revisit) and relative attitude (e.g. commitment to continuing the relationship with the
company) toward the company. With relation to perceived value, customer loyalty can be
examined as a behavioral and attitudinal response to perceived value of a loyalty
program. Repeated patronage is expected when the balance between benefits (e.g.

32
benefits associated with the loyalty program) and costs (e.g. purchase a meal) exists
according to exchange theory.
Conceptual Model
Overview
Compared to previous research examining information disclosure in relation to
information attributes and cue attributes (Cranor et al., 1999; Culnan & Armstrong, 1999;
Hoffman et al., 1999; Milne & Boza, 1999; Miyazaki & Fernandez, 2001; Phelps et al.,
2000), this study focuses on information disclosure in relation to perceived control,
privacy concern and perceived value as shown in Figure 3.
The construction of a customer database is a necessary first step to a complete
CRM solution and the foundation for any customer relationship management activity
(Berry, 1983; Winer, 2001). Relationships with customers are maintained through various
relationship programs. A loyalty program as a part of a relationship program offers
rewards and benefits to members, and customers join by providing personal information
in return. While the objective of the companies that have a loyalty program is customer
retention, little research was found on factors influencing customers’ decision to disclose
personal information in the loyalty program context. This study examines the roles of
privacy concern, perceived control and perceived value in information disclosure and
customer loyalty.

33
Figure 3. Conceptual model of information disclosure and its relationship with
information sensitivity, privacy concern, perceived value, perceived control and customer
loyalty.
Note. Parallelograms indicate control variables.
The scope of this study is the situation where a customer is requested to disclose
personal information while the customer is deciding whether to join a loyalty program.
Given the scope of this study, the focal company has not established a customer database
and is about to initiate the CRM model by collecting disclosure-based information from
customers. Disclosure-based data, by definition, are collected based on customers’ self-
disclosure and a literature review of research on self-disclosure follows. The model
presented in this study is proposed under the consideration of the first-time customer. The
first-time customer describes a customer who has never used the service or product of the
focal company providing a loyalty program and is deciding whether to participate in the
loyalty program. In this study, the first-time customers are exposed under a situation

34
where they are requested to disclose information as a process to become a member of the
loyalty program.
Hypotheses
Information sensitivity and privacy concern.
Privacy concern refers to the level of consumer anxiety for the way their
information is used by firms with respect of confidentiality and maintenance of privacy
(Martínez-López et al., 2005; Phelps et al., 2001). Research on privacy concern has
examined a positive relationship between the types of information requested and privacy
concern (Culnan, 1993; Norberg & Dholakia, 2004). While the types of information
requested were examined as the independent variables in the previous study (Phelps et
al., 2000), they do not fully explain a situational influence (Cranor et al., 1999; Horne et
al., 2007; Phelps et al., 2000). For example, a telephone number and social security
number can be categorized as a type of information to identify a customer (e.g. a personal
identification number), customers’ worry for the way that the information is used by
companies will vary. Therefore, another categorization of information and its influence
on privacy concern are worthy of investigation.
In this study, information sensitivity is proposed as an alternative way to
categorize information. While information sensitivity was differentiated from information
intimacy in some research (Norberg & Dholakia, 2004; Omarzu, 2000), sensitivity and
intimacy have been used interchangeably in other research (Moon, 2000; Phelps et al.,
2000). In previous research where information sensitivity was differentiated from
intimacy, the distinction was made based on emotion intensity versus monetary value, or
intrinsic risk versus extrinsic risk. That is, information intimacy was explained by

35
emotional intensity whereas information sensitivity was explained by monetary value
(Norberg & Dholakia, 2004; Omarzu, 2000). However, the distinction based on emotion
intensity and monetary value does not seem to be mutually exclusive. Since monetary
gain and loss triggers emotions, information characteristics can be described not with
either intimacy or sensitivity, but with both information intimacy and sensitivity. In order
to reconcile the ambiguity, information sensitivity, for the purpose of this study, refers to
comprehensive information characteristics that amalgamate emotion intensity and
monetary value and reflects situational influence. Given that information sensitivity
amalgamates both emotional intensity and monetary value, it is proposed that privacy
concern can be explained with a level of sensitivity (Norberg & Dholakia, 2004).
Therefore, the proposed hypothesis is:
H1: Information privacy concern is greater when high sensitive information is
requested than when low sensitive information is requested.
Information edit function, perceived control and privacy concern.
While information, choice, and predictability are the antecedents of control,
which have potential to influence experience and perceptions of control, increases in
information, choice, or predictability do not always lead to more perceived control
(Skinner, 1996). Thus, it needs to be examined empirically whether and under what
conditions information, choice, or predictability is likely to change perceived control
(Skinner, 1996).

36
In e-commerce, customers are provided with two choices as a way to reduce
privacy concern: opt-in and opt-out (Winer, 2001). In the opt-in case, customers must
consent to the collection and use of personal data while customers have to explicitly
forbid the collection and use in the opt-out case. While the opt-in option reduces privacy
concern because it gives customers more control over their personal information,
customers bear the loss of control in opt-out option (Winer, 2001). Thus, perceived
control varies between two options available.
In this study, an information edit function is proposed to have a similar role to the
opt-in option in privacy concern; it provides more perceived control. An information edit
function refers to an option to edit, hide, show and view personal information available
from a loyalty program. The availability of an information edit function is proposed to
help customers to decease their privacy concern with more control over companies’ use
of their personal information. The discussions about the role of perceived control in
privacy concern reduction and conceptualization of perceived control follow.
When personal information is requested by the company, the stress level
associated with privacy concern is increased (Milberg, Smith, & Burke, 2000). Perceived
control has a stress-reducing effect (Averill, 1973) and seeking for control is natural to
aversive events (Lefcourt, 1973). Perceived control consists of three domains, namely,
behavioral control, cognitive control, and decisional control (Averill, 1973). Although
cognitive control was postulated to play a lesser role in a service context than behavioral
and decisional controls (Namasivayam, 2004), it is proposed that behavioral control plays
a lesser role than cognitive and decisional control in the loyalty program context.

37
Given that behavioral control refers to the direct control over the actions of the
service provider (Namasivayam, 2004), behavioral control plays a greater role in a
service context since customers can directly influence the actions of the service provider
and request the components that they want to include. However, in most loyalty program
cases, the request of information disclosure (e.g. types and amount of information) is
fixed and customers cannot alter or modify the way in which questions are asked as they
can in the service exchange context. The only options available to customers are either
disclosure or non-disclosure of information requested. Due to the lack of direct control
over the actions of the service provider, behavioral control plays a lesser role than
cognitive and decisional controls in the information disclosure context. Therefore,
cognitive and decision controls, rather than behavioral control, need to be examined in
the loyalty program context.
Cognitive control plays a role in the information disclosure situation as follows.
Although the level of sensitivity of the information requested may vary, it is a stressful
event to customers when they decide to disclose personal information (Milberg et al.,
1995; Milberg et al., 2000). In this study, the stressful event is the restaurant’s request
for personal information. Consequently, customers have to impose meanings on the
aversive and stressful event. Cognitive control includes information gain and appraisal.
While information gain is the objective evaluation of threat, appraisal is the subjective
evaluation to conform to the needs and desires of the evaluator (Averill, 1973). In this
stressful situation, customers may seek cues to help them prepare for the impending
threat – it describes information gain in cognitive control. The cue in a loyalty program
can be present in various ways such as a policy statement about information handling,

38
opt-in and opt-out options, and so forth. When the cues for the impending threat are
present in the loyalty program, customers can appraise the current information request as
a less threatening event – it describes appraisal in cognitive control.
Decisional control refers to the opportunity to choose among various courses of
action. When various options are available to avoid or reduce the stressful event,
customers will perceive more decisional control than when no or fewer options are
available. While the choice available has been postulated to have a positive relationship
with stress reduction, too many choices may result in stress increase (Averill, 1973).
Thus, perceived control is proposed to play a significant role in privacy concern
reduction. Therefore, the following hypotheses are proposed:
H2a: Perceived cognitive control is greater when an information edit function is present
than when an information edit function is absent.
H2b: Perceived decisional control is greater when an information edit function is
present than when an information edit function is absent.
H2c: Perceived cognitive control has a negative relationship with information privacy
concern.
H2d: Perceived decisional control has a negative relationship with information privacy
concern.

39
Privacy concern and perceived value.
Based on previous research (Christopher, 1982; Lynn, 1991; Zeithaml, 1988),
perceived value, for the purpose of this study, refers to a subjective assessment of the
trade-off between benefits and costs associated with a loyalty program and is used in a
marketing context meaning values or utilities that consumers perceive (Monroe &
Krishnan, 1985; Ravald & Gronroos, 1996; Zeithaml, 1988).
The benefit components of perceived value include salient intrinsic and extrinsic
attributes, and other relevant abstractions such as convenience (Zeithaml, 1988) and the
benefits in a loyalty program context are rewards and benefits associated with a loyalty
program. Loyalty programs commonly reward customers for repeated purchases and
offer relational benefits (Gwinner et al., 1998; Winer, 2001). The cost components of
perceived value include monetary and nonmonetary costs (Zeithaml, 1988). Monetary
costs include the amount of money paid, installation, and handling costs and
nonmonetary costs include time, search costs, the risk of a product failure, fear of late or
inaccurate delivery and other factors (Christopher, 1982; Zeithaml, 1988). Since privacy
concern relates to worry and fear (Martínez-López et al., 2005; Phelps et al., 2001),
privacy concern is proposed to be a perceived cost.
Perceived value increases when perceived benefits increase, perceived costs
decrease or both events simultaneously occur. If privacy concern of a loyalty program
can be considered a perceived cost associated with a loyalty program, it will influence
perceived value in a negative way. Therefore, the proposed hypothesis is:

40
H3: Information privacy concern has a negative relationship with perceived value of a
loyalty program.
Privacy concern, information sensitivity and willingness to disclose.
Privacy concern in previous research was examined to have a negative influence
on behavioral responses (Liu et al., 2004; Miyazaki & Fernandez, 2001; Phelps et al.,
2000; Phelps et al., 2001). While behavioral responses in previous research examined
include actual purchase, purchase intention, and/or request to remove personal
information from companies’ database (Liu et al., 2004; Miyazaki & Fernandez, 2001;
Phelps et al., 2000; Phelps et al., 2001), little research was found on information
disclosure or intent to disclose as a behavioral response (Nam et al., 2005). Given that
self-disclosure is a behavior (Hartnack, 1968; Norberg & Dholakia, 2004), it is
worthwhile to investigate self-disclosure as a behavioral response to privacy concern.
Therefore, privacy concern may have a negative association with information disclosure,
specifically with willingness to disclose. The following hypothesis is proposed:
H4a: Information privacy concern has a negative relationship with willingness to
disclose information.
Also, the sensitivity level of information requested is proposed to influence
willingness to disclose information. While researchers have suggested that it is necessary
to include an information type factor in personal information disclosure in marketing
settings (Moon, 2000; Norberg & Dholakia, 2004), the type of information was criticized

41
not for reflecting situational influence (Annacker et al., 2001; Chaikin & Derlega, 1974).
Therefore, information sensitivity is proposed to be an alternative to the types of
information and the sensitivity level of information is proposed to influence willingness
to disclose in a negative way (Cozby, 1973; Omarzu, 2000).
Based on Hypotheses 1 and 4a, a higher level of information sensitivity is
proposed to be related to higher privacy concern, and an increment in privacy concern is
proposed to influence a decrement in willingness to disclose. The increment in privacy
concern describes the situation where people become worried more about information
privacy while a decrement in willingness to disclose describes the situation where people
become less willing to disclose information. Therefore, a higher level of information
sensitivity is proposed to be related to less willingness to disclose information and a
lower level of information sensitivity to be related to more willingness. Thus, the
following hypothesis is proposed:
H4b: Willingness to disclose information is greater when low sensitive information is
requested than when high sensitive information is requested.
Perceived control, information edit function and willingness to disclose.
The relationship between perceived control and behavior was introduced in the
theory of planned behavior, which was developed from the theory of reasoned action
(Ajzen, 1991). The theory of planned behavior proposed that human behavioral
achievement is predicted by the combination of motivation (intention) and ability
(perceived control over behavior). In addition, perceived control was examined to have

42
positive influence on behavior or a behavioral intent empirically (Hui & Bateson, 1991;
Povey et al., 2000). Given that self-disclosure is a behavior (Hartnack, 1968; Norberg &
Dholakia, 2004), its behavioral intent – willingness to disclose – can be examined as the
extension of research on perceived control and a behavioral intent. Thus, it is suggested
that an increment in perceived control results in an increment in willingness to disclose
information. Therefore, the following hypothesis is proposed:
H5a: Perceived cognitive control has a positive relationship with willingness to disclose
information.
H5b: Perceived decisional control has a positive relationship with willingness to
disclose information.
Based on Hypotheses 2a, 2b, and 5a, it is proposed that the presence of an
information edit function is related to greater perceived control and perceived control is
positively related to customers’ willingness to disclose information. Therefore, the
following hypothesis is proposed:
H5c: Willingness to disclose information is greater when an information edit function
is present than when an information edit function is absent.

43
Perceived value and willingness to disclose.
Similar to previous research on perceived control and a behavioral intent, little
was found on willingness to disclose information as a behavioral intent in research on
perceived value (Franzak, Pitta, & Fritsche, 2001). Previous research examined the
relationship between perceived value and purchase intent (Dodds et al., 1991; Monroe &
Krishnan, 1985). Given that willingness to disclose information is a behavioral intent, the
relationship between perceived value of a loyalty program and willingness to disclose can
be examined in a similar way as in previous studies.
The exchange between customers and companies is reciprocal in the loyalty
program context. That is, customers provide personal information to companies and the
companies provide economic and/or social benefits in return (Lacey & Sneath, 2006).
The reciprocal exchange relationship is explained in exchange theory. Based on Bagozzi,
restricted exchange describes the reciprocal exchange between a giver and a receiver and
restricted exchanges include two characteristics, namely, equality and a quid pro quo
mentality, or “something of value in exchange for something for value” (Bagozzi, 1975,
p. 33). He suggested an attempt to maintain equality is made in repeatable social
exchange and emotional reaction is heightened when equality is breached. In the case of
the information and benefits exchange, information disclosed should be equitable to
perceived value of the benefits associated with the loyalty program. An increment in
perceived value is expected to have an increment in information disclosed in order for
equality to be maintained. Therefore, the following hypothesis is proposed:
44
H6: Perceived value of a loyalty program has a positive relationship with willingness
to disclose information.
While the positive relationship between perceived value of a loyalty program and
willingness to disclose information can be explained by exchange theory, the positive
relationship may also be explained by social penetration theory. Based on social
penetration theory, the advancement of an interpersonal relationship is dependent on the
nature of the rewards and costs. That is, when current or future interactions are predicted
to be favorable, it is hypothesized that the pair then gradually moves to successively more
intimate levels of encounters, from superficial biographical features to emotions and
attitudes.
The prediction of interaction is made based on the comparison between the
rewards and costs. Rewards in social penetration theory refers to positive experiences in
an interpersonal relationship such as pleasure, satisfaction, and gratifications and hold a
similar conceptualization of social benefits in a loyalty program, which refers to the
benefits associated with a kind of fraternization. Costs hold the opposite
conceptualization to rewards. The higher the ratio of rewards to costs, the more satisfying
the relationship is considered. To the extent that repeated assessment of past interactions
and predictions of the future are favorable, the relationship will proceed further (Altman
& Taylor, 1973). It implies gradual increments in depth and breath of penetration; people
disclose more intimate thought and personal details to the extent that the ratio of rewards
to costs is assessed to be favorable.

45
Given that this study is proposed under the consideration of the first-time
customer who has never used the service or product at the focal company, future rewards
of the relationship, rather than immediately obtained rewards, are relevant to the scope of
the study. The first-time customer needs to assess future rewards due to no experience of
immediate and cumulated rewards. Therefore, it can be proposed that the first-time
customer will assess outcome of exchange between information requested to disclose and
forecasted benefits of the relationship. Consequently, those who assess future benefits
favorably will show different behavioral responses than those who do not. Therefore,
those who perceived more value of a loyalty program are more willing to disclose than ,
when those who perceived less value.
Perceived value and customer loyalty.
Loyalty has been proposed to consist of two dimensions, namely, behavior and
attitude (Dick & Basu, 1994; Yi & Jeon, 2003). Behavioral loyalty is defined as repeated
purchases of particular products or service while attitudinal loyalty is defined when
repeated purchases occur due to a customer’s attitudinal commitment to the brand or
company (Baloglu, 2002; Fitzgibbon & White, 2005). That is, repeat patronage is the key
element of loyalty, but loyalty can be categorized based on what drives repeated
purchase. However, customer loyalty in this study refers to behavioral intent (e.g. intent
to repurchase or revisit) and relative attitude (e.g. commitment to continuing the
relationship with the company) toward the company, rather than actual repeated
patronage.
46
Given that customer loyalty can be expressed in terms of repeated exchange – or
intent to repeated patronage – and affective commitment, the influence of perceived value
of a loyalty program on customer loyalty can be explained with exchange and social
penetration theories. According to exchange theory, repeated exchange is expected as
long as equality and a quid pro quo mentality, or “something of value in exchange for
something for value” is maintained (Bagozzi, 1975; Houston & Gassenheimer, 1987).
Customers will patronize a restaurant as long as customers know that they will receive
something of value in return. Therefore, customers’ assessment of benefits and costs
associated with a loyalty program can explain customer loyalty and customers who
perceive a loyalty program to be valuable will show customer loyalty (e.g. intent to
revisit or commitment to continuing the relationship). In addition, previous research
examined positive relationships between perceived value of a loyalty program and
behavioral loyalty and between benefits associated with a loyalty program and customer
loyalty (Bowen & Shoemaker, 2003; Yi & Jeon, 2003).
According to social penetration theory, the decision of future interaction is made
based on the reward/cost ratio; if the assessment is favorable (e.g. rewards is greater than
costs), future interaction will take place (Altman & Taylor, 1973). If the assessment is
uncertain, the interaction will slow down. With an unfavorable decision, the relationship
will terminate. Thus, a positive relationship between rewards and the advancement of
interaction is proposed. Therefore, the following hypothesis is proposed:
H7: Perceived value of a loyalty program has a positive relationship with customer
loyalty.

47
Willingness to disclose and customer loyalty.
The positive relationships of perceived value of a loyalty program with
willingness to disclose information and with customer loyalty are proposed in
Hypotheses 6 and 7. While the relationship between willingness to disclose and customer
loyalty can be examined with respect to perceived value of a loyalty program, little
research was found on willingness to disclose as a predictor of customer loyalty.
Willingness to disclose information and customer loyalty may be recursive, but
given the scope of this study, it is reasonable to assume that information disclosure
occurs prior to customer loyalty. That is, the scope of this study is for the first-time
customers who have not used the service or product of the focal company and
consequently, no or little loyalty has been established. Thus, willingness to disclose
information is a precedent of customer loyalty in this study and the following hypothesis
is proposed:
H8: Willingness to disclose information has a positive relationship with customer
loyalty.

48
Summary of Hypotheses
Figure 4. Summary of conceptual model of information disclosure and its relationship
with information sensitivity, privacy concern, perceived value, perceived control and
customer loyalty.
Note. Parallelograms indicate control variables.
H1: Information privacy concern is greater when high sensitive information is
requested than when low sensitive information is requested.
H2a: Perceived cognitive control is greater when an information edit function is
present than when an information edit function is absent.
H2b: Perceived decisional control is greater when an information edit function
is present than when an information edit function is absent.

49
H2c: Perceived cognitive control has a negative relationship with information
privacy concern.
H2d: Perceived decisional control has a negative relationship with information
privacy concern.
H3: Information privacy concern has a negative relationship with perceived
value of a loyalty program.
H4a: Information privacy concern has a negative relationship with willingness
to disclose information.
H4b: Willingness to disclose information is greater when low sensitive
information is requested than when high sensitive information is requested.
H5a: Perceived cognitive control has a positive relationship with willingness to
disclose information.
H5b: Perceived decisional control has a positive relationship with willingness to
disclose information.
H5c: Willingness to disclose information is greater when an information edit
function is present than when an information edit function is absent.
H6: Perceived value of a loyalty program has a positive relationship with
willingness to disclose information.
H7: Perceived value of a loyalty program has a positive relationship with
customer loyalty.
H8: Willingness to disclose information has a positive relationship with
customer loyalty.

50
CHAPTER 3
METHODOLOGY
This chapter discusses the methods used to examine the hypotheses proposed in
the previous chapter. A pilot test was conducted to develop and validate measurement
items and the main study was conducted to test the hypotheses. This chapter details the
definitions and variables of interest, the experimental design, measurement items, the
participants, experiment stimuli and procedures for the data collection. Then, the
analytical methods used to investigate the research hypotheses are discussed.
Pilot Test
The main purpose of the pilot test was 1) to determine the sensitivity level of
information items and 2) to define the underlying structure among the variables in the
analysis. In this section, the development of measurement items and the scenario are
discussed, followed by the procedures of the data collection, and the results of the pilot
test.
Development of Measurement Items
Identification of the level of information sensitivity.
Information sensitivity refers to comprehensive information characteristics that
amalgamate emotion intensity and monetary value. From previous studies, 29 items were
adapted with addition of the items date of birth, diabetes (i.e. presence) , marital status,

51
ethnicity and allergies (i.e. types and/or presence) as shown in Table 1 (Cranor, Reagle,
& Ackerman, 1999; Horne, Norberg, & Ekin, 2007; Norberg & Dholakia, 2004; Phelps,
Nowak, & Ferrell, 2000). The sensitivity of the items were measured by asking how
sensitive each item would be when it is asked in the membership application using a
seven-point Likert scale (1 = not sensitive at all, 7 = very sensitive). No identification of
the categorization was provided in the pilot study.
Table 1. Lists of information items and their categories in previous research.
Categories Information items Research
Demographic Marital status Phelps (2000)
Last grade of school completed Phelps (2000)
Occupation Phelps (2000)
Age Phelps (2000)
Name Cranor (1999)
Email address Cranor (1999)

52
Table 1 (continued). Lists of information items and their categories in previous research.
Categories Information items Research
Lifestyle Favorite hobbies Phelps (2000)
Favorite magazine Phelps (2000)
Favorite TV programs Phelps (2000)/ Cranor
(1999)
Favorite leisure activities Phelps (2000)
Smoke preference Horne (2007)
Alcohol consumption Horne (2007)
Favorite snack Cranor (1999)
Purchase-related Hotels/restaurant patronized most
often
Phelps (2000)
Most recent purchases Phelps (2000)
Preferred payment methods Phelps (2000)
Personal identifiers Telephone number Phelps (2000)/ Cranor
(1999)
Social security number Phelps (2000)
Preferred credit cards owned Phelps (2000)

53
Table 1 (continued). Lists of information items and their categories in previous research.
Categories Information items Research
Financial Annual income Phelps (2000)
Weekly money spent on
entertainment
Horne (2007)
Credit card number Cranor (1999)
Income Cranor (1999)
Medical Medications Norberg (2004)
Religion Religion Cranor (1999)
Additional items Date of birth Adapted from Cranor (1999)
Diabetes Adapted from Norberg
(2004)
Ethnicity Adpated from Cranor (1999)
Allergies Adapted from Norberg
(2004)
Development of a scenario.
A scenario was used because the advantages of using scenarios include
elimination of the difficulties associated with observation such as the time and expense
involved (Bateson & Hui, 1992; Smith, Bolton, & Wagner, 1999). In the scenario,
Riley’s Restaurant was described to be casual for lunch and upscale for dinner, featuring
American dishes with wine and beer. The loyalty program in the scenario was described

54
as a reward program with various member-exclusive benefits including recognition,
quicker service, discounts, redeemable points and other economic and social benefits. A
personal information policy stating how Riley’s Restaurant handles personal information
collected through the loyalty member registration was presented in the scenario. Also, a
written statement described how participants could view, edit, show or hide their
information after their account was created. The scenario was utilized after review from a
hospitality marketing professor.
Development of the measurement items for perceived control.
In the pilot test, two components of perceived control were measured, namely,
cognitive and decisional controls. Cognitive control is obtained by processing potentially
threatening information in a way to reduce stress and decisional control refers to the
range of choice or number of options available and involves choices prior to information
disclosure. Cognitive control was operationalized based on Faranda’s study (2001) and
measured using a seven-point Likert scale (1 = strongly disagree, 7 = strongly agree) as
shown in Table 2. The items of decisional control were adapted from the previous works
(de Rijk, Le Blanc, Schaufeli, & de Jonge, 1998; Mathwick & Rigdon, 2004) (see Table
3) and measured using a seven-point Likert scale (1 = strongly disagree, 7 = strongly
agree).

55
Table 2. Measurement items for cognitive control, adapted from Faranda’s study (2001).
Scale (1 = strongly disagree, 7 = strongly agree)
COGCTRL 1. There are parallels between this option and other options to add, edit,
delete, show and hide my personal information that I have experienced.
COGCTRL 2. The option that the loyalty program offers to view, edit, show and hide my
personal information is similar to others with which I am familiar.
COGCTRL 3. I am capable of using the option that the loyalty program offers to add,
edit, delete, show and hide my personal information.
COGCTRL 4. I have used other options that are fundamentally the same as this option.
Table 3. Measurement items for decisional control, adapted from previous research (de
Rijk et al., 1998; Mathwick & Rigdon, 2004).
Scale (1 = strongly disagree, 7 = strongly agree)
DECCTRL 1. This loyalty program offers many choices to add, edit, delete, show and
hide my personal information.
DECCTRL 2. This loyalty program allows me to add, edit, delete, show and hide my
personal information whenever it is necessary.
DECCTRL 3. I can select the method to add, edit, delete, show and hide my personal
information.
DECCTRL 4. I have very little freedom to add, edit, delete, show and hide my personal
information.

56
Development of the measurement items for perceived value.
Perceived value refers to some form of trade-off between benefits and costs
associated with a loyalty program (Christopher, 1982; Lynn, 1991; Zeithaml, 1988). The
benefit components of perceived value include salient intrinsic and extrinsic attributes,
and other relevant abstractions such as discount, tailored service and other rewards. The
cost components of perceived value include monetary and nonmonetary costs such as
price (e.g. price to purchase a reward card), effort (e.g. presentation of a card to a cashier,
and personal information disclosure) and other resources. Three measurement items,
adapted from previous research (Gwinner, Gremler, & Bitner, 1998; Lacey, 2007), were
used to measure perceived value of the loyalty program as shown in Table 4.
In the scenario, the importance of perceived benefits was measured regarding two
types of member-exclusive benefits: economic and social benefits as shown in Table 5.
The importance of perceived benefits was measured by asking how important the benefits
would be while no identification of the categorization was provided. The same number of
measurement items was listed for both benefits in order to control a confound effect. A
confound is defined as “an extraneous variable that covaries with the variable of interest”
(Shadish, Cook, & Campbell, 2002, p. 506). The confound effect anticipated in this case
was that the difference of value perception may result from the different number of
benefits (an extraneous variable), not from the different characteristics of benefits (the
variable of interest).

57
Table 4. Measurement items for perceived value, adapted from previous research
(Gwinner et al., 1998; Lacey, 2007).
Scale (1: strongly disagree, 7: strongly agree)
PERCVAL 1. The loyalty program of Riley’s restaurant is valuable to me.
PERCVAL 2. I look forward to participating in the loyalty program of Riley’s restaurant.
PERCVAL 3. What I get from the loyalty program of Riley’s restaurant makes it a great
value.
Table 5. List of the benefits offered in the scenario and the scale to measure the
importance of the benefits, adapted from previous research (Gwinner et al., 1998; Lacey,
2007).
Categories Scale (1 = not important at all, 7 = very important)
Economic benefits ECONBENF 1. Having quicker service
ECONBENF 2. Better prices / discount
ECONBENF 3. Time saving
ECONBENF 4. Redeemable reward points
Social benefits SOCBENF 1. The company’s anticipation of my service and menu
needs
SOCBENF 2. Recognition from the company (e.g. addressing me
by name)
SOCBENF 3. Special attention
SOCBENF 4. Long-term relationship with the company

58
Development of the measurement items for customer loyalty.
Customer loyalty has been proposed to consist of two dimensions, namely,
behavior and attitude (Baloglu, 2002; Dick & Basu, 1994; Fitzgibbon & White, 2005; Yi
& Jeon, 2003). Behavioral loyalty is defined as repeated purchases of particular products
or service while attitudinal loyalty is defined when repeated purchases occur due to a
customer’s attitudinal commitment to the brand or company. However, customer loyalty
in this study refers to behavioral intent (e.g. intent to purchase or visit) and relative
attitude (e.g. commitment to continuing the relationship with the company) toward the
company.
The measurement items for customer loyalty were adapted from previous research
(Lacey, 2007; Mattila, 2006; Yi & Jeon, 2003) as shown in Table 6. Customer loyalty
was measured with the two dimensions, behavioral intent and relative attitude.
Table 6. Measurement items for customer loyalty, adapted from previous research
(Lacey, 2007; Mattila, 2006; Yi & Jeon, 2003).
Categories Scale (1 = strongly disagree, 7 = strongly agree)
Behavioral intent BEHLOY 1. I would like to patronize this company more so than other
companies.
BEHLOY 2. I would recommend the proposed loyalty program to others.
BEHLOY 3. I like the proposed loyalty program more so than other
programs.
BEHLOY 4. I would encourage friends and relatives to do business with
this company.

59
Table 6 (continued). Measurement items for customer loyalty, adapted from previous
research (Lacey, 2007; Mattila, 2006; Yi & Jeon, 2003).
Categories Scale (1 = strongly disagree, 7 = strongly agree)
Behavioral intent BEHLOY 5. I have a strong preference for the proposed loyalty program.
BEHLOY 6. I would consider this company my first choice.
BEHLOY 7. I would say positive things about this company to other
people.
Relative attitude ATTDLOY 1. My relationship with this company is/will be worth my
effort to maintain.
ATTDLOY 2. My relationship with this company is/will be very
important to me.
ATTDLOY 3. My relationship with this company is/will be something
that I really care about.
ATTDLOY 4. My relationship with this company is/will be strong (e.g. I
am very committed to continuing it).
Participants and Procedures for the Data Collection
Participants for the pilot test were recruited from the listserv of a consumer taste
panel in a hospitality management program of a major northeastern US university after
permission from the Office for Research Protections (ORP) was obtained. An email
requesting voluntary participation was sent along with a link to the online survey.
Participants could begin the online survey by either clicking the link or copying and
pasting the link into the address bar in an Internet browser.

60
Before beginning the online survey, they were informed that they could not
resume the survey once they closed the Internet browser. Participants were asked to
complete the survey after reading a scenario about a loyalty program for a hypothetical
national restaurant chain named Riley’s Restaurant (see Appendix B). A scenario was
used because the advantages of using scenarios include elimination of the difficulties
associated with observation such as the time and expense involved (Bateson & Hui, 1992;
Smith et al., 1999).
The online survey was hosted in a commercial web service provider, Mutual
Gravity, which offers professional online survey instrument tools. The survey was open
from March 19, 2008 to March 25, 2008, and no reminder email was sent.
Results
Of 337 invitation emails, 86 participants completed the survey for a response rate
of 25.52%. From the server where the online survey resided, 46 incomplete responses
were found. The results of the sensitivity level identification of the information items are
discussed, followed by the underlying structure among and the reliability of the
measurement items assessed in the pilot study including cognitive and decisional
controls, perceived value, economic and social benefits, and customer loyalty.
Level of information sensitivity.
The items were assessed using a seven-point Likert scale (1 = not sensitive at all,
7 = very sensitive). First, the mean and standard deviation of each item was computed as
shown in Table 7. Although social security number was rated most sensitive, social
security number was excluded from the study because it is unrealistic to ask restaurant
customers for their social security number. Instead of two separate items (i.e. credit card
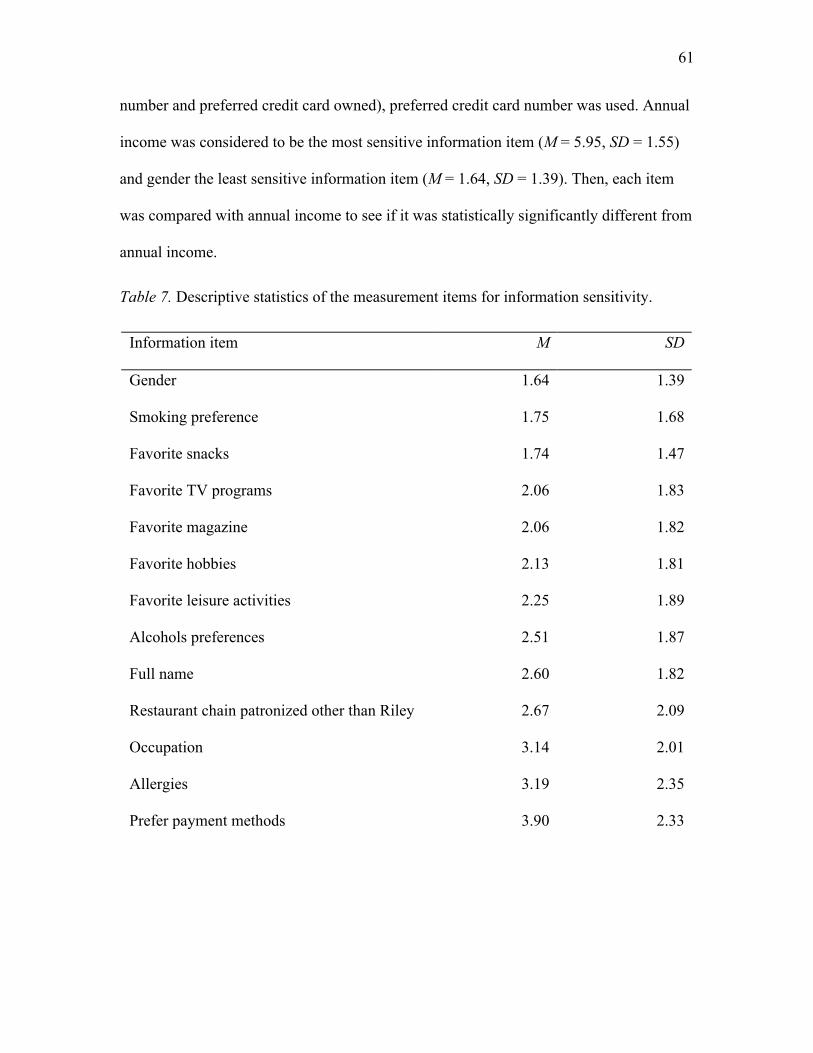
61
number and preferred credit card owned), preferred credit card number was used. Annual
income was considered to be the most sensitive information item (M = 5.95, SD = 1.55)
and gender the least sensitive information item (M = 1.64, SD = 1.39). Then, each item
was compared with annual income to see if it was statistically significantly different from
annual income.
Table 7. Descriptive statistics of the measurement items for information sensitivity.
Information item M SD
Gender 1.64 1.39
Smoking preference 1.75 1.68
Favorite snacks 1.74 1.47
Favorite TV programs 2.06 1.83
Favorite magazine 2.06 1.82
Favorite hobbies 2.13 1.81
Favorite leisure activities 2.25 1.89
Alcohols preferences 2.51 1.87
Full name 2.60 1.82
Restaurant chain patronized other than Riley 2.67 2.09
Occupation 3.14 2.01
Allergies 3.19 2.35
Prefer payment methods 3.90 2.33

62
Table 7 (continued). Descriptive statistics of the measurement items for information
sensitivity.
Information item M SD
Ethnicity 3.49 2.36
Age 3.50 2.20
Marital status 3.63 2.52
Email address 3.87 2.24
Prefer payment methods 3.90 2.33
Last grade of school complete 4.00 2.37
Date of birth 4.15 2.23
Most recent purchases 4.15 2.20
Weekly money spent on entertainment 4.30 2.17
Diabetes and other chronic diseases 4.63 2.26
Religion 4.81 2.42
Preferred credit card owned 5.10 2.03
Medication 5.21 2.23
Telephone numbers 5.26 1.95
Annual income 5.95 1.55
Credit card number 6.58 0.90
Social security number 6.89 0.49

63
Next, data were examined for outliers. Mahalanobis distances, which measure the
distance of cases from the mean of the predictor variable, were computed to detect
outliers (Field, 2005; Hair, Black, Babin, Anderson, & Tatham, 2006). Subjects whose
Mahalanobis chi-square exceeded the critical χ2(29) at p< .001, 58.30, were deleted
(Mertler & Vannatta, 2005).
One-way analysis of variance (ANOVA) was conducted to determine the
statistical difference of the means among the information items as shown in Table 8.
There was a significant difference among the means of the information items, F (28,
2407) = 44.67, p < .0001, and it implies that the sensitivity level of annual income was
significantly different from that of gender. Levene statistics, a test of homogeneity of
variances, indicate unequal variance of the groups (see Table 9).
Table 8. Analysis of variance for the measurement items for information sensitivity.
Source SS df MS F P
Between groups 4996.20 28 178.44 44.67** .000
Within groups 9615.39 2407 3.40
Total 14611.59 2435
** p < .01.
Table 9. Test of homogeneity of variance for the measurement items for information
sensitivity.
Levene statistics df 1 df 2 P
18.39** 28 2407 .000
** p < .01.

64
Multiple mean comparisons among the measurement items for information
sensitivity, a Post Hoc analysis, followed to determine the mean difference among the
measurement items. Specifically, the analysis would show which item’s mean was the
same as or different from that of the most sensitive item, annual income, and the least
sensitive item, gender.
A Dunnet T3 analysis was conducted due to the unequal variance (Field, 2005;
Kuehl, 2000). No significant mean differences were found among the item with the
lowest mean, gender, and the next five items, ranked by mean and no mean differences
were found among the item with the highest mean, annual income, and the next four
items, ranked by mean, as shown in Table 10. Diabetes was added into the highest means
group in order to match the number of items to the lowest means group. The mean of
favorite hobbies, which is the highest in the lowest means group, was statistically
different from the mean of diabetes, which is the lowest mean in the highest means
group. The six items in the lowest means group represented low sensitivity information
items and the other six items in the highest means group represented high sensitivity
information items (see Table 11).

65
Table 10. Multiple mean comparisons among the mean of the measurement items for
information sensitivity.
Information items 95% C. I.
(I) (J)
Mean
difference
(I-J)
SE P
Lower
bound
Upper
bound
Gender Smoking preference -.107 .24 1.00 -1.04 .83
Favorite snacks -.095 .22 1.00 -.96 .77
Favorite TV programs -.417 .25 1.00 -1.40 .57
Favorite magazine -.417 .25 1.00 -1.40 .56
Favorite hobbies -.488 .25 1.00 -1.47 .49
Annual Telephone number .69 .27 .97 -.38 1.76
income Medication .74 .30 .98 -.43 1.90
Preferred credit card number .86 .28 .58 -.24 1.95
Religion 1.14 .31 .14 -.09 2.38
Diabetes Favorite hobbies 2.50 .32 .00** 1.26 3.74
** p < .01

66
Table 11. Categorization of the measurement items for information sensitivity.
Sensitivity category Information sensitivity item
Low sensitivity information Gender
Favorite Snack
Smoking preferences
Favorite TV programs
Favorite Magazine
Favorite hobbies
High sensitivity information Annual income
Telephone number
Medication
Preferred credit card number
Religion
Diabetes

67
Underlying structure among the measurement items for perceived control.
Factor analysis was conducted to define the underlying structure among the
measurement items assessing perceived control. In this study, eight items were measured
and two underlying structures, namely cognitive and decisional control, were expected
with factor analysis.
First, data were examined for outliers. Mahalanobis distances, which measure the
distance of cases from the mean of the predictor variable, were computed to detect
outliers (Field, 2005; Hair et al., 2006). Subjects whose Mahalanobis chi-square exceeded
the critical χ2(8) at p< .001, 26.13, were deleted (Mertler & Vannatta, 2005). Bartlett’s
test, χ2 = 434.290, p < .0001, and Kaiser-Meyer-Olkin measure of sampling adequacy
(KMO) statistics, KMO = .783, indicated that factor analysis was adequate.
Principal component analysis was conducted utilizing a varimax rotation. The
analysis produced a two-component solution, which was evaluated with the following
criteria: eigenvalue, variance, scree plot and residuals. The criteria indicated a two-
component solution was appropriate as shown in Table 12 and Figure 5. With rotation for
improved interpretation, the first component accounted for 43.25% of the total variance
in the original variables, while the second component accounted for 31.58% as shown in
Table 12.

68
Table 12. Total variance explained for perceived control.
Initial Eigenvalues Extraction Sums of Squared
Loadings Rotation Sums of Squared Loadings
Compo
-nent Total
% of
Variance
Cumulative
% Total
% of
Variance
Cumulative
% Total
% of
Variance
Cumulative
%
1 4.188 52.354 52.354 4.188 52.354 52.354 3.460 43.245 43.245
2 1.798 22.470 74.824 1.798 22.470 74.824 2.526 31.579 74.824
3 .686 8.580 83.404
4 .498 6.229 89.633
5 .315 3.932 93.564
6 .260 3.245 96.810
7 .130 1.620 98.429
8 .126 1.571 100.000
Note. Principal component analysis used for extraction method.
Figure 5. Scree plot of the measurement items for perceived control.

69
Table 13. Rotated component matrix for the measurement items for perceived control.
Component
1 2
DECCTRL 2. This loyalty program allows me to add, edit, delete, show and
hide my personal information whenever it is necessary.
.902 .207
DECCTRL 3. I can select the method to add, edit, delete, show and hide my
personal information.
.900 .211
DECCTRL 1. This loyalty program offers many choices to add, edit, delete,
show and hide my personal information.
.880 .198
COGCTRL 3. I am capable of using the option that the loyalty program offers
to add, edit, delete, show and hide my personal information.
.736 .349
DECCTRL 4. I have very little freedom to add, edit, delete, show and hide my
personal information.
.676 -.109
COGCTRL 4. I have used other options that are fundamentally the same as this
option.
.154 .887
COGCTRL 2. The option that the loyalty program offers to view, edit, show
and hide my personal information is similar to others with which I am familiar.
.186 .865
COGCTRL 1. There are parallels between this option and other options to add,
edit, delete, show and hide my personal information that I have experienced.
.082 .855
Note. DECCTRL is decisional control and COGCTRL is cognitive control. DECCTRL 4 was
reverse coded.

70
Based on the rotated component matrix, the first component consisted of five
items including DECCTRL 1, DECCTRL 2, DECCTRL 3, DECCTRL 4 and COGCTRL 3
while the second component consisted of three items including COGCTRL 1, COGCTRL
2 and COGCTRL 4 as shown in Table 13. The first component could be labeled as
decisional control and the second component as cognitive control.
In the pilot study, COGCTRL 3 was found to be interrelated with four items
(DECCTRL 1, 2, 3 and 4), which were expected to be interrelated and represented
decisional control. Based on the factor loading and previous research (de Rijk et al.,
1998; Mathwick & Rigdon, 2004), COGCTRL 3 and DECCTRL 4 could be excluded to
represent decisional control. A reliability analysis followed to assure this decision. While
Cronbach’s alpha tends to increase as the number of items on scale increases, three items
(DECCTRL 1, 2 and 3) for decisional control (α = .942) were more reliable to measure
the construct than four items (DECCTRL 1, 2, 3 and 4) (α = .867). Similarly, three items
(COGCTRL 1, 2 and 4) for cognitive control (α = .861) were more adequate than four
items (COGCTRL 1, 2, 3 and 4) (α = .818).
Reliability of the measurement items for perceived value and underlying structure
among the measurement items for importance of perceived benefits.
A reliability analysis was conducted to assure that the measurement items reflect
the construct that they are measuring. First, one case was eliminated whose Mahalanobis
chi-square exceeded the critical χ2(3) at p< .001, 16.27 (Mertler & Vannatta, 2005). The
reliability of the measurement items for perceived value was acceptable with Cronbach’s
coefficient α = .942.

71
The factor analysis followed to examine the underlying structure among the
measurement items assessing the importance of perceived benefits. In this study, eight
items were measured and two underlying structures, namely the importance of economic
and social benefits, were examined with factor analysis.
First, data were examined for outliers. Mahalanobis distances, were computed to
detect outliers (Field, 2005; Hair et al., 2006). Subjects whose Mahalanobis chi-square
exceeded the critical χ2(8) at p< .001, 26.13, were deleted (Mertler & Vannatta, 2005).
Bartlett’s test, χ2 = 384.874, p < .0001, and KMO = .725 indicated that factor analysis
was adequate.
Principal component analysis was conducted utilizing a varimax rotation. The
analysis produced a two-component solution, which was evaluated with the following
criteria: eigenvalue, variance, scree plot and residuals. The criteria indicated a two-
component solution was appropriate as shown in Table 14 and Figure 6. With rotation for
improved interpretation, the first component accounted for 37.28% of the total variance
in the original variables, while the second component accounted for 32.08%.

72
Table 14. Total variance explained for importance of perceived benefits.
Initial Eigenvalues Extraction Sums of Squared
Loadings Rotation Sums of Squared Loadings
Compo
-nent Total
% of
Variance
Cumulative
% Total
% of
Variance
Cumulative
% Total
% of
Variance
Cumulative
%
1 4.067 50.837 50.837 4.067 50.837 50.837 2.982 37.279 37.279
2 1.481 18.517 69.354 1.481 18.517 69.354 2.566 32.075 69.354
3 .869 10.868 80.222
4 .669 8.364 88.586
5 .358 4.472 93.058
6 .233 2.916 95.973
7 .221 2.764 98.737
8 .101 1.263 100.000
Note. Principal component analysis used for extraction method.
Figure 6. Scree plot of the measurement items for importance of perceived benefits.

73
Table 15. Rotated component matrix for the measurement items for importance of
perceived benefits.
Component
1 2
ECONBENF 2. Better prices / discount .898 -.058
ECONBENF 1. Having quicker service .878 .285
ECONBENF 3. Time saving .865 .279
ECONBENF 4. Redeemable reward points .549 .228
SOCBENF 2. Recognition from the company (e.g. addressing me by name) .148 .837
SOCBENF 4. Long-term relationship with the company .309 .772
SOCBENF 1. The company’s anticipation of my service and menu needs .011 .754
SOCBENF 3. Special attention .489 .698
Note. ECONBENF is economic benefits and SOCBENF is social benefits.
Based on the rotated component matrix, the first component consisted of four
items including ECONBENF 1, ECONBENF 2, ECONBENF 3 and ECONBENF 4
whereas the second component consisted of four items including SOCBENF 1,
SOCBENF 2, SOCBENF 3 and SOCBENF 4 as shown in Table 15. The first component
can be labeled as the importance of economic benefits and the second component as the
importance of social benefits. The result showed two components of the measurement
items, which was expected in the development of the measurement items.

74
Reliability of the measurement items for customer loyalty.
A reliability analysis was conducted to assure that the measurement items reflect
the construct that they are measuring. First, subjects whose Mahalanobis chi-square
exceeded the critical χ2(7) = 24. 32 for behavioral intent and the critical χ2(4) = 18. 47 for
relative attitude at p< .001 were deleted (Mertler & Vannatta, 2005). The reliability of the
measurement items for behavioral intent was acceptable with Cronbach’s coefficient α =
.958 and for relative attitude with α = .973.
Main Study
Design of the Study
To test the hypotheses of this study, participants were divided into four groups
based on two experimental treatments, namely, information sensitivity and information
edit function. Information sensitivity refers to comprehensive information characteristics
that amalgamate emotion intensity and monetary value and was manipulated at two
levels: high and low sensitivity. An information edit function refers to an option to edit,
hide, show and view personal information available from a loyalty program and was
manipulated at two levels: presence and absence. The four groups were: high sensitive
information – presence of an information edit function, high sensitive information –
absence of an information edit function, low sensitive information – presence of an
information edit function, and low sensitive information – absence of an information edit
function.
Privacy concern, perceived control, perceived value, information disclosure and
customer loyalty were assessed for each group. That is, participants in each group were

75
asked about their opinions on a loyalty program for a hypothetical national restaurant
chain and privacy concern, perceived control over information use of the company,
perceived value of a loyalty program, willingness to disclose and customer loyalty (i.e.
behavioral intent and relative attitude toward the company) were measured.
Experimental Treatments
Scenarios.
Scenarios were used for this study since they eliminate the difficulties associated
with observation such as the time and expense involved (Bateson & Hui, 1992; Smith et
al., 1999). In the scenario, Riley’s Restaurant was described to be casual for lunch and
upscale for dinner, featuring American dishes with wine and beer. The loyalty program in
the scenario was described as a reward program with various member-exclusive benefits
and the eight benefit items were listed. A personal information policy was stated in the
scenario describing how Riley’s Restaurant handles personal information collected
through the loyalty member registration. Also, a written statement describing how
participants can view, edit, show or hide their information after their account is created
was present.
Information sensitivity.
Information sensitivity refers to comprehensive information characteristics that
amalgamate emotion intensity and monetary value and was manipulated at two levels:
high and low sensitivity. Based on the pilot test, 12 of 29 items were selected for
information sensitivity manipulation as shown in Table 11. The six items representing
low sensitivity information were gender, favorite snack, smoking preferences, favorite
TV programs, favorite magazine and favorite hobbies. The items representing high

76
sensitivity information were annual income, telephone number, medication which the
respondent takes, preferred credit card number, religion preferences of the respondent
and the presence of diabetes.
Information edit function.
An information edit function refers to an option to edit, hide, show and view
personal information available from a loyalty program and was manipulated at two
levels: presence and absence. This stimulus was manipulated in order to establish the
different settings for perceived control; perceived control is expected to be different
between presence and absence of the information edit function.
In the questionnaire where the information edit function was present, the function
was simulated so that participants could interact with the option to edit, hide, show, and
view a mock-up email address. An email address was included for the simulation because
it was not included in the high or low sensitivity information item group. When the Show
action was selected, the following message appeared: The staff in your local Riley’s
restaurant can see your email address. When the Hide action was selected, the following
message appeared: The staff in your local Riley’s restaurant CANNOT see your email
address. When the Edit action was selected, participants were asked to enter a new email
address. When the View action was selected, the following message appeared: Your email
address is [email protected]. At the condition where the information edit
function was absent, no simulation was available.

77
Dependent Variables
Five dependent variables used and measured were perceived control, privacy
concern, value perception, information disclosure, and customer loyalty. The same
measurement items used in the pilot test were used in the main study.
Perceived control.
Two components of perceived control, namely cognitive and decisional control,
were measured using the measurement items in the pilot test as shown in Table 2 and
Table 3. Participants were asked to indicate their level of agreement or disagreement with
the statements of the measurement items (1 = strongly disagree, 7 = strongly agree).
Cognitive control is obtained by processing potentially threatening information in a way
to reduce stress and decisional control refers to the range of choice or number of options
available and involves choices prior to information disclosure.
Perceived cognitive and decisional control were measured to examine the effect
of the information edit function on perceived control, not to examine the effect of the
company’s request for information. While information, choice, and predictability are the
antecedents of control, which have the potential to influence experience and perceptions
of control, increases in information, choice, or predictability do not always lead to more
perceived control (Skinner, 1996). Thus, it was examined whether and under what
conditions the information edit function changes perceived control. Similarly, the
experiments exemplified in previous research (Averill, 1973) examined the effect of
information on perceived control while an impending stressful event stayed constant.

78
Privacy concern.
Privacy concern refers to the level of consumers’ anxiety for the way their
information is used by companies (Phelps, D'Souza, & Nowak, 2001). The five items of
the scale were adapted from previous research (Milne & Culnan, 2004; Miyazaki &
Fernandez, 2001) and measured using a seven-point Likert scale (1 = strongly disagree, 7
= strongly agree) as shown in Table 16.
Table 16. Measurement items for privacy concern, adapted from previous research
(Milne & Culnan, 2004; Miyazaki & Fernandez, 2001).
Scale (1 = strongly disagree, 7 = strongly agree)
PRVCCONC 1. It usually bothers me when this company asks me for such personal
information.
PRVTCONC 2. I am concerned that this company is collecting too much personal
information about me.
PRVTCONC 3. It bothers me to give personal information to this company.
PRVTCONC 4. When this company asks for personal information, I sometimes think
twice.
PRVTCONC 5. It bothers me when I imagine that this company tracks my purchase
habits and histories
79
Perceived value.
Perceived value of a loyalty program refers to some form of trade-off between
benefits and costs associated with a loyalty program (Christopher, 1982; Lynn, 1991;
Zeithaml, 1988). It was measured using the measurement items in the pilot test as shown
in Table 4. Participants were asked to indicate their level of agreement or disagreement
with the statements (1 = strongly disagree, 7 = strongly agree).
The importance of perceived benefits was measured for economic and social
benefits using the measurement items used in the pilot test as shown in Table 5.
Participants were asked to rate the importance of the benefits listed (1 = not important at
all, 7 = very important).
Willingness to disclose information.
Willingness to disclose information was measured for the items used for the
information sensitivity as shown in Table 11. Participants were asked to rate their
willingness to disclose the items listed (1 = strongly unwilling, 7 = strongly willing).
Customer loyalty.
Behavioral intent and relative attitude were measured for customer loyalty
(Lacey, 2007; Mattila, 2006; Yi & Jeon, 2003) using the measurement items in the pilot
test as shown in Table 6. Participants were asked to indicate their level of agreement or
disagreement with the statements of the measurement items (1 = strongly disagree, 7 =
strongly agree).
Participants
A minimum sample size of 30 participants per group and 120 participants in total
is required to yield significant statistical analysis. A convenience sample was recruited

80
from the customers who made a reservation for dinner at a student managed restaurant of
a major northeastern university between March 1, 2007 and April 30, 2008. The dinner
service is managed and staffed by students majoring in hospitality management, as part of
an undergraduate class course.
Although the customers made a reservation either by an online reservation form
or phone, the customer email list was collected mainly from those who made a
reservation online since many of those who made a reservation by phone stated they
didn’t have an email address. The email list was obtained from the customer database of
the online reservation system with the permission from the Office for Research
Protections (ORP) and 1,441 email addresses were available from the contact
information.
Procedures for the Data Collection
An invitation email with a link to the online survey was sent to a sample size of
1,441. The online survey was hosted by a commercial web service company, Mutual
Gravity, which offers professional online survey instrument tools. The online survey
could be initiated by clicking the link or copying and pasting the link into the address bar
in an Internet browser.
Once the survey was initiated, participants were randomly exposed to one of the
four experimental conditions: 1) high sensitive information request – presence of an
information edit function, 2) low sensitive information – presence of an information edit
function, 3) high sensitive information – absence of an information edit function, or 4)
low sensitive information – absence of an information edit function.

81
After reading a scenario about a hypothetical national restaurant chain named
Riley’s Restaurant and its loyalty program, participants were asked to complete a
questionnaire evaluating their perceptions about control, privacy concern, value and
assessing their willingness to disclose information requested in the experiment as shown
in Appendix C. Also, their behavioral intent and relative attitude to the hypothetical
restaurant were assessed. The survey was open for two weeks in April, 2008, and a
reminder email was sent one week after the initial email had been sent.
Online survey.
The online survey offers the advantages of reaching a large number of potential
respondents cheaply and quickly (Couper, 2005; Couper, Blair, & Triplett, 1999). Also,
the online survey provides improved measurement with the capability of a computer-
assisted survey technique including automated branching or skipping and randomization
of questions or response opinions (Couper, 2001).
However, the response rate of the online survey might not reach the levels of an
equivalent paper-based survey (Couper et al., 1999). The nonresponse error can exist
when an obtained sample differs from the original selected sample and there are two
ways in which nonresponse can occur: the inability to contact all members of the sample
and nonresponse to some or all items on the measurement instrument (Smith & Albaum,
2005). Although a high response rate does not guarantee an absence of nonresponse rate
error, the lower rate tends to affect estimates derived from the sample (Couper, 2001).
The advantages of online survey in term of cost reduction, timeliness, or improved
measurement may be offset by possible losses with respect to nonresponse (Couper,
2005).

82
Randomized assignment to the experimental condition.
Participants were randomly exposed to one of the four experimental conditions. A
JavaScript was used to achieve this random assignment. A JavaScript is a scripting
language, which is a lightweight programming language used to add interactivity to
hypertext markup language (HTML) pages (W3C, 1999). When participants clicked the
hyperlink in the introduction page of the online survey, the JavaScript generated a
random number from zero to three, each of which linked to one of the four experimental
conditions.
One fourth of the participants were asked to disclose high sensitive information,
and the information edit function was available that they could show, hide, edit and view
released information. Another one fourth of the participants was asked to disclose low
sensitive information with the information edit function available. The third group was
asked to disclose high sensitive information but no information edit function was
available. The final fourth was asked to disclose low sensitive information and no
information edit function was available.
Statistical Analysis
A univariate analysis of variance (ANOVA) was conducted to investigate the
effect of information sensitivity on information privacy concern proposed in Hypothesis
1 (information privacy concern is greater when high sensitive information is requested
than when low sensitive information is requested). The difference in information privacy
concern between high and low sensitivity information condition was examined.

83
Multivariate analysis of variance (MANOVA) was conducted to analyze
Hypotheses 2a (perceived cognitive control is greater when an information edit function
is present than when an information edit function is absent) and 2b (perceived decisional
control is greater when an information edit function is present than when an information
edit function is absent). Since the variables, perceived cognitive and decisional control,
are the components of perceived control, the combined differences (e.g. differences in
perceived control combining perceived cognitive and decisional control) can be examined
with MANOVA.
To test Hypotheses 2c (perceived cognitive control has a negative relationship
with information privacy concern), and 2d (perceived decisional control has a negative
relationship with information privacy concern), a univariate ANCOVA was conducted.
Perceived cognitive and decisional control were controlled for in order to examine the
effect of an information edit function on an information edit function and the effect of
perceived cognitive and decisional control, as covariates, on privacy concern.
To test Hypotheses 3 (information privacy concern has a negative relationship
with perceived value of a loyalty program), 4a (information privacy concern has a
negative relationship with willingness to disclose information), and 6 (perceived value of
a loyalty program has a positive relationship with willingness to disclose information),
structural equation modeling (SEM) was conducted. The parameters and their sign
indicated the relationships among information privacy concern, perceived value of a
loyalty program, and willingness to disclose. Also, the model fit indices provided the
model fitness to the data.

84
ANCOVA was conducted to test Hypothesis 4b (willingness to disclose
information is greater when low sensitive information is requested than when high
sensitive information is requested) where information sensitivity was an independent
variable (IV), willingness to disclose was a dependent variable (DV) and information
privacy concern was a covariate. Similarly, ANCOVA was conducted to test Hypotheses
5a (perceived cognitive control has a positive relationship with willingness to disclose
information), 5b (perceived decisional control has a positive relationship with willingness
to disclose information), and 5c (willingness to disclose information is greater when an
information edit function is present than when an information edit function is absent)
where an information edit function was an IV, willingness to disclose was a DV and
perceived cognitive and decisional control were covariates.
A series of regression analyses was conducted to analyze Hypotheses 7 (perceived
value of a loyalty program has a positive relationship with customer loyalty), and 8
(willingness to disclose information has a positive relationship with customer loyalty). In
addition, multiple regression analysis was conducted to examine the relationship of
customer loyalty with perceived value of a loyalty program and willingness to disclose to
information. The summary of hypotheses and the correspondent statistical analyses are
shown in Table 17.

85
Table 17. Summary of independent and dependent variables and the statistical analysis
methods to examine the interests in hypotheses.
IV and DV Interest Statistical analysis
H1 IV: Information sensitivity
DV: Information privacy concern
Group difference ANOVA
H2a &b IV: Information edit function
DV: Perceived cognitive control (H2a)
DV: Perceived decisional control (H2b)
Group difference MANOVA
H2c & d IV: Information edit function
DV: Information privacy concern
Covariates: Perceived cognitive and
decisional control
Group difference ANCOVA
H3, 4a
& 6
IVs: Information privacy concern and
perceived value of a loyalty program
DV: Willingness to disclose information
Model fit SEM
H4b IV: Information sensitivity
DV: Willingness to disclose information
Covariate: Information privacy concern
Group difference ANCOVA

86
Table 17 (continued). Summary of independent and dependent variables and the
statistical analysis methods to examine the interests in hypotheses.
IV and DV Interest Statistical analysis
H5a, 5b
& 5c
IV: Information edit function
DV: Willingness to disclose information
Covariates: Perceived cognitive and
decisional control
Group difference ANCOVA
H7 IV: Perceived value
DV: Customer loyalty
Linear relationship Regression
H8 IV: Willingness to disclose information
DV: Customer loyalty
Linear relationship Regression

87
CHAPTER 4
RESULTS AND DISCUSSION
The purpose of this study was to examine the relationships among the levels of
information sensitivity, information edit function, perceived control, privacy concern,
perceived value of a restaurant-based loyalty program, willingness to disclose and
customer loyalty. An online survey with a scenario was used to investigate these
relationships among the variables of interest. The participants were instructed to read a
scenario and complete the questionnaire. The level of information sensitivity and an
information edit scheme were manipulated to investigate the influences on and the
relationships among perceived control, privacy concern, perceived value, willingness to
disclose information and customer loyalty as shown in Figure 7.
This chapter presents the results and findings of the statistical analyses performed
to investigate the hypothesis. The analyses include descriptive statistics, correlation
analysis, one-way ANOVA, and multiple regression analysis. The results and findings of
this study provide restaurant industry researchers and managers information about
customers’ willingness to disclose and its relationships with the antecedents.

88
Figure 7. Conceptual model of willingness to disclose information disclosure and its
relationship among information sensitivity, privacy concern, perceived value, perceived
control and customer loyalty.
Note. Parallelograms indicate control variables.
Manipulation Check
One-way ANOVA was conducted to examine the effect of the experimental
treatment, the information sensitivity, and a chi-square test was conducted to examine the
effect of the information edit function. More specifically, if the information sensitivity
manipulation is effective, the perceived sensitivity level of the information items would
vary between the group exposed to the high sensitivity information condition (HighSens)
and the group exposed to the low sensitivity information condition (LowSens). Also, if
the information edit function manipulation is effective, the responses to the question

89
asking the presence of the information edit function in the scenario would be different
between the group exposed to the presence condition (PresFn) and the group exposed to
the absence condition (AbsFn).
From the analysis, the perceived sensitivity level of the information items varied
significantly between the groups as shown in Tables 18 and 19. Also, the difference in
the responses between the two groups was found as shown in Table 20.
Table 18. Descriptive statistics of the perceived sensitivity level of the information items.
N M SD
Perceived sensitivity from the high sensitivity
information item condition group
151 4.78 1.28
Perceived sensitivity from the low sensitivity
information item condition group
149 2.34 1.28
Note. Scale (1 = not sensitive at all, 7 = very sensitive).
Table 19. Analysis of variance for the perceived sensitivity level of the information
items.
Source SS df MS F p
Between groups 445.41 1 445.41 270.45** .000
Within groups 490.79 298 1.65
Total 936.20 299
** p < .01.

90
Table 20. Chi-square test for the information edit function manipulation and the response
to the presence of the information edit function.
Value df
Asymptotic Sig. (2-sided)
Pearson Chi-Square 16.576** 2 .000 Likelihood Ratio 64.202** 2 .000 Linear-by-Linear Association
29.341** 1 .000
N of Valid Cases 300 ** p < .01.
Reliability and Validity of the Measurement Items
Perceived Cognitive and Decisional Control
In this study, cognitive and decisional controls were measured as the components
of perceived control. Four items were used to measure cognitive and decisional control,
respectively. Reliability analyses of the measurement items were conducted and showed
commonly acceptable coefficient alphas, α = .833 for cognitive control and α = .866 for
decisional control, implying the measurement items are reliable to measure the construct
(Field, 2005).
Construct validity is the extent to which a set of measured items actually reflects
the theoretical latent construct those items are designed to measure (Hair, Black, Babin,
Anderson, & Tatham, 2006). Convergent and discriminant validity are both considered
subcategories of construct validity and variance extracted (VE) is used as a summary
indicator of convergence. A VE of .5 or higher is considered to suggest adequate
convergence while less than .5 indicates that, on average, more error remains in the items

91
than the variance explained by the latent factor structure imposed on the measure (Hair et
al., 2006). The measurement items for cognitive control showed adequate convergent
validity, VE = .60, and the items for decisional control showed also adequate convergent
validity, VE = .66.
Privacy Concern
Five items were used to measure privacy concern. The reliability analysis for the
measurement item was conducted and showed an acceptable coefficient alpha, α = .943.
Perceived Value of a Loyalty Program
Three measurement items were used to measure the perceived value of the loyalty
program. The reliability of the three items was analyzed and showed an acceptable
coefficient alpha, α = .952.
Customer Loyalty
Behavioral intent and relative attitude were used as the components of customer
loyalty. The reliability of the seven measurement items for behavioral intent showed an
acceptable coefficient alpha, α = .971 and the reliability of the four measurement items
for relative attitude also showed an acceptable coefficient alpha, α = .972. The items for
behavioral intent showed adequate convergent validity, VE = .831, and the items for
relative attitude control showed also an adequate convergent validity, VE = .900. A
summated scale was generated for customer loyalty as a multivariate measurement. A
multivariate measurement was used to represent the combined aspects of customer
loyalty in a single measure (Hair et al., 2006). The reliability of the summated scale

92
showed an acceptable coefficient alpha, α = .977 and adequate convergent validity, VE =
.856.
Descriptive Characteristics of the Respondents
Of the 1,441 invitation emails, a sample of 300 participants completed the online
survey for a response rate of 20.82%. Based on gender, 34.0 % of the participants were
male and 63.7% were female. Based on age, 71.0% were between 35 and 64 years old.
The demographics of the participants are shown in Table 21.
Table 21. Demographics of the participants.
N Percent of the total response Age Male Female No response Male Female No response
18-25 6 32 0 2.0 10.7 .0 26-34 7 21 0 2.3 7.0 .0 35-49 54 53 2 18.0 17.7 .7 50-64 28 73 3 9.3 24.3 1.0 65 and over 7 10 0 2.3 3.3 .0 No response 0 2 2 .0 .7 .7
Test of the Hypotheses
Hypothesis 1
To test Hypotheses 1 (information privacy concern is greater when high sensitive
information is requested than when low sensitive information is requested), a univariate
ANOVA was conducted. The independent variable (IV) was the information sensitivity

93
with two levels, namely high and low sensitivity, and the dependent variable (DV) was
information privacy concern.
Based on Mahalanobis distances, no outliers were detected. Then, the assumption
of normality was examine graphically with normal Q-Q plots and an acceptable
distribution was found. Also, ANOVA F test is robust to the violation of normality (Hair
et al., 2006). Homoscedasticity was checked and no violation was detected (Levene F(1,
298) = 3.634, p = .058).
Next, a univariate ANOVA was conducted to test whether or not information
sensitivity had a significant effect on privacy concern. The results indicated a significant
effect of information sensitivity on privacy concern (F(1, 298) = 16.449, p < .0001). That
is, the group that was exposed to the high sensitivity information condition (HighSens)
showed a higher privacy concern than the group that was exposed to the low sensitivity
information condition (LowSens) as shown in Table 22. The results provide support for
Hypothesis 1.
Table 22. Means and standard deviation for privacy concern by information sensitivity
level.
Information privacy concern M SD High sensitivity information requested (HighSens) 5.634 1.302 Low sensitivity information requested (LowSens) 4.971 1.526

94
Hypotheses 2a and 2b
To test Hypotheses 2a (perceived cognitive control is greater when information
edit function is present than when information edit function is absent) and 2b (perceived
decisional control is greater when information edit function is present than when
information edit function is absent), a MANOVA was conducted to examine the
differences in perceived cognitive and decisional controls between when an information
edit function was present (PresFn) and when the function was absent (AbsFn). First,
outliers were examined with Mahalanobis distances which value exceeded the critical
value of chi-square of 13.82, df =2 at p = .01. Three cases were identified and excluded
from the analysis. Next, the assumption of homoscedasticity was checked and the Box’s
test indicated that the assumption was not violated (F(3, 18980000) = 1.497, p = .213).
The MANOVA results revealed the significant differences in perceived cognitive
and decisional control between two levels of the information edit function (Wilks’ Λ =
.045, F(2, 294) = 3125, p < .0001). Then, a univariate ANOVA was conducted on each
dependent variable as a follow-up test to the MANOVA. The information edit function
had a significant effect on perceived cognitive control (F(1, 295) = 23.829, p < .0001);
the group to whom an information edit function was available showed greater perceived
cognitive control than those to whom the information edit function was not available (see
Table 23). Similarly, a information edit function had a significant effect on perceived
decisional control (F(1, 295) = 29.424, p < .0001); the group to whom an information edit
function was available showed greater perceived decisional control than those to whom
the information edit function was not available (see Table 23). Thus, Hypotheses 2a and
2b were supported.

95
Table 23. Means and standard deviation for perceived cognitive and decisional control by
information edit function.
Perceived cognitive control
Perceived decisional control
M SD M SD Presence of information edit function (PresFn)
4.659 1.210 4.446 .932
Absence of information edit function (AbsFn)
3.906 1.430 3.860 .967
Hypotheses 2c and 2d
To test Hypotheses 2c (perceived cognitive control has a negative relationship
with information privacy concern), and 2d (perceived decisional control has a negative
relationship with information privacy concern), a univariate ANCOVA was conducted. In
the ANCOVA, the independent variable was an information edit function with two levels
(i.e. presence and absence) and the dependent variable was information privacy concern
while perceived cognitive and decisional control were covariates. The relationships of
perceived cognitive and decisional control with information privacy concern were
examined in terms of the covariates in the ANCOVA.
Based on Mahalanobis distances whose value exceeded the critical value of chi-
square of 16.27, df = 3 at p = .001, three cases were detected and excluded from the
analysis. Then, the assumption of normality was examine graphically with normal Q-Q
plots and indicated an acceptable distribution. Homoscedasticity was checked and no
violation was detected (Levene F(1, 294) = 1.065, p = .303). Homogeneity of regression

96
slopes was examined with the interaction effect between the IV and the covariates on DV
and no violation was detected (F(2, 290) = 1.816, p = .165).
Next, an univariate ANCOVA was conducted to test whether or not information
privacy concern differed for the information edit function while controlling for perceived
cognitive and decisional control. The means and standard deviations are presented in
Table 24. The ANCOVA results are summarized in Table 25 and parameter estimates are
presented in Table 26.
Table 24. Means and standard deviation for information privacy concern by information
edit function level.
Information privacy concern M SD Presence of information edit function (PresFn) 5.510 1.286 Absence of information edit function (AbsFn) 5.223 1.452
Table 25. Analysis of covariance for information privacy concern by information edit
function.
Source df F Partial η2 p Information edit function 1 11.431 .038 .001** Perceived cognitive control 1 10.027 .033 .002** Perceived decisional control 1 3.496 .012 .063 Error 292
Note. ** p < .01.

97
Table 26. Parameter estimates from ANCOVA for information privacy concern.
Parameter b SE t p Perceived cognitive control -.210 .066 -3.167 .002** Perceived decisional control -.181 .097 -1.870 .063
Note. ** p < .01.
The effect of an information edit function on information privacy concern was
significant (F(1, 292) = 11.431, p = .001) and perceived cognitive control significantly
adjusted information privacy concern (F(1, 292) = 10.027, p = .002). More specifically,
perceived cognitive control had a negative effect on information privacy concern while
perceive decisional control had an insignificant effect on information privacy concern
(see Table 26). Thus, the results provide support for Hypotheses 2c while the results
failed to provide support for 2d.
While the results indicated the significant effect of an information edit function on
information privacy concern, the direction of the effect was different from what was
expected. That is, information privacy concern was greater, not lesser, when the
information edit function was present than when the information edit function was
absent. It may be because the effect of information edit function on privacy concern was
minor with partial eta-squared of .038, so an information edit function wouldn’t explain
the privacy concern. Therefore, further examination of the relationship between a
information edit function and privacy concern is required.
The interaction effect between information sensitivity and an information edit
function on privacy concern was also examined with ANCOVA where perceived

98
cognitive and decisional control were covariates. The mean of each level is presented as
shown in Figure 8. and the results indicate the insignificant interaction effect on privacy
concern (F(1, 292) =.809, p = .369). Privacy concern was found to be greatest when high
sensitive information was requested with an information edit function and least when low
sensitive information was requested without an information edit function.
Figure 8. Means for privacy concern by information sensitivity and information edit
function level.
Note. for presence of an information edit function; for absence of an information edit function.
An additional ANOVA was conducted to investigate how the effect of the
information edit function on privacy concern changes when perceived cognitive and
decisional control were not controlled for. Without these variables controlled, the effect
of the information edit function on information privacy concern was insignificant (F(1,

99
294) = 3.208, p = .074). Therefore, perceived cognitive control was required to explain
the differences in information privacy concern for the information edit function.
Hypotheses 3, 4a and 6
Structural equation modeling (SEM) was conducted to estimate the model
proposed in Hypotheses 3 (information privacy concern has a negative relationship with
perceived value of a loyalty program ), 4a (information privacy concern has a negative
relationship with willingness to disclose information ), and 6 (perceived value of a loyalty
program has a positive relationship with willingness to disclose information).
The model proposed in the hypotheses and the standardized regression weights
are presented in Figure 9. The value of standardized regression weight can be interpreted
as a regression coefficient (Byrne, 1998) and the results provide support for Hypotheses 3
with standardized regression weight = -.342, p < .0001, 4a with standardized regression
weight = -.600, p < .0001, and 6with standardized regression weight =.193, p < .0001.
The goodness-of-fit statistics are presented in Table 27. The goodness-of-fit
statistics examined include a chi-square statistic, GFI, CFI, NFI, RMSEA. The values of
GFI, CFI, NFI well exceeded the value .90 and the value of RMSEA was less than .05,
recommended by Byrne (1998). The results indicate that a perceived value – privacy
concern – willingness to disclose model provides a good fit to the data. The results also
indicate the stronger effect of privacy concern on willingness to disclose than the effect
of perceived value of a loyalty program.
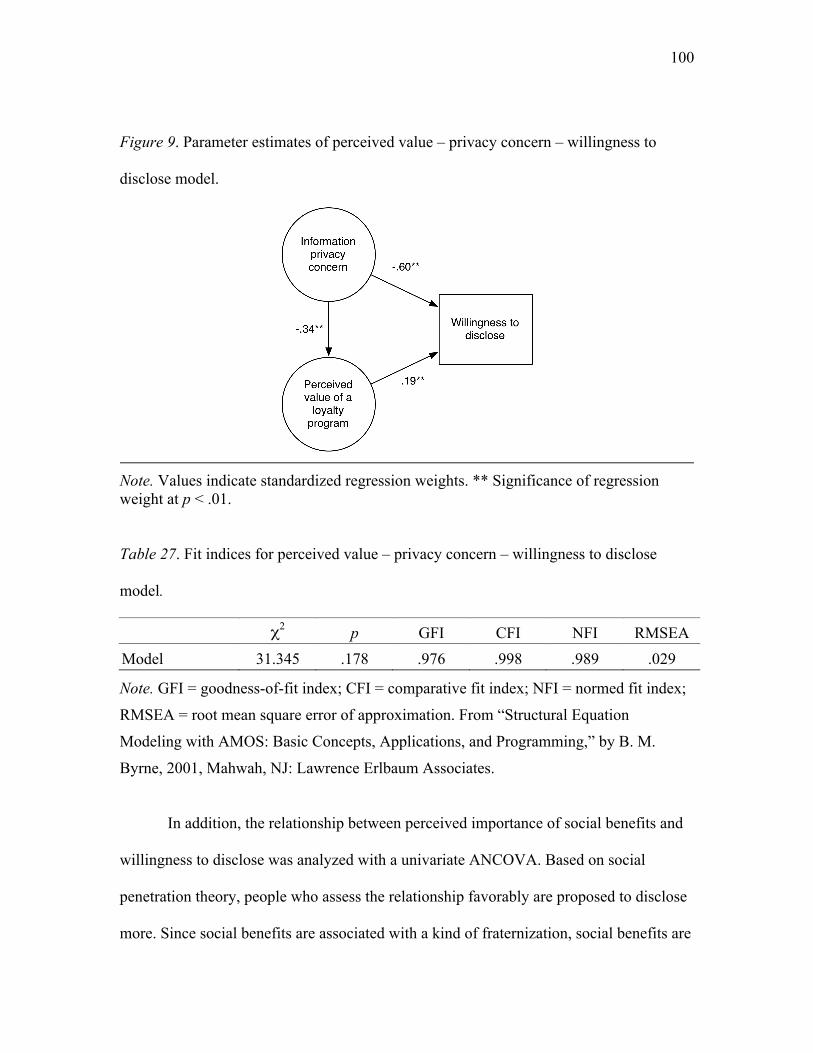
100
Figure 9. Parameter estimates of perceived value – privacy concern – willingness to
disclose model.
Note. Values indicate standardized regression weights. ** Significance of regression weight at p < .01.
Table 27. Fit indices for perceived value – privacy concern – willingness to disclose
model.
χ2 p GFI CFI NFI RMSEA Model 31.345 .178 .976 .998 .989 .029
Note. GFI = goodness-of-fit index; CFI = comparative fit index; NFI = normed fit index;
RMSEA = root mean square error of approximation. From “Structural Equation
Modeling with AMOS: Basic Concepts, Applications, and Programming,” by B. M.
Byrne, 2001, Mahwah, NJ: Lawrence Erlbaum Associates.
In addition, the relationship between perceived importance of social benefits and
willingness to disclose was analyzed with a univariate ANCOVA. Based on social
penetration theory, people who assess the relationship favorably are proposed to disclose
more. Since social benefits are associated with a kind of fraternization, social benefits are

101
proposed to be associated with the assessment of the relationship more closely than
economic benefits. Therefore, although social benefits may not be obtained instantly,
those who think social benefits associated with a loyalty program to be important will
assess future rewards to be more favorable than those who think social benefits to be
unimportant. A univariate ANCOVA was used where the independent variable was the
importance of social benefits with two levels and the dependent variable was willingness
to disclose information while the importance of economic benefits was a covariate.
Participants were divided into two groups based on their responses on the
importance of social benefits associated with the loyalty program using K-Means
clustering analysis. The K-means algorithm is one of the most popular iterative descent
clustering methods and the squared Euclidean distance is used as the dissimilarity
measure (Hastie, Tibshirani, & Friedman, 2001). In K-means analysis, an initial cluster
mean is randomly assigned and the squared Euclidean distance is computed based on the
initial cluster mean. After computing the squared Euclidean distance between
observations, a new cluster mean is set and compared to the previous mean. If two means
are different, the iteration continues. The K-means iteration continues until the previous
and current cluster means become statistically same.
Two clusters were identified based on the responses on how important
participants think social benefits associated with the loyalty program. The final cluster
mean (centroid) and the number of cases in each cluster are shown in Table 28. Cluster 1
had lower means for the importance of social benefits than Cluster 2 and was categorized
as the group who responded the importance of social benefits to be high; Cluster 2 was
categorized as the group who responded the importance of social benefits to be low.

102
Table 28. Centroids and the number of cases in each cluster.
Centroid 1 2 SOCBENF 1. Company’s anticipation 2.30 5.29 SOCBENF 2. Recognition from the company 2.00 5.27 SOCBENF 3. Special attention 2.99 5.51 SOCBENF 4. Long-term relationship 3.31 5.25 N 74.00 226.00
A univariate ANCOVA was followed to examine the differences in willingness to
disclose information between the groups. An ANCOVA, rather than an ANOVA, was
conducted because the importance of economic benefits was sought to be a confound
with the importance of social benefits; thus, the importance of economic benefits was a
covariate. Based on Mahalanobis distances whose value exceeded the critical value of
chi-square of 10.83, df = 1 at p = .001, no outliers were detected. Then, the assumptions
for ANCOVA, namely normality and homoscedasticity, were checked. Although
Kolmogorov-Smirnov statistics indicated a modest violation of normality for the DV
willingness to disclose information in the group who showed the importance of social
benefits to be high (statistic = .074, df = 226, p = .004), no violation for the DV
willingness to disclose information in the group who showed the importance of social
benefits to be low (statistic = .087, df = 74, p = .200) was examined. However, due to the
robustness of F tests to the violation of normality, no transformation was made (Hair et
al., 2006). Homoscedasticity was examined with the Levene test and no violation of the
assumption was found (Levene F(1, 298) =.204, p = .652). Homogeneity of regression

103
slopes was examined with the interaction effect between the IV and the covariate on DV
and no violation was detected (F(1, 296) =.325, p = .569).
Next, an ANCOVA was conducted to test whether or not willingness to disclose
information differs for the importance of social benefits while controlling for the effect of
the importance of economic benefits. The group who responded that the importance of
social benefits was high showed greater willingness to disclose information than the
group that responded the importance of social benefits was low as shown in Table 29.
The results provide support for the proposition that willingness to disclose information is
greater when the importance of social benefits is perceived to be high than when the
importance of social benefits is perceived to be low (F(1, 297) = 11.168, p < .0001). The
results indicate the covariate, the importance of economic benefits, significantly adjusted
willingness to disclose information (F (1, 297) = 14.451, p < .0001) and had a positive
effect on willingness to disclose (b for the importance of economic benefits = .317, p <
.0001).
Table 29. Means and standard deviation for willingness to disclose information by
information edit function.
Willingness to disclose information M SD Importance of social benefits to be high 4.235 .102 Importance of social benefits to be low 3.505 .186
The results indicate that the effect of the importance of social benefits on
willingness to disclose was significant and imply that those who value social benefits

104
associated with the loyalty program more show greater willingness to disclose than those
who place a low importance on social benefits.
Hypothesis 4b
To test Hypothesis 4b (willingness to disclose information is greater when low
sensitive information is requested than when high sensitive information is requested), a
univariate ANCOVA was conducted. In the ANCOVA, the independent variable was
information sensitivity with two levels (i.e. high and low sensitivity) and the dependent
variable was willingness to disclose information while information privacy concern was a
covariate. Thus, the effect of information sensitivity on willingness to disclose was
examined while controlling for information privacy concern.
Based on Mahalanobis distances whose value exceeded the critical value of chi-
square of 13.82, df = 2 at p = .001, two cases were detected and excluded from the
analysis. Then, the assumption of normality was examine graphically with normal Q-Q
plots and indicated acceptable distribution. Homoscedasticity was checked and no
violation was detected (Levene F(1, 296) =.048, p = .827). Homogeneity of regression
slopes was examined with the interaction effect between the IV and the covariate on DV
and no violation was detected (F(1, 294) =.060, p = .807).
Next, a univariate ANCOVA was conducted to test whether or not willingness to
disclose differed for information sensitivity while controlling for information privacy
concern. The ANCOVA results are summarized in Table 31.

105
Table 30. Means and standard deviation for willingness to disclose information by
information sensitivity level.
Willingness to disclose M SD High sensitivity information requested (HighSens) 3.199 1.229 Low sensitivity information requested (LowSens) 4.951 1.396
Table 31. Analysis of covariance for willingness to disclose by information sensitivity.
Source df F Partial η2 p Information sensitivity 1 123.967 .296 .000** Information privacy concern 1 257.116 .466 .000** Error 295
Note. ** p < .01.
The effect of information sensitivity on willingness to disclose was significant
(F(1, 295) = 123.967, p < .0001); the group that was asked for low sensitive information
showed greater willingness to disclose than the group that was requested to provide high
sensitive information as shown in Table 30. Information privacy concern significantly
adjusted willingness to disclose (F(1, 295) = 257.116, p < .0001). More specifically,
information privacy concern had a negative effect on willingness to disclose information
(b = -.650, p < .0001); the negative effect was also found in the results from SEM for
Hypothesis 4a. Thus, the results provide support for Hypothesis 4b. Also, the effect of
information privacy concern (partial η2 = .466, p < .0001) was greater than the effect of
information sensitivity (partial η2 = .296, p < .0001) on willingness to disclose.

106
An additional ANOVA was conducted to examine how the effect of information
sensitivity on willingness to disclose changes if information privacy concern was not
controlled for. When information privacy concern was not controlled for, the effect of
information sensitivity on willingness to disclose was also significant (F(1, 296) =
132.182, p < .0001). Both information sensitivity and information privacy concern
accounted for 63.1% of the variance in willingness to disclose while information
sensitivity accounted for 30.9%.
Hypotheses 5a, 5b, and 5c
A univariate ANCOVA was conducted to test Hypotheses 5a (perceived cognitive
control has a positive relationship with willingness to disclose information), 5b
(perceived decisional control has a positive relationship with willingness to disclose
information), and 5c (willingness to disclose information is greater when an information
edit function is present than when an information edit function is absent). In the
ANCOVA, the independent variable was an information edit function with two levels
(i.e. presence and absence) and the dependent variable was willingness to disclose
information while perceived cognitive and decisional control were covariates. Thus, the
effect of an information edit function on willingness to disclose was examined while
controlling for perceived cognitive and decisional control.
Based on Mahalanobis distances whose value exceeded the critical value of chi-
square of 16.27, df = 3 at p = .001, two cases were detected and excluded from the
analysis. Then, the assumption of normality was examine graphically with normal Q-Q
plots and indicated acceptable distribution. Homoscedasticity was checked and no
violation was detected (Levene F(1, 296) = 1.025, p = .312). Homogeneity of regression

107
slopes was examined with the interaction effect between the IV and the covariates on DV
and no violation was detected (F(1, 292) = .838, p = .433).
Next, a univariate ANCOVA was conducted to test whether or not willingness to
disclose differed for the information edit function while controlling for perceived
cognitive and decisional control. The ANCOVA results are summarized in Table 32 and
parameter estimates are presented in Table 33.
Table 32. Analysis of covariance for willingness to disclose by information edit function.
Source df F Partial η2 p Information edit function 1 14.670 .048 .000** Perceived cognitive control 1 5.446 .018 .020* Perceived decisional control 1 8.017 .027 .005** Error 294
Note. * p < .05. ** p < .01.
Table 33. Parameter estimates from ANCOVA for willingness to disclose.
Parameter b SE t p Perceived cognitive control .176 .075 2.334 .020* Perceived decisional control .304 .108 2.831 .005**
Note. * p < .05. ** p < .01.
The effect of the information edit function on willingness to disclose was
significant (F(1, 294) = 14.670, p < .0001) and perceived cognitive and decisional control
significantly adjusted willingness to disclose (F(1, 294) = 5.446, p = .020 for perceived
cognitive control; F(1, 294) = 8.017, p = .005 for perceived decisional control). More
specifically, both perceived cognitive and decisional control had positive effects on

108
willingness to disclose information as shown in Table 33. Thus, the results provide
support for Hypotheses 5a and 5b.
Table 34. Means and standard deviation for willingness to disclose information by
information sensitivity level.
Willingness to disclose M SD Presence of information edit function (PresFn) 3.828 1.551 Absence of information edit function (AbsFn) 4.227 1.586
While the effect of the information edit function on willingness to disclose was
significant, the group to whom the information edit function was not presented showed a
greater willingness to disclose than the group to whom the information edit function was
presented as shown in Table 34. Thus, the results fail to provide support for Hypothesis
5c. While the significant positive effect of perceived control on the relationship between
the information edit function and willingness to disclose was found, the reason that
Hypothesis 5c was not supported might be because a minor portion of the variance (9%)
in willingness to disclose was explained by the independent variable and the covariate.
Also, it implies that the information edit function did not explain willingness to disclose
information well.
An additional ANOVA was conducted to examine if the significance of the effect
of the information edit function on willingness to disclose changed if perceived cognitive
and decisional control were not controlled for. When perceived cognitive and decisional
control were not controlled for, the effect of the information edit function on willingness
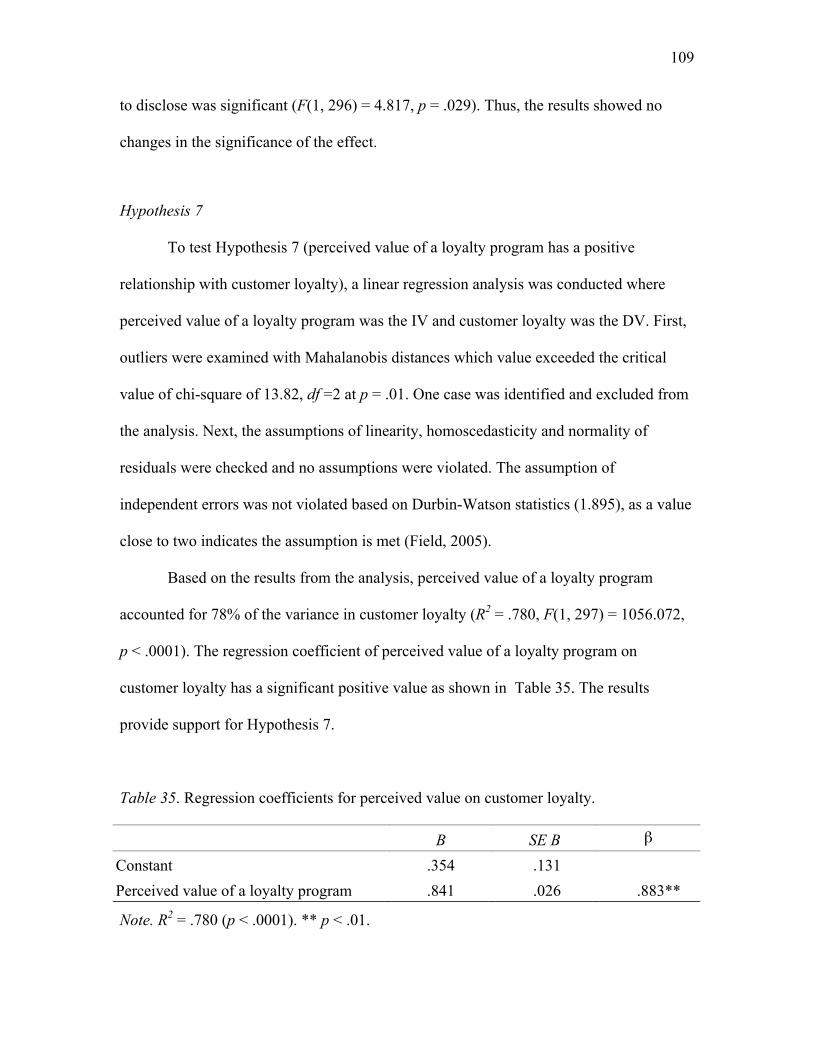
109
to disclose was significant (F(1, 296) = 4.817, p = .029). Thus, the results showed no
changes in the significance of the effect.
Hypothesis 7
To test Hypothesis 7 (perceived value of a loyalty program has a positive
relationship with customer loyalty), a linear regression analysis was conducted where
perceived value of a loyalty program was the IV and customer loyalty was the DV. First,
outliers were examined with Mahalanobis distances which value exceeded the critical
value of chi-square of 13.82, df =2 at p = .01. One case was identified and excluded from
the analysis. Next, the assumptions of linearity, homoscedasticity and normality of
residuals were checked and no assumptions were violated. The assumption of
independent errors was not violated based on Durbin-Watson statistics (1.895), as a value
close to two indicates the assumption is met (Field, 2005).
Based on the results from the analysis, perceived value of a loyalty program
accounted for 78% of the variance in customer loyalty (R2 = .780, F(1, 297) = 1056.072,
p < .0001). The regression coefficient of perceived value of a loyalty program on
customer loyalty has a significant positive value as shown in Table 35. The results
provide support for Hypothesis 7.
Table 35. Regression coefficients for perceived value on customer loyalty.
B SE B β
Constant .354 .131
Perceived value of a loyalty program .841 .026 .883**
Note. R2 = .780 (p < .0001). ** p < .01.

110
Hypothesis 8
To test Hypothesis 8 (willingness to disclose information has a positive
relationship with customer loyalty), a linear regression analysis was conducted where
willingness to disclose information was the IV and customer loyalty was the DV. First,
outliers were examined with Mahalanobis distances which value exceeded the critical
value of chi-square of 13.82, df =2 at p = .01. No outlier was detected. Next, the
assumptions of linearity, homoscedasticity and normality of residuals were checked and
no assumptions were violated. The assumption of independent errors was not violated
based on Durbin-Watson statistics (1.975), as a value close to two indicates the
assumption is met (Field, 2005).
Based on the results from the analysis, willingness to disclose information
accounted for 14% of the variance in customer loyalty (R2 = .143, F(1, 298) = 49.586, p <
.0001). The regression coefficient of willingness to disclose information on customer
loyalty has a significant positive value as shown in Table 36. Thus, the results provided
support for Hypothesis 8.
Table 36. Regression coefficients for willingness to disclose information on customer
loyalty.
B SE B β
Constant 3.257 .186
Willingness to disclose information .301 .043 .378**
Note. R2 = .143 (p < .0001). ** p < .01.
Based on the findings from the tests of Hypotheses 6, 7, and 8, a multiple
regression analysis was conducted to examine the relationship of customer loyalty with

111
perceived value of a loyalty program and willingness to disclose information; perceived
value of a loyalty program and willingness to disclose were the IVs and customer loyalty
was the DV.
First, outliers were examined with Mahalanobis distances which value exceeded
the critical value of chi-square of 16.27, df =3 at p = .01. One case was identified and
excluded from the analysis. Next, linearity and homoscedasticity were checked with the
scatter plot of residual and predicted values and normality of residuals was checked with
the normal P-P plot of regression standardized residual and histograms. No assumptions
were violated. Then, multicollinearity was checked with the correlations among the
independent variables. The correlation of .80 or above indicates multicollinearity (Field,
2005) and no such high correlations were found as shown in Table 37.
A forced entry multiple regression was conducted to determine the influence of
perceived value of a loyalty program and willingness to disclose on customer loyalty as
shown in Table 38. Based on the results from the analysis, the regression coefficient of
perceived value of a loyalty program was significant (β = .869, p < .0001) while the
regression coefficient of willingness to disclose was not significant (β = .036, p = .224).
The difference in the variance explained between the model with perceived value of a
loyalty program and willingness to disclose (R2 = .782, F(2, 296) = 529.634, p < .0001)
and the mode with perceived value was 0.2% (R2 = .782, F(2, 296) = 529.634, p < .0001).
Thus, the variance explained by willingness to disclose was minimal.
While willingness to disclose had a significant positive influence on customer
loyalty when only willingness to disclose was taken into account (R2 = .143, F(1, 298) =
49.586, p < .0001), its effect on customer loyalty became insignificant when both

112
perceived value of a loyalty program and willingness to disclose were taken into account.
It might be because the effect of perceived value of a loyalty program (β = .883, p < .001)
was stronger than that of willingness to disclose (β = .378, p < .001) on customer loyalty,
so the effect of willingness became insignificant when both variables were included
simultaneously.
Table 37. Measurement items correlations among perceived value of a loyalty program,
willingness to disclose (IVs) and customer loyalty (DV).
1 2 3 Customer loyalty (1) 1.000 Perceived value of a loyalty program (2) .883** 1.000 Willingness to disclose information (3) .378** .393** 1.000
** p < .01.
Table 38. Regression coefficients for perceived value of a loyalty program and
willingness to disclose information on privacy concern.
B SE B β
Constant .303 .138
Perceived value of a loyalty program .828 .028 .869** Willingness to disclose information .029 .024 .036
Note. R2 = .782 (p < .0001). ** p < .01.

113
Summary
The hypotheses were analyzed with various techniques such as univariate
ANOVA, ANCOVA, MANOVA, linear and multiple regression analyses and SEM. The
hypotheses and the results are summarized in Table 39.
Table 39. Summary of the hypotheses and the results from the statistical analyses.
Hypothesis Result H1: Information privacy concern is greater when high
sensitive information is requested than when low sensitive information is requested.
Supported
H2a: Perceived cognitive control is greater when an information edit function is present than when an information edit function is absent.
Supported
H2b: Perceived decisional control is greater when an information edit function is present than when an information edit function is absent.
Supported
H2c: Perceived cognitive control has a negative relationship with information privacy concern.
Supported
H2d: Perceived decisional control has a negative relationship with information privacy concern.
Not supported
H3: Information privacy concern has a negative relationship with perceived value of a loyalty program.
Supported
H4a: Information privacy concern has a negative relationship with willingness to disclose information.
Supported
H4b: Willingness to disclose information is greater when low sensitive information is requested than when high sensitive information is requested.
Supported

114
Table 39 (continued). Summary of the hypotheses and the results from the statistical
analyses.
Hypothesis Result H5a: Perceived cognitive control has a positive relationship
with willingness to disclose information.
Supported
H5b: Perceived decisional control has a positive relationship with willingness to disclose information.
Supported
H5c: Willingness to disclose information is greater when an information edit function is present than when an information edit function is absent.
Not supported
H6: Perceived value of a loyalty program has a positive relationship with willingness to disclose information.
Supported
H7: Perceived value of a loyalty program has a positive relationship with customer loyalty.
Supported
H8: Willingness to disclose information has a positive relationship with customer loyalty.
Supported

115
CHAPTER 5
SUMMARY, CONCLUSIONS, IMPLICATIONS, AND RECOMMENDATIONS
Introduction
The objective of customer relationship management is to retain customers by way
of various approaches such as customer recognition, customization and individualization
(Dyche, 2002; Fitzgibbon & White, 2005). Companies can tailor service to customers by
learning about the specific characteristics and requirements of individual customers based
on the data captured (Berry, 1983). Thus, the CRM approaches are dependent on a
customer database, which consists of transaction-based and disclosure-based data (Berry,
1983; Norberg & Dholakia, 2004). Disclosure-based data refer to data that are typically
related to internal beliefs and attitudes and are not usually collected on completion of a
commercial transaction. Disclosure-based data cannot be obtained unless customers
choose to supply the information.
This dissertation examined customers’ willingness to disclose in a restaurant
loyalty program context and the relationship to customer loyalty (i.e. behavioral intent
and relative attitude). The antecedents of customers’ willingness to disclose included
information privacy concern, perceived value of a loyalty program, and perceived
cognitive and decisional control over the companies’ use of customer information. The
effect of each antecedent on willingness to disclose was investigated through
manipulation of information sensitivity level and the availability of an information edit
function.

116
This chapter first summarizes the key findings of the results and discusses these
results. Next, the conclusions and implications based on these results are provided.
Finally, limitations and recommendations for future research are presented.
Summary of the Findings
The purpose of this study was to examine the relationship between willingness to
disclose and customer loyalty in a restaurant loyalty program, the role of privacy concern
and perceived value of a loyalty program in customers’ willingness to disclose, the effect
of information sensitivity and the availability of an information edit function, and the
relationship between perceived control and privacy concern. An online survey was
conducted and 300 participants completed the survey. The techniques for the data
analysis included univariate ANOVA, ANCOVA, MANOVA, linear and multiple
regression analyses and SEM. The results provided support for all hypotheses except H2d
and H5c as shown in Figure 10.

117
Figure 10. Summary of the results from the hypotheses tests.
Results from a univariate ANOVA indicated that the group that was exposed to
the high sensitivity information condition showed higher privacy concern than the group
that was exposed to the low sensitivity information condition and provided support for
Hypothesis 1 (privacy concern is higher when high sensitive information is requested
than when low sensitive information is requested) (F(1, 298) = 16.449, p < .0001). It can
be interpreted as participants became worried about the company’s use of information
when information related to greater emotion intensity and monetary value was asked than
when information related to lower emotion intensity and monetary value was asked.
Perceived control was found to differ between the group that was offered an
information edit function (PresFn) and the group that did not have an information edit
function (AbsFn). When an information edit function was present, respondents perceived
greater cognitive and decisional control than when an information edit function was
absent. The results provided support for Hypotheses 2a (perceived cognitive control is

118
greater when information edit function is present than when information edit function is
absent) (F(1, 295) = 23.829, p < .0001) and 2b (perceived decisional control is greater
when information edit function is present than when information edit function is absent)
(F(1, 295) = 29.424, p < .0001).
Perceived cognitive control was found to have a significant negative relationship
with information privacy concern while perceived decisional control had no significant
relationship; the results provided support for Hypothesis 2c (perceived cognitive control
has a negative relationship with information privacy concern) (F(1, 292) = 10.027, p =
.002; b = -.210, p = .002). It can be interpreted that respondents were less concerned
about information privacy when they perceived cognitive control.
SEM was conducted to test a privacy concern – perceived value of a loyalty
program – willingness to disclose model. The results showed that privacy concern had a
stronger effect on willingness to disclose than perceived value of a loyalty program did.
Based on the standardized regression coefficients, the results provided support for
Hypotheses 3 (information privacy concern has a negative relationship with perceived
value of a loyalty program), 4a (information privacy concern has a negative relationship
with willingness to disclose information), and 6 (perceived value of a loyalty program has
a positive relationship with willingness to disclose information). An additional analysis to
test the relationship between perceived importance of social benefits and willingness to
disclose showed that those who thought that social benefits are important were more
willing to disclose than those who thought that social benefits are less important.
The group from whom low sensitive information was requested to disclose
(LowSens) was found to have greater willingness to disclose than the group from whom
119
high sensitive information was requested (HighSens) and provided support for
Hypothesis 4b (willingness to disclose information is greater when low sensitive
information is requested than when high sensitive information is requested) (F(1, 295) =
123.967, p < .0001). The relationships of perceived cognitive and decisional control with
willingness to disclose were analyzed with ANCOVA and the results provided support
for Hypothesis 5a (perceived cognitive control has a positive relationship with
willingness to disclose information) (F(1, 294) = 5.446, p = .020; b = .176) and 5b
(perceived decisional control has a positive relationship with willingness to disclose
information) (F(1, 294) = 8.017, p = .005; b = .304). It implies that participants who
perceived cognitive or decisional control were more willing to disclose information than
those who did not. The results from ANCOVA failed to provide support for Hypothesis
5c (willingness to disclose information is greater when information edit function is
present than when information edit function is absent).
Hypotheses 7 (perceived value has a positive relationship with customer loyalty)
(R2 = .780, F(1, 297) = 1056.072, p < .0001; β = .883) and 8 (willingness to disclose
information has a positive relationship with customer loyalty) (R2 = .143, F(1, 298) =
49.586, p < .0001; β = .373) were supported based on regression analysis results. It
implies that the more value is perceived, the greater customer loyalty is; the more willing
to disclose, the greater customer loyalty is.

120
Discussion
Determinants of Customer Loyalty: Perceived Value of a Loyalty Program and
Willingness to Disclose
Customer loyalty in this study refers to behavioral intent and relative attitude
toward a restaurant. Perceived value of a loyalty program was found to account for
significant variance in customer loyalty (R2 = .780, F(1, 297) = 1056.072, p < .0001), and
willingness to disclose was found to account for significant variance in customer loyalty
(R2 = .143, F(1, 298) = 49.586, p < .0001). More specifically, customer loyalty was found
to have a positive relationship with perceived value of a loyalty program, and willingness
to disclose, respectively. The positive relationship between the perceived value of a
loyalty program and customer loyalty is consistent with the findings in previous research
on perceived value and customer loyalty (or behavioral intent) (Brady et al., 2005;
Parasuraman & Grewal, 2000; Yi & Jeon, 2003); customers’ perceived value of a product
or service is a determinant of customer loyalty. However, the difference between
previous research and this study is that perceived value in previous studies is a subjective
assessment of a focal product or service after customers experienced the product or
service while perceived value in this study is a subjective assessment of a loyalty
program that is additive to a focal product or service; moreover, customers haven’t
experienced the loyalty program in this study.
The significance of this study is in the examination of a relationship between
willingness to disclose and customer loyalty (i.e. behavioral intent and relative attitude)
since little research was found on the relationship; previous research examined a

121
relationship between attitudes toward companies’ use of customer information and
purchase (or behavioral) intent (Culnan, 1993; Phelps, Nowak, & Ferrell, 2000).
However, the findings indicate willingness to disclose had no significant
accountability for the variance in customer loyalty when both perceived value of a loyalty
program and willingness to disclose were taken into account. The reason that willingness
to disclose was not found to have a significant effect on customer loyalty could be
because the perceived value of a loyalty program could explain the majority of the
variance in customer loyalty (i.e. 78.0%) and the addition of willingness to disclose might
not provide significant accountability. However, the predictability of customer loyalty
with two variables (i.e. perceived value of a loyalty program and willingness to disclose)
is greater than the predictability with one variable (i.e. perceived value of a loyalty
program).
Information Sensitivity, Privacy Concern, and Willingness to Disclose
Two levels of information sensitivity (high and low) were used to examine the
differences in privacy concern and willingness to disclose rather than a positive or
negative relationship between sensitivity and other factors (i.e. privacy concern and
willingness to disclose). The sensitivity level of 29 items was determined after a pilot
test. Of the 29 items, six items were believed to have high sensitivity and six items were
placed in a low sensitivity group; the rest of the items were excluded from the study.
The results indicate the effect of information sensitivity on privacy concern and
the effect of privacy concern on willingness to disclose to be significant. More
specifically, customers’ privacy concern was greater when high sensitive information was
requested than when low sensitive information was requested; customers’ privacy

122
concern had a negative relationship with willingness to disclose information. Thus,
customer loyalty is affected by information sensitivity and privacy concern with the link
to the positive relationship of willingness to disclose.
While some types of data were found to be more sensitive than others (e.g.
telephone number is more sensitive than email) (Culnan, 1993) and willingness to
disclose information was found to vary among the type of information (e.g. demographic,
lifestyle, and financial information) (Phelps et al., 2000), the findings in previous
research are inconclusive. For example, a greater willingness to disclose was found in
demographic information followed by lifestyle and financial information (Phelps et al.,
2000) while a greater information privacy concern about sharing lifestyle and medical
information with another company was found (Culnan, 1993). These studies did not show
whether or not the connection between willingness to disclose and customers’ privacy
concern exists. The finding about the relationship between customers’ privacy concern
and willingness to disclose is consistent with a previous study where the relationship was
examined in a web site context (Nam, Song, Lee, & Park, 2005). Thus, the findings from
this study can provide connections among information sensitivity, privacy concern and
willingness to disclose.
Information Edit Function, Perceived Control, and Willingness to Disclose
In addition to the effect of information privacy concern, the results show the
effect of perceived control (i.e. perceived cognitive and decisional control) on willingness
to disclose to be significant. That is, the greater control customers perceive, the more
willing they are to disclose and the greater customer loyalty they show.

123
The presence of an information edit function (i.e. an option to edit, show, hide or
view) was proposed to be related to perceived control. In e-commerce, customers are
provided with an opt-in option as a way to give customers more control over their
personal information (Winer, 2001) and an information edit function was proposed to
have a similar role to the options in a restaurant loyalty program context. The results are
consistent with previous research (Winer, 2001) and indicate that the presence of an
information edit function had the same effect as the opt-in option; perceived cognitive
and decisional control were greater with an information edit function than without the
function.
The positive relationship of perceived control with willingness to disclose and
customer loyalty was found to be consistent with the findings in previous research (Hui &
Bateson, 1991; Povey, Conner, Sparks, James, & Shepherd, 2000); a positive relationship
of perceived control was found to be significant with behavioral intent such as
completion of shopping and food intake. Thus, the presence of an information edit
function influences perceived control, and perceived control is predictive of willingness
to disclose and customer loyalty.
While willingness to disclose was proposed to be greater with an information edit
function than without the function, the current results are opposite to the proposition;
greater willingness to disclose was found when an information edit function was absent.
Such results might imply that another moderate (or mediator) exists between an
information edit function and willingness to disclose.
The weak effects of the information edit function might support a possible
moderator. Based on the partial eta-squared value, 7.5% of the variance in perceived

124
control and 9.1% of the variance in perceived decisional control were explained by the
information edit function. Compared to 46.6% of the variance in willingness to disclose
explained by privacy concern, 1.8% of the variance in willingness to disclose was
explained by perceived cognitive control and 2.7% by perceived decisional control. Such
small effect sizes (or small partial eta-squared values) imply that the manipulation of the
information edit function was not effective to explain the variance in willingness to
disclose information and possible existence of another moderator (or mediator) between
an information edit function and willingness to disclose.
Thus, a moderator such as awareness might exist between an information edit
function and willingness to disclose. Customers may not be aware of the company’s
request for information until an information edit function is present (Norberg &
Dholakia, 2004; Olivero & Lunt, 2004). Awareness of the company’s request for
information might heighten negative emotion or the feeling of suspicion when an
information edit function is present, and consequently, customers become less willing to
disclose (Hu & Dinev, 2005). Thus, customers’ awareness of the company’s request for
personal information may be greater when an information edit function is present than
when an information edit function is absent.
Privacy Concern, Perceived Value, and Willingness to Disclose
While perceived value of a loyalty program was found to be a determinant of
customer loyalty, perceived value was also found to have a positive influence on
willingness to disclose. That is, the more value customers perceive, the more willing they
are to disclose, and the greater customer loyalty they show. Also, customers’ privacy
concern was found to have a negative influence on perceived value of a loyalty program

125
and willingness to disclose information. That is, the less concerned customers are about
information privacy, the more value they perceive and consequently the greater
willingness to disclose and customer loyalty they show.
The findings about the negative relationship between privacy concern and
perceived value of a loyalty program imply that privacy concern might play a role as
perceived costs in the subjective assessment of benefits and costs associated with a
loyalty program. While previous research proposed that willingness to disclose
information is dependent on perceived benefits and costs associated with information
disclosure (Franzak, Pitta, & Fritsche, 2001; Lee, Im, & Taylor, 2008), this study
examined willingness to disclose with respect to perceived benefits and costs associated
with a loyalty program. The results indicate that customers’ willingness to disclose is
dependent on the assessment of perceived benefits and costs associated with a loyalty
program.
In addition, the relationship between the importance of social benefits and
willingness to disclose was examined and the results indicate a significant effect of
importance of social benefits on willingness to disclose information (F(1, 297) = 11.168,
p < .0001). Based on social penetration theory, people who assess the relationship
favorably are proposed to disclose more. Perceived benefits increase when something that
is perceived to be important is added to the product or service (Ravald & Gronroos,
1996). Therefore, when a certain benefit is provided in a loyalty program, those who
perceive the benefit to be important will perceive the loyalty program to be more
beneficial than those who think the benefit is trivial. Since the social benefits are
associated with fraternization and relationship (e.g. personal recognition, and extra

126
attention), those who place a high importance on social benefits will assess the
relationship with the company to be more favorable than those who place a low
importance on social benefits in a restaurant loyalty program.
Conclusions and Implications
The most significant findings of this study were 1) customers’ willingness to
disclose and perceived value of a loyalty program are the determinants of customer
loyalty (i.e. behavioral intent and relative attitude); 2) willingness to disclose is affected
by perceived control (i.e. perceived cognitive and decisional control), privacy concern
and perceived value of a loyalty program; 3) privacy concern is affected by the sensitivity
level of information and perceived cognitive control; and 4) perceived value of a loyalty
program is affected by information privacy concern.
Based on Winer’s seven-step CRM model (2001), the construction of a customer
database is a necessary first step to a complete CRM solution which aims for customer
retention by establishing long-term relationships. Companies practicing CRM establish
long-term relationships by way of various approaches such as customer recognition,
customization and individualization, and such approaches can be more precisely tailored
to customers by learning about customers based on the customer database. Thus, a
customer database provides a basis of a long-term relationship between customers and
companies.
Customer loyalty (i.e. behavioral intent and relative attitude) was examined with
respect to customers’ willingness to disclose and perceived value of a loyalty program in
a restaurant loyalty program context. Willingness to disclose and perceived value of a

127
loyalty program, respectively, were found to be predictive of customer loyalty. The
findings imply that participants who are more willing to disclose might show greater
customer loyalty, and that participants who perceive more value of a loyalty program
might show greater customer loyalty to the restaurant.
Customers’ willingness to disclose was found to be affected by perceived control,
privacy concern and perceived value of a loyalty program. The findings imply that an
increment in perceived control led to a decrement in privacy concern, which led to an
increment in perceived value of a loyalty program, which led to an increment in
willingness to disclose, and consequently increased customer loyalty. The availability of
an information edit function affects perceived control; greater perceived cognitive and
decisional control occurred with an information edit function than without the function.
Privacy concern was found to be affected by the sensitivity level of information.
While it is suggested to include an information type factor in personal information
disclosure in marketing settings (Moon, 2000; Norberg & Dholakia, 2004), the type of
information was not reflecting a situational influence (Annacker, Spiekermann, &
Strobel, 2001; Chaikin & Derlega, 1974). Therefore, information categorized based on
sensitivity level was proposed to be an alternative to the types of information (Moon,
2000; Norberg & Dholakia, 2004). This study empirically examined the usability of
information categorization based on sensitivity, and the findings support that information
sensitivity was an appropriate alternative. It was also found that the more value customers
perceive in a loyalty program, the more willing they are to disclose.
Privacy concern was also found to have a positive relationship with perceived
value of a loyalty program as well as with willingness to disclose. The findings indicate

128
that privacy concern might play a role as perceived costs in the subjective assessment of
benefits and costs associated with a loyalty program. Thus, it is important for companies
practicing CRM to lower customers’ privacy concern because privacy concern negatively
affects perceived value of a loyalty program as well as willingness to disclose
information, which positively influence customer loyalty.
The implications of the findings for restaurants are that managers can collect more
disclosure-based information in a restaurant loyalty program by controlling the sensitivity
level of information and providing a loyalty program which has a high perceived value.
Since customers’ privacy concern has a greater effect on willingness to disclose,
companies can influence customers’ privacy concern indirectly by manipulating the
information sensitivity level to increase willingness to disclose. The availability of a
policy statement assuring the fair use of personal information may decrease privacy
concern (Culnan & Armstrong, 1999).
Restaurants need to provide a loyalty program with more value to customers in
order to collect more disclosure-based information and to increase customer loyalty. The
value of a loyalty program is perceived (or subjectively assessed), so restaurants can
provide a loyalty program which increases customers’ perception of benefits or decreases
their perception of costs associated with the loyalty program. Member-exclusive benefits
which are attractive and cannot be copied will increase customers’ perception of the
value of a loyalty program. Restaurant managers can increase the value of loyalty
programs with cash value of redemption rewards, the various but relevant (to the core
service/product) redemption choices, and easy-to-use schemes (Yi & Jeon, 2003).

129
Also, restaurants may provide customers with more control over the way that
companies use personal information to collect disclosure-based information. Since
perceived cognitive and decisional control were found to have a significant positive effect
on willingness to disclose, restaurants may use various strategies to increase perceived
control such as offering various options to control over companies’ use and security of
information (e.g. Privacy Bird and Secure Sockets Layer).
It is also important for restaurants to distinguish those customers who place a high
value on social benefits from those who place a high value on economic benefits. Based
on the results, the group that placed a high value on social benefits placed a high value on
economic benefits also; it implies that it is a necessary condition for companies to
provide a loyalty program in a way that customers perceive a high value on economic
benefits. Restaurants can increase the value of a loyalty program by providing a form of
fraternization to the customers who think that social benefits are important while
providing monetary rewards or economic benefits to the customers who think social
benefits are less important.
Limitations and Recommendations for Future Research
Limitations
First, this study has a limitation on the generalizability. In spite of the advantages
of a scenario method, customers’ privacy concern, perceived control, perceived value,
willingness to disclose information and customer loyalty from an actual restaurant chain
would be different from a hypothetical restaurant chain. While trust, brand, and past
experience with the focal restaurant could be controlled for in this study by presenting a

130
hypothetical restaurant chain, customers might be more concerned about information
privacy concern in an actual loyalty program context. That is, if personal information
such as name, favorite magazine, or annual income were requested, participants would be
more concerned about information privacy.
Second, this study has a limitation on measurements of information disclosure.
While customers’ decision to disclose information would be dichotomous (i.e. to disclose
or not to disclose), the magnitude of willingness (e.g. more or less willing) was measured
in this study.
Third, the operationalization of the measurement items for perceived control can
be improved. Although the measurement items were adapted from previous studies and
the statistical analyses indicated their validity, the measurement items for perceived
cognitive control could be improved by decomposing the items into sub dimensions of
information gain and appraisal.
Fourth, the manipulations of the independent variables, information sensitivity
and an information edit function could be improved by including diverse lists of
information which vary in sensitivity and by providing more choices to edit, show, hide
and view. Two categorizations of information sensitivity had a limitation on variations in
information sensitivity. Also the lists used in this study were adapted from previous
studies (Cranor, Reagle, & Ackerman, 1999; Horne, Norberg, & Ekin, 2007; Norberg &
Dholakia, 2004; Phelps et al., 2000), and may need to be modified for a restaurant
context. While participants correctly recalled the availability of an information edit
function in the scenarios, their perceived decisional control was not significantly different

131
for the availability. This result may be because the information edit function used was not
effective to stimulate perceived cognitive and decisional control.
Recommendations for Future Research
For future research, the generalizability could be improved by recruiting
participants from a restaurant which practices CRM with a loyalty program. By doing so,
the information requested by the company would be more realistic. Although the
measurement items for perceived cognitive and decisional control were adapted from
previous studies, they need to be refined. The measurement items for perceived cognitive
and decisional control were somewhat limited in previous research.
Also, other marketing strategies to reduce privacy concern, other than providing
an information edit function, need to be examined in a restaurant loyalty context.
Additionally, further examination of an information edit function utilized in this study
and its effect on privacy concern and willingness to disclose would help to explain the
relationship between greater willingness to disclose (and greater privacy concern) and
absence of information edit function.
The order of control operation could be examined to further research on perceived
control. That is, the order in which perceived control is invoked could be examined. For
example, cognitive control may be perceived prior to decisional control. If so, an
individual who perceives cognitive control may not seek another cue to increase
decisional control; only those who do not perceive cognitive control look for a cue related
to decisional control. By understanding the order of control operation, the restaurants can
collect more disclosure-based information by effective strategies to invoke perceived
control. Consequently, the model proposed in this study can be examined by using

132
appropriate techniques such as SEM in order to explore the fitness of the model as a
whole. Also, the models with other possible paths can be compared to explore a better
fitted model than the proposed model.
Based on the findings from this study, the effect of data mining techniques on
customer loyalty can be examined. Customers who are willing to disclose are more likely
to receive customized service than those who are less willing because managers could
collect more information about them and use customer information for customization.
Future research can examine the effect of customized service based on disclosure-based
information on perceived value of a loyalty program and customer loyalty. Also, the
threshold of information (e.g. amount and sensitivity) that is allowed to be utilized for
customization can be explored in a restaurant loyalty program context.

133
REFERENCES
Ajzen, I. (1991). The theory of planned behavior. Organizational Behavior and Human
Decision Processes, 50(2), 179-211.
Altman, I. & Taylor, D. A. (1973). Social Penetration: The Development of Interpersonal
Relationships. New York: Holt, Rinehart and Winston.
Annacker, D., Spiekermann, S., & Strobel, M. (2001). E-privacy: Evaluating a new
search cost in online environments. Paper presented at the 14th Bled Electronic
Commerce Conference, Bled, Slovenia.
Averill, J. R. (1973). Personal control over aversive stimuli and its relationship to stress.
Psychological Bulletin, 80(4), 286-303.
Bagozzi, R. P. (1975). Marketing as Exchange. Journal of Marketing, 39(4), 32-39.
Baloglu, S. (2002). Dimensions of customer loyalty: Separating friends from well
wishers. Cornell Hotel and Restaurant Administration Quarterly, 43(1), 47-59.
Bateson, J. & Hui, M. (1992). The eclogocial validity of photographic slides and
videotapes in simulating the service setting. Journal of Consumer Research, 19(2),
271-281.
Berry, L. (1983). Emerging perspectives on service marketing. Chicago, IL.: American
Marketing Association.
Bowen, J. & Shoemaker, S. (2003). Loyalty: A strategic commitment. Cornell Hotel and
Restaurant Administration Quarterly, 44(5-6), 31-46.
Bowman, C. & Ambrosini, V. (2000). Value creation versus value capture: Towards a
coherent definition of value in strategy. British Journal of Management, 11, 1-15.
134
Brady, M. K., Knight, G. A., Cronin, J. J., Tomas, G., Hult, M., & Keillor, B. (2005).
Removing the contextual lens: A multinational, multi-setting comparison of service
evaluation models. Journal of Retailing, 81(3), 215.
Byrne, B. M. (1998). Structural Equation Modeling with LISREL, PRELIS, and
SIMPLIS: Basic Concepts, Applications, and Programming. Mahwah, NJ:
Lawrence Erlbaum Associates, Inc.
Chaikin, A. L. & Derlega, V. J. (1974). Variables affecting the appropriateness of self-
disclosure. Journal of Consulting and Clinical Psychology, 42(4), 588-593.
Chen, I. J. & Popovich, K. (2003). Understanding customer relationship management
(CRM): People, process and technology. Business Process Management Journal,
9(5), 672-688.
Christopher, M. (1982). Value-in-use pricing. European Journal of Marketing, 16(5), 35-
46.
Cigliano, J. ., Georgiadis, M., Pleasance, D., & Whalley, S. (2000). The Price of Loyalty.
The McKinsey Quarterly, 4.
Couper, M. P. (2001). Web survey research: Challenges and oppotunities. Paper
presented at the The Annual Meeting of the American Statistical Association,
Atlanta, Geogia.
Couper, M. P. (2005). Technology trends in survey data collection. Social Science
Computer Review, 23(4), 486-501.
Couper, M. P., Blair, J., & Triplett, T. (1999). A comparison of mail and e-mail for a
survey of employees in federal statistical agencies. Journal of Official Statistics,
15(1), 39-56.

135
Cozby, P. C. (1973). Self-disclosure: A literature review. Psychological Bulletin, 79(2),
73-91.
Cranor, L. F., Reagle, J., & Ackerman, M. S. (1999). Beyond concern: Understanding net
users' attitudes about online privacy. AT&T Labs-Research Technical Report TR
99.4.3.
Culnan, M. J. (1993). 'How did they get my name?': An exploratory investigation of. MIS
Quarterly, 17(3), 341-361.
Culnan, M. J. & Armstrong, P. K. (1999). Information privacy concerns, procedural
fairness, and impersonal trust: An empirical investigation. Organization Science,
10(1), 104-115.
Dabholkar, P. A. (1996). Consumer evaluations of new technology-based self-service
options: An investigation of alternative models of service quality. International
Journal of Research in Marketing, 13(1), 29-51.
de Rijk, A. E., Le Blanc, P., M., Schaufeli, W., B., & de Jonge, J. (1998). Active coping
and need for control as moderators of the job demand-control model: Effects on
burnout. Journal of Occupational and Organizational Psychology, 71, 1-18.
Dick, A. S. & Basu, K. (1994). Customer loyalty: Toward an integrated conceptual
framework. Journal of the Academy of Marketing Science, 22(2), 99-113.
Dodds, W. B., Monroe, K. B., & Grewal, D. (1991). Effects of price, brand, and store
information on buyers' product evaluations. Journal of Marketing Research, 28(3),
307-319.
Dyche, J. (2002). The CRM Handbook: A Business Guide to Customer Relationship
Management. New York: Addison-Wesley.

136
Faranda, W. T. (2001). A scale to measure the cognitive control form of perceived
control: Construction and preliminary assessment. Psychology & Marketing,
18(21), 1259-1281.
Field, A. (2005). Discovering Statistics Using SPSS (2nd ed.). Thousand Oaks, CA:
SAGE Publications.
Fitzgibbon, C. & White, L. (2005). The role of attitudinal loyalty in the development of
customer relationship management strategy within service firms. Journal of
Financial Services Marketing, 9(3), 214-230.
Franzak, F., Pitta, D., & Fritsche, S. (2001). Online relationships and the consumer's right
to privacy. Journal of Consumer Marketing, 18(7), 631-641.
Gordon, I. (2002). Best practices: Customer relationship management. Ivey Business
Journal, 67(1), 1-5.
Greenberg, P. (2004). CRM at the Speed of Light: Essential Customer Strategies for the
21st Century. Emeryville, CA: McGraw-Hill.
Gwinner, K. P., Gremler, D. D., & Bitner, M. J. (1998). Relational benefits in services
industries: The customer's perspective. Journal of the Academy of Marketing
Science, 26(2), 101-114.
Hair, J. F., Black, W. C., Babin, B. J., Anderson, R. E., & Tatham, R. L. (2006).
Multivariate Data Analysis (6th ed.). Upper Saddle River, NJ: Pearson Prentice
Hall.
Hartnack, J. (1968). The concept of act and behavior. Man and World, 2, 267-277.
Hastie, T., Tibshirani, R., & Friedman, J. (2001). The Elements of Statistical Learning:
Data Mining, Inference, and Prediction. New York, NY: Springer.

137
Hoffman, D. L., Novak, T. P., & Peralta, M. A. (1999). Information Privacy in the
Marketspace: Implications for the Commercial Uses of Anonymity on the Web. The
Information Society, 15(2), 129 - 139.
Horne, D. R., Norberg, P. A., & Ekin, A. C. (2007). Exploring consumer lying in
information-based exchanges. The Journal of Consumer Marketing, 24(2), 90-99.
Houston, F. S. & Gassenheimer, J. B. (1987). Marketing and Exchange. Journal of
Marketing, 51(4), 3-18.
Howell, A. & Conway, M. (1990). Perceived intimacy of expressed emotion. Journal of
Social Psychology, 130(0), 467-476.
Hu, Q. & Dinev, T. (2005). Is spyware an Internet nuisance or public menace?
Communications of the ACM, 48(8), 61-66.
Hughes, A. M. (2000). Strategic Database Marketing (2nd ed.). New York, NY:
McGraw-Hill.
Hui, M. K. & Bateson, J. E. G. (1991). Perceived Control and the Effects of Crowding
and Consumer Choice on the Service Experience. Journal of Consumer Research,
18(2), 174.
Jones, A., Bentler, P. M., & Petry, G. (1966). The reduction of uncertainty concerning
future pain. Journal of abnormal psychology, 71(2), 87-94.
Jourard, S. M. (1971). Self-disclosure: An Experimental Analysis of the Transparent Self.
New York: Wiley-Interscience.
Kuehl, R. O. (2000). Design of Experiments: Statistical Principles of Research Design
and Analysis (2nd ed.). Pacific Grove, CA: Duxbury Press.

138
Lacey, R. (2007). Relationship drivers of customer commitment. Journal of Marketing
Theory and Practice, 15(4), 315-333.
Lacey, R. & Sneath, J. Z. (2006). Customer loyalty programs: are they fair to consumers?
The Journal of Consumer Marketing, 23(7), 458-464.
Lacey, R., Suh, J., & Morgan, R. M. (2007). Differential Effects of Preferential
Treatment Levels on Relational Outcomes. Journal of Service Research, 9(3), 241-
256.
Lee-Kelley, L., Gilbert, D., & Mannicom, R. (2003). How e-CRM can enhance customer
loyalty. Marketing Intelligence & Planning, 21(4/5), 239-248.
Lee, D.-H., Im, S., & Taylor, C. (2008). Voluntary self-disclosure of information on the
Internet: A multimethod study of the motivations and consequences of disclosing
information on blogs. Psychology & Marketing, 25(7), 692-710.
Lefcourt, H. M. (1973). The function of the illusions of control and freedom. American
Psychologist, 28(5), 417-425.
Liu, C., Marchewka, J. T., & Ku, C. (2004). American and Taiwanese perceptions
concerning privacy, trust, and behavioral intentions in electronic commerce.
Journal of Global Information Management, 12(1), 18-40.
Lynn, M. (1991). Scarcity Effects on Value: A Quantitative Review of the Commodity
Theory Literature. Psychology & Marketing, 8(1), 43-57.
Martínez-López, F. J., Luna, P., & Martínez, F. J. (2005). Online shopping, the standard
learning hierarchy, and the consumers’ internet expertise: An American-Spanish
comparison. Internet Research, 15(3), 312-334.

139
Mathwick, C. & Rigdon, E. (2004). Play, Flow, and the Online Search Experience.
Journal of Consumer Research, 31(2), 324-332.
Mattila, A. S. (2006). How Affective Commitment Boosts Guest Loyalty (and Promotes
Frequent-guest Programs). Cornell Hotel and Restaurant Administration Quarterly,
47(2), 174-181.
Mertler, C. A. & Vannatta, R. A. (2005). Advanced and Multivariate Statistical Methods:
Practical Application and Interpretation. Glendale, CA: Pyrczak Publishing.
Milberg, S. J., Burke, S. J., Smith, H. J., & Kallman, E. A. (1995). Values, personal
information privacy, and regulatory approaches. Association for Computing
Machinery. Communications of the ACM, 38(12), 65-74.
Milberg, S. J., Smith, H. J., & Burke, S. J. (2000). Information Privacy: Corporate
Management and National Regulation. Organization Science, 11(1), 35-57.
Milne, G. R. & Boza, M.-E. (1999). Trust and concern in consumers' perceptions of
marketing information management practices. Journal of Interactive Marketing,
13(1), 5.
Milne, G. R. & Culnan, M. J. (2004). Strategies for reducing online privacy risks: Why
consumers read (or don't read) online privacy notices. Journal of Interactive
Marketing, 18(3), 15.
Miyazaki, A. D. & Fernandez, A. (2001). Consumer perceptions of privacy and security
risks for online shopping. The Journal of consumer affairs, 35(1), 27-44.
Monroe, K. B. & Krishnan, R. (1985). The effect of price on subjective product
evaluations. In J. Jacoby & J. C. Olson (Eds.), Perceived Quality: How Consumers
View Stores and Merchandises. (pp. 209-232). Lexington, MA: Lexington Books.

140
Moon, Y. (2000). Intimate exchanges: Using computers to elicit self-disclosure from
consumers. Journal of Consumer Research, 26(4), 323-339.
Morgan, R. M. & Hunt, S. D. (1994). The commitment-trust theory of relationship
marketing. Journal of Marketing, 58(3), 20-38.
Nam, C., Song, C., Lee, E., & Park, C. I. (2005). Consumers' privacy concnerns and
willingness to provide marketing-related personal information online. Advances in
Consumer Research, 33, 212-217.
Namasivayam, K. (2004). Action Control, Proxy Control, and Consumers' Evaluations of
the Service Exchange. Psychology & Marketing, 21(6), 463-480.
Norberg, P. A. & Dholakia, R. R. (2004). Customization, information provision and
choice: what are we willing to give up for personal service? Telematics and
Informatics, 21(2), 143-155.
Oliver, R. (1997). Satisfaction: A Behavioral Perspective on the Consumer. New York,
NY: McGraw-Hill.
Olivero, N. & Lunt, P. (2004). Privacy versus willingness to disclose in e-commerce
exchanges: The effect of risk awareness on the relative role of trust and control.
Journal of Economic Psychology, 25(2), 243-262.
Omarzu, J. (2000). A Disclosure Decision Model: Determining How and When
Individuals Will Self-Disclose. Personality and Social Psychology Review, 4(2),
174-185.
Parasuraman, A. & Grewal, D. (2000). The impact of technology on the quality-value-
loyalty chain: A research agenda. Journal of the Academy of Marketing Science,
28(1), 168-174.

141
Phelps, J., D'Souza, G., & Nowak, G. J. (2001). Antecedents and consequences of
consumer privacy concerns: An empirical investigation. Journal of Interactive
Marketing, 15(4), 2-17.
Phelps, J., Nowak, G., & Ferrell, E. (2000). Privacy concerns and consumer willingness
to provide personal information. Journal of Public Policy & Marketing, 19(1), 27.
Povey, R., Conner, M., Sparks, P., James, R., & Shepherd, R. (2000). Application of the
theory of planned behaviour to two dietary behaviours: Roles of perceived control
and self-efficacy. British Journal of Health Psychology, 5, 121-139.
Prosser, W. L. (1960). Privacy. California Law Review, 48(3), 383-423.
Ravald, A. & Gronroos, C. (1996). The value concept and relationship marketing.
European Journal of Marketing, 30(2), 19-30.
Reichheld, F. (1996). The Loyalty Effect. Cambridge, MA: Harvard Business School
Press.
Reinartz, W. & Kumar, V. (2002). The mismanagement of customer loyalty. Harvard
Business Review, 80(7), 86-94.
Reinartz, W. J. & Kumar, V. (2000). On the profitability of long-life customers in a
noncontractual setting: An empirical investigation and implications for marketing.
Journal of Marketing, 64(4), 17-35.
Sassaroli, S. & Ruggiero, G. M. (2004). The role of stress in the association between low
self-esteem, perfectionism, and worry, and eating disorders. International Journal
of Eating Disorders, 37(2), 135-141.

142
Shadish, W. R., Cook, T. D., & Campbell, D. T. (2002). Experimental and Quasi-
Experimental Designs for Generalized Causal Inference. Boston, MA: Houghton
Mifflin Company.
Shankar, V., Smith, A. K., & Rangaswamy, A. (2003). Customer satisfaction and loyalty
in online and offline environments. International Journal of Research in Marketing,
20(2), 153-175.
Skinner, E. A. (1996). A guide to constructs of control. Journal of Personality and Social
Psychology, 71(3), 549-570.
Smith, A. K., Bolton, R., & Wagner, J. (1999). A model of customer satisfaction with
service encounters involving failure and recovery. Journal of Marketing Research,
36(3), 356-372.
Smith, S. M. & Albaum, G. S. (2005). Fundamentals of Marketing Research. Thousand
Oaks, CA: Sage Publications, Inc.
Staub, E. & Kellett, D. S. (1972). Increasing pain tolerance by information about aversive
stimuli. Journal of Personality and Social Psychology, 21(2), 198-203.
Sweeney, J. & Soutar, G. (2001). Consumer perceived value: the development of a
multiple item scale. Journal of Retailing, 77, 203-220.
Van Raaij, W. F. & Pruyn, A. T., H. (1998). Customer Control and Evaluation of Service
Validity and Reliability. Psychology & Marketing, 15(8), 811-832.
W3C. (1999). JavaScript Tutorial. Retrieved May 23, 2008, from
http://www.w3schools.com/JS/default.asp
Wheeless, L. R. (1976). Self-dsiclosure and interpersonal solidarity: Measurement,
validation, and relationships. Human Communication Research, 3(1), 47-61.

143
Winer, R. S. (2001). A framework for customer relationship management. California
Management Review, 43(4), 89-107.
Yi, Y. & Jeon, H. (2003). Effects of loyalty programs on value perception, program
loyalty, and brand loyalty. Journal of the Academy of Marketing Science, 31(3),
229-240.
Zeithaml, V. (1988). Consumer perceptions of price, quality and value: A means-end
model and synthesis of evidence. Journal of Marketing, 52(3), 2-22.
Zimbardo, P. G. (1969). The human choice: Individuation, reason, and order versus
deinidividualization, impulse, and class. Nebraska Symposium on Motivation: 1969.

144
APPENDIX A
Definition of Terms.
1. Customer loyalty. Customer loyalty consists of two dimensions, namely,
behavior and attitude. Behavioral loyalty is defined as repeated purchases of particular
products or service while attitudinal loyalty is defined as a customer’s attitudinal
commitment to the brand or company with repeated purchases (Baloglu, 2002; Dick &
Basu, 1994; Fitzgibbon & White, 2005; Yi & Jeon, 2003). Customer loyalty in this study
refers to behavioral intent (e.g. intent to purchase or visit) and relative attitude (e.g.
commitment to continuing the relationship with the company) toward the company.
2. Information disclosure. The act of revealing personal information to others
(Jourard, 1971). Self-disclosure and information disclosure were used interchangeably in
this study. Information disclosure in this study was operationalized as customers’
willingness to release requested information when they decide to join a loyalty program.
3. Information edit function. An information edit function refers to an option to
edit, hide, show and view personal information available from a loyalty program and was
manipulated at two levels: presence and absence.
4. Information sensitivity. Information items requested associated with a loyalty
program are categorized based on information sensitivity. Information sensitivity refers
to comprehensive information characteristics that amalgamate emotion intensity and
monetary value aspects (Moon, 2000; Norberg & Dholakia, 2004). For example,
information items which have greater emotion intensity and monetary value are high

145
sensitive information. Information sensitivity was manipulated at two levels: high and
low sensitivity information.
5. Preferential treatment. Rewards and benefits associated with a loyalty program.
Preferential treatment is classified as economic or social benefits. Economic benefits
describe the monetary enticements and examples include having quicker service, better
price / discount, time saving, and redeemable reward points. Social benefits describe
fraternization and other benefits from a relationship with the organization and examples
include the company’s anticipation of customers’ service and menu needs, recognition
from the company, special attention, long-term relationship with the company (Gwinner,
Gremler, & Bitner, 1998; Lacey, 2007).
6. Privacy concern. The level of customer anxiety for the way that personal
information is used by companies (Phelps, D'Souza, & Nowak, 2001). Four underlying
dimensions of privacy concern include collection, unauthorized secondary use, errors and
improper access of personal information (Milberg, Burke, Smith, & Kallman, 1995).
7. Perceived control. While Averill (1973) proposed a three dimensional
perceived control, namely, behavioral, cognitive and decisional control, perceived control
in the proposed study will be identified as cognitive and decisional control. Based on
Averill (1973), cognitive control describes the way to interpret a potentially harful event,
and it is obtained by processing potentially threatening information in a way to reduce
stress. Decisional control refers to the range of choice or number of options available.
8. Perceived value of a loyalty program. A subjective assessment of the trade-off
between benefits and costs associate with a loyalty program (Christopher, 1982;
Zeithaml, 1988). The benefit components of perceived value include salient intrinsic and

146
extrinsic attributes, and other relevant abstractions such as discount, tailored service and
other rewards. The cost components of perceived value include monetary and
nonmonetary costs such as price (e.g. price to purchase a reward card), effort (e.g.
presentation of a card to a cashier, and personal information disclosure) and other
resources.
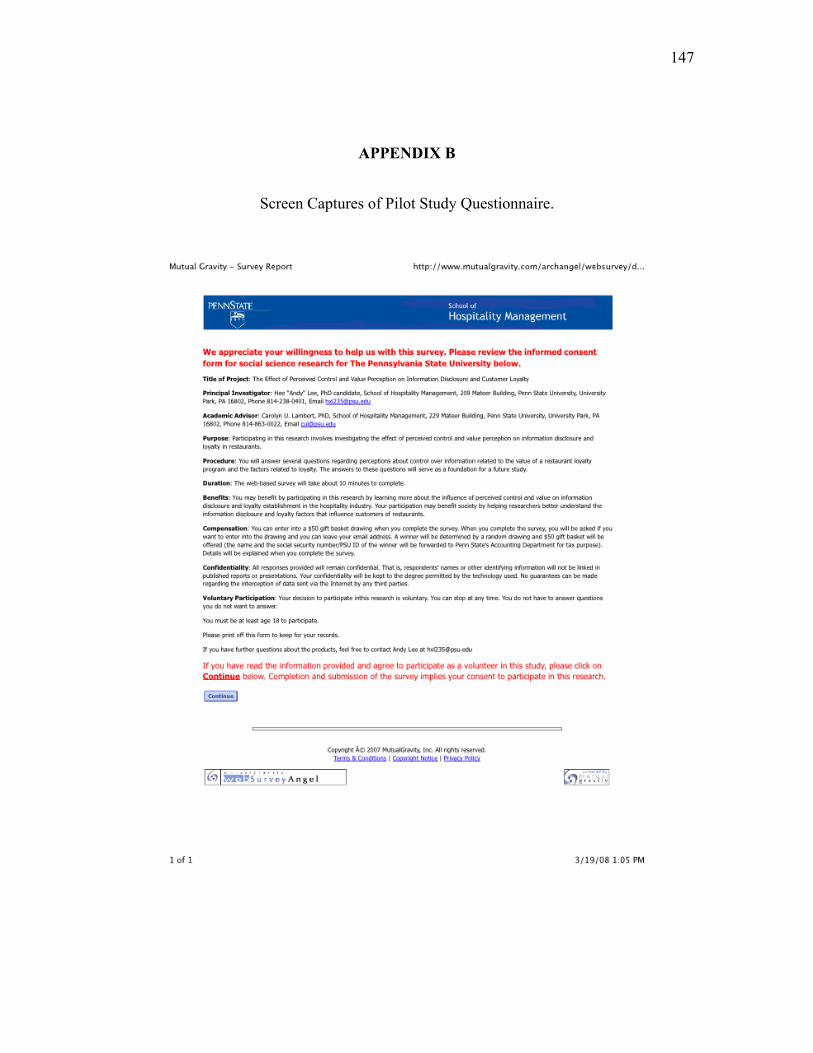
147
APPENDIX B
Screen Captures of Pilot Study Questionnaire.

148
Screen Captures of Pilot Study Questionnaire (continued).

149
Screen Captures of Pilot Study Questionnaire (continued).

150
Screen Captures of Pilot Study Questionnaire (continued).

151
Screen Captures of Pilot Study Questionnaire (continued).

152
Screen Captures of Pilot Study Questionnaire (continued).

153
Screen Captures of Pilot Study Questionnaire (continued).

154
Screen Captures of Pilot Study Questionnaire (continued).

155
Screen Captures of Pilot Study Questionnaire (continued).

156
APPENDIX C
Screen Captures of High Sensitive and Presence of Information Edit Function
Questionnaire.
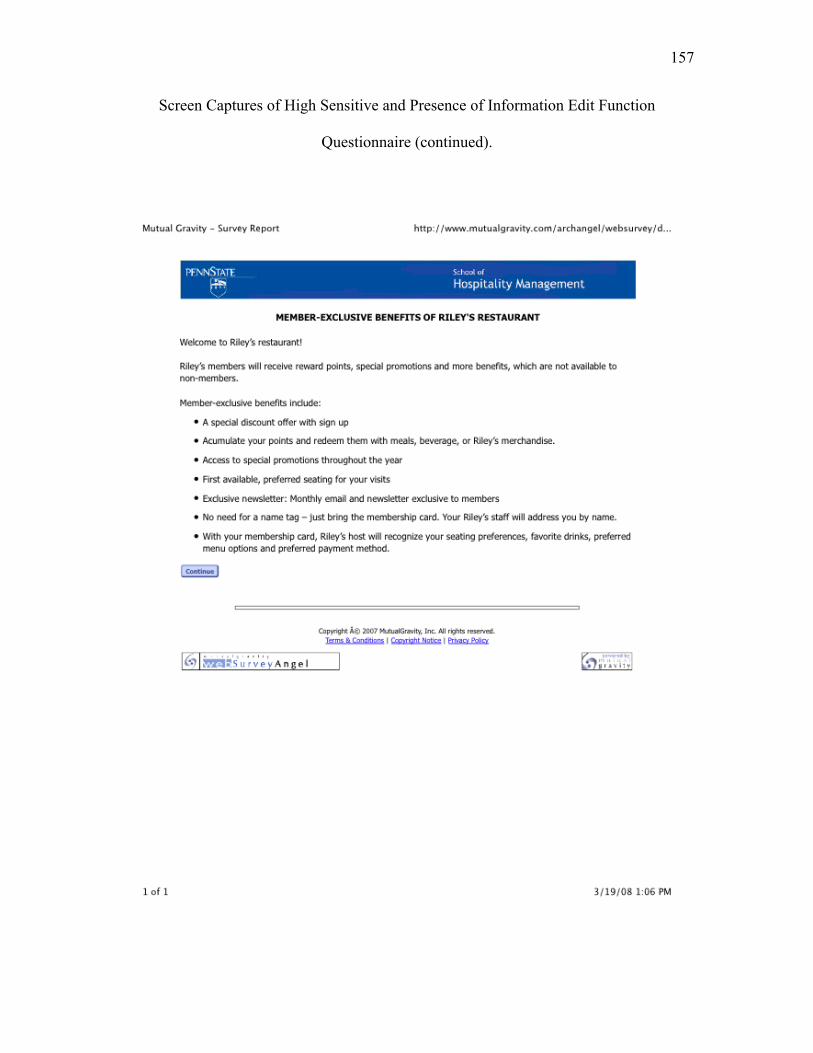
157
Screen Captures of High Sensitive and Presence of Information Edit Function
Questionnaire (continued).
158
Screen Captures of High Sensitive and Presence of Information Edit Function
Questionnaire (continued).

159
Screen Captures of High Sensitive and Presence of Information Edit Function
Questionnaire (continued).

160
Screen Captures of High Sensitive and Presence of Information Edit Function
Questionnaire (continued).

161
Screen Captures of High Sensitive and Presence of Information Edit Function
Questionnaire (continued).

162
Screen Captures of High Sensitive and Presence of Information Edit Function
Questionnaire (continued).

163
Screen Captures of High Sensitive and Presence of Information Edit Function
Questionnaire (continued).

164
Screen Captures of High Sensitive and Presence of Information Edit Function
Questionnaire (continued).

165
Screen Captures of High Sensitive and Presence of Information Edit Function
Questionnaire (continued).

166
Screen Captures of High Sensitive and Presence of Information Edit Function
Questionnaire (continued).

167
Screen Captures of High Sensitive and Presence of Information Edit Function
Questionnaire (continued).

168
Screen Captures of High Sensitive and Presence of Information Edit Function
Questionnaire (continued).
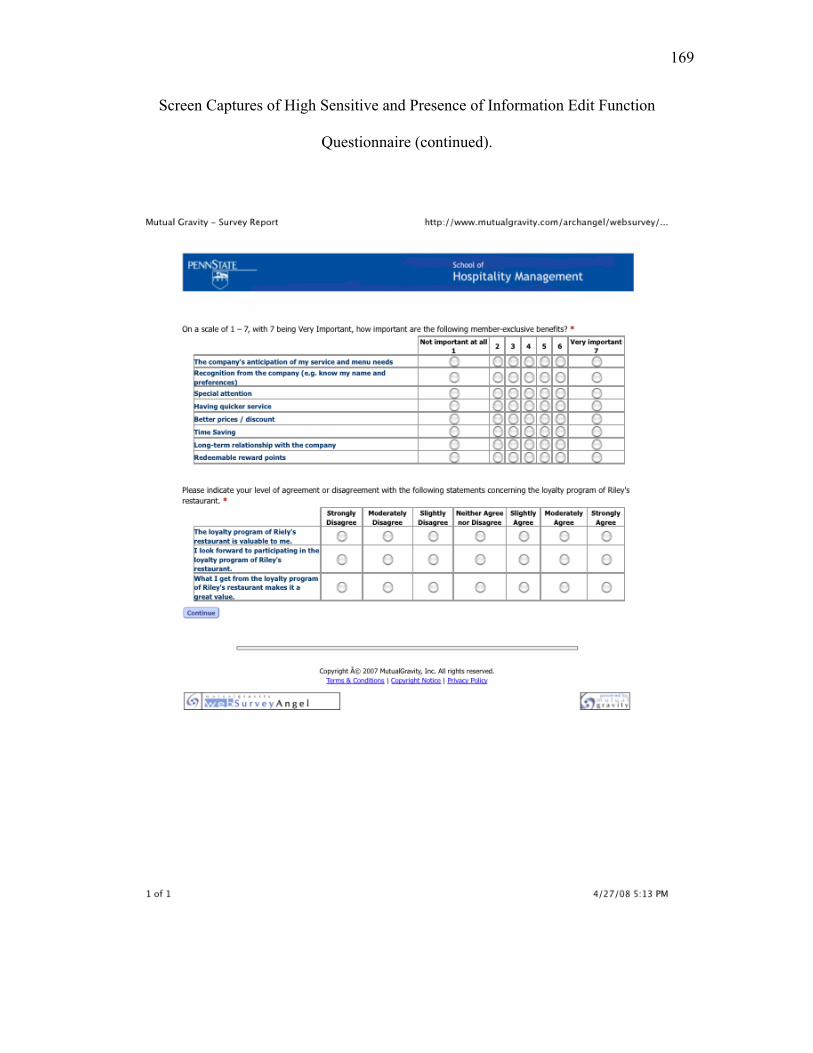
169
Screen Captures of High Sensitive and Presence of Information Edit Function
Questionnaire (continued).

170
Screen Captures of High Sensitive and Presence of Information Edit Function
Questionnaire (continued).

171
Screen Captures of High Sensitive and Presence of Information Edit Function
Questionnaire (continued).

172
APPENDIX D
Screen Captures of Low Sensitive and Absence of Information Edit Function
Questionnaire.

173
Screen Captures of Low Sensitive and Absence of Information Edit Function
Questionnaire (continued).

174
Screen Captures of Low Sensitive and Absence of Information Edit Function
Questionnaire (continued).

175
Screen Captures of Low Sensitive and Absence of Information Edit Function
Questionnaire (continued).

176
Screen Captures of Low Sensitive and Absence of Information Edit Function
Questionnaire (continued).

177
Screen Captures of Low Sensitive and Absence of Information Edit Function
Questionnaire (continued).

178
Screen Captures of Low Sensitive and Absence of Information Edit Function
Questionnaire (continued).

179
Screen Captures of Low Sensitive and Absence of Information Edit Function
Questionnaire (continued).

180
Screen Captures of Low Sensitive and Absence of Information Edit Function
Questionnaire (continued).

181
Screen Captures of Low Sensitive and Absence of Information Edit Function
Questionnaire (continued).

182
Screen Captures of Low Sensitive and Absence of Information Edit Function
Questionnaire (continued).

VITA
HEE SEOK LEE
EDUCATION
Ph.D., Hotel, Restaurant and Institutional Management, Penn State University, 2008.
M.S., Hospitality Business, Michigan State University, 2004.
B.S., Tourism, Hanyang Univerisity, Seoul, Korea, 1998.
WORK EXPERIENCE
F&B Coordinator, F&B Office, Seoul Hilton Hotel, 1999 - 2000.
Management Trainee, F&B Department, Seoul Hilton Hotel, 1998 - 1998.
HONORS AND AWARDS
Sung and Fumi Lee Scholarship for Outstanding Graduate Students, The
Pennsylvania State University, 2007 - 2008.
Fellowship, Michigan State University, 2003 - 2004.
Full Scholarship, Hanyang University, Seoul, Korea, 1991 - 1998.